1. Introduction
Maritime shipping is the main pillar of international trade and the global economy [
1]. In some busy waterways and ports, such as Shenzhen Port in China, near Hong Kong, these areas have witnessed a significant increase in vessel traffic, with annual transits of up to 500,000 ships (approximately 1500 ships per day) [
2]. Given that the objectives of ship maximization and increased ship speed have become more attainable, the safety of the vessel traffic has become a big issue in such areas [
3]. Accidents are frequently experienced in this area, and the hazard profile is dominated by ship–ship collisions, which account for approximately 50% of the total risk [
4].
Given the undesirable consequences and social influences of collision accidents, ship collision causation analysis and collision probability analysis have become important research topics in the maritime transportation discipline. The causations of collision accidents lie in many aspects: human factors, machine condition, environmental contributors, etc. However, the majority of the collision accidents tend to result from human errors [
5,
6,
7]. Chen et al. [
8] studied the pattern of ship collision accidents in estuarine waters using historical data and found that human errors were important factors in the accidents. Meanwhile, Chauvin [
9] studied human failure and other factors in collision accidents. It is important to note that ships will also collide with each other under circumstances of mechanical failure and the presence of external elements (e.g., restricted visibility, turbulent flow, high winds, etc.) [
10,
11,
12].
To model the probability of collision, statistical analysis methods such as regression analysis and frequency analysis are widely employed. Fujii et al. [
13] utilized historical accident data in Japanese waters to estimate the causational probability. Similar work has also been done by Pedersen [
14], and Hanninen and Kujala [
15], respectively. Compared to the statistical analysis approach to obtain the causational probability of ship collisions, the fault tree analysis (FTA) integrates causal analysis, which identifies the accident causations and their inter-relationships and historical accident data. Pedersen [
14], Martins and Maturana [
16], and Uğurlu et al. [
17] utilized the FTA to model the causational probability of ship-ship collisions, and to analyze the importance of the causes. The Bayesian network is a graphical inference network based on the Bayesian theorem, where Montewka et al. [
18] presented a framework based on the Bayesian network for the risk analysis of collision accidents. Li [
19] applied petri networks to causation analysis and the structured analytical network of vessel collisions, which was of great benefit to studies on vessel collisions. Martins and Maturana [
16] incorporated human reliability analysis (HRA) analysis and the Bayesian network to analyze the probability of ship-ship collision accidents. However, given that ship–ship collisions are a category of accidents with relatively rare occurrence, the number of available accident investigation reports may not be sufficient to conduct the analysis. Meanwhile, the quality of the data (e.g., incomplete information) also diminishes the efficacy of the results when using the above mentioned approaches.
Ship collisions are a direct result of traffic encounters and conflict. In recent years, increased attention has been directed towards the phenomena of the rapid increase in traffic density, which normally accounts for the difficulty in managing vessel traffic and the complexity of the ship encounter situations. Wen [
20] presented a marine traffic complexity model to evaluate the status of the traffic situation, and it uses the complexity to investigate the degree of crowding and the risks of collision. Mazaheri et al. [
21] considered vessel traffic as one of the main factors affecting the expected frequency of ship groundings in their study aimed at determining the statistical dependency between traffic density and the distribution of traffic. However, there is no universal definition of traffic complexity. Park et al. [
22] assessed the basic parameter of speed, and they proposed a regression model to show the effects of mean speed, standard deviation of speed, and the flow per route on the potential collision rates. From the literature, it can be observed that there is limited research on the actual dependency between ship traffic and the collision accidents.
What is relationship between the vessel traffic and accidents? This is a basic question that needs to be answered. The purpose of this study was to reveal the relationship between vessel traffic and accidents, to excavate the traffic parameters with the greatest impact on accidents, and to provide suggestions for vessel traffic management and traffic engineering design. To achieve this goal, as a pilot study, real data from the ship automatic identification system (AIS) and accidents over a 10-year-span were collected and displayed using the geography information system (GIS). Particularly, vessel traffic is a general term, consisting of various characteristics. From a macroscopic view, vessel traffic flow and its parameters, such as speed, variation of heading, and traffic volume, are taken as vital indicators in waterway management. Therefore, to discover the relationship between accidents and traffic, regression models were established to associate the accidents and the parameters of vessel traffic, such as speed, variation of heading, and traffic volume, within a specified grid. In a case study of the western Port of Shenzhen City, China, the methodology proved to be effective in vessel traffic management and traffic engineering design. The main contents of this paper are structured as follows:
Section 2 explains the methodology, framework, and details of the models, including the correlation model proposed in this paper. In
Section 3, a case study on the Shenzhen waterways was conducted and the results are shown.
Section 4 and
Section 5 comprise the discussions, conclusions, and future areas of research.
2. Methodology
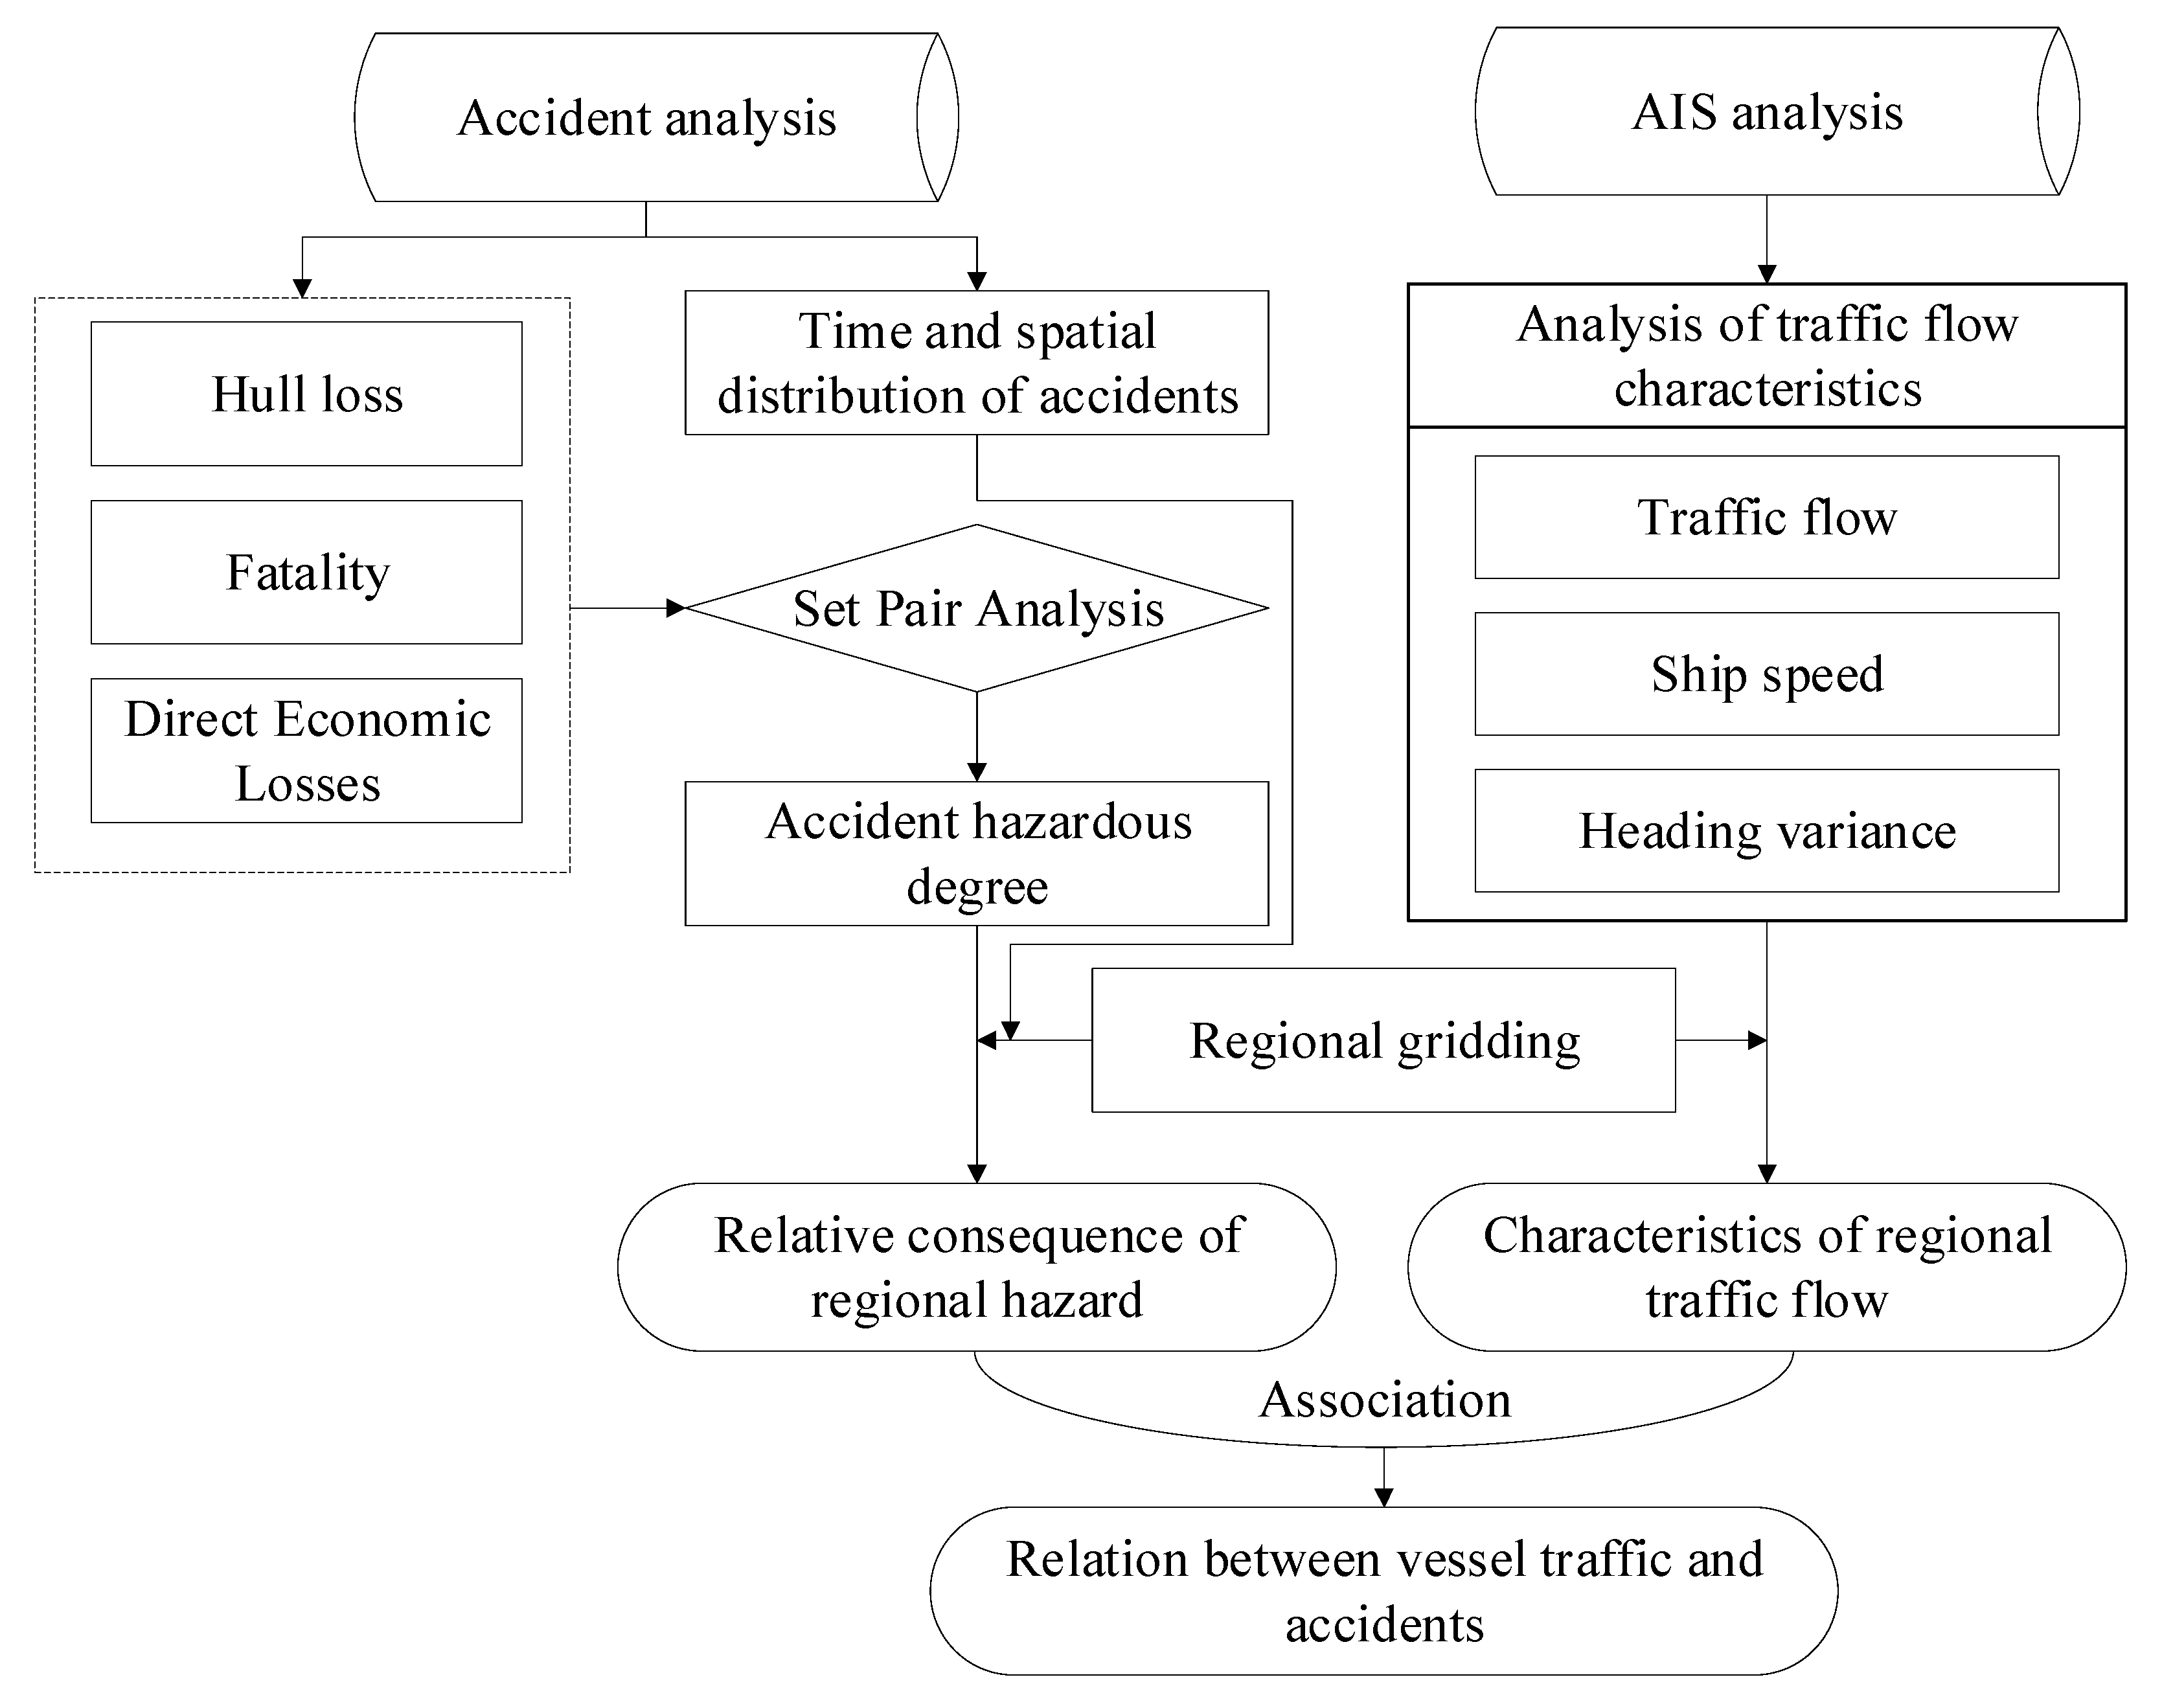
Modeling the relationship between vessel traffic and accidents involves two fundamental issues: (1) How to quantify the consequences of the accident, and (2) how to overlay and synchronize the traffic and accident data for a certain area.
It is well known that the consequences of accidents are varied. Accidents can be roughly divided into catastrophic, hazardous, major, minor, and negligible accidents, and they are accurately measured according to hull loss, fatalities, and direct economic losses. To properly quantify the consequences of an accident, the set pair analysis was applied to map the consequence of each accident into a determined value, defined as the hazardous degree of an accident viewed from the aspects of hull loss, fatalities, and direct economic losses. However, there are sizable deviations in the hazardous degrees of accidents. For example, if the interval of the set is from 1 to 5, some accidents will be marked as 1, and some as 2, 3, 4, or 5. Therefore, a relative hazardous degree of each accident may be defined. Consequently, by summing up all the relative hazardous degrees of accidents that occurred in a specified area, the relative consequence of the regional hazard (RCORH) can be determined. The RCORH is an important indicator in development of the final models.
Using the ArcGIS software, all the specified areas could be modeled and analyzed in the form of grids. The statistical traffic flow in each grid was further analyzed, and based on the grid, the traffic and accident data was synchronized for use in the final modelling. Based on the opinions of experts, such as vessel traffic service operators, three parameters of vessel traffic, that is, speed, heading variance, and traffic volume were selected to interpret their relationships with the collision accident. Investigations of the vessel traffic data overlaid with the RCORH in each grid on the ArcGIS, led to the development of regression models. The detailed technical scheme is shown in
Figure 1.
2.1. Accident Hazard Degree (AHD)
Traditionally, the severity of an accident is measured by its classification, such as “minor”, “major”, “hazardous”, or “catastrophic”. However, the classifications are very general and cover wide ranges. According to the State Council [
23], an accident with a death toll of 3–10 people is classified as “major”, while the impact of three or ten fatalities can still be considered as very great. Consequently, we developed a composite severity rating system to include fatalities, injuries, property damages, hull loss, and time loss to evaluate the overall impact of an accident.
Set pair analysis is a method that uses specific mathematical formulas to describe the uncertainty information, form certain knowledge, and discover potential laws from it. The method has been widely applied in the safety evaluation field.
For any case of an accident, all the indicators will be rated as a number in
Table 1. The evaluation index grade is based on five levels, namely, y = {Slight, small, average, large, significant} = {1,2,3,4,5}.
Variables measuring different aspects of accident loss, such as hull loss, fatalities, and direct economic losses, are weighted using the entropy weight method. The entropy weight method is an objective weighting method, where the weight of the index is calculated using an expert evaluation index. To discriminate between the importance of the indicators, the expert’s opinions are adopted. The weight of each indicator can be obtained as: w = [hull loss, fatality, direct economic losses] = [] = [0.25, 0.41, 0.34].
According to the criteria for the classification of accidents [
24], 10 serious injuries are normally equal to 3 deaths. In this context, a case of severe injury is converted to 0.3 deaths, thus the indicator of fatality in
Table 1 is not an integer.
Applying the principals described above, the accident hazard degree can be measured as
where
is each evaluation indicators grade of the i-th accident;
is the weight of the evaluation indicator;
is the degree of contact corresponding to level and can be expressed as
is the value of each evaluation indicators grade of the i-th accident;
and are the standard values of evaluating indicator .
2.2. Relative Consequence of the Regional Hazard (RCORH)
To calculate the relative hazardous degree of certain locations where accidents have occurred, the researchers built a grid using ArcGIS. According to the opinions of relevant experts, the study area was divided into small grids. The combination of the accident frequencies and total accident severity as a percentage of the regional total was calibrated for each cell or grid, which indicated the hazardous conditions for a particular location:
where:
R represents the relative consequence of the regional hazard in a grid;
is the frequency of accidents in a grid; and
is the severity rate of a single accident’s relative hazard degree in a grid.
2.3. Relational Model of the Accidents and Vessel Traffic
All the specified areas were shown as grids using the ArcGIS software. The statistical traffic flow in each grid was further analyzed using the geographic grid as a basic unit, where the vessel traffic characteristics and the accidents were synchronized based on the geographic positions. Examining the traffic characteristics, three parameters, such as speed, heading deviations, and traffic volume, were obtained using the AIS data. Vessel traffic data was overlaid with the RCORH in each grid on the ArcGIS, where the grid system provided a basic unit to examine the correlation or causal relationship between travel conditions and the accident consequences. Finally, regression models were developed to associate the relative consequences and the parameters of the vessel traffic, such as speed and the variation of heading in a certain grid.
3. Application
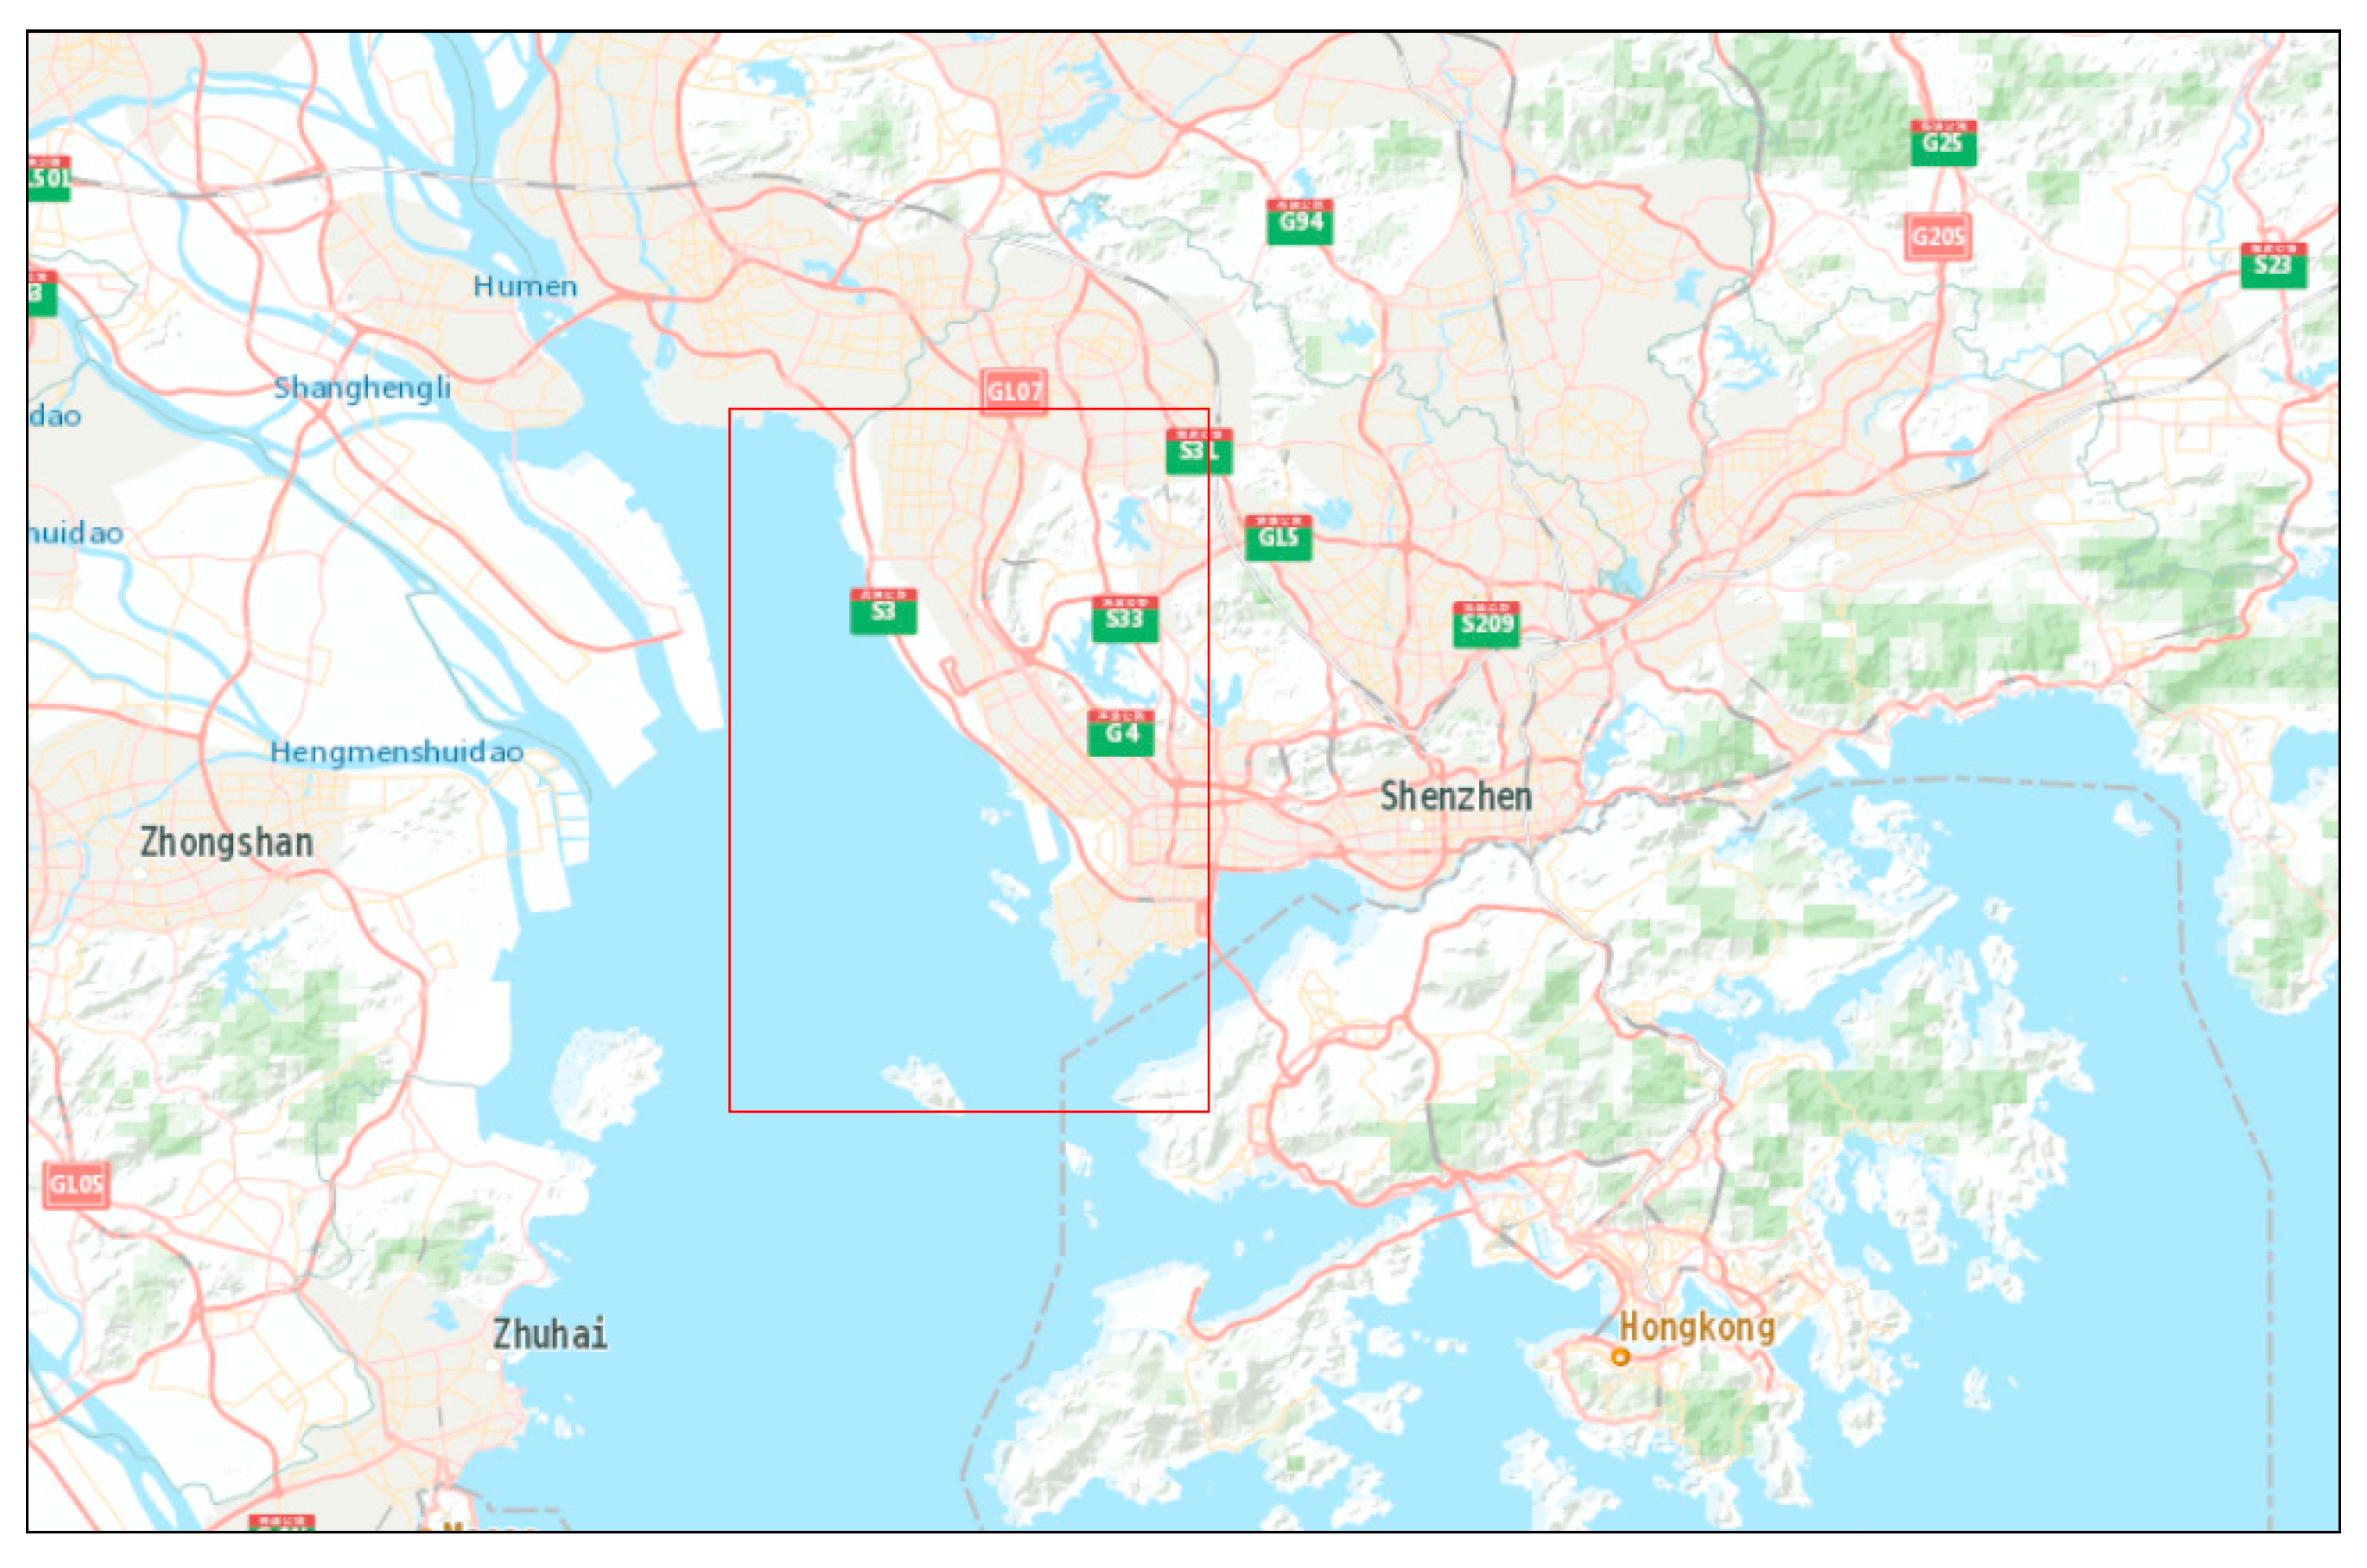
Shenzhen is located on the east bank of the mouth of the Pearl River and it is adjacent to Hong Kong, China. The western waterways of Shenzhen Port were chosen as our case study (
Figure 2). The Western Shenzhen Port is the third largest port in the world, comprising more than 100 berths, and where the annual throughput of the port was 24 million Twenty-foot Equivalent Unit (TEU) of containers and 2.14 million tons of bulk and general cargo in 2016. The western waterways, our study area, provide the primary access for most ships coming from the upstream river to Hong Kong. The waterway also provides a shortcut for ships to travel from Hong Kong to the East coast of China.
3.1. Accident Analysis
Working with the Shenzhen Maritime Bureau, which is the main authority for port management in the area, the authors gained access to the accident records for the ten years from 2007 to 2017. The database contained 95 accidents and the records included time, place, ship type, and type of accident. Of the 95 records, 23 had incomplete data and the remainder had fairly accurate and consistent data.
According to the analysis of accident reports by the Shenzhen Maritime Safety Administration (MSA), there are many factors affecting ship collisions, such as negligence in guarding, wrong assessment of collision risk, improper emergency operations, improper steering control, improper lookout, uncoordinated avoiding, improper avoiding, deviating from the channel, unused safety speed, poor visibility, rough seas, main engine failure, steering failure, and so on.
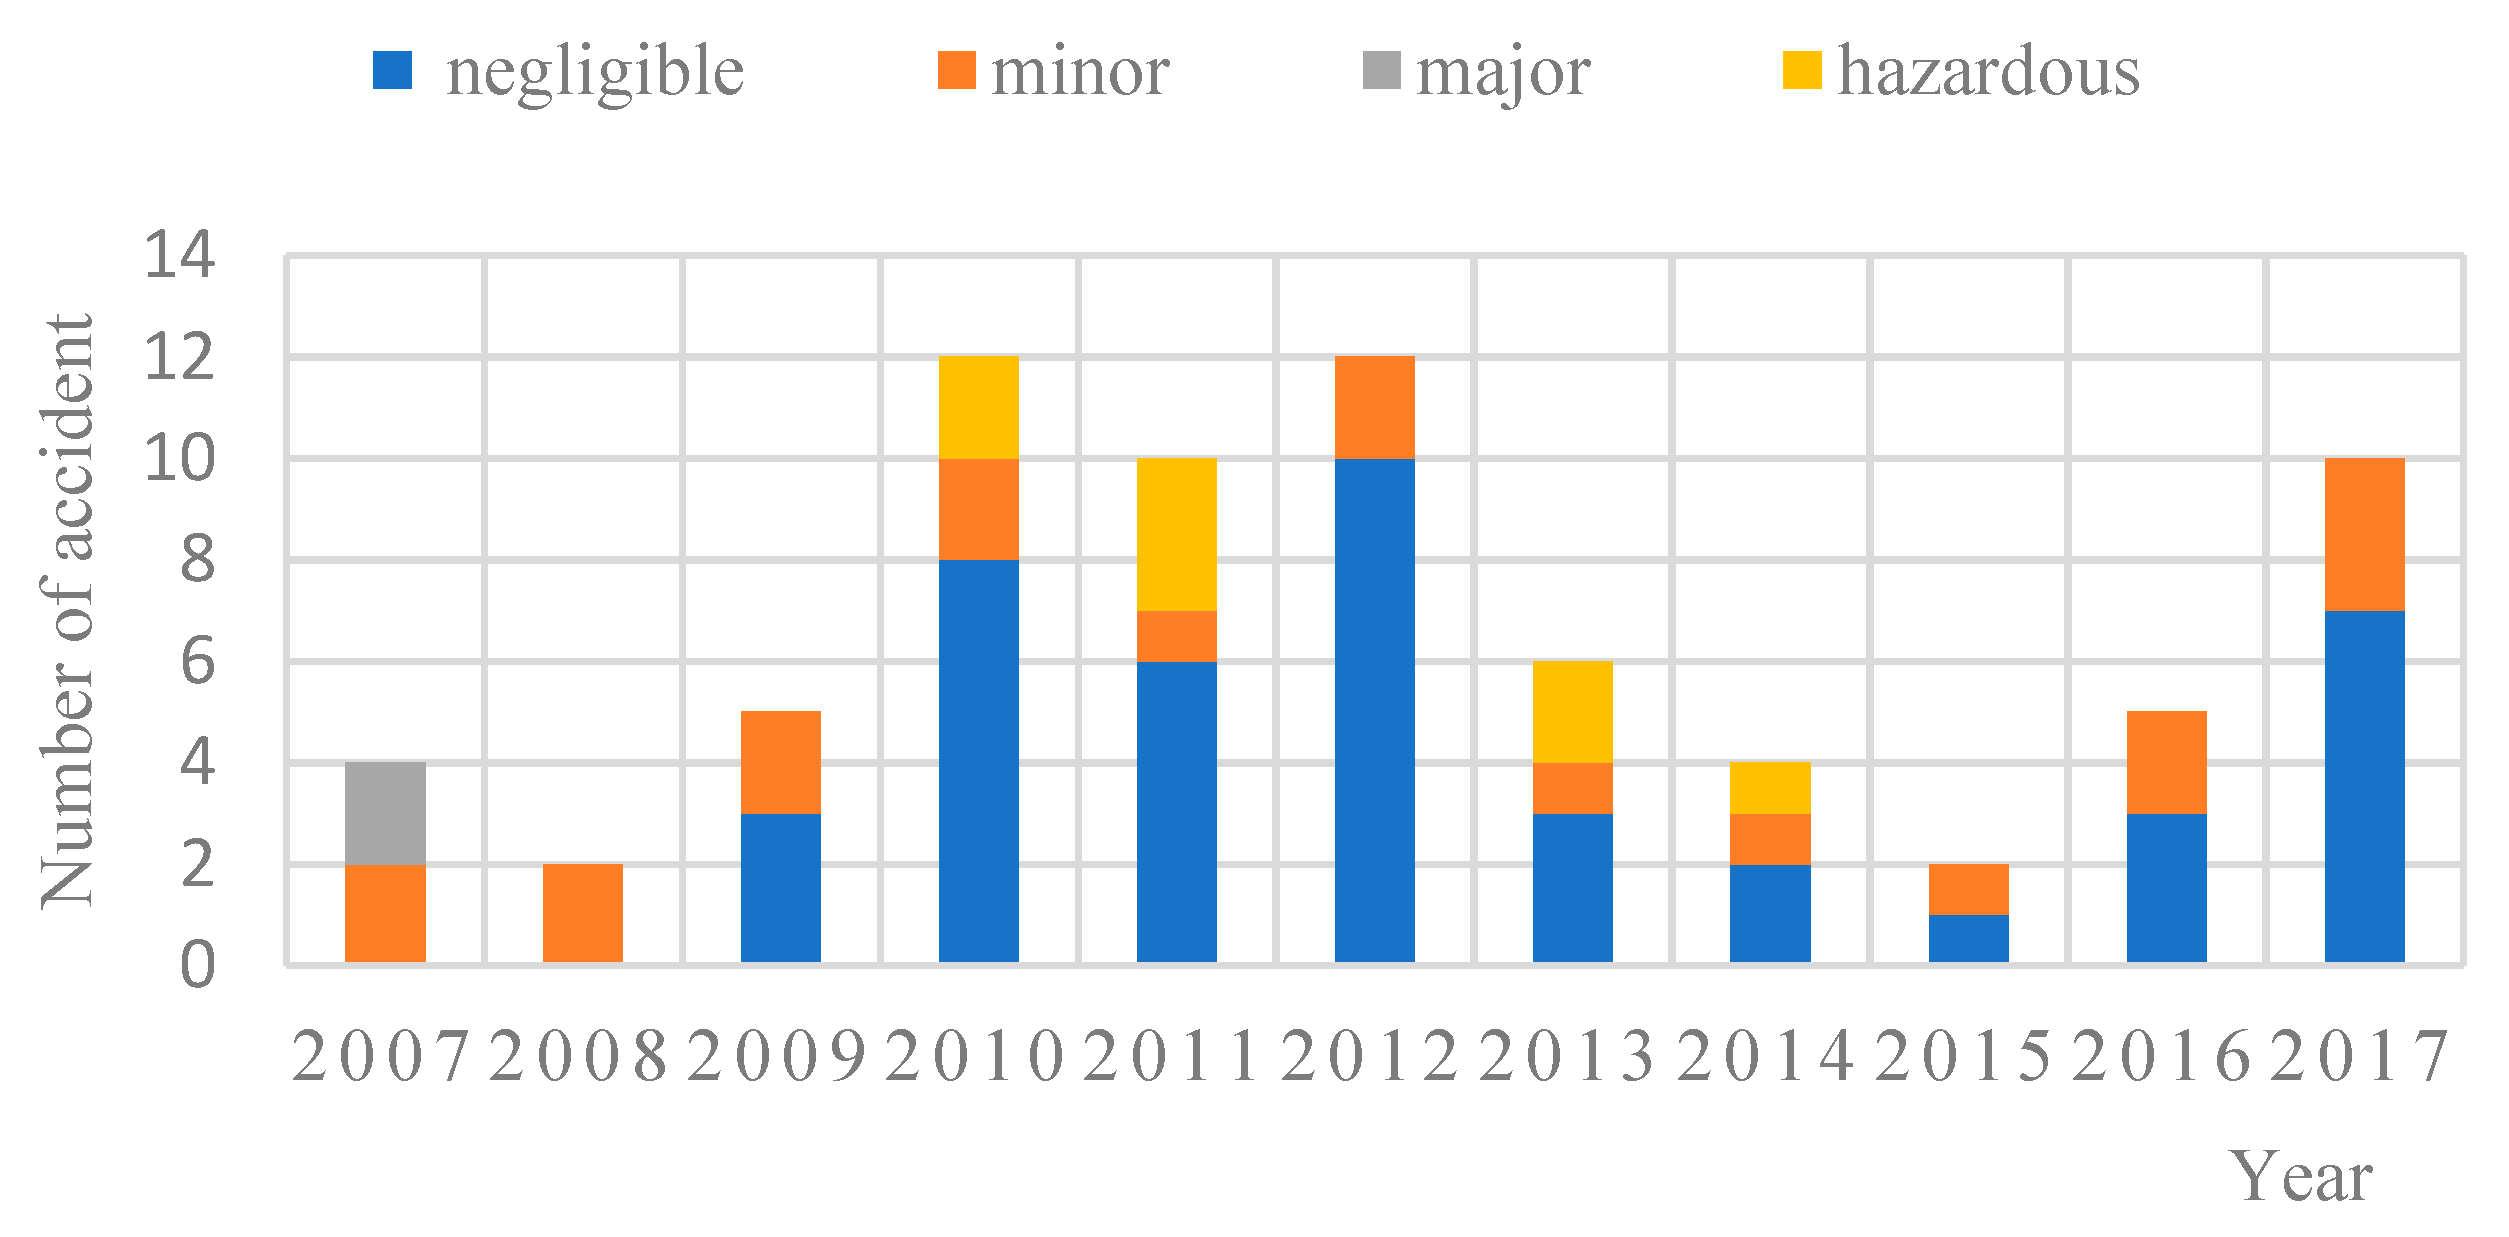
Our first analysis was to assess the historical trends by category and in total. As shown in
Figure 3, the total number of accidents surged around 2010 and 2012 before dropping to a very low level in 2015. Since then, the total number of accidents has steadily increased. Amongst the various types of accidents, the majority were classified as “negligible”, which was the most benign category, and there was no “major” accident during the 10 year period on the western waterways. The values for the “minor” category and “hazardous” category, i.e., the most severe category, ranged from zero to three per year in different years.
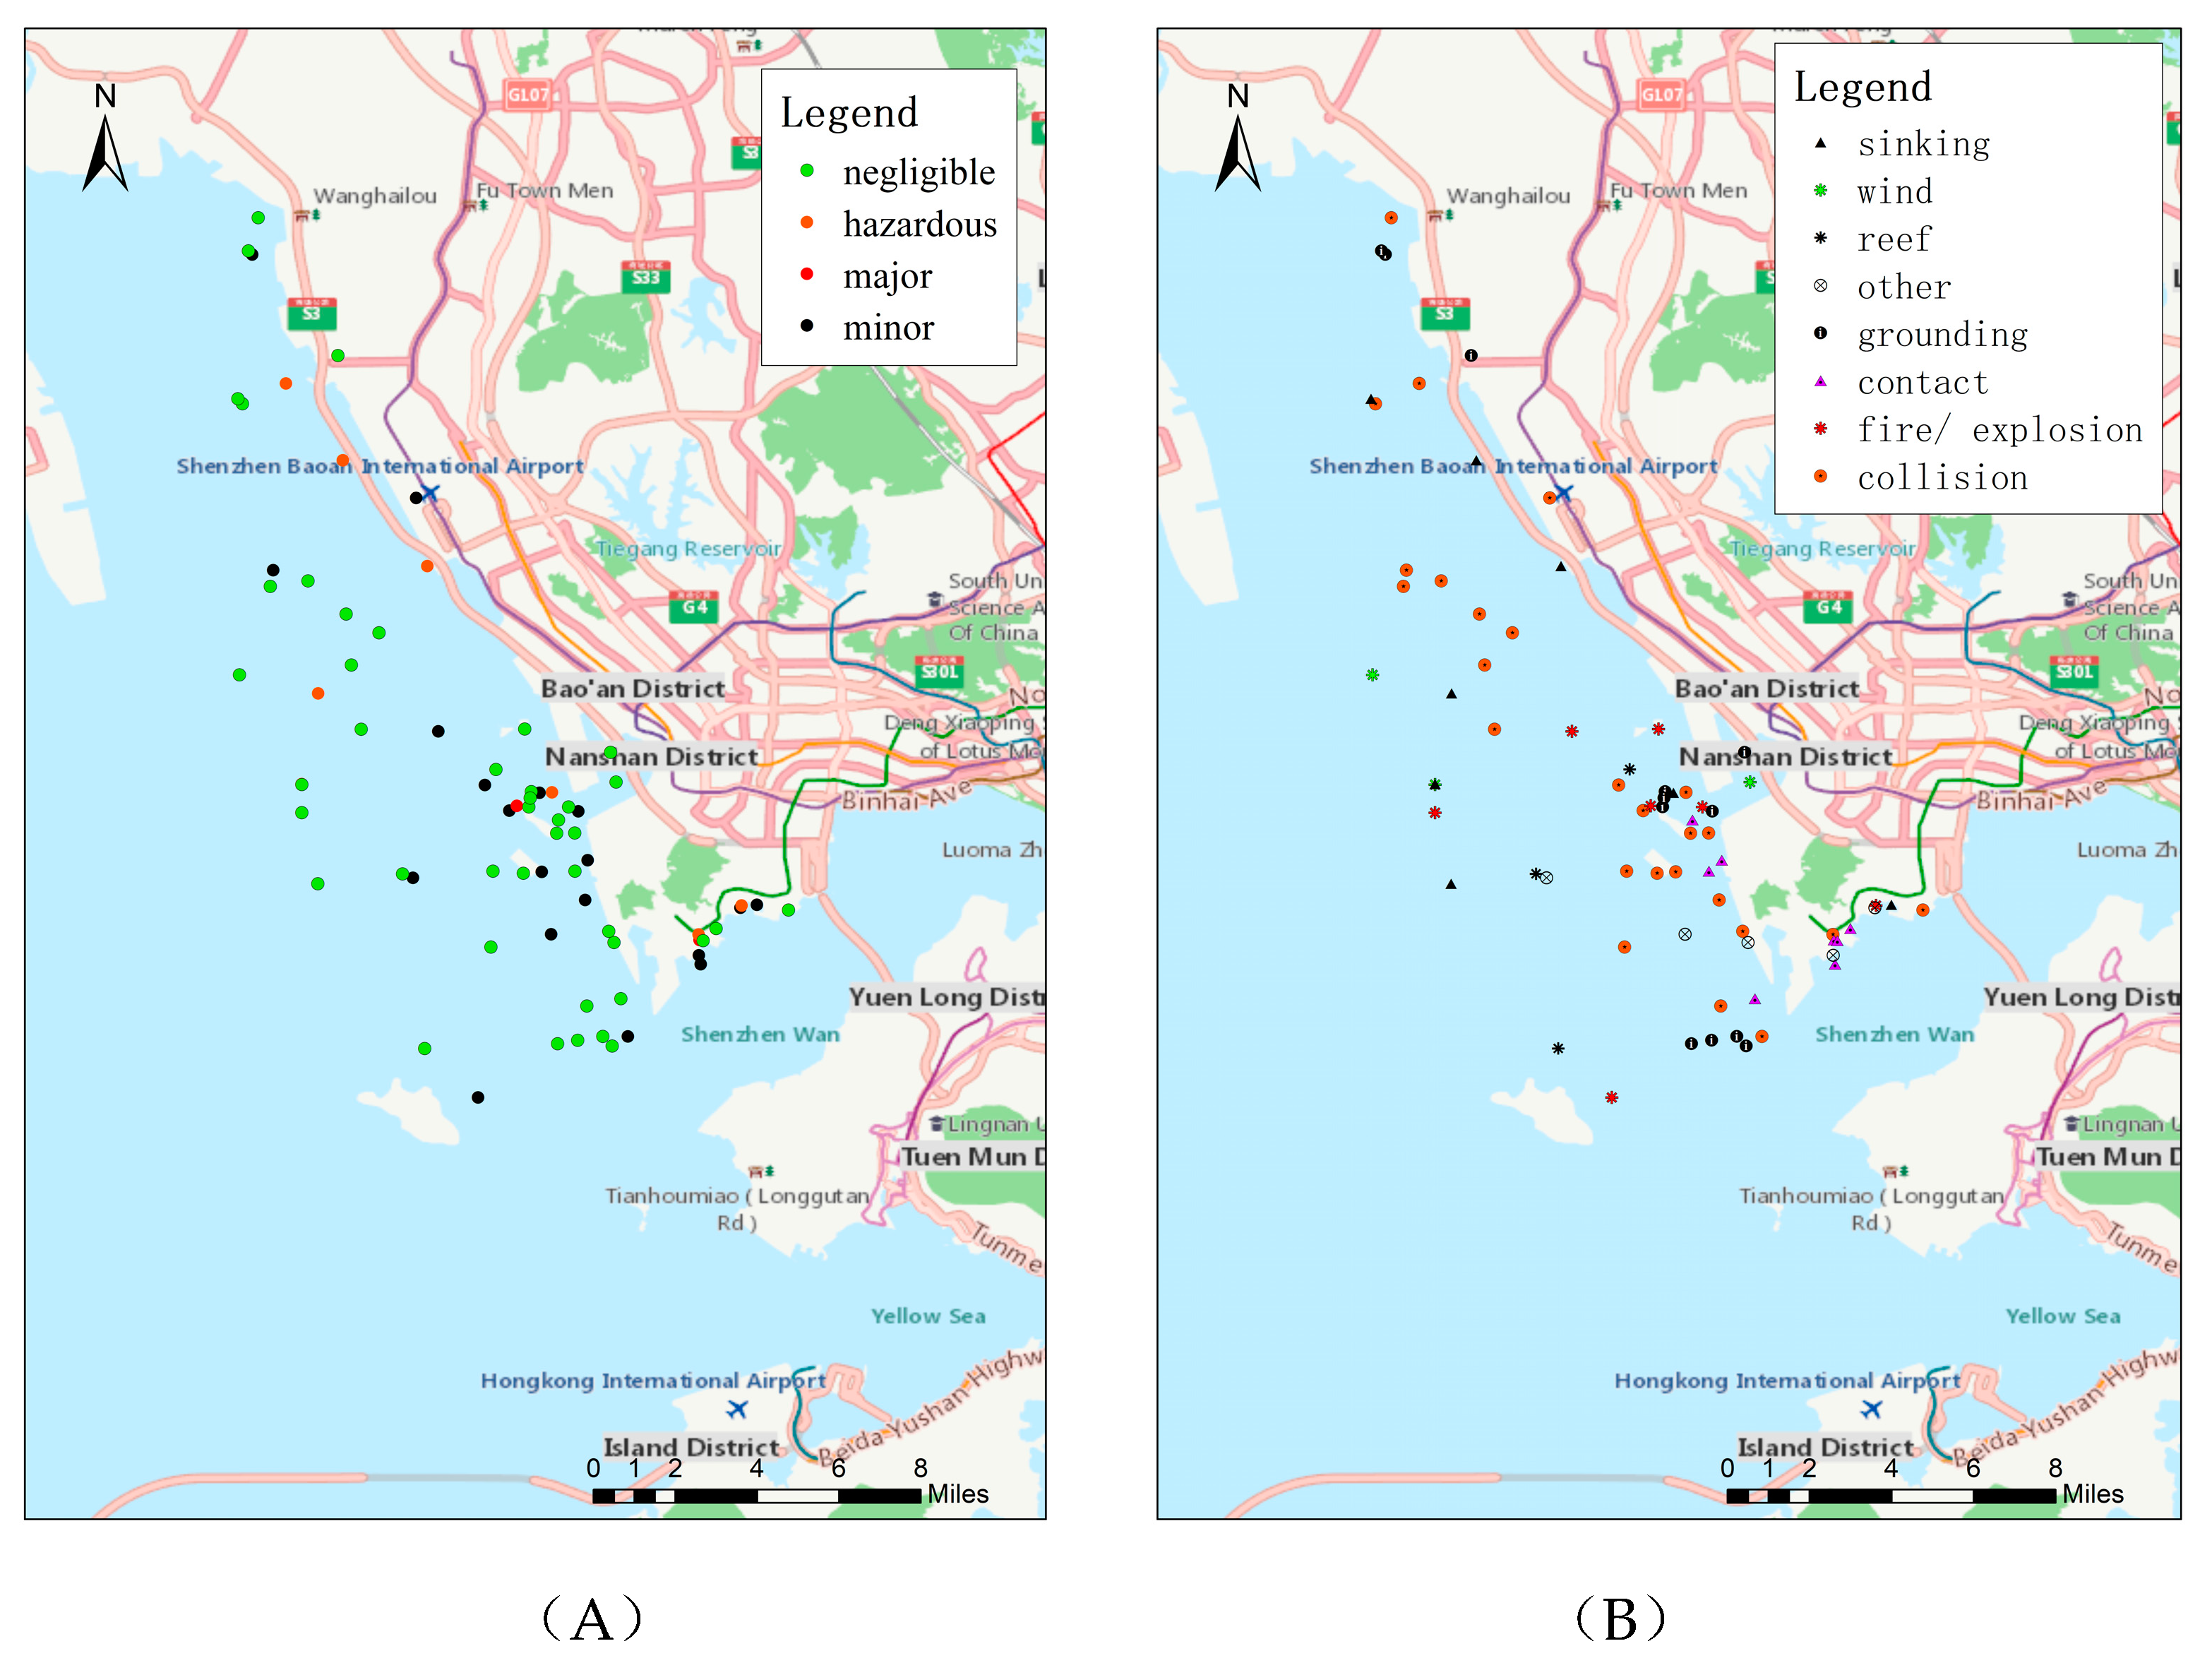
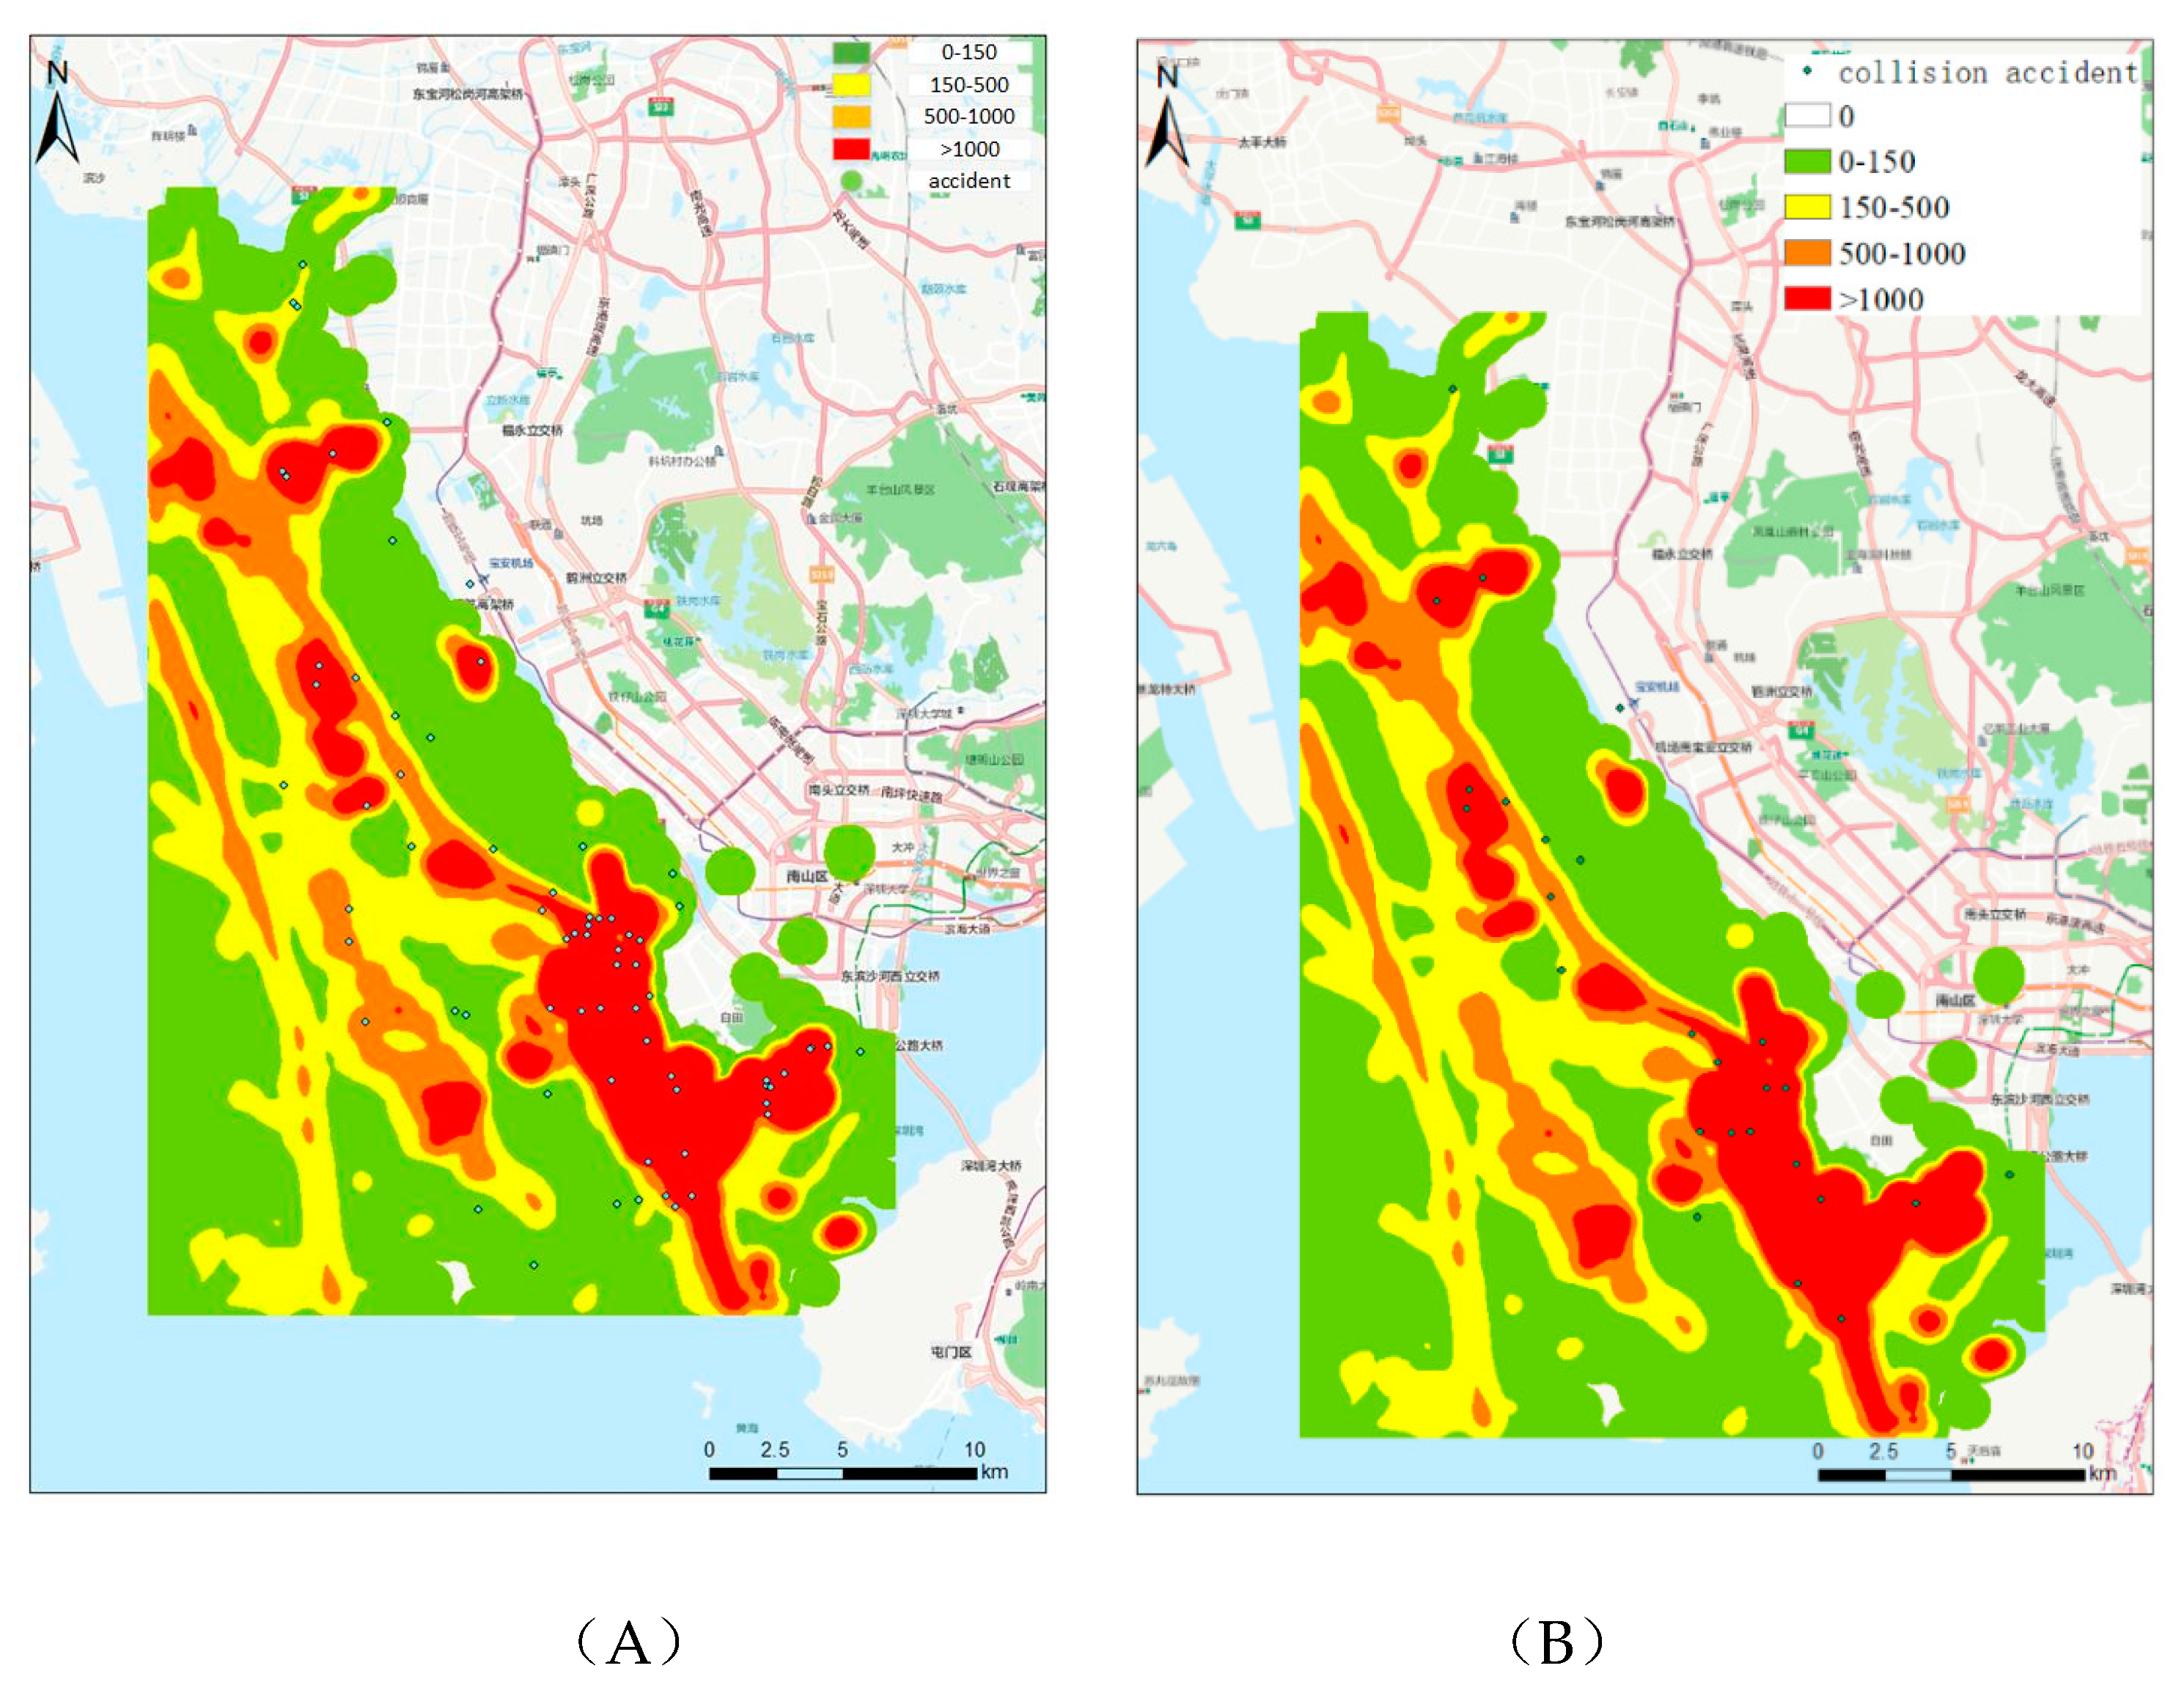
Another way to examine the characteristics of accidents in an area is the geographical distribution patterns. As shown in
Figure 4A, the individual accidents are plotted on a GIS map based on their severity.
Figure 4B demonstrates another way to visualize accident distributions based on the categories. As noted in the map legend, reference is made to the statistical methods of water traffic accidents [
24], where accidents are classified into nine categories according to the cause of the accident, such as collision accidents, grounding accidents, strike a rock accidents, contact accidents, wave damage accidents, fire/explosion accidents, wind disasters, sinking accidents, and other water traffic accidents causing casualties and direct economic losses. Actually, there are only eight categories of accidents that have occurred at the Shenzhen port, wherein wave damage accidents have not been experienced, as shown in
Figure 4B.
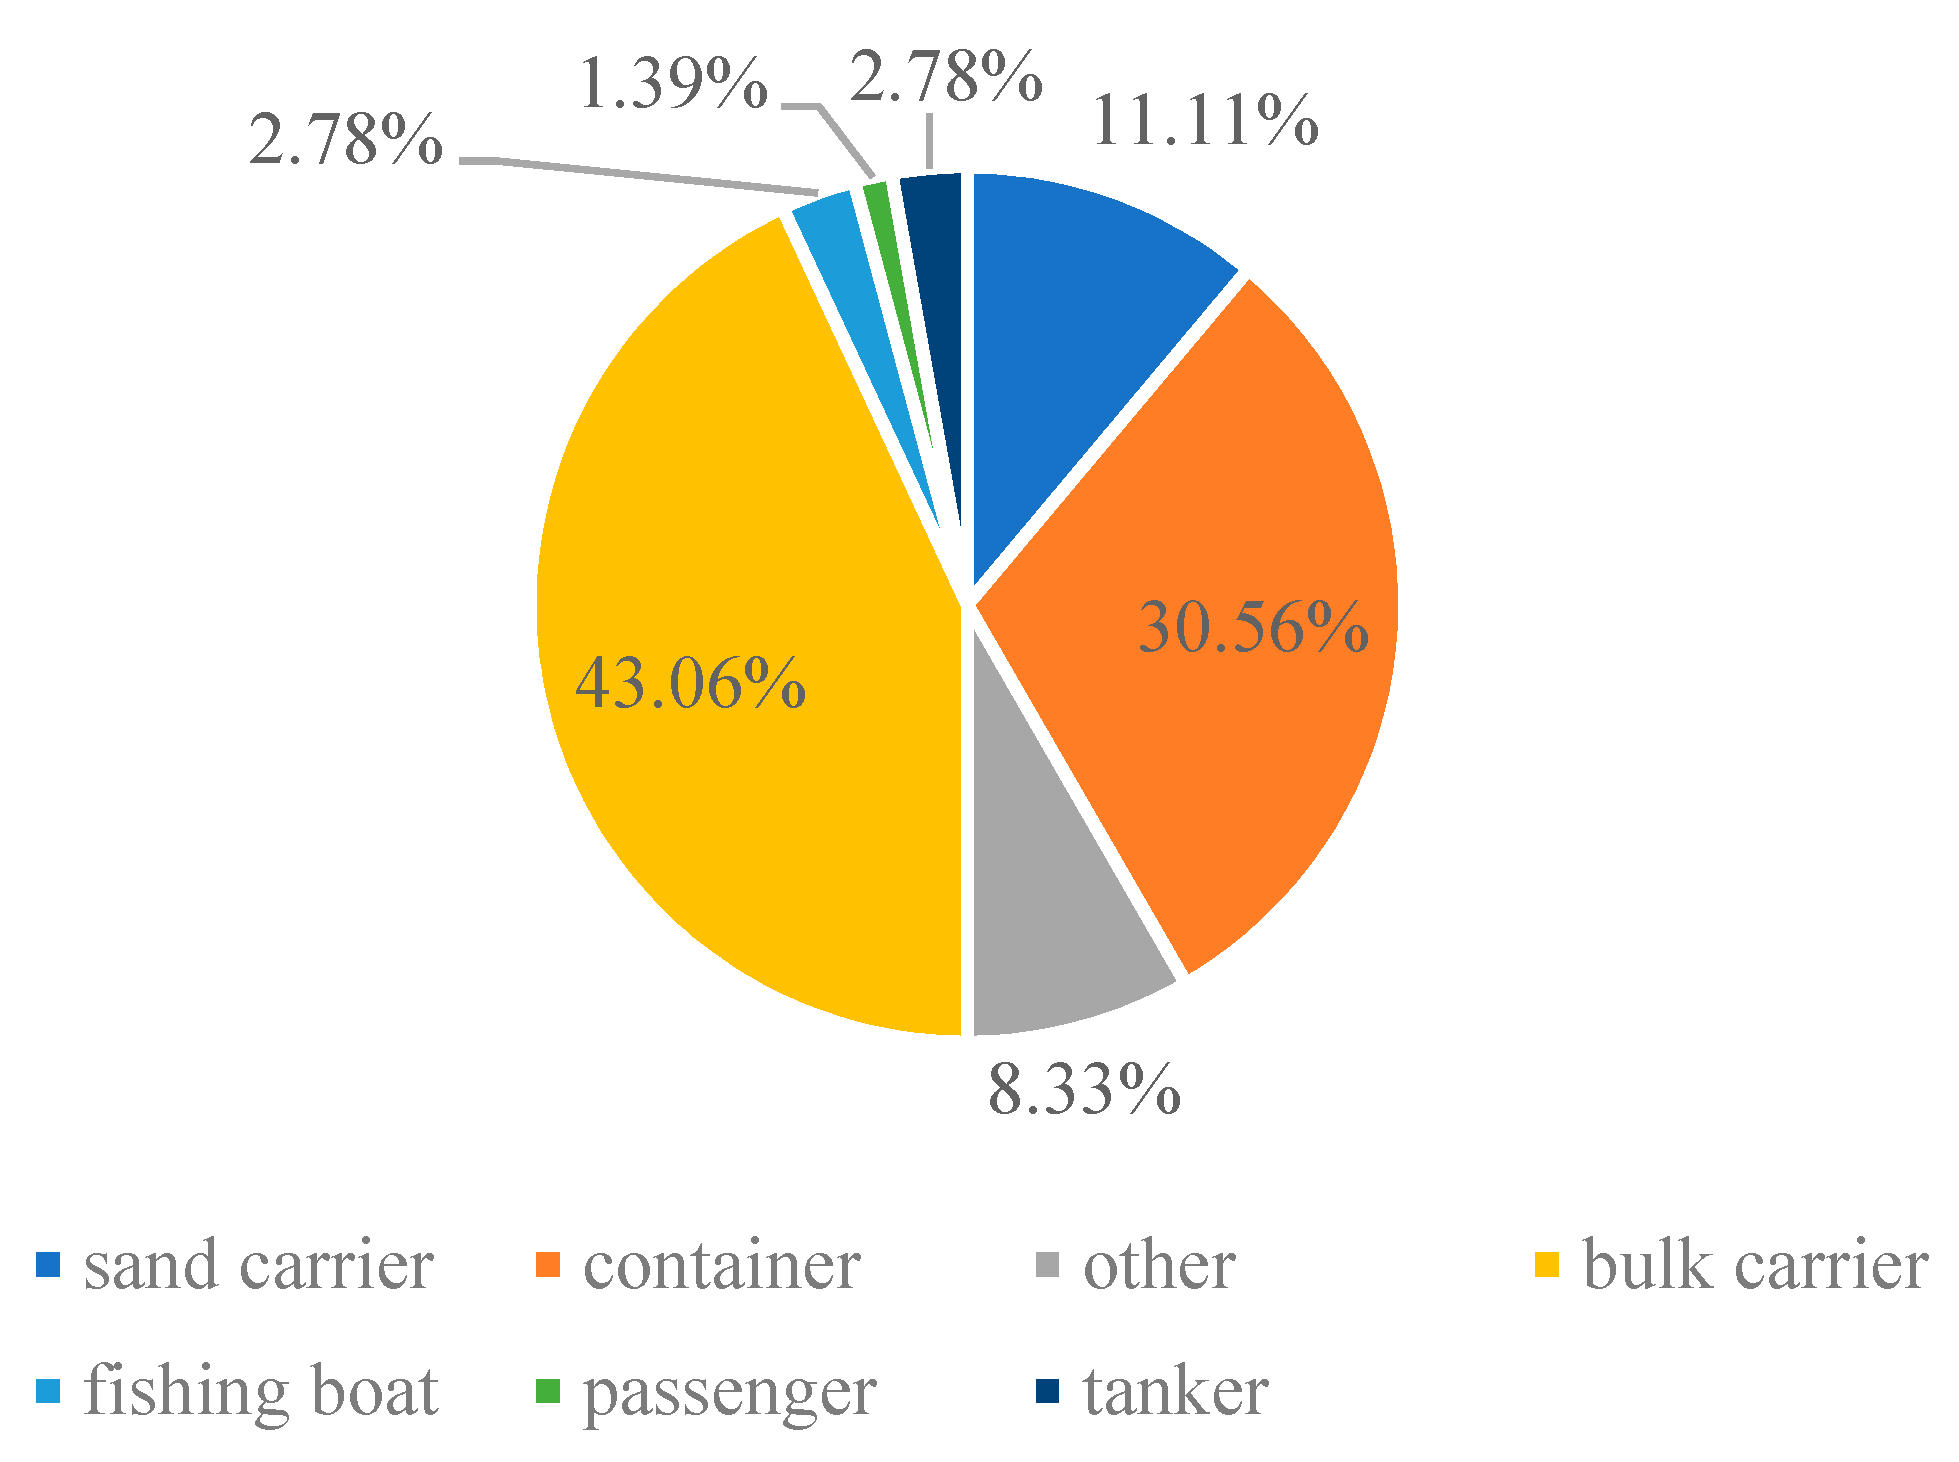
As shown in
Figure 5, the main ships involved in accidents are bulk ships, constituting about 46.06%, followed by container ships at about 30.56%.
3.2. Accident Hazard Degree
3.2.1. Accident Hazard Degree Calculation
Applying the framework and the Equations (1) and (2) presented in the earlier sections, the accident hazard degree (AHD) can be calculated and ranked.
Table 2 lists a few sample locations and their respective hazard indices.
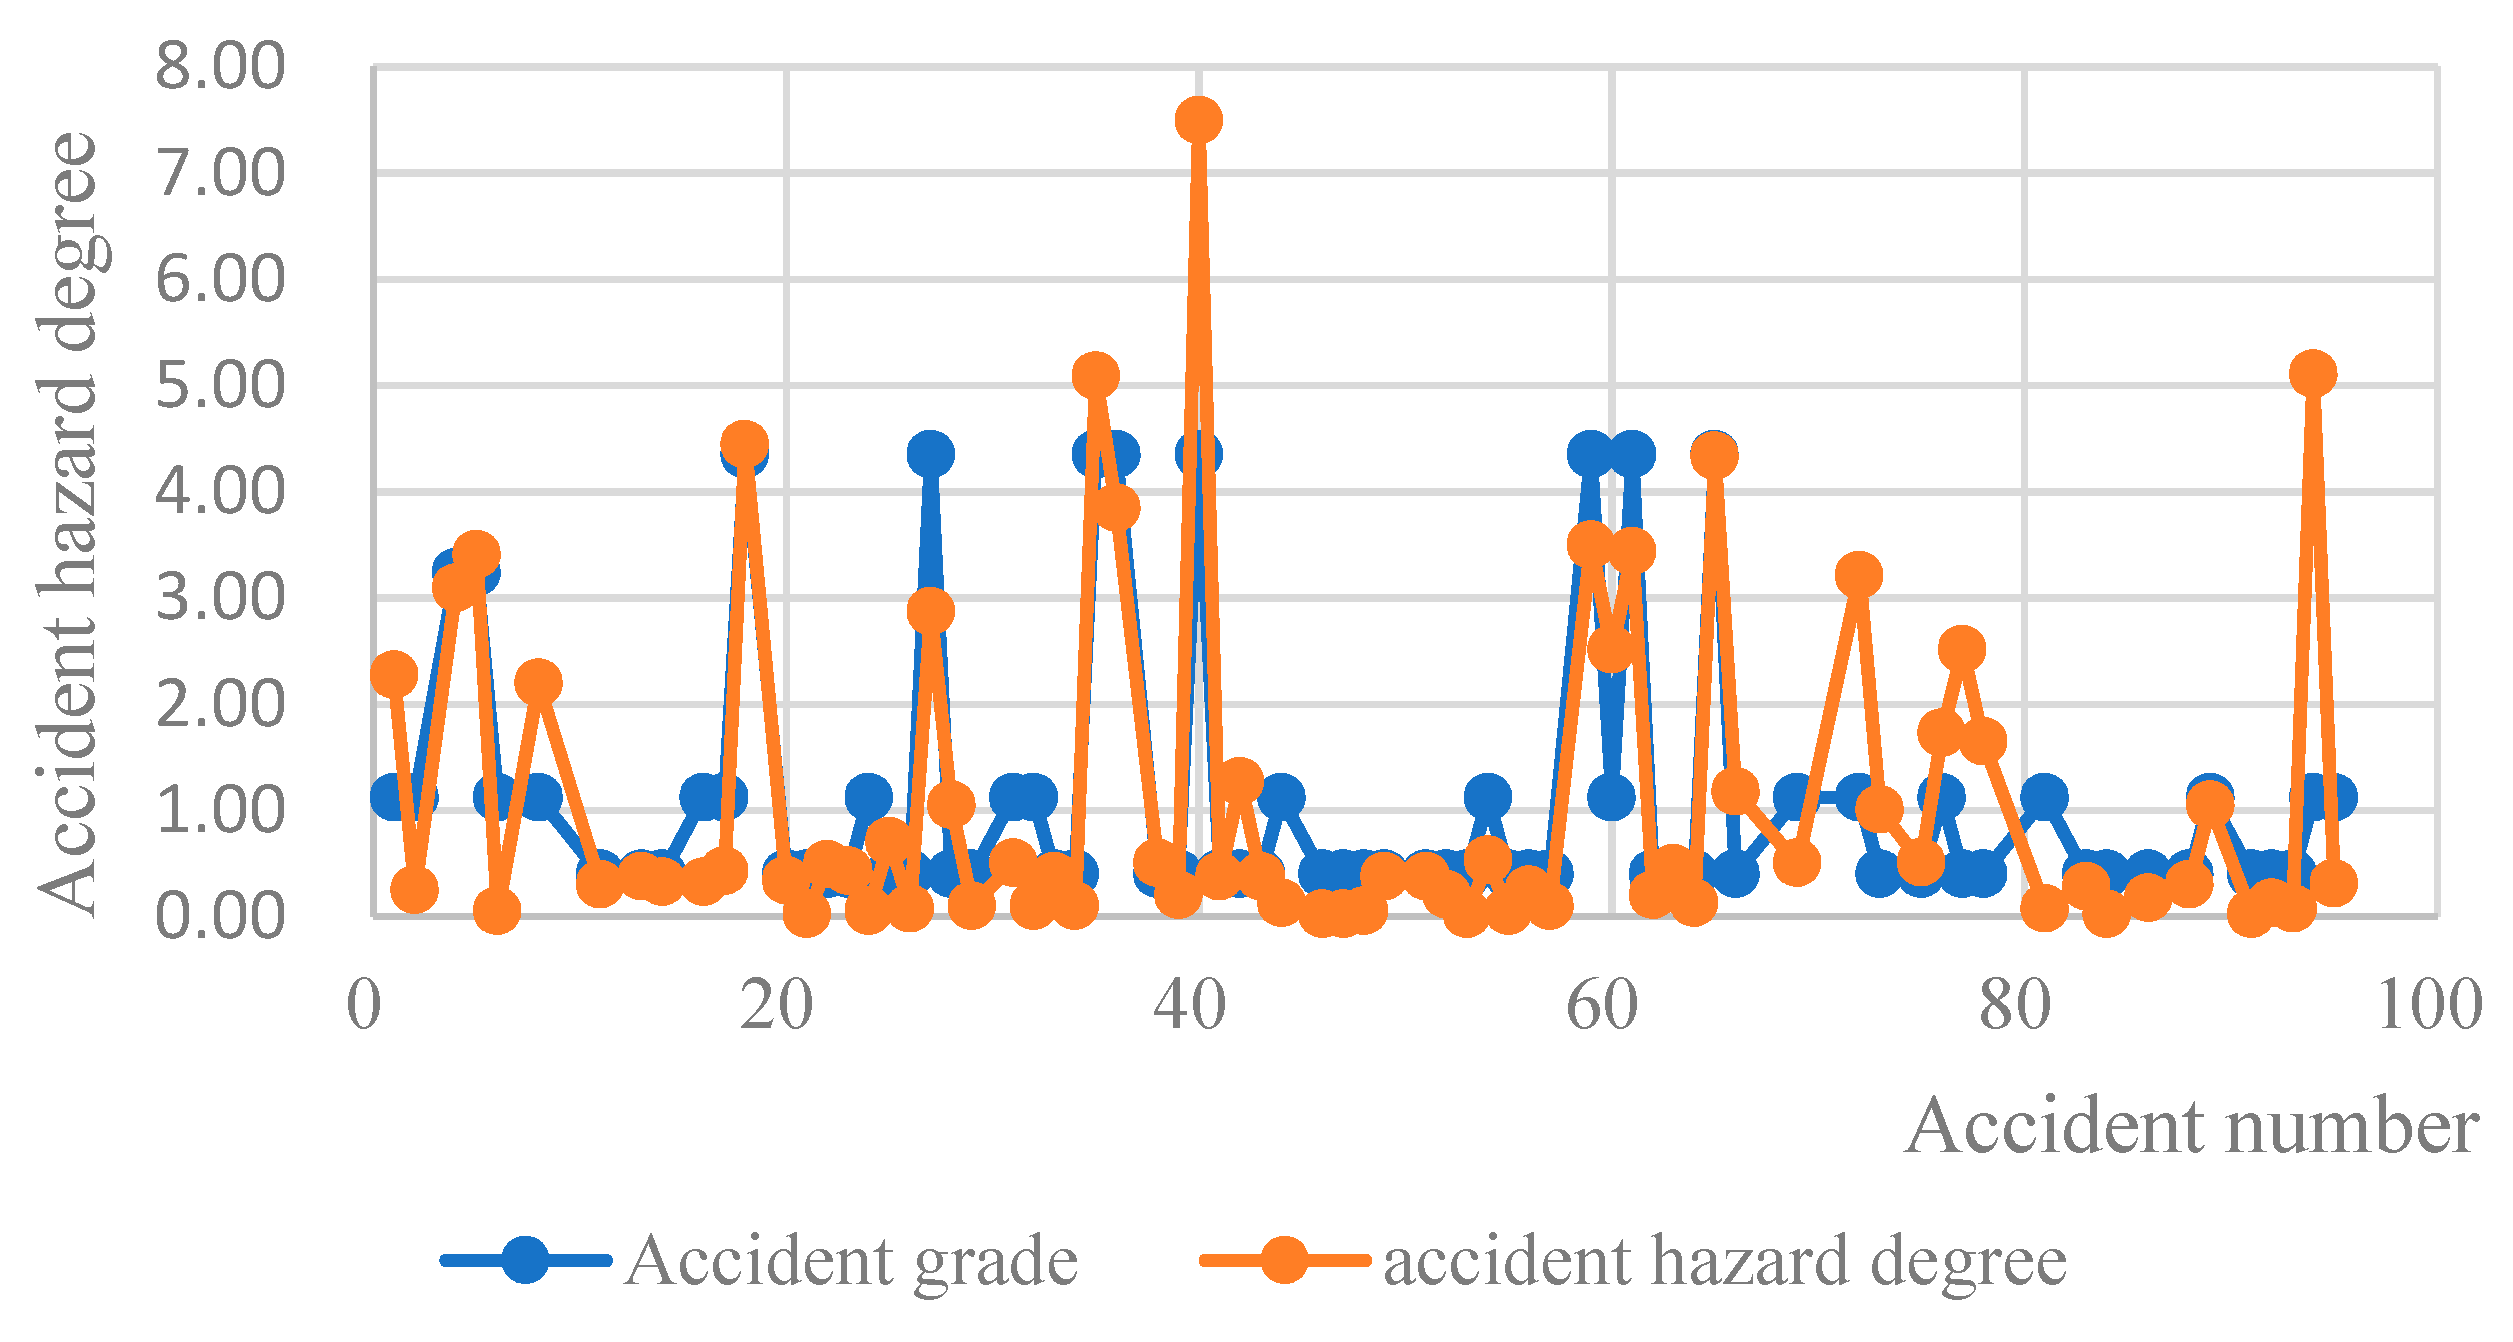
3.2.2. Validity of the Model
This paper matched the accident hazard degree and the accident grades to judge the validity of the model. Comparing the trends of the accident hazard degree with the accident grades, as shown below in
Figure 6, the accident hazard degree was generally consistent with the change in accident severity, proving the model’s effectiveness.
3.3. Traffic Analysis
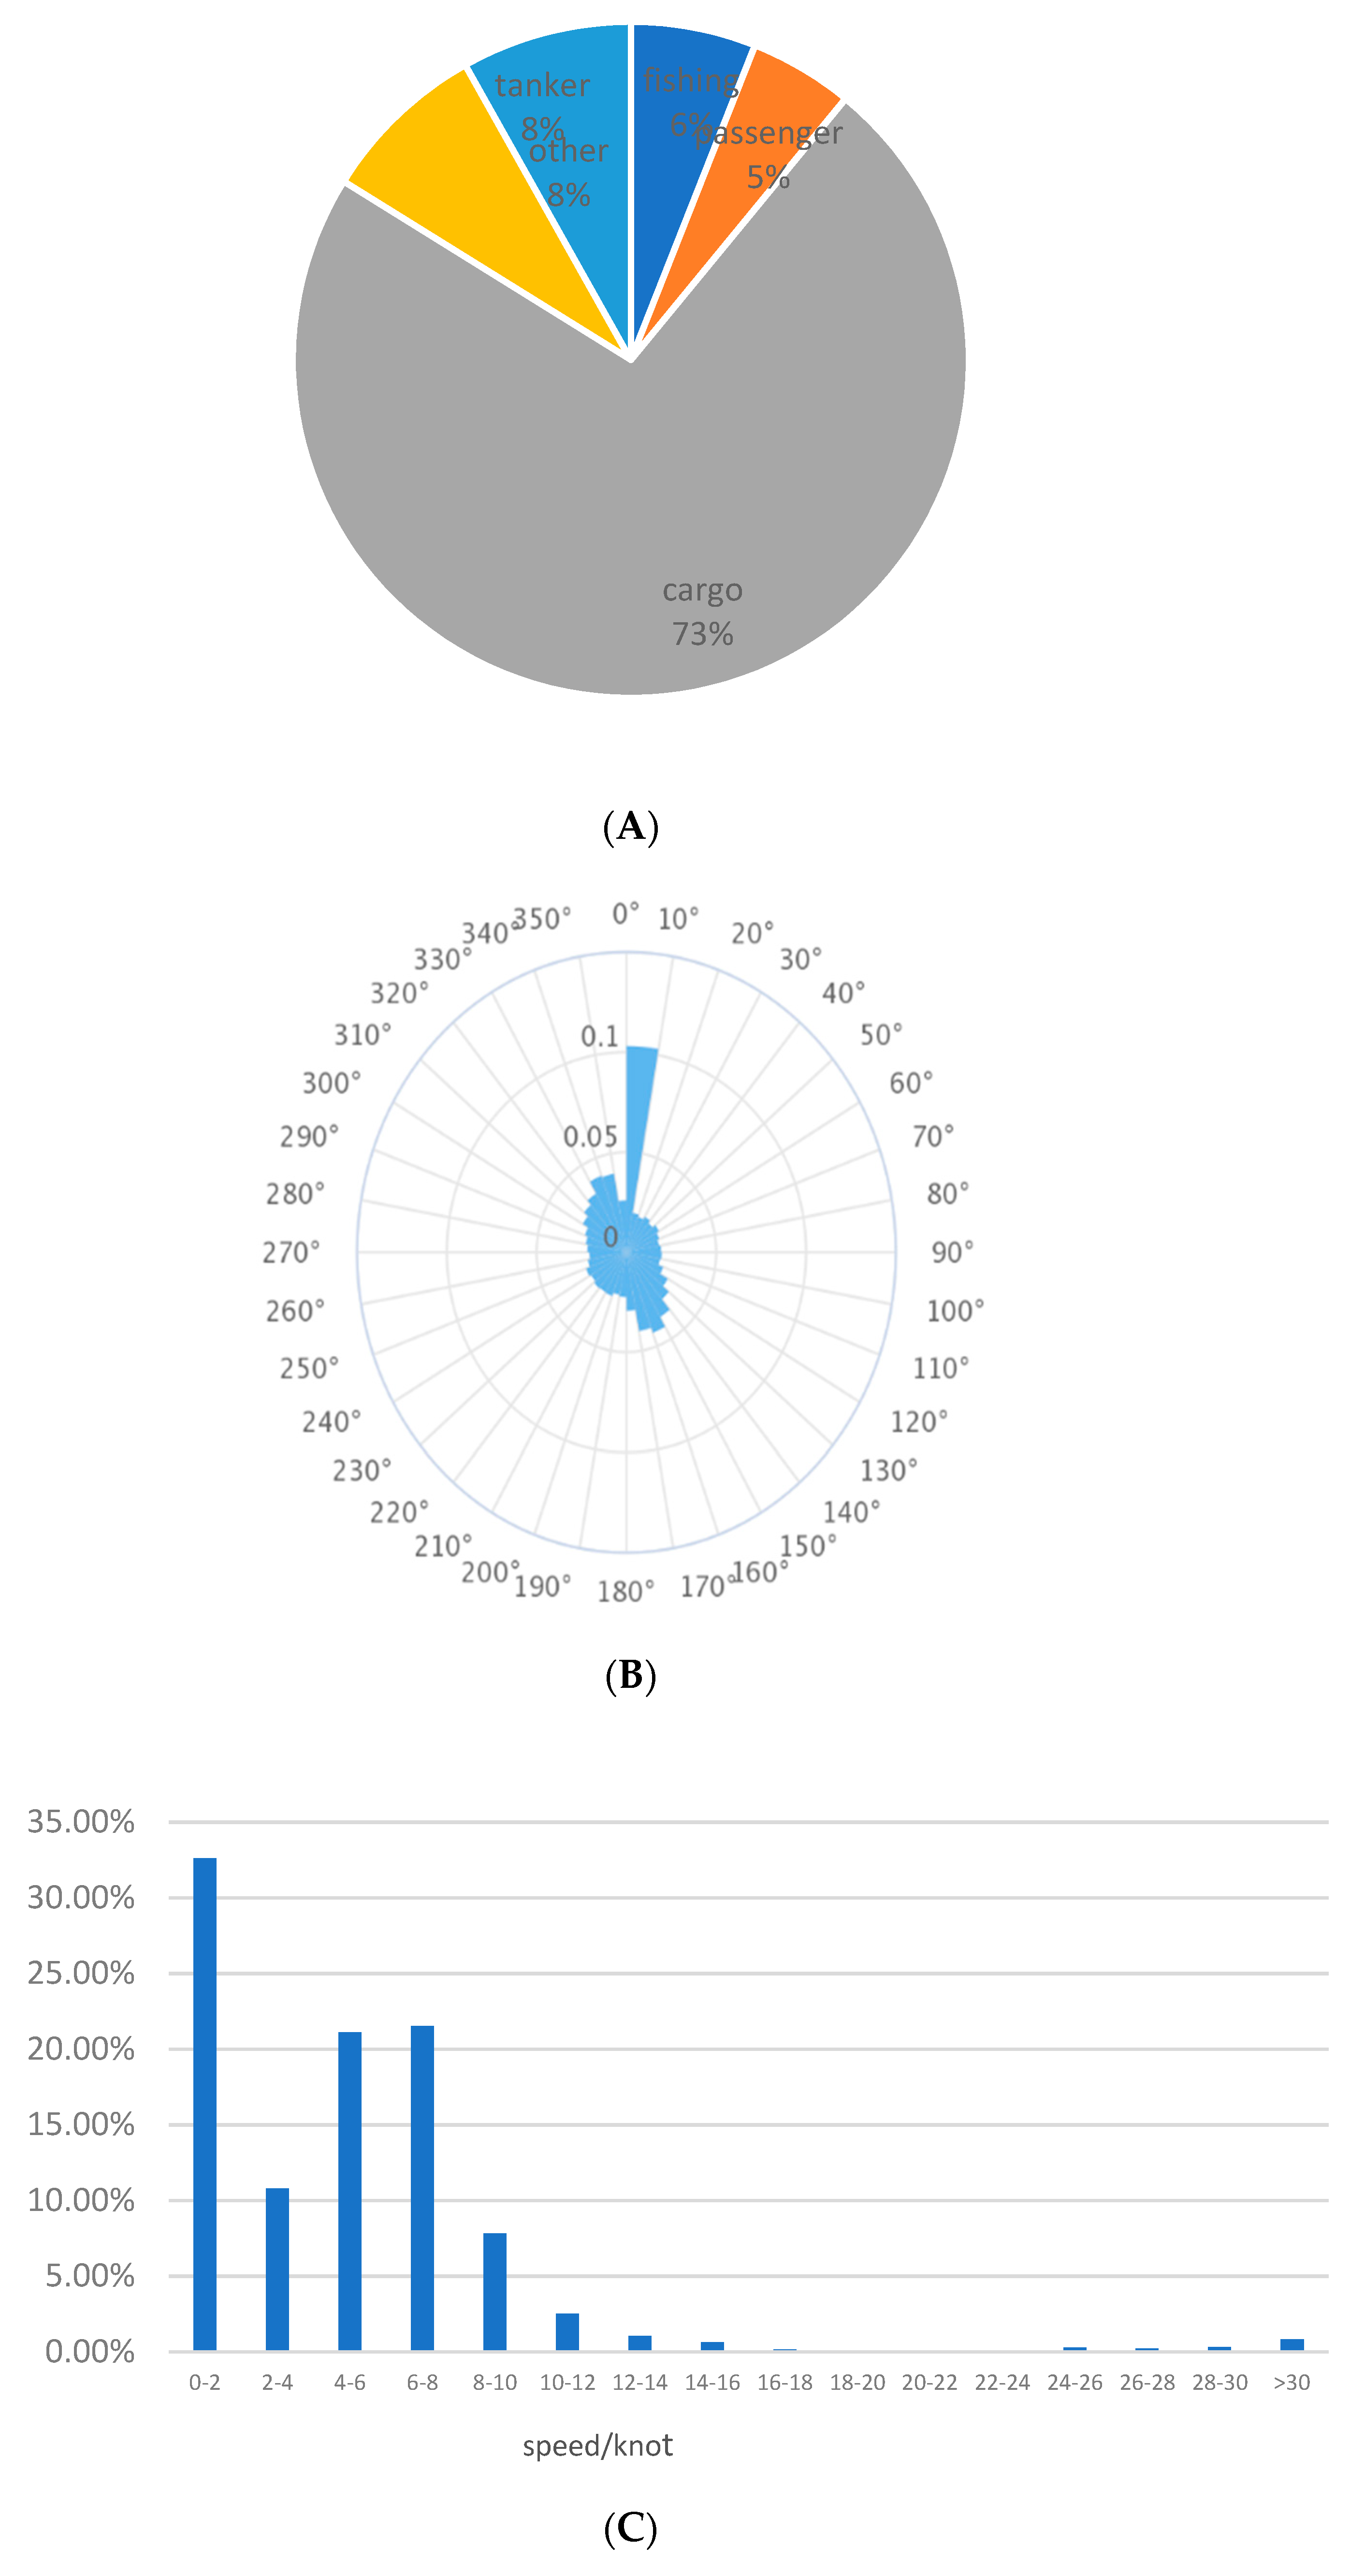
Using the AIS data on the western waterways at Shenzhen Port during March 2018, the research team was able to evaluate the vessel traffic, which was essential for further correlation analyses. As shown in
Figure 7A, cargo ships, accounting for 73%, made up the majority of the vessel traffic in the study area. For the heading distribution, as shown in
Figure 7B, two concentrations were observed around 000–010° and 150–160°, which was consistent with the actual direction of ship movements, being north and south bound.
Figure 7C demonstrates that the ship speed was largely concentrated at 0–2, followed by 6–8 knots, which knots reflected the ships close proximity to the port and docking activities.
3.4. Overlay of Accident and Traffic
As demonstrated in
Figure 8, the superimposed accident data and traffic flow data showed high degrees of correlation. The unit of density map represents the number of ships per square kilometer. About 54% of the total accidents took place in the regions with higher traffic density, and about 65% of the collision accidents took place in the regions with higher traffic density. Therefore, the potential to prove our initial hypothesis that higher vessel traffic increases the probability of collision accidents, will be tested in the following sections.
4. Relational Model between Accidents and Traffic
It is commonly known that accident location is a point data, while traffic flow is linear and has regional features. As outlined in the research framework, a geographical grid system needs to be derived as a link between accidents and traffic flow information.
4.1. Visualization
Synthetic Indicator Approach
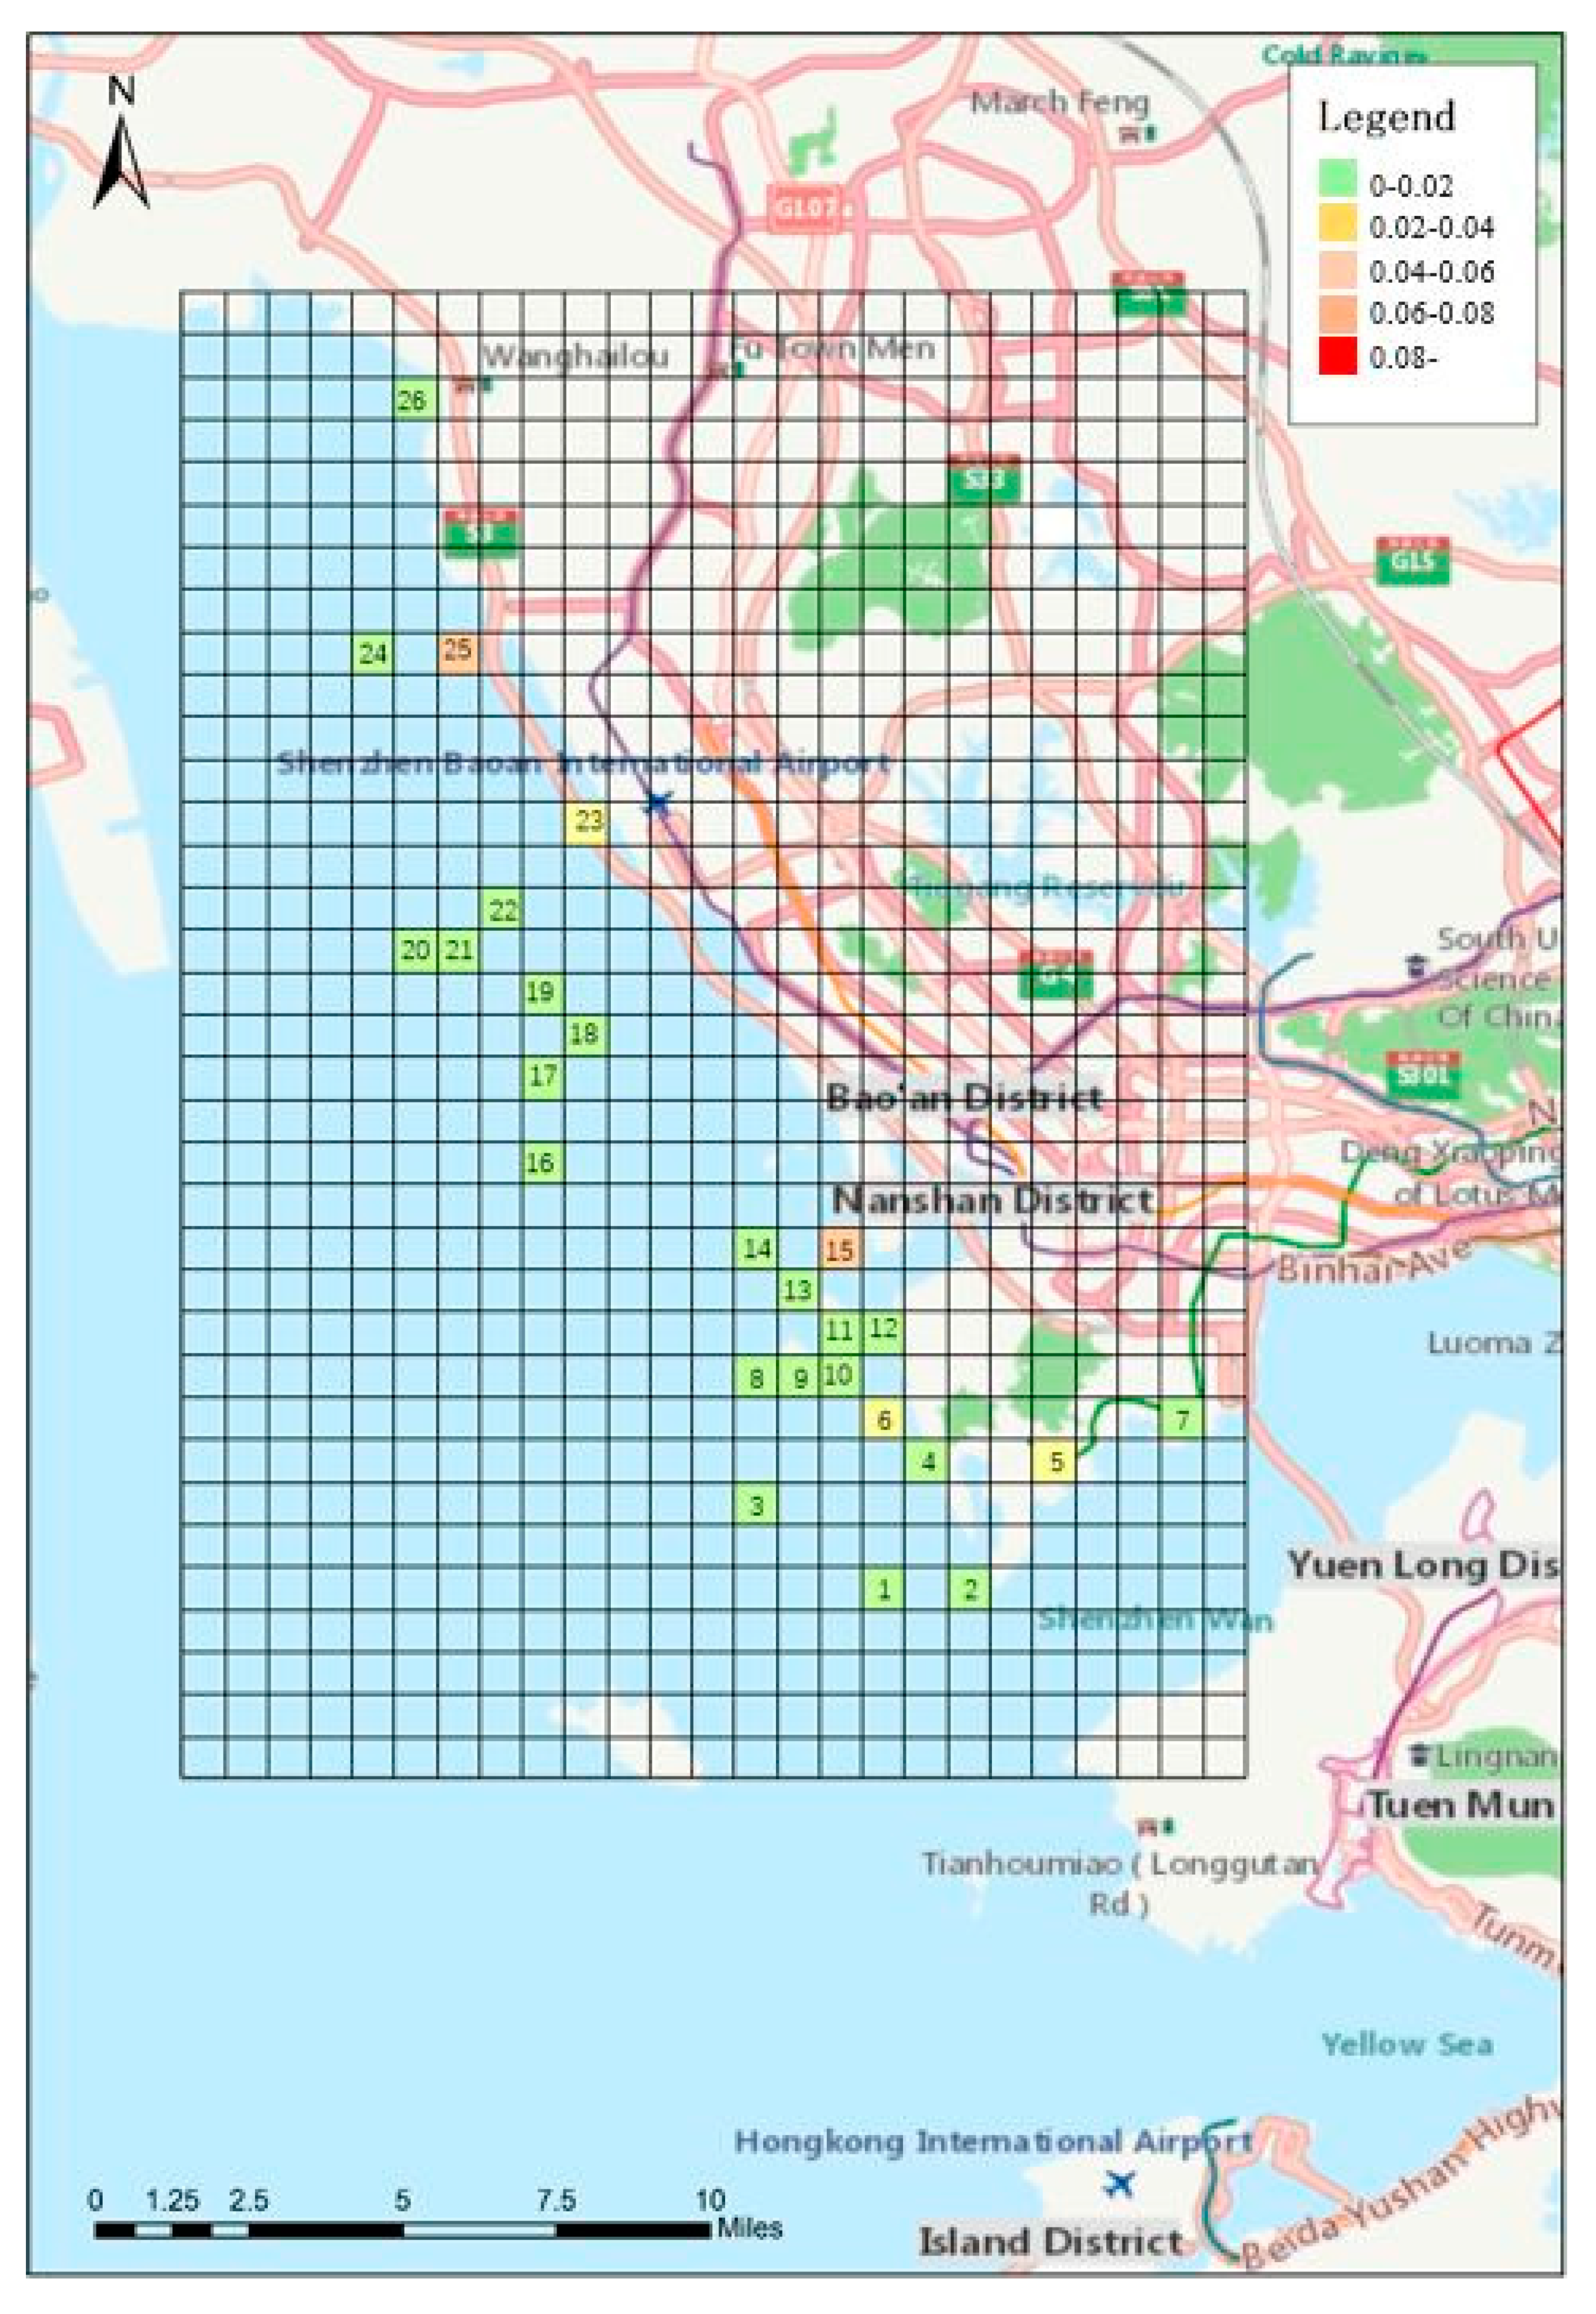
The study area was divided into 875 grids, each measuring at least 1.1 by 1.1 km. Relative consequence of regional hazard (RCORH) measures were calculated for each grid, or cell, and plotted on the map, as shown in
Figure 9. There were several grids with high location hazard indices, such as those marked in red.
4.2. Regression Models
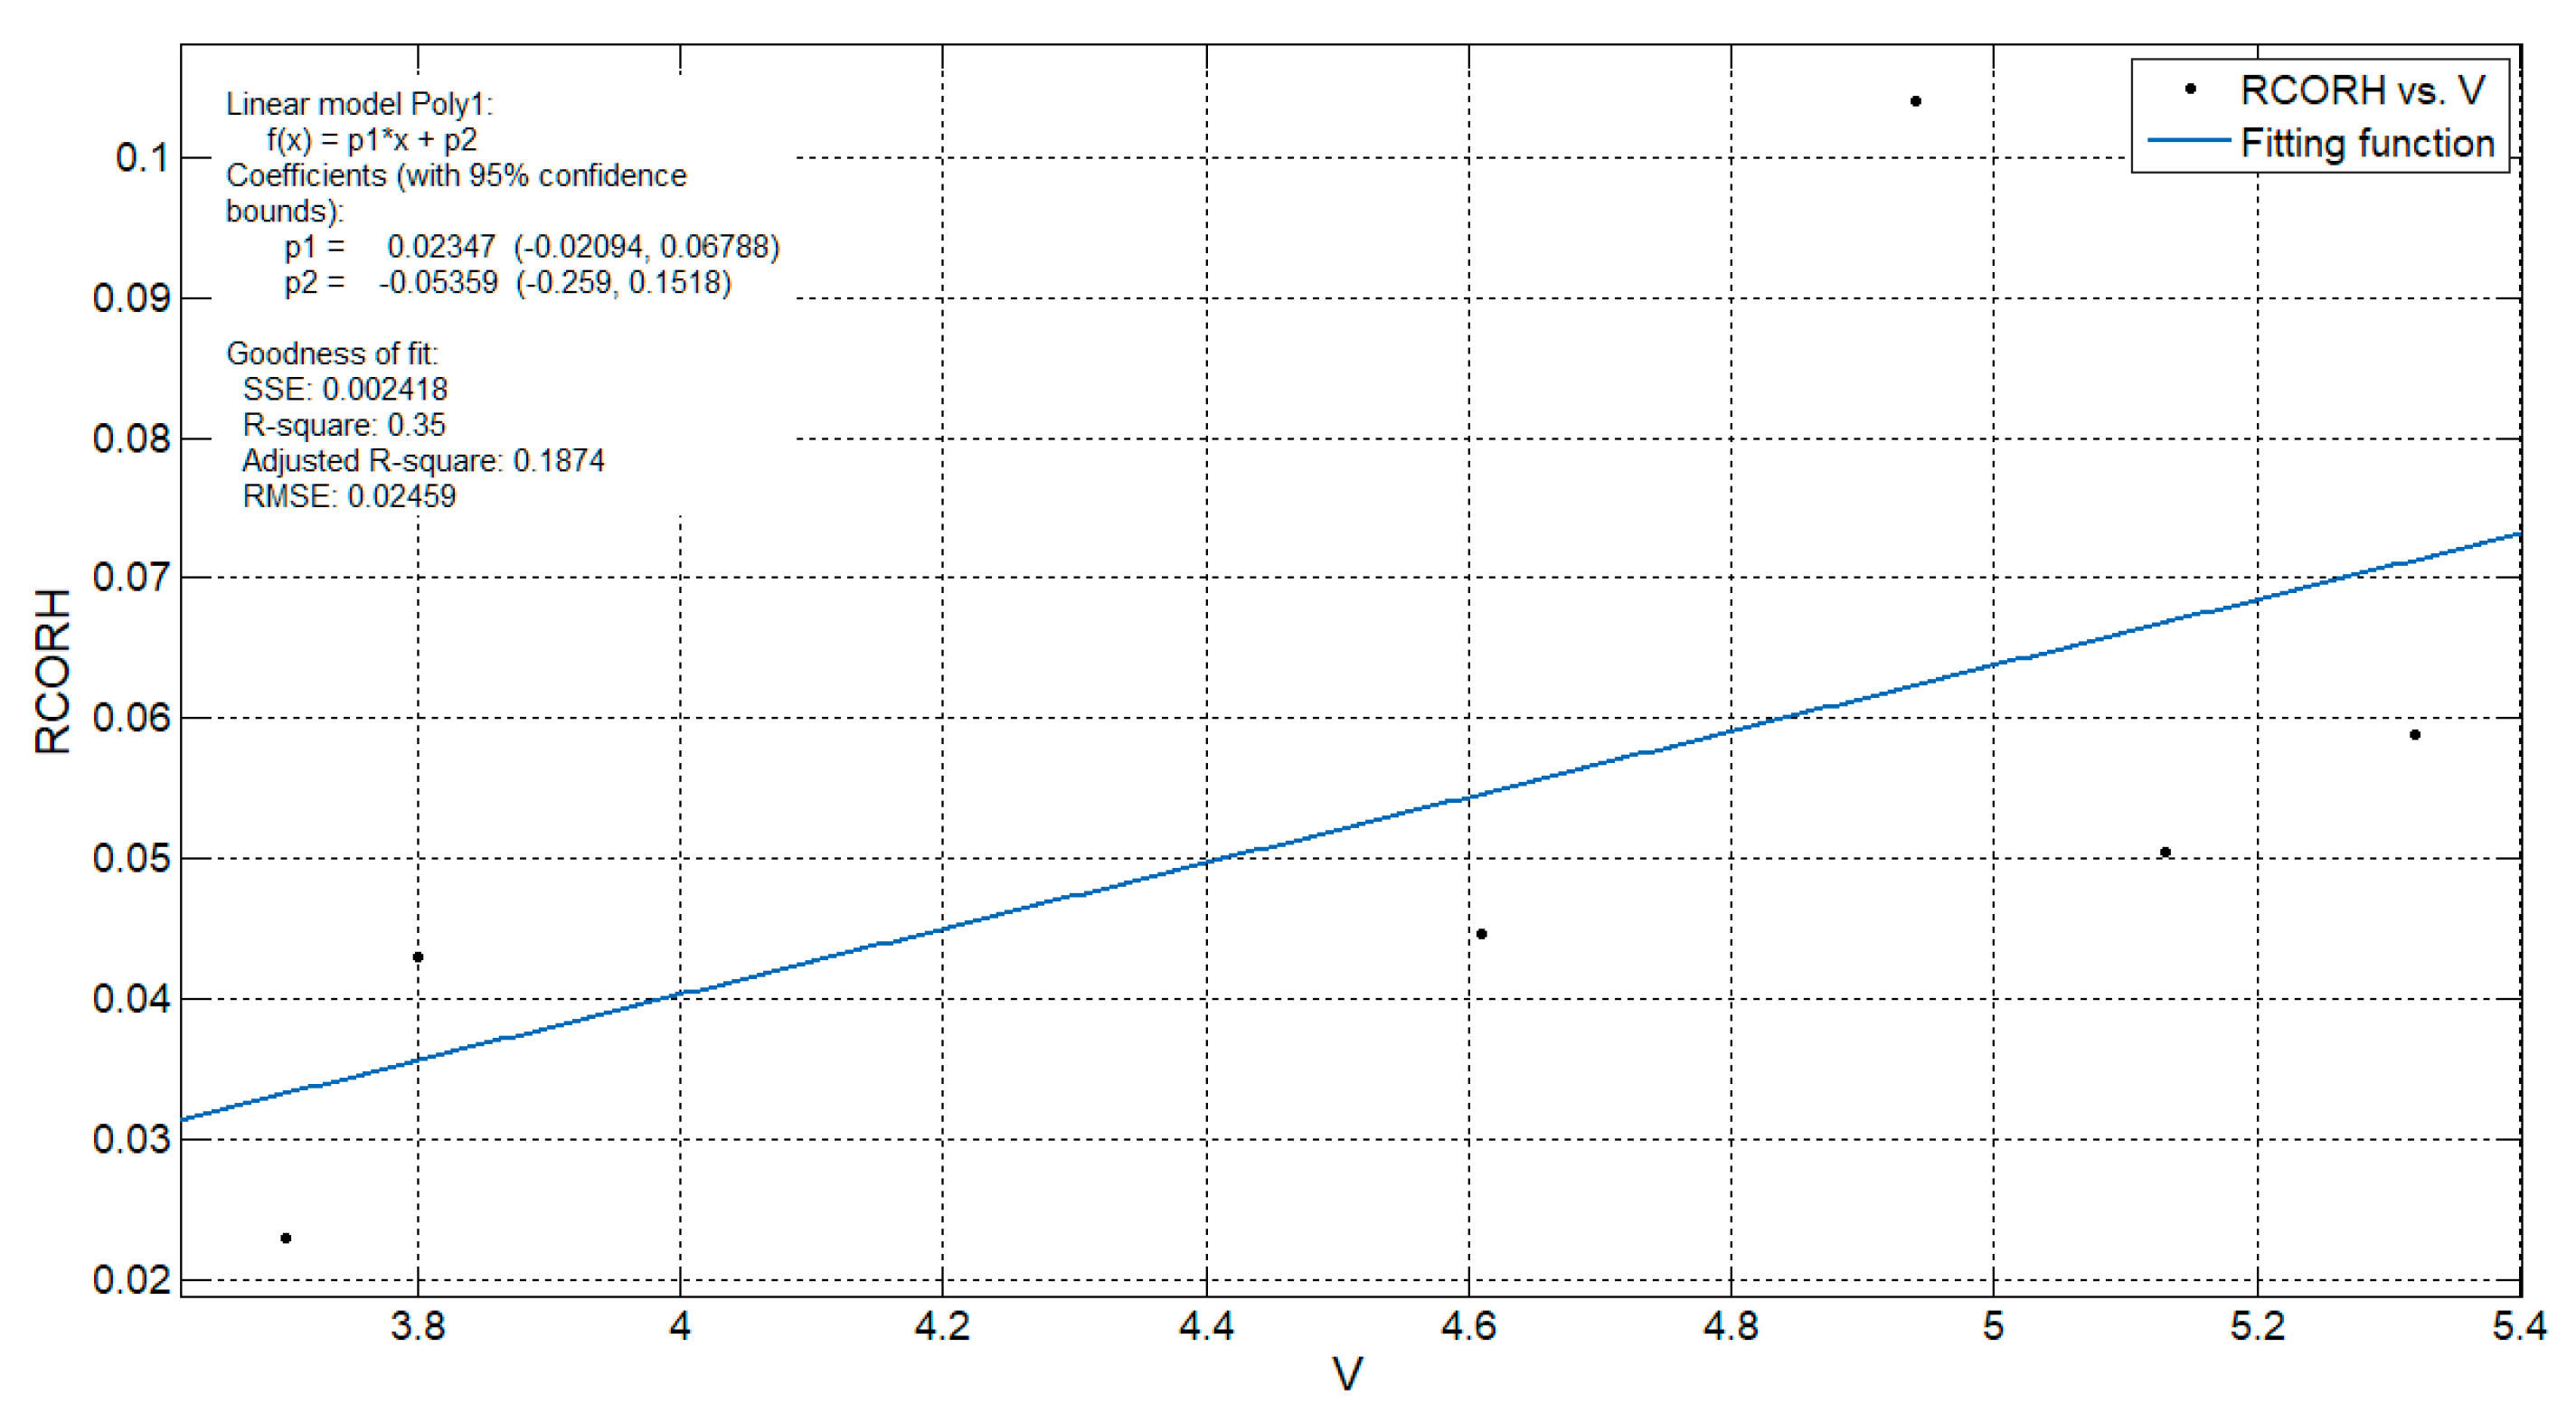
4.2.1. Viewed from Traffic Speed
First, the speed in the grids was selected via longitude and latitude, and the speed distribution was obtained using a statistical method. Then, 14 grids were selected for the regression model, although the model fitting was poor, which was inconsistent with the actual experience. According to the analysis, the ships sailing in coastal waters were mainly on the berthing, and the ship speed was small and unrepresentative. Therefore, excluding the coastal grids, six grids of relative consequences of the regional hazard and the mean speed were fitted, as shown in
Figure 10.
4.2.2. Viewed from the Ship Heading Variance
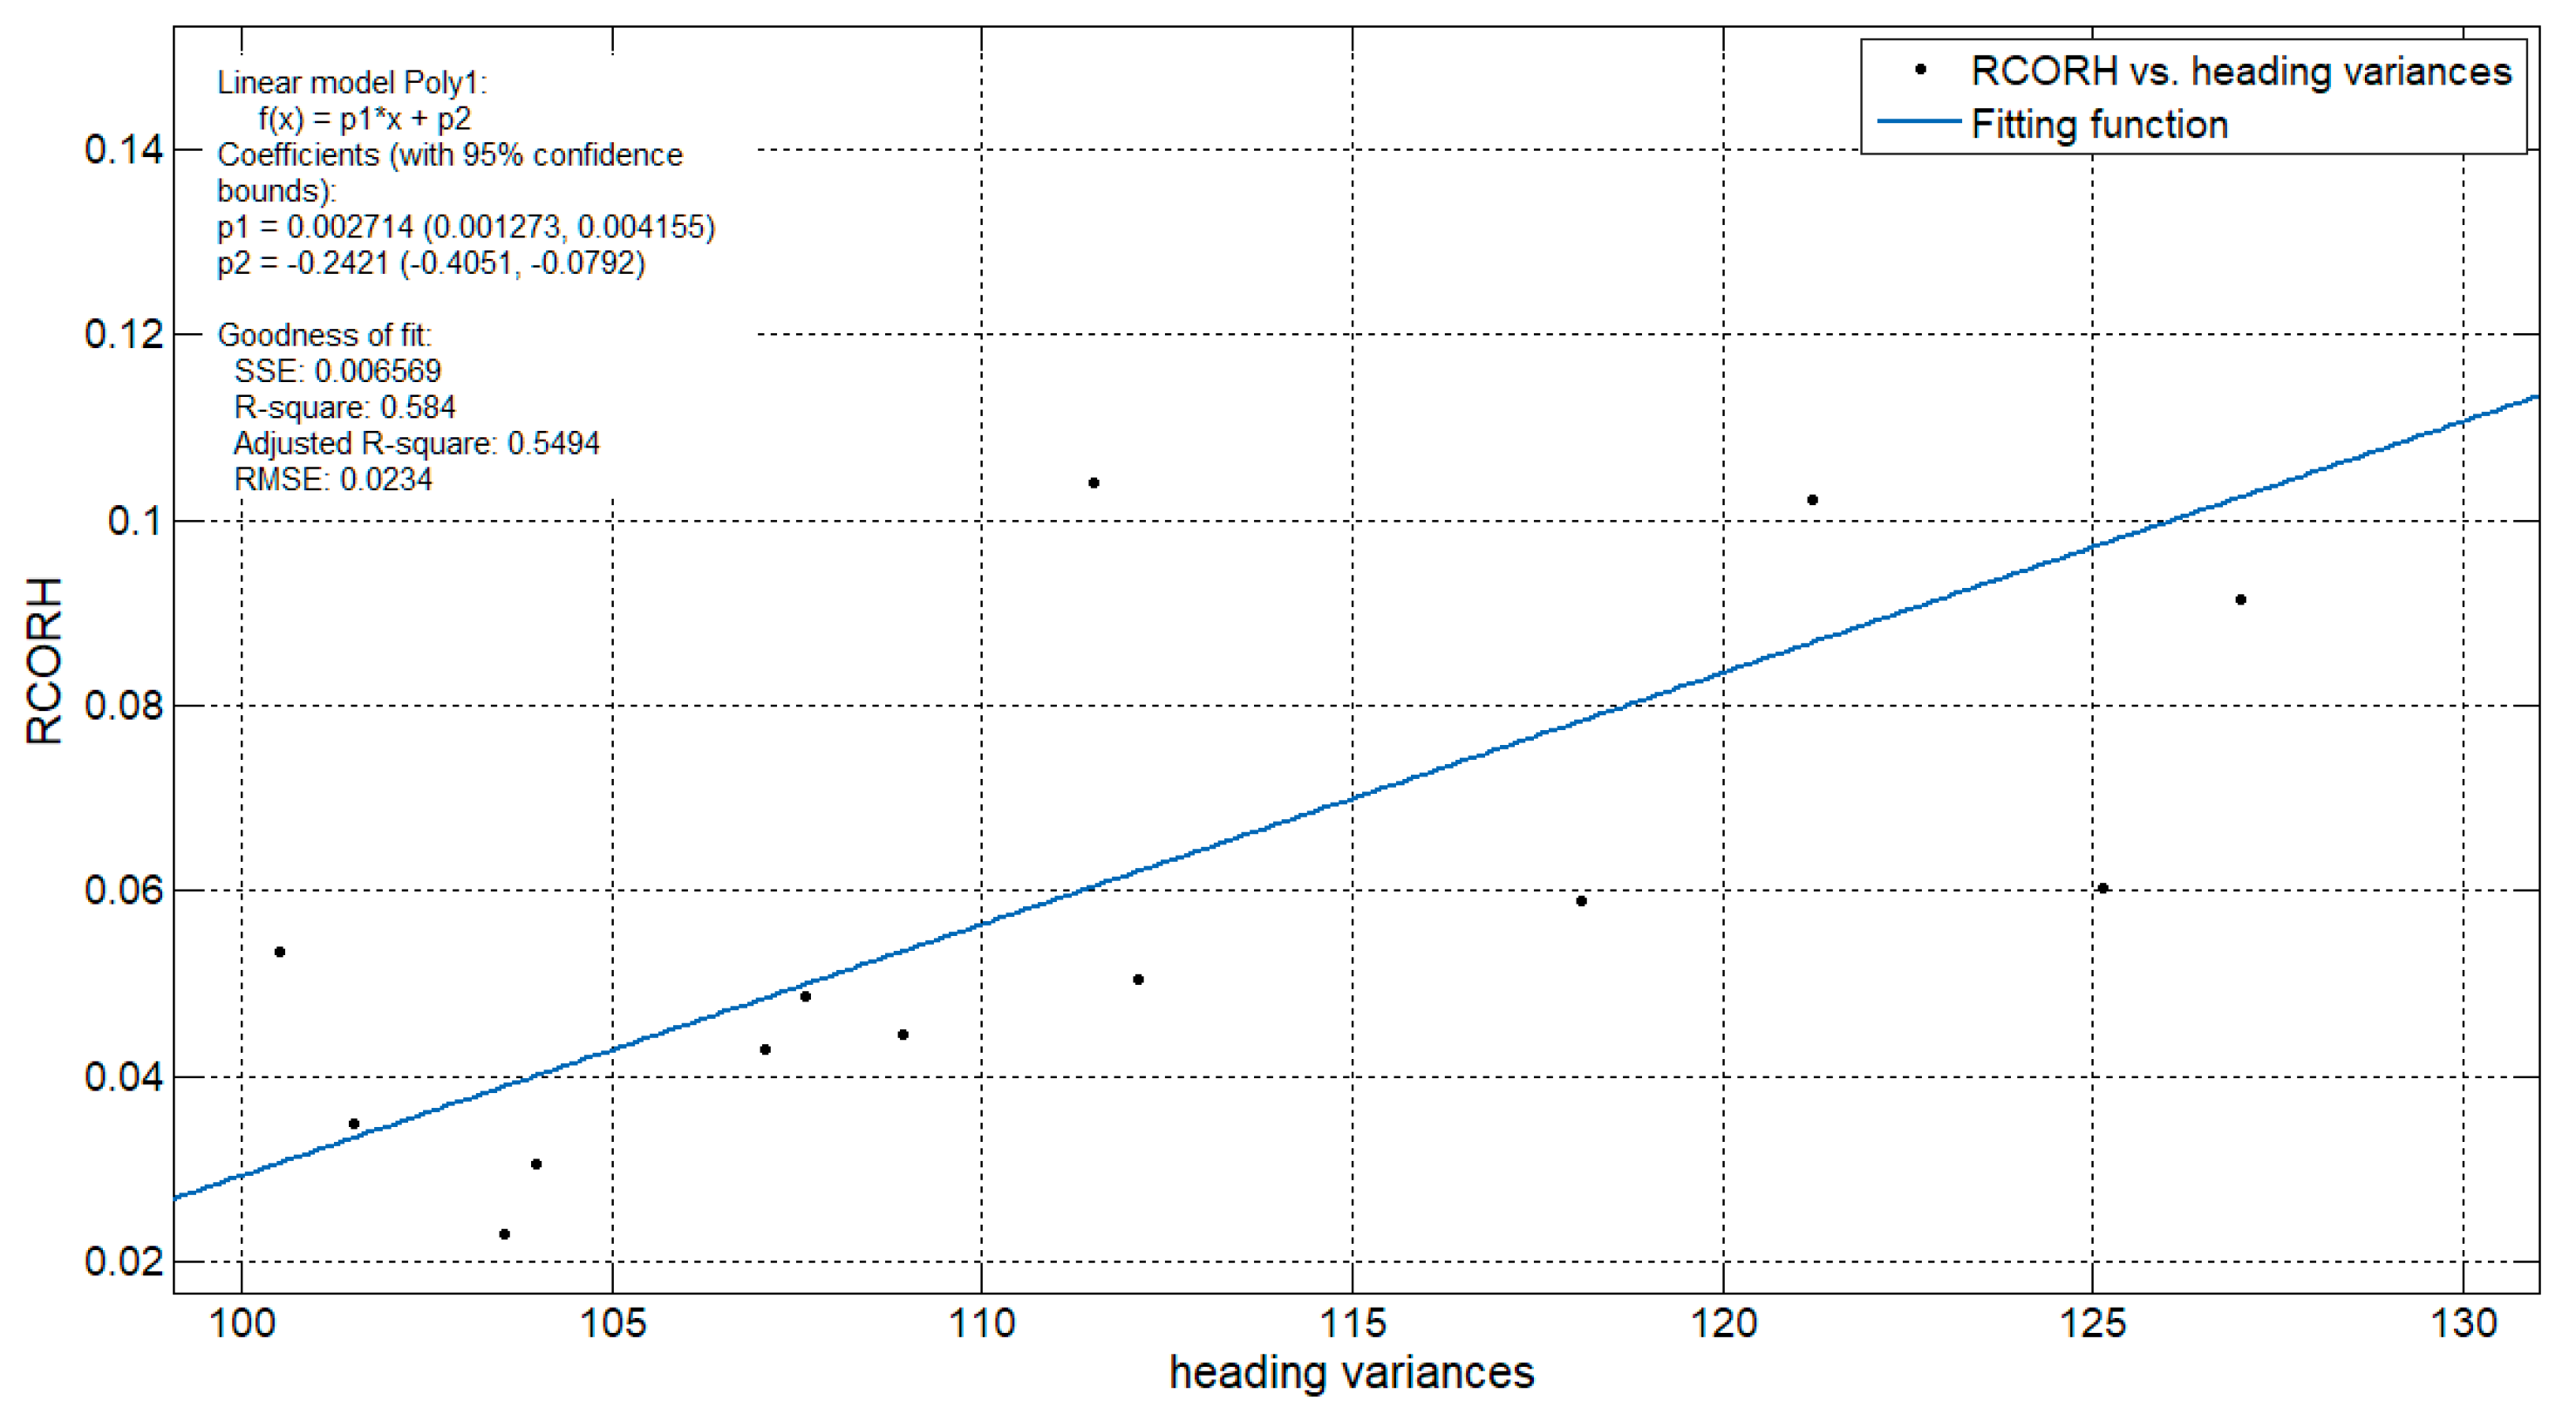
The fitting relationship between the relative consequence of regional hazard and the variance of heading is shown in
Figure 11.
Heading variance is the expectation of the squared deviation of the heading from its mean. As shown in
Figure 11, the ship heading deviation maybe a good indicator for complex travel conditions. The heading variance represents the complexity of traffic flow. The linear function has the best fit for heading variance and the relative consequence of regional hazard. The correlation between the complexity of the waterways and accidents was positive, i.e., the greater the variance of the heading, the more complex the traffic flow, and the more likely it was to cause an accident, that is, a bigger RCORH value will appear for certain areas.
4.2.3. Viewed from Traffic Volume
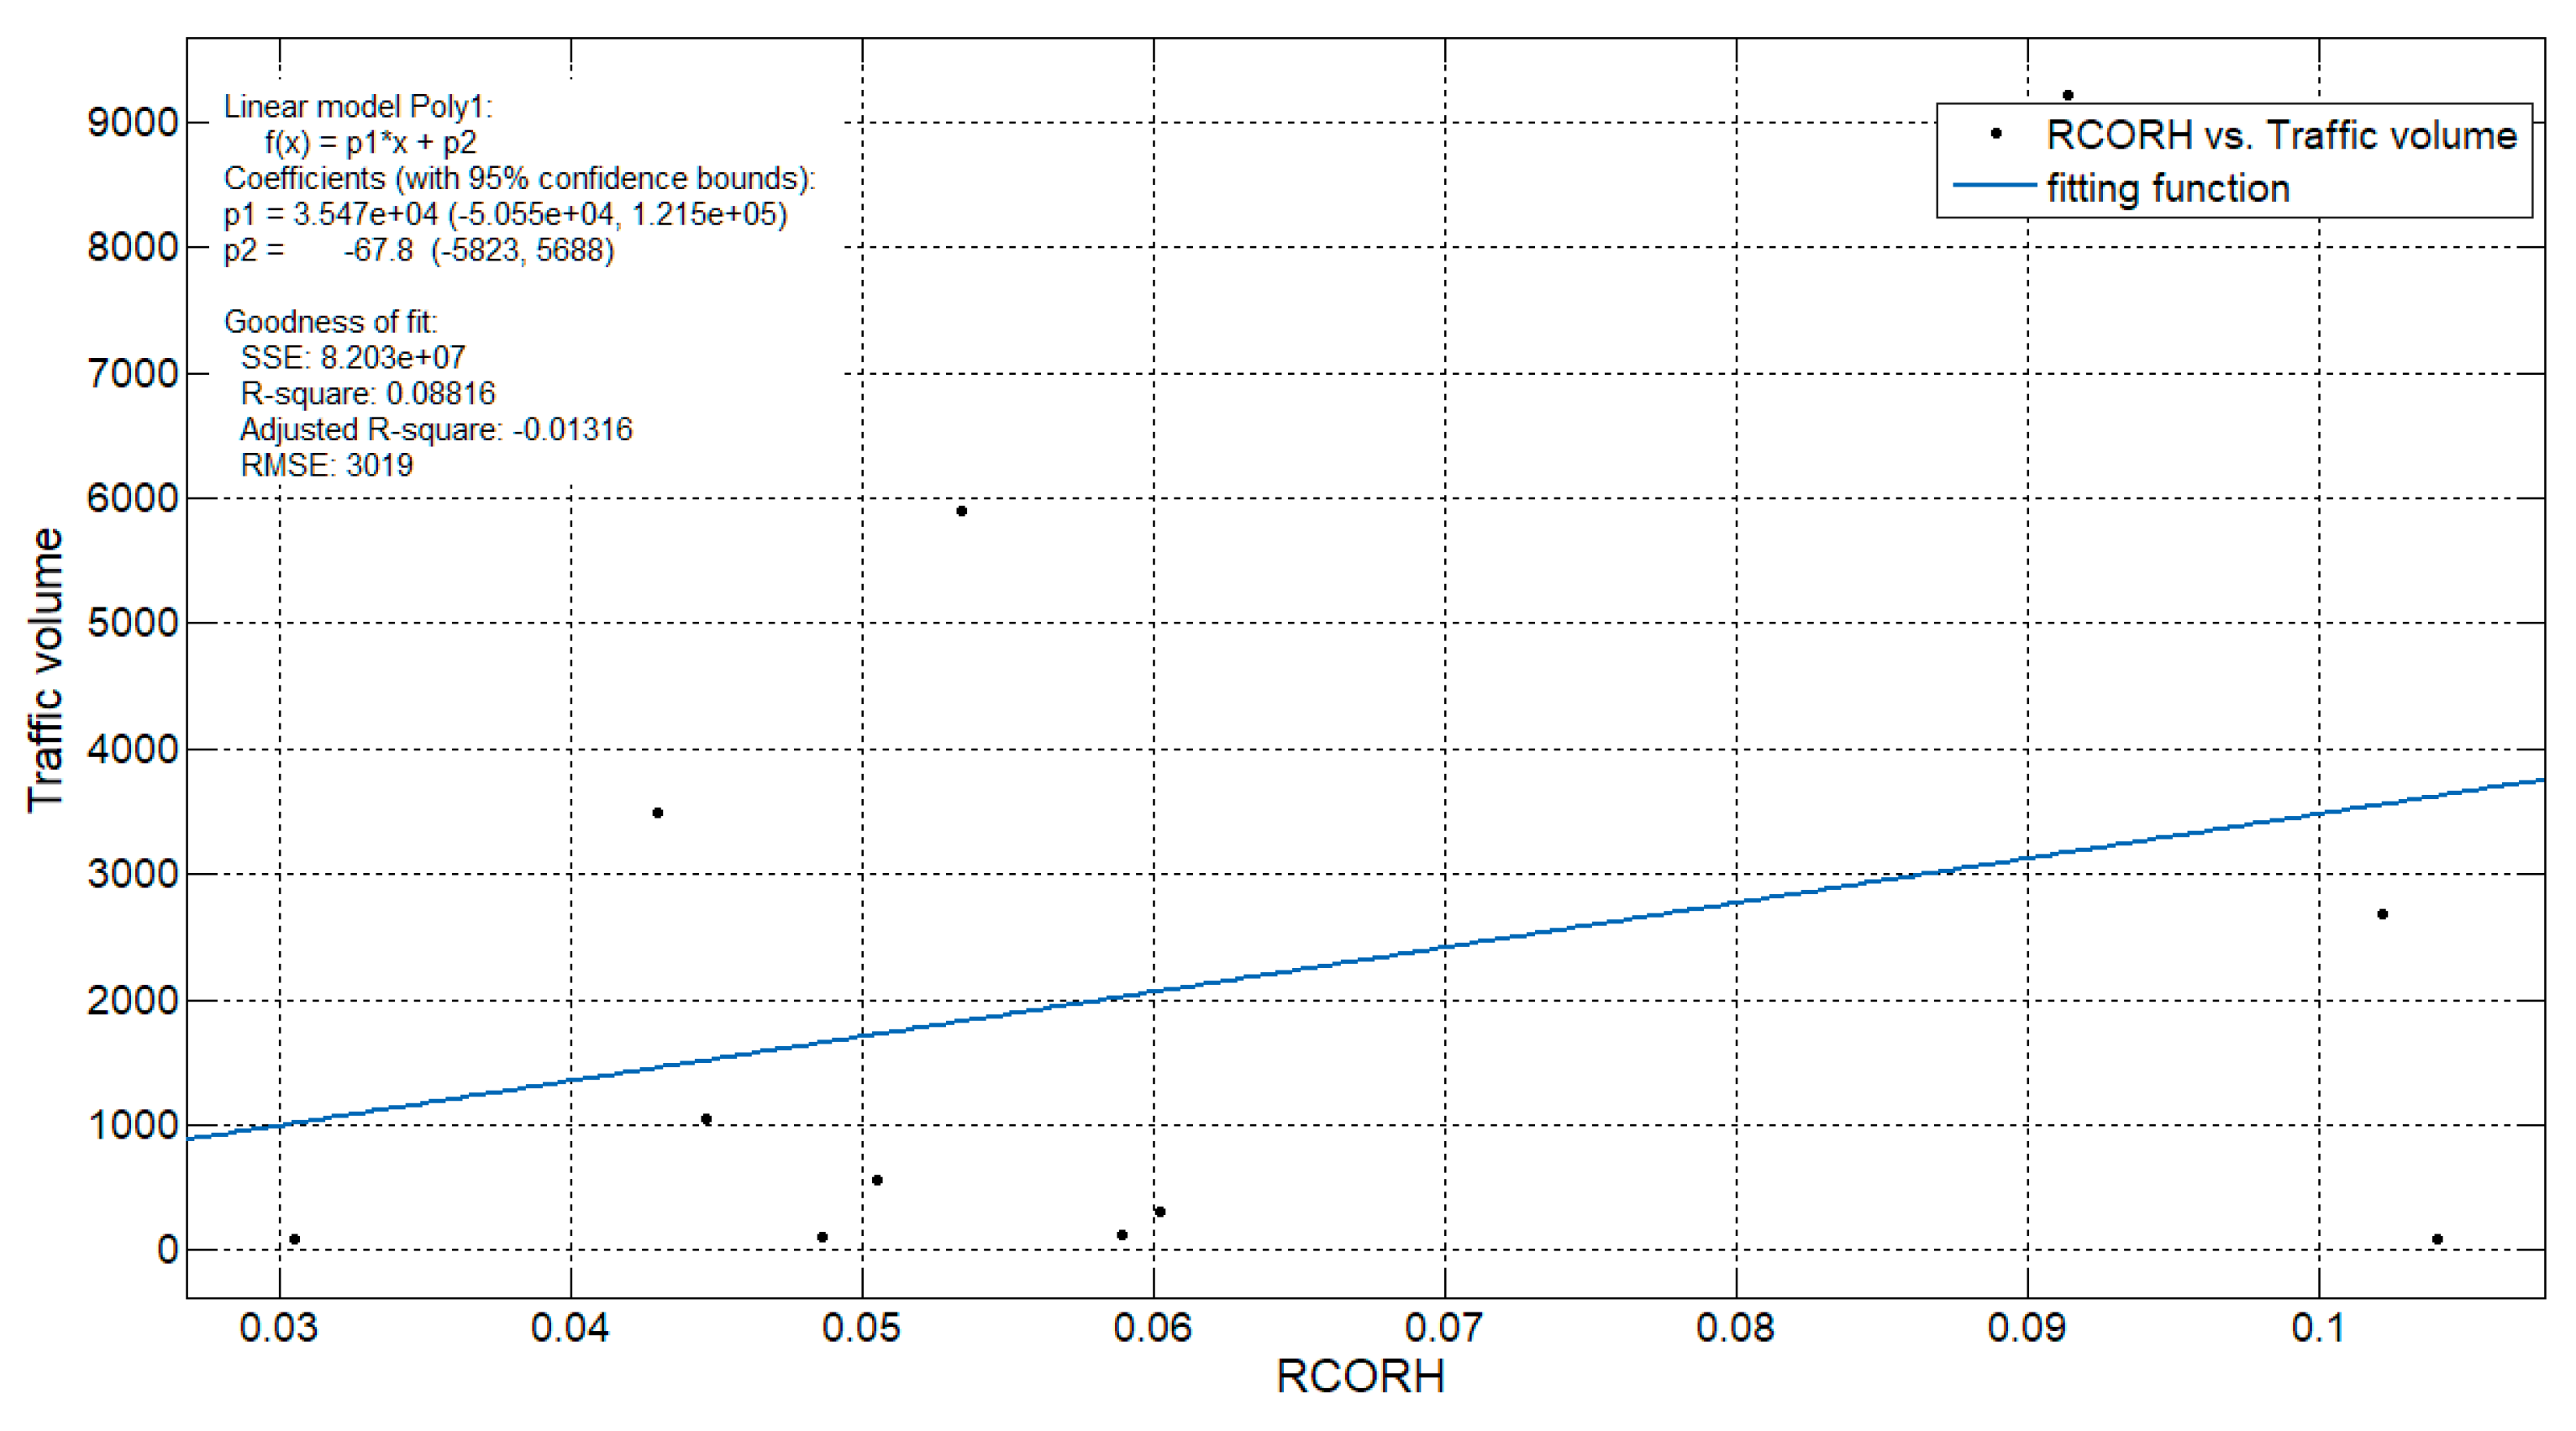
Traffic volume is another potential variable that affects the probability of collision accidents, as reported in several studies. As shown in
Figure 12, the correlation between traffic volume and accidents was positive. Therefore, the greater the traffic volume, the more likely the traffic conflict, and the more likely that an accident will occur.
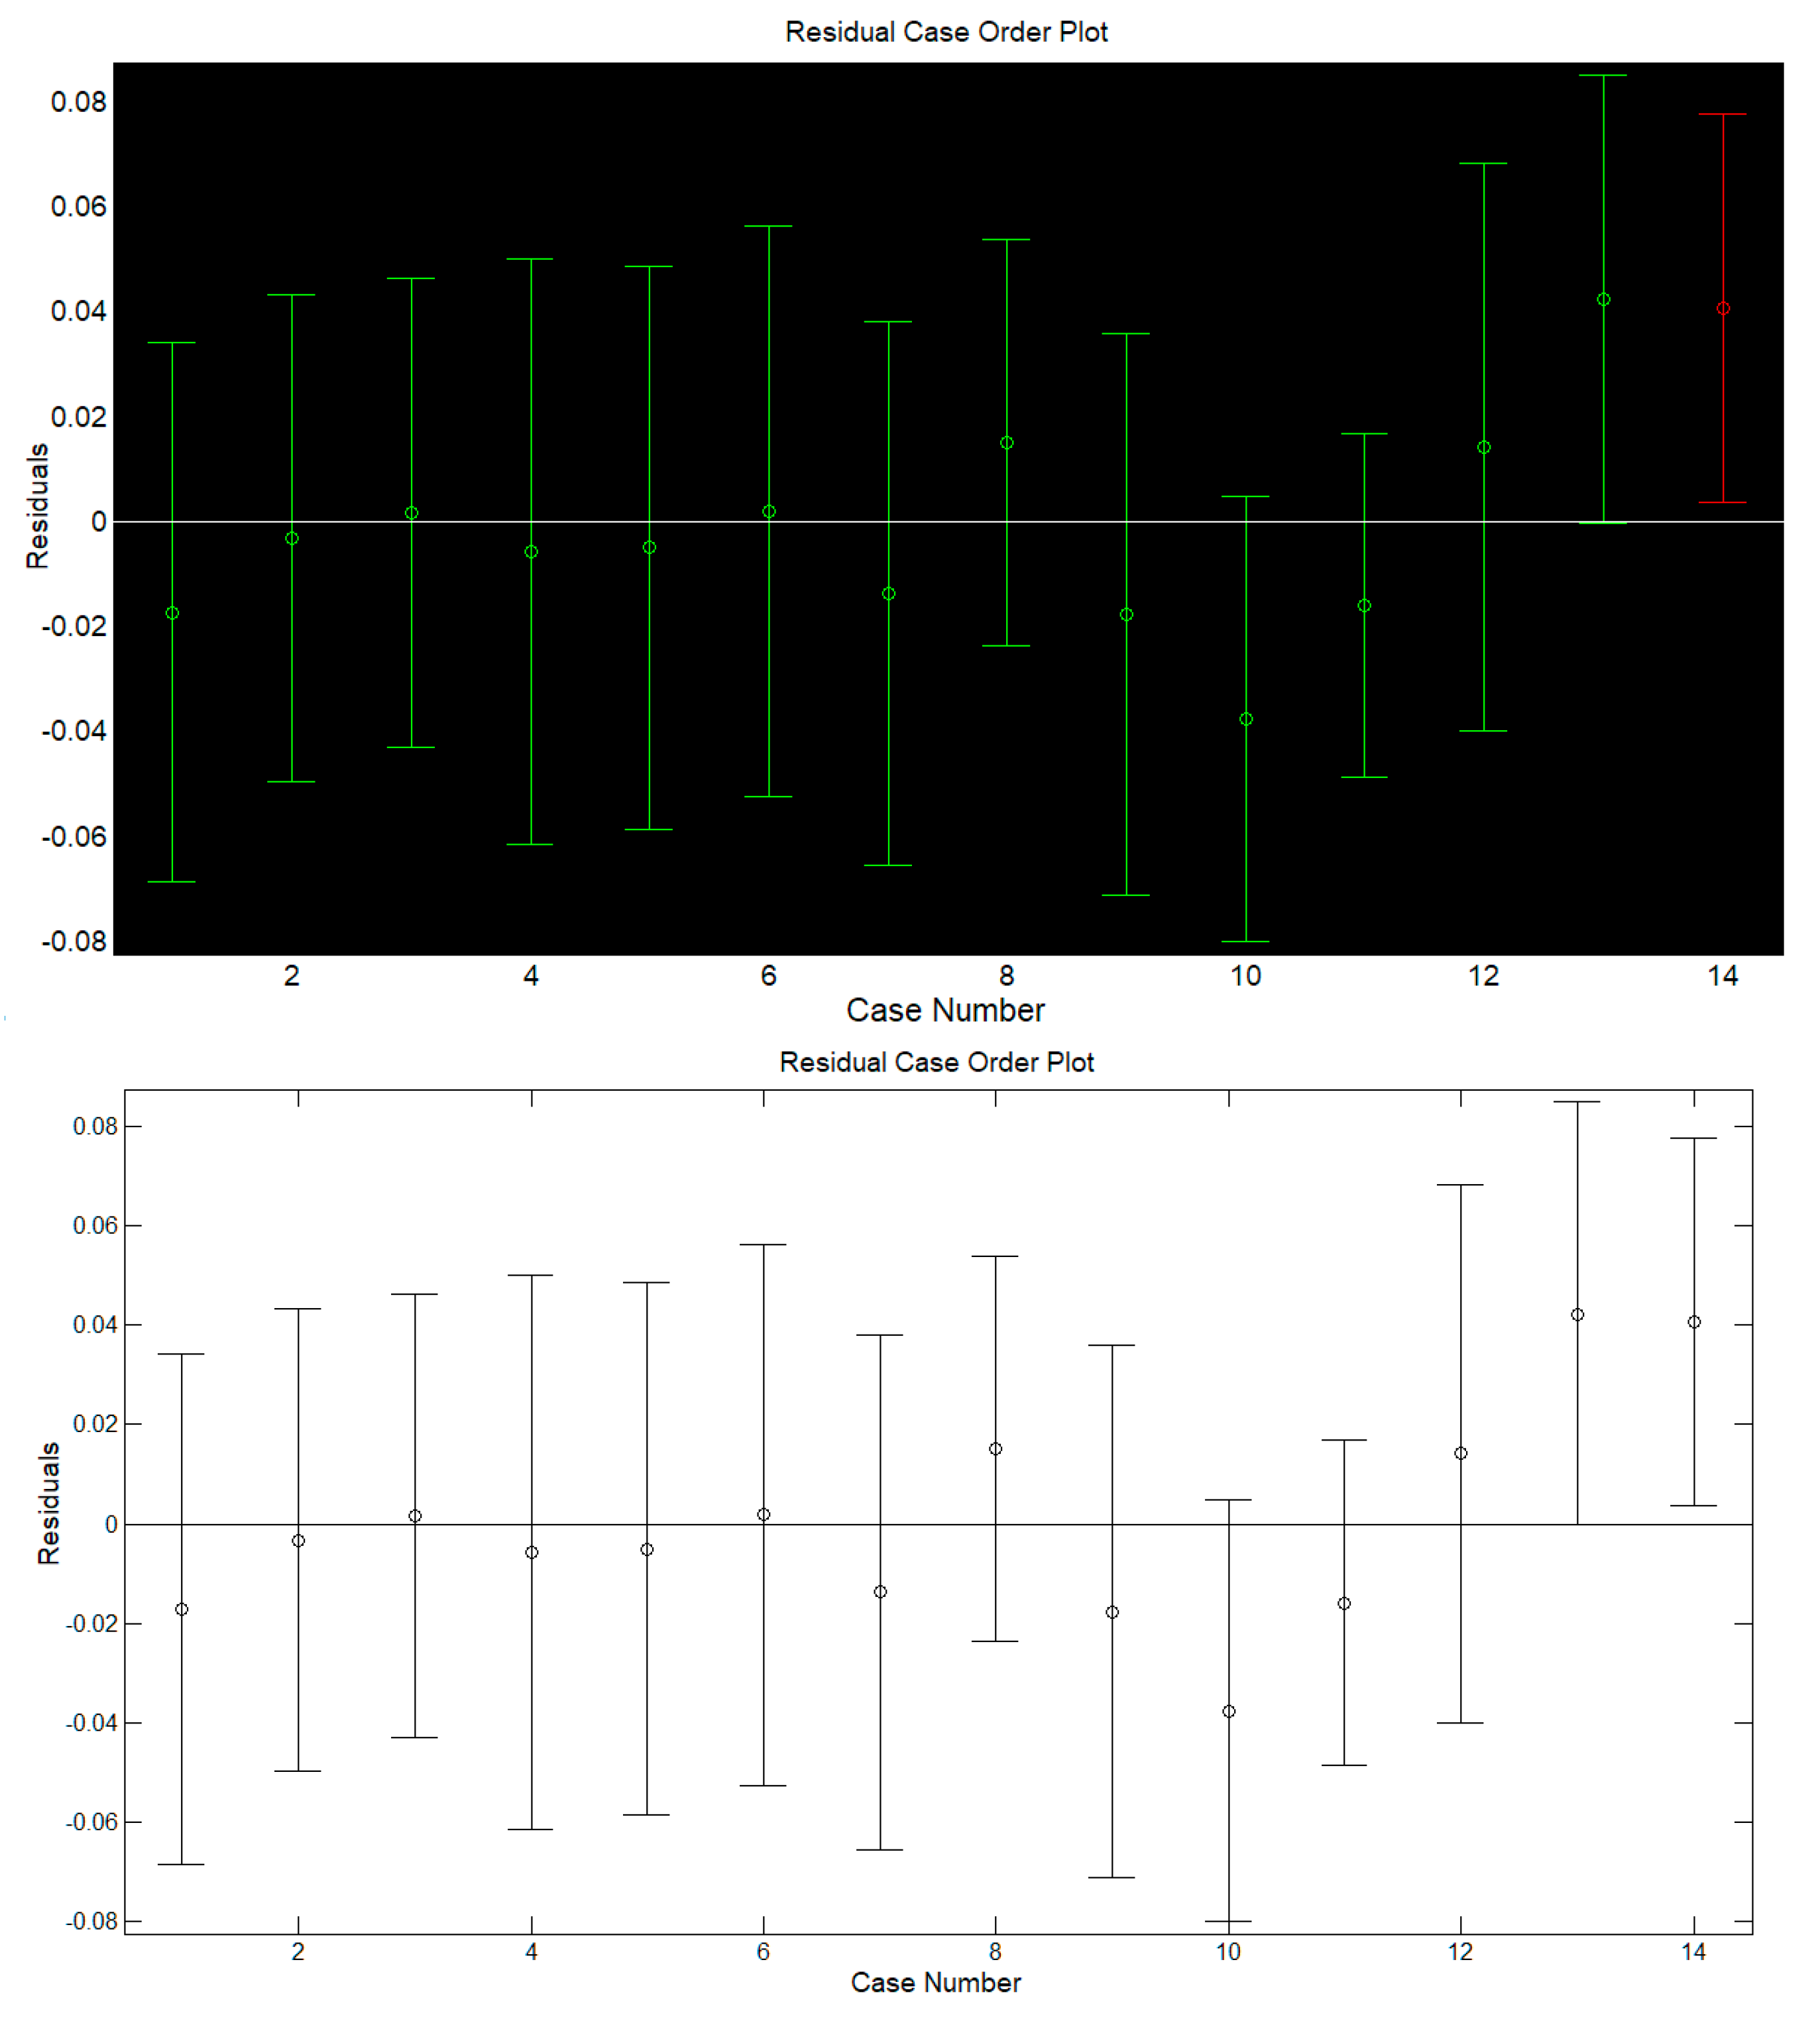
4.2.4. Multiple linear regression model
To discover the integrated effects of the vessel traffic parameters, a multiple linear regression model was developed in Equation (6), where the residual case order plot is shown in
Figure 13. The
was 0.5947, F was 4.8901, and
P was 0.0241. The closer the R-squared to 1, the more accurate the regression model.
P < 0.5 proves that Equation (6) is valid.
where:
,
,
are the normalized heading variances, traffic speed, and traffic volume, respectively.
5. Discussion
This study aimed to interpret the relationship between vessel traffic and accidents. We have presented three regression models that consider speed, heading variance, and traffic volume. The historical accident data and real AIS data of vessel traffic were analyzed, and the model was shown to fit the data well. Thus, the RCORH is an effective indicator for use in the development of relationship models. Set pair analysis was applied to map the consequences of each accident into a determined value, and this value was generally consistent with the change in accident severity, proving that the model was effective. Combining the RCORH with the vessel traffic visualization, high RCORH value location was identified in grid 15, which was consistent with the characteristics of dangerous areas as judged by experts. As far as the multiple linear regression model was concerned, after normalization of the traffic parameters, the fit result was good with R2 = 0.59. The model showed that heading variance was the dominant impact factor on the RCORH.
Our findings might be slightly different from the results of previous related studies. Our three regression models showed positive proof that the increase in vessel traffic also increases the collision accidents. Moreover, the causes of accidents were very complicated. Whilst the occurrence of accidents is very rare, there are probably deviations across the different water areas of the world. In this paper, real data on accidents and traffic flow was collected from the administration. The pilot study was also based on the experience and knowledge of experts in vessel traffic management. They believed there is a strong link between vessel traffic and accidents. It is self-evident that ship collisions definitely originated from encounters and conflicts. Along with the rapid growth in vessel traffic, traffic density has also been increasing in the waters of the port. At the same time, this growth will bring more complexity in vessel traffic, where traffic conflict can be considered as an important indicator of traffic complexity. However, in the case of grounding, the situation might be a little different. Grounding results from mistakes in ship position control, and the mistake maybe caused by unfamiliarity with the layout of the channel, bad positioning, etc. On the contrary, vessel traffic has a weak link with grounding accidents.
Unfortunately, limited by the small number of accidents and the lack of data for most of the grids, it was impossible to study all the grids using the regression analysis. Furthermore, there was no historical AIS data corresponding to the periods when the accidents occurred, that is, from 2007 to 2017. Using the assumption that the general distribution of traffic is similar over time, the vessel traffic data from 2018 was applied in the modelling, which may deviate from reality. Therefore, the relationship between the parameters and traffic requires further study.
6. Conclusions
In some busy waterways and ports, vessel traffic increases significantly and the complexity of this vessel traffic may increase the occurrence of accidents. Since there has been limited research on the actual dependency between ship traffic and collision accidents, this paper presented a pilot study on the relational models between vessel traffic and accident occurrence using AIS data and 10-year accident data.
In summary,
- (1)
Our three regression models showed positive proof that the increase in vessel traffic will increase the collision accidents. These results coincided with the previous knowledge and experience of experts in vessel traffic management.
- (2)
Specific vessel traffic parameters, such as speed, heading variance, and traffic volume can be selected to interpret the parameters’ relations with collision accidents.
- (3)
To properly quantify the consequences of an accident, the set pair analysis was applied to map the consequences of each accident into a determined value, defined as the hazardous degree of an accident viewed from the aspects of hull loss, fatalities, and direct economic losses. Calculating and summing up the relative hazardous degrees of each accident that occurred in a certain area, the relative consequence of regional hazard (RCORH) values could be determined. The RCORH is an effective indicator for the development of relational models.
- (4)
Vessel traffic data was overlaid with the RCORH on the ArcGIS. The visualization combined with the above regression models was implemented by the Shenzhen MSA, where the pilot study proved to be useful and benefitted Shenzhen vessel traffic management and traffic engineering design.
In the near future, more studies should be conducted, for example, to continue the grid approach, to link the big data of vessel traffic, environmental contributors, and human factors, as well as to establish a more integrated and accurate relation model.
Author Contributions
The authors confirm contribution to the paper as follows: Conceptualization: M.L., J.M. and R.L.; Methodology: M.L., J.M.; Data Collection and Curation: M.L., Z.D. and J.M.; Formal Analysis: M.L., P.C.; Software, Validation and Visualization: M.L., Y.H.; Original Draft Preparation: M.L., P.C., Y.H., and J.M.; Review and Editing: M.L. and J.M.
Funding
This research was funded by National Natural Fund of China, grant number 51579201.
Acknowledgments
The work presented in this paper was financially supported by the National Natural Fund of China (grant number: 51579201), an independent innovation fund for graduate students of the Wuhan University of Technology (grant number: 195212002).
Conflicts of Interest
The authors have no conflict of interest.
References
- UNCTAD. Review of Maritime Transport 2018. Available online: https://www.polity.org.za/article/review-of-maritime-transport-2018-2018-10-04 (accessed on 9 March 2019).
- Mou, J.; Tak, C.; Ligteringen, H. Study on collision avoidance in busy waterways by using AIS data. Ocean Eng. 2010, 37, 483–490. [Google Scholar] [CrossRef]
- Chen, P.; Mou, J.; van Gelder, P.H. Risk assessment methods for ship collision in estuarine waters using ais and historical accident data. In Proceedings of the 17th International Congress of the International Maritime Association of the Mediterranean, IMAM 2017, Lisbon, Portugal, 9–11 October 2017. [Google Scholar]
- Mou, J.M.; Ligteringen, H.; Gan, L.X.; Xu, H.X.; Li, W.H. Safety index designed for vessel traffic:a case study of the western ports and waterways in Shenzhen. In Proceedings of the 12th International Congress of the International Maritime Association of the Mediterranean, IMAM 2007, Varna, Bulgaria, 2–6 September 2007; pp. 1087–1094. [Google Scholar]
- Fotland, H. The International Maritime Human Element Bulletin; Nautical Institute: London, UK, 2004. [Google Scholar]
- Hetherington, C.; Flin, R.; Mearns, K. Safety in ship ping: The human element. J. Saf. Res. 2016, 37, 401–411. [Google Scholar] [CrossRef] [PubMed]
- Corovic, B.; Djurovic, P. Research of marine accidents through the prism of human factors. Promet Traffic Transp. 2013, 25, 369–377. [Google Scholar]
- Chen, P.F.; Mou, J.M.; Li, Y.; Yip, T.L.; Yue, X. Mining of Accident Data for Vessels Collided in Estuary. In Proceedings of the 3rd International Workshop on Next Generation of Nautical Traffic Model, IWNTM 2014, Wuhan, China, 15–17 October 2014. [Google Scholar]
- Chauvin, C.; Lardjane, S.; Morel, G.; Clostermann, J.P.; Langard, B. Human and organisational factors in maritime accidents: Analysis of collisions at sea using the HFACS. Accid. Anal. Prev. 2013, 59, 26–37. [Google Scholar] [CrossRef] [PubMed]
- Chen, P.; Huang, Y.; Mou, J.; van Gelder, P.H. Probabilistic Risk Analysis for Ship-Ship Collision: State-of-the-Art. Saf. Sci. 2019, 117, 108–122. [Google Scholar] [CrossRef]
- Rezaee, S.; Pelot, R.; Ghasemi, A. The effect of extreme weather conditions on commercial fishing activities and vessel incidents in Atlantic Canada. Ocean Coast. Manag. 2016, 130, 115–127. [Google Scholar] [CrossRef]
- Yin, F.; Mou, J.; Wen, Y.; Wang, B.; Li, W.; Zhang, H. Analyzing environmental contributors to vessel traffic accident based on Bayesian theorem. In Proceedings of the 2010 International Offshore and Polar Engineering Conference, Beijing, China, 20–25 June 2010; pp. 56–58. [Google Scholar]
- Fujii, Y.; Shiobara, R. The Analysis of Traffic Accidents. J. Navig. 1971, 24, 534–543. [Google Scholar] [CrossRef]
- Pedersen, P.T. Collision and grounding mechanics. Proc. WEMT 1995, 95, 125–157. [Google Scholar]
- Hänninen, M.; Kujala, P. The effects of causation probability on the ship collision statistics in the Gulf of Finland. In Marine Navigation and Safety of Sea Transportation; Taylor and Francis: London, UK, 2009; pp. 267–272. [Google Scholar]
- Martins, M.R.; Maturana, M.C. Application of Bayesian Belief networks to the human reliability analysis of an oil tanker operation focusing on collision accidents. Reliab. Eng. Syst. Saf. 2013, 110, 89–109. [Google Scholar] [CrossRef]
- Uğurlu, Ö.; Köse, E.; Yıldırım, U.; Yüksekyıldız, E. Marine accident analysis for collision and grounding in oil tanker using FTA method. Marit. Policy Manag. 2013, 42, 163–185. [Google Scholar] [CrossRef]
- Montewka, J.; Ehlers, S.; Goerlandt, F.; Hinz, T.; Tabri, K.; Kujala, P. A framework for risk assessment for maritime transportation systems—A case study for open sea collisions involving RoPax vessels. Reliab. Eng. Syst. Saf. 2014, 124, 142–157. [Google Scholar] [CrossRef]
- LI, S. Petri net based vessel collision accident causation analysis. J. Dalian Marit. Univ. 2010, 36, 5–7. [Google Scholar]
- Wen, Y.; Huang, Y.; Zhou, C.; Yang, J.; Xiao, C.; Wu, X. Modelling of marine traffic flow complexity. Ocean Eng. 2015, 104, 500–510. [Google Scholar] [CrossRef]
- Mazaheri, A.; Montewka, J.; Kotilainen, P.; Sormunen, O.V.E.; Kujala, P. Assessing grounding frequency using ship traffic and waterway complexity. J. Navig. 2014, 68, 89–106. [Google Scholar] [CrossRef]
- Park, J.W.; Jeong, J.S.; Park, G.K. An effect of traffic speed on maritime accidents. In Soft Computing in Intelligent Control; Springer International Publishing: Cham, Switzerland, 2014; pp. 29–43. [Google Scholar]
- Ministry of Transport of the People’s Republic of China. Rules for Maritime Accident Investigation and Handling; State Council of the People’s Republic of China: Peking, China, 1990.
- Ministry of Transport of the People’s Republic of China. Statistics on Water Traffic Accidents; State Council of the People’s Republic of China: Peking, China, 2015; pp. 44–47.
© 2019 by the authors. Licensee MDPI, Basel, Switzerland. This article is an open access article distributed under the terms and conditions of the Creative Commons Attribution (CC BY) license (http://creativecommons.org/licenses/by/4.0/).

 ,
, 


