
Pulsed Detonation Hydroramjet: Design Optimization
by
 , ,
, ,
Sergey M. Frolov
1,2,3,* ,
,
Konstantin A. Avdeev
1,
Viktor S. Aksenov
1,2,
Fedor S. Frolov
1,3,
Ilias A. Sadykov
1 and
Igor O. Shamshin
1,2,3 1
Department of Combustion and Explosion, Semenov Federal Research Center for Chemical Physics of the Russian Academy of Sciences, 119991 Moscow, Russia
2
Institute of Laser and Plasma Technologies, National Research Nuclear University “Moscow Engineering Physics Institute”, 115409 Moscow, Russia
3
Department of Computational Mathematics, Federal State Institution “Scientific Research Institute for System Analysis of the Russian Academy of Sciences”, 117218 Moscow, Russia
*
Author to whom correspondence should be addressed.
J. Mar. Sci. Eng. 2022, 10(9), 1171; https://doi.org/10.3390/jmse10091171
Submission received: 4 August 2022
/
Revised: 18 August 2022
/
Accepted: 20 August 2022
/
Published: 23 August 2022
(This article belongs to the Special Issue Advances in Marine Propulsion)
Abstract
:A new type of marine transportation engine, the pulsed detonation hydroramjet (PDH), which was first designed, manufactured, and tested by the present authors, has been further investigated in terms of the potential improvement of its propulsive performance. PDH is composed of a pulsed detonation tube (DT) inserted in the flow-through water guide. Thrust is developed by shock-induced pulsed water jets which are periodically emitted from the water guide nozzle. The measured values of the time-averaged thrust and specific impulse in the first operation cycle were shown to always be considerably higher than those in subsequent cycles, indicating the possibility of improving the overall thrust performance. The present manuscript is aimed at clarifying the reasons for, and eliminating, cycle-to-cycle variability during PDH operation, as well as optimization of the PDH design. An experimental model of the PDH with an optically transparent water guide was designed and manufactured. The cycle-to-cycle variability was found to be caused by the overexpansion of gaseous detonation products in the DT due to the inertia of water column in the water guide. Gas overexpansion caused the reverse flow of the gas–water mixture which filled the water guide and penetrated the DT, thus exerting a strong effect on PDH operation. To eliminate the cycle-to-cycle variability, a new PDH model was developed, manufactured, and tested. The model was equipped with a passive flap valve and active rotary valve and operated on the stochiometric propane–oxygen mixture. Its test firing showed that use of the valves made it possible to eliminate the cycle-to-cycle variability and nearly double the time-averaged thrust and specific impulse reaching 40 N and 550 s, respectively.
1. Introduction
Detonation-based propulsion is a topic of growing research and development interest worldwide, mainly due to the higher theoretical efficiency of the Zel’dovich thermodynamic cycle with propagating detonation compared to the conventional cycle with constant-pressure combustion [1,2]. Pressure gain, high kinetic energy of detonation products, and high reaction completeness caused by shock-induced volumetric ignition are other advantages inherent in the propagating detonation, which makes it attractive for advanced aerospace jet propulsion systems based on pulsed detonation engines [3,4,5] and/or rotating detonation engines [6,7,8]. The fundamental mechanisms of detonation wave propagation in tubes and in semiconfined space were studied for gaseous [9,10,11] and two-phase [12,13,14] explosive mixtures. This work deals with the utilization of the Zel’dovich cycle for underwater propulsion.
In [15,16,17,18,19,20,21,22,23], a new type of underwater propulsion engine was designed, manufactured, and tested, i.e., the pulse-detonation hydroramjet (PDH). The PDH is a detonation tube (DT) inserted into a submerged water guide (Figure 1). The DT is designed for cyclic generation of a detonation wave that enters the water guide in the form of a shock wave. The detonation wave is generated by filling the DT with a gaseous (e.g., propane–oxygen) or two-phase (e.g., gasoline–oxygen) explosive mixture, igniting the mixture with a spark plug, and the subsequent deflagration-to-detonation transition. Thrust in the PDH is created by pulsed jets of a compressible aqueous medium (bubbly water), which is a mechanical mixture of water and gaseous detonation products of each previous cycle, outflowing through the nozzle under the action of a travelling shock wave and expanding detonation products. Numerical simulation and experiments [20,21,22,23] showed that the optimal gas content in the medium flowing through the water guide was 20–25%vol. With such a gas content, the maximum increase in the momentum of the outflowing jets was achieved, and the absolute velocity of the aqueous medium increased by 25–30 m/s compared to the velocity of the approaching water flow ahead of the water intake. Numerical simulations [23] also showed that the PDH could produce the time-averaged thrust with a specific impulse (the ratio of the time-averaged thrust to the weight flow rate of explosive mixture) at a level of 600 to 2400 s.
Various valveless and valved PDH models were tested at a laboratory test rig. Thus, in test fires of the PDH with a 2-dm3-volume DT performed in [18,19,22,23] at an approaching water flow velocity of up to 10 m/s the specific impulse of valveless and valved PDH models was 350–400 s without regard for the first operation cycle. The measured values of the time-averaged thrust and specific impulse in the first operation cycle were always significantly higher than in the subsequent cycles. During test fires, the time-averaged thrust in the first cycle reached 300–480 N, and the specific impulse was 960–2690 s. This fact indicated the possibility for the essential improvement of the PDH thrust performance. It was found in [22,23] that the amplitude and duration of pressure pulses in the DT in the first and subsequent cycles of PDH operation differed significantly (up to a factor of 2). In addition, in each cycle (except for the first one), a parasitic rarefaction phase was detected in the water guide with a duration of up to 10–15 ms, which affected the measured PDH thrust. The reasons of the cycle-to-cycle variability during PDH operation have not been identified at this stage.
There are many publications in the literature which closely bear on the processes inherent in PDH operation, including shock wave propagation in bubbly media, submerged gas jet penetration and bubble formation, shock wave coalescence, reflection from the water free surface and rigid walls, bubble growth, deformation, and pulsation, etc. Ando et al. [24] numerically investigated the effect of bubble polydispersity on shock wave propagation in a bubbly liquid. The averaged shock structure in one-dimensional calculations was shown to become less oscillatory and tending to monotonic when the bubble size distribution broadened. Jourdan et al. [25] conducted a series of shock tube experiments on shock wave propagation through the columns of aqueous foam, focusing on the shock mitigation capability of the foam. The mitigation effect was shown to be more pronounced for shock waves having a blast-shaped profile due to attached rarefaction waves. Borisov et al. [26] reviewed the results of theoretical and experimental studies on shock wave propagation in liquids with gas bubbles. They considered such issues as shock wave propagation velocity and pressure, shock wave reflection from submerged rigid walls, and shock wave attenuation in bubbly liquids. Zhang et al. [27] used high-speed photography and image post-processing to register time-resolved structural changes in a submerged gaseous jet emanating from a Laval nozzle. Wang et al. [28] reported the results of numerical simulation and experimental study on gas jetting by an underwater DT and discussed the mechanism of shock wave propagation and bubble deformation. Wang et al. [29] investigated both computationally and experimentally the effect of the nozzle attached to a DT on the underwater shock wave and gas detonation bubble. Three types of nozzles (converging, straight, and diverging) were examined. The converging nozzle was shown to enhance water–gas mixing and increase the peak pressure of the shock wave compared with the straight nozzle, as well as to substantially inhibit the bubble pulsation process. On the contrary, the diverging nozzle was shown to suppress water–gas mixing, increase the gas jet velocity, and enhance the bubble pulsation process. Hou et al. [30] computationally studied the interaction of shock waves generated by two underwater DTs. The dynamics of detonation gas bubbles and spectral characteristics of pressure field were analyzed and the formation of a high-pressure zone in the region between the DTs was revealed. Avdeev et al. [31] studied experimentally the superposition of shock waves in a high-frequency (7 kHz) wave package propagating in bubbly water and shock-to-water momentum transfer. The wave package was generated by the time-delayed detonation of the stoichiometric propane–oxygen mixture in three DTs submerged in bubbly water. The use of high-frequency shock-wave pulses in a PDH was shown to be pointless because of the arising superposition of pulses worsening the shock-to-water momentum transfer. High-speed photography, digital particle image velocimetry, underwater pressure field measurements, and CFD calculations were used by Liu et al. [32,33] to study the two-phase flow nearby the open end of the DT submerged in water. Stoichiometric explosive mixtures of three gaseous fuels (methane, hydrogen, and acetylene) with oxygen were detonated in the DT in a single-shot mode under the same fill conditions. The oscillation frequencies and directional growth of the detonation gas bubble were investigated. The dynamic behavior of the bubble in the first oscillation was found to be very similar to that of a conventional underwater explosion. Nguyen et al. [34] computationally studied the local dynamics of bubbles generated by free-field underwater explosions with different charge weights. The flow field evolution was analyzed and the effects of buoyancy were investigated. Phan et al. [35,36] simulated computationally the dynamics of spherical and nonspherical bubbles generated by underwater explosion and showed the predicted bubble motion was consistent with experimental observations. Zhang et al. [37] experimentally and computationally studied the dynamic behavior of a bubble of a real underwater explosion with regard for the charge shape and its finite-time detonation. Liu et al. [38,39] computationally studied interactions between two bubbles generated by underwater explosions in a free field and analyzed the characteristics of primary shock waves and bubble pulsations. Wu et al. [40,41] and Yu et al. [42] computationally studied the cavitation phenomena caused by reflection of the shock wave generated by underwater explosion from the water free surface and showed that the cavitated zone could exert a significant effect on floated marine structures. Phan et al. [43] computationally investigated the dynamic nonlinear interaction of two spark-generated bubbles and the water free surface. Dynamic physical mechanisms of bubble coalescence, development of an annular residual, and bubble splitting, were shown to be well reproduced. Klaseboer et al. [44] presented the results of experiments and calculations on interactions between an underwater explosion bubble and a nearby submerged structure in various geometrical arrangements. Nguyen [45] investigated computationally the behavior of a bubble close to vertical and horizontal rigid walls. Li et al. [46] both computationally and experimentally studied the bubble dynamics near two mutually perpendicular semi-infinite rigid walls.
The objective of this work was to improve the PDH thrust performance by clarifying and eliminating the causes of the cycle-to-cycle variability found in [22,23]. This objective, as well as the approach used for problem solution and the obtained results, are the novel and distinctive features of the present work.
2. Materials and Methods
2.1. Test Rig
Figure 2 shows the schematic of the test rig with a system for creating a free submerged water jet in the water pool 1.26 × 1.05 × 2.54 m in size [23]. To measure the PDH thrust, a load-measuring frame consisting of a fixed base and suspension was used. A load cell was attached to the fixed base connected to the power beam. A PDH model was attached to the suspension that transferred force to the load cell. The suspension was attracted to the fixed base by springs preloading the load cell. Such preloading allowed the longitudinal axial load to be detected in both directions. When the PDH model was placed in the water jet without feeding the explosive mixture to the DT, load cell records were taken as zero, and when the PDH model was operating, the load cell measured thrust with an error of about 1 N. The system for creating a free submerged water jet in the pool included a motor pump with a power of 6.7 kW and a flow rate of 1800 L/min, as well as delivery and discharge water ducts with diameters of 110 mm introduced into the pool through glands ensuring tightness and axial mobility. The delivery duct was equipped with a tapered conical nozzle. Water was discharged from the water pool into the motor pump through the discharge duct and delivered back to the pool in the form of a submerged jet through the delivery duct. The intake of the PDH model was located along the jet axis. The outlet diameter of the conical nozzle of the delivery duct (49 mm) was the same as the inlet diameter of the PDH model intake, so that most water flow passed through the intake, and only a small part of water flow went around the model from the outside. Thus, the tests were conducted under conditions when the external hydrodynamic resistance could be neglected. Figure 3 shows the photograph of the test rig with the PDH model installed.
2.2. Baseline PDH Model
To find out the reasons for the cycle-to-cycle variability during PDH operation, we developed a new PDH model with the vertically located DT and the coaxial water guide (Figure 4). The DT with a volume of 1 dm3 consisted of an injector head with gas fittings and a fuel injector, a flame acceleration section with a Shchelkin spiral, a smooth section and a conical transition section. In the experiments, the stoichiometric mixture of Nefras C2-80/120 gasoline (Octane number 80) with oxygen was used. Fuel and oxygen were fed to the DT separately. The fuel was injected into the DT by an automotive injector. The fuel was supplied from the fuel tank by nitrogen-assisted displacement. The overpressure of nitrogen gas in the tank was kept constant at a level of 0.2 MPa. Oxygen was fed to the DT through two channels 3 mm in diameter equipped with check valves. Oxygen was supplied to the valves from the oxygen reducer under an overpressure of 0.7 MPa. To prevent premature ignition of a fresh portion of explosive mixture in the DT, a purge gas (nitrogen) was shortly supplied before the explosive mixture was injected into the DT. Nitrogen was fed under an overpressure of 0.45 MPa through one of the oxygen channels. The ignition system consisted of an automotive electronic ignition module and two automobile spark plugs. The ignition energy did not exceed 0.2 J. The control unit based on the AtMega-328p microcontroller allowed setting the time intervals for the supply of fuel, oxygen, and purge gas, triggering the ignition pulses and generating control signals in the pulsed operation mode. The data acquisition system included three ionization probes (IPs) and an analog-to-digital converter connected to a personal computer. Registration of combustion and detonation processes by IPs was tested by the authors earlier and showed high efficiency [47]. To ensure the fast deflagration-to-detonation transition and the formation of a detonation wave, turbulizing obstacles were installed in the DT in the form of the Shchelkin spiral [10]. The experiments were conducted at two operation frequencies: 3 and 5 Hz. The water guide was made of a plexiglass tube with an internal diameter of 80 mm and a length of 500 mm. In test fires, the water guide was vertically immersed in water to a depth of 400 mm.
The operation cycle of the PDH model included the following stages:
- -
- purging the DT with nitrogen gas;
- -
- filling the DT with the explosive mixture;
- -
- spark ignition of the explosive mixture followed by deflagration-to-detonation transition and combustion of the mixture in the propagating detonation wave; and
- -
- momentum transfer from the propagating shock wave and expanding detonation products to bubbly water in the water guide, and outflow of bubbly water from the water guide.
The time of purging the DT with nitrogen and filling the DT with the explosive mixture did not change during the experiments. The frequency of the operation process was controlled by a time interval between ignition triggering and purging the DT with nitrogen. In most experiments, the supply time of fuel and oxygen was chosen so that the DT was filled with the explosive mixture only by about two thirds of the entire volume (to prevent the destruction of the transparent water guide and to generate a shock wave with an amplitude less than 0.5 MPa at the DT exit).
In test fires, the pressure at the DT exit was recorded using an absolute pressure sensor Kurant-DA (see Figure 4) possessing a measurement error of 8 kPa. The propagation velocity of the reaction front in the DT was measured by IPs at two measuring segments each 80 mm long with an accuracy of 5%. In addition, with the help of a CASIO EX-1 video camera (shooting speed 300 fps) and a Phantom Miro LC310 high-speed video camera (shooting speed 5000 fps), processes in the transparent water guide were video recorded through a round window in the side pool wall of the laboratory test rig.
The procedure of a test fire was as follows. First, the PDH model was fixed on the thrust-measuring frame and lowered into the pool. Then the data acquisition system and high-speed video recording were triggered. Next, a cyclogram of PDH model operation was launched and 5 to 7 operation cycles were performed. As the objective was to clarify the causes of the cycle-to-cycle variability and to eliminate this phenomenon, the present study implied the step-by-step optimization of the PDH model design and the improvement of the PDH thrust performance. Therefore, in addition to the baseline PDH model, several more PDH models operating either on liquid gasoline or gaseous propane were developed, manufactured, and tested.
3. Results and Discussion
3.1. Cycle-to-Cycle Variability
Figure 5 shows the primary records of three IPs (IP#1, IP#2, and IP#3, see Figure 4) in the DT of the baseline PDH model in one operation cycle at a frequency of 5 Hz. In this test fire, the DT was filled completely with the explosive mixture and the water guide was removed. The corresponding propagation velocities of the detonation wave at two available measuring segments were 2200 ± 110 and 2000 ± 100 m/s. These velocities were close to the thermodynamic Chapman–Jouguet detonation velocity of ~2330 m/s. The decrease in the wave velocity toward the end of the DT is most probably explained by the partial dilution of the explosive mixture with the purging nitrogen gas. As seen, IP#1 registered a developed detonation, thus implying that the onset of detonation occurred in the DT upstream of IP#1, i.e., the partial fill of the DT by the two thirds of the entire volume ensured the detonation onset.
Figure 6 shows the flow structure in the water guide of the baseline PDH model in two successive cycles. In this test fire, the DT was filled by the two thirds of the entire volume with the explosive mixture and the water guide was attached to the DT. The frame in Figure 6a corresponds to the time instant when the shock wave of the first cycle reached the unperturbed water free surface in the water guide. The frame in Figure 6b corresponds to the time instant when the downward displacement of the water free surface was maximal, whereas the water free surface itself was strongly perturbed. The frame in Figure 6c corresponds to the time instant when the reverse flow of bubbly water was developed in the water guide, and bubbly water filled not only the water guide, but also penetrated the DT. Finally, the frame in Figure 6d shows the flow structure in the water guide after the shock wave of the second cycle passed through the aqueous medium.
Figure 7 compares the pressure records at the DT exit in the first (Figure 7a) and third (Figure 7b) operation cycles. Water penetration into the DT caused by the reverse flow in the PDH water guide, observed in Figure 6c,d is seen to exert a strong effect on the measured pressure in the DT and, consequently, on the PDH thrust. This effect was obviously caused by a pronounced rarefaction phase in the pressure record of the first cycle (see Figure 7a). As for the third cycle, the rarefaction phase in the corresponding pressure record was considerably less pronounced (see Figure 7b). The appearance of the rarefaction phase was apparently associated with gas overexpansion due to the inertia of water column and with gas cooling at the strongly perturbed water–gas interface.
For illustration, Table 1 shows quantitative data on the decrease in pressure pulse amplitude (P) and specific impulse (Isp) in three successive cycles of the baseline PDH model in three different test fires performed at same conditions. The specific impulse was determined by the formula:
where t is time; P(t) is the measured pressure at the DT exit; is the mass flow rate of the explosive mixture; g is the acceleration of gravity; S is the cross-sectional area of the water guide; indices 1 and 2 correspond to the beginning and end of the operation cycle; and F(t) is the PDH thrust. Both definitions of the specific impulse in Equation (1) were proved to provide close values for [48]. The estimated error of the specific impulse determination by this formula was less than 10%. The pressure amplitude and specific impulse for the first cycle were reproduced quite well (within about 3% and 10%, respectively) from test to test. In the second and third cycles, the pressure pulse amplitudes were reproduced within about 5% and 10%, respectively, whereas the specific impulses were reproduced within about 40% and 20%, respectively, from test to test. Such cycle-to-cycle and test-to-test variability indicates that the hydrodynamic conditions of the explosive mixture in the DT and the aqueous medium in the water guide prior to ignition were not identical and there is a need in special measures to ensure the conditions identity.
3.2. PDH Model with Passive Flap Valve
To eliminate the cycle-to-cycle variability during PDH operation, it was first decided to avoid water penetration from the water guide into the DT by making a provision for a passive flap valve (FV). For this purpose, a new PDH model with the passive FV was created (Figure 8a). This model was composed of a vertical DT connected to a horizontal flow-through water guide equipped with a water intake and a nozzle.
The DT was a smooth-walled cylindrical tube with an inner diameter of 49 mm and length of 400 mm (0.5 dm3 in total volume). One end of the DT was equipped with an injector head. Another end was equipped with a passive FV. To facilitate deflagration-to-detonation transition in the DT, a Shchelkin spiral 400 mm long with a pitch of 25 mm made of an 8-mm steel rod was inserted in it close to the injector head.
The water guide was a 200-mm long duct of rectangular cross section 60 mm wide and 30 mm high with transparent 8-mm thick side walls made of plexiglass for high-speed video recording of dynamic processes during PDH operation. The passive FV made of stainless-steel sheet 1 mm thick was installed in such a way that it might prevent the penetration of the reverse water flow into the DT due to the pressure difference in the water intake and DT. The FV could be easily removed, so test fires could be performed either without or with the valve.
Comparative test fires of the PDH model without and with FV were conducted at the laboratory test rig of Figure 3. The photograph of the PDH model installed at the test rig is shown in Figure 8b. The speed of the approaching water flow was 5 m/s. The PDH operation frequency was 10 Hz. The pressures in the fuel (propane), oxygen, and purge gas (nitrogen) supply receivers were 0.27, 0.5, and 0.7 MPa, respectively. The fill time of the DT with explosive mixture was varied from 40 to 60 ms and the purging time of the DT with nitrogen was 40 ms.
Figure 9 shows two characteristic video frames of the flow structure in the PDH without FV. The water guide was shortened by removing the nozzle section. Figure 9a corresponds to the time instant when a shock wave emanates from the PDH. Despite high-velocity detonation products mainly propagated from right to left, some part of the products was seen to penetrate the water intake. Figure 9b corresponds to the time instant when reverse flow formed in the PDH water guide. As seen, on the one hand, bubbly water moved back from the water guide into the DT and, on the other hand, pure water turned from the water intake into the DT.
Figure 10 shows the video frames of the flow structure in the PDH with FV. Figure 10a corresponds to the stage when the DT was purged with nitrogen and filled with the explosive mixture. Figure 10b corresponds to the time instant when a shock wave just passed the FV and the valve was moving down to its lower position to close water flow through the intake. Due to the inertia of the valve, some part of detonation products penetrated the water intake (Figure 10c). Figure 10d corresponds to the time instant when the FV was in its lower position and water flow through the water intake was closed. Figure 10e corresponds to the time instant when the FV was in its upper position to close the DT and allow water flow from the intake to the water guide.
The installation of the passive FV reduced water penetration into the DT and, as a result, improved the PDH thrust performance. Table 2 shows the measured values of the time-averaged thrust and the specific impulse for the PDH without and with FV at three different values of the DT fill volume with the explosive mixture, Vm. The time-averaged thrust and specific impulse for the PDH without FV were 17–19 N and 270–340 s, respectively, while for the PDH with FV the corresponding values increased to 20–23 N and 340–440 s, respectively, i.e., by 15–30%. In addition, the operation stability was improved. These features are well illustrated by Figure 11 for test fire #2 in Table 2.
It should be noted that, in addition to water penetration into the DT, other factors reducing the PDH thrust were water flow deceleration in the water guide caused by rarefaction in the DT and the loss of shock-wave momentum when the shock wave interacted with the FV. In addition, due to the inertia of the response, the FV partially prevented the free exit of the shock wave into the water guide, thereby dissipating a part of its kinetic energy and limiting the benefits of the shock-induced motion of bubbly water. Thus, the installation of the FV made it possible to improve the PDH thrust performance due to the partial reduction of the negative effect of the rarefaction phase in the DT. However, with such an approach it was not possible to solve the problems of the loss of shock-wave momentum due to interaction with the FV and of reverse flow formation in the water guide.
3.3. PDH Model with Passive Flap Valve and Active Rotary Valve
To further improve the cycle-to-cycle stability, it was decided to undertake supplementary measures to reduce the loss of shock-wave momentum due to interaction with the FV and to weaken the rarefaction phase both in the first and subsequent PDH operation cycles. For this purpose, the PDH model with passive FV was modified by displacing the FV into the water intake and incorporating an additional active rotary valve (RV) (Figure 12). Mounting of the FV in the water intake eliminated penetration of detonation products into the water guide and the loss of shock wave momentum due to interaction with the FV. Moreover, when being closed, the FV played the role of an additional thrust wall.
The RV was mainly intended for organizing the natural supply of atmospheric air to the DT when the pressure in the DT decreased below the atmospheric value, as well as for blowing the DT with atmospheric air by the end of bubbly water displacement from the water guide.
The RV consisted of two coaxial tubes. The inner tube was stationary, while the outer tube was rotated by a belt drive (gear ratio 1:2) from an electric motor with a controlled speed (Figure 13). The gap between the coaxial tubes was 0.2 mm. The length of the inner tube was 200 mm, and the inner and outer diameters were 51 and 55 mm, respectively. The wall of the inner tube had two windows symmetrical with respect to the diametral plane, 50 mm high and 8.4 mm wide (the central angle of the window was 18°). The total area of the purge windows was 8.4 cm2. The outer tube had counter windows with a height of 54 mm and a central opening angle of 120°.
To ensure the synchronization of DT and RV valve operation, the latter was equipped with a position sensor (PS), which triggered spark ignition in the DT. The cycle diagram of the PDH included the following stages (Figure 14a):
- (1)
- purging the DT with nitrogen gas (time interval T1);
- (2)
- filling the DT with the explosive mixture (time interval T2);
- (3)
- spark ignition of the explosive mixture followed by deflagration-to-detonation transition and combustion of the mixture in the propagating detonation wave (time interval T3); and
- (4)
- momentum transfer from the propagating shock wave and expanding detonation products to bubbly water in the water guide, outflow of bubbly water from the water guide (time interval T4).
The half time (T1/2) of RV revolution (Figure 14b) corresponded to one operation cycle of the PDH. PDH operation with the RV was controlled by a control code with feedback created in the Arduino environment. Time intervals T1 and T2 were set in the control unit. Time interval T3 was determined by the dimensions of the PS and the PDH operation frequency and was relatively short (less than 2 ms) and therefore neglected. Time interval T4 for the (i + 1)th revolution was calculated from the value of T1/2 for the previous ith revolution as
The opening of the RV weakened the rarefaction phase in the DT and prevented the formation of the reverse flow of the aqueous medium in the water guide, accompanied by casting of films and drops of water into the DT. The RV could be easily fixed at any position, so test fires could be performed either with deactivated or activated valve.
Test fires of the PDH model with RV were performed on the laboratory test rig of Figure 3 at two operation frequencies (7 and 14 Hz) at an approaching water flow velocity of 5 m/s, and Vm ≈ 0.4 dm3. The pressure in the receivers for supplying fuel (propane), oxygen, and purge gas (nitrogen) was 0.27, 0.5, and 0.7 MPa, respectively. The fill time of the DT with the explosive mixture was 40 ms and the purging time of the DT with nitrogen was 40 and 26 ms for an operation frequency of 7 and 14 Hz, respectively. Figure 15 compares the primary records of PDH thrust and pressure at the DT exit for two modes of PDH operation with a frequency of 14 Hz: with deactivated RV (in the closed position, Figure 15a) and with activated RV (Figure 15b). Firstly, the use of the RV led to more regular PDH operation as cycle-to-cycle variations in thrust and pressure were considerably smaller and the first cycle was better reproduced in each subsequent cycle. Secondly, the duration of the rarefaction phase essentially decreased for the PDH with RV. In addition, an increase in the time-averaged thrust from 8 N with the deactivated RV to 35 N with the activated RV must be noted.
Figure 16 compares video frames of the flow structure in the water guide at PDH operation with deactivated (left column) and activated (right column) RV. When the RV was deactivated, reverse water flow formed in the water guide. However, when the RV was activated, there was no reverse water flow in the water guide.
Figure 17 shows a series of video frames of the flow structure in the PDH at five instants of time corresponding to the beginning of five successive cycles under conditions when the PDH operated at a frequency of 14 Hz with an approaching water flow velocity of 5 m/s. The time instants are shown by vertical lines in the upper diagram presenting the synchronized time histories of PDH thrust and pressure at the DT exit. As seen, the RV avoided reverse water flow in the water guide and provided good reproducibility of hydrodynamic conditions at the beginning of each operation cycle.
3.4. Effect of Ignition Delay on PDH Thrust Performance
The response of the PDH thrust performance to the ignition delay Δtign was also investigated for the PDH model with passive FV and active RV. Here, the ignition delay was the time delay for triggering the spark plug in the DT after the RV reached a preset position. In experiments, Δtign varied from 0 to 30 ms at a PDH operation frequency of 7 Hz and from 0 to 17 ms at a frequency of 14 Hz.
At Δtign = 0, the explosive mixture in the DT was ignited at the moment when the RV started opening. In this case, a detonation wave propagated in the DT while the area of the purge windows of the RV increased, and the cycle active phase (the outflow of the aqueous medium from the water guide) proceeded mainly with fully open purge windows. At the maximum values of Δtign, the explosive mixture was ignited at the moment when the RV was already completely closed, and the cycle active phase could proceed with the RV either fully or partially closed, depending on the valve revolution speed. Thus, the ignition delay determined the duration of the PDH cycle active phase, during which the thrust was produced.
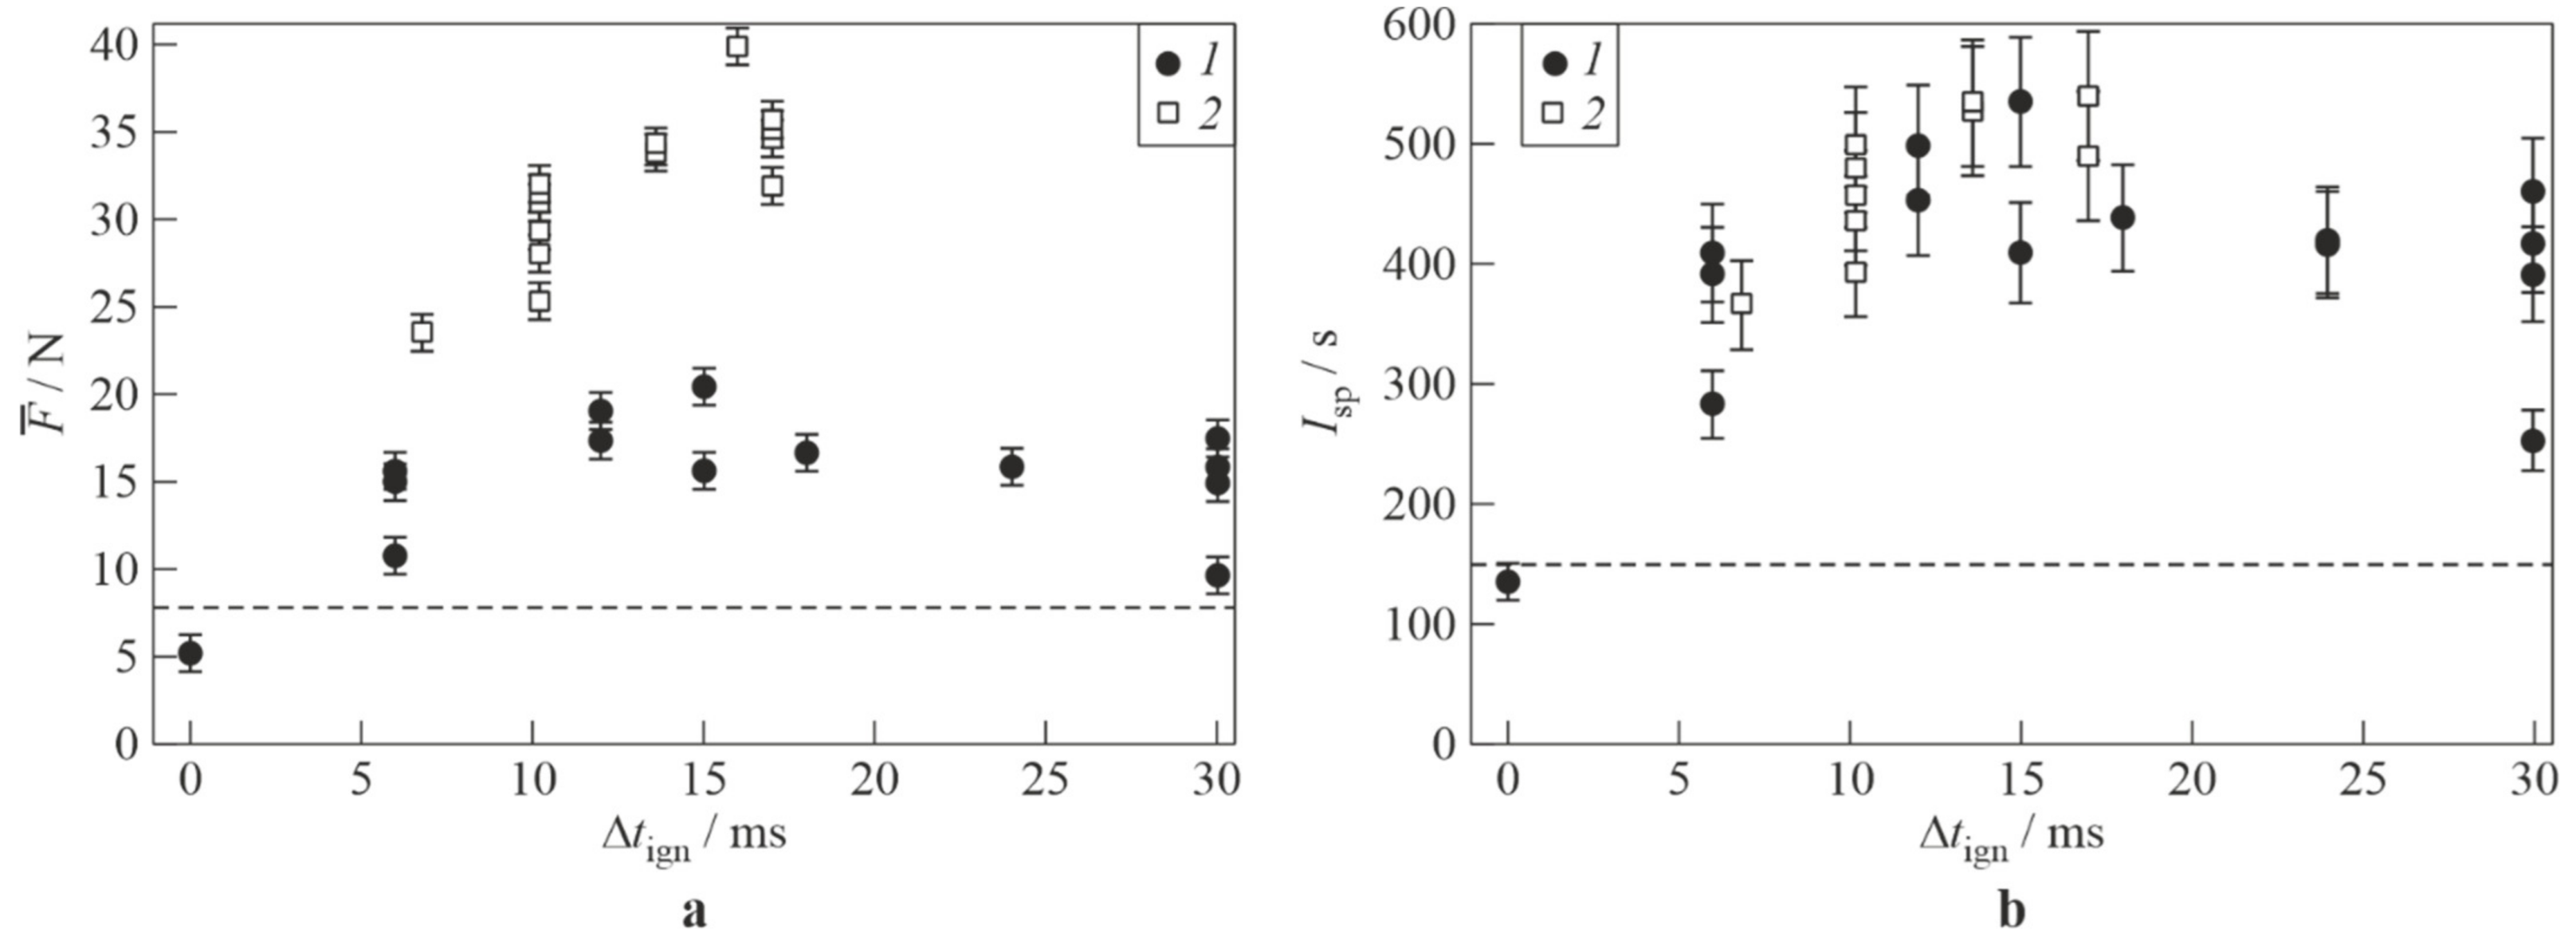
Figure 18 shows the experimental dependences of thrust (Figure 18a) and specific impulse (Figure 18b) on the ignition delay. For both values of operation frequency, there was an optimal ignition delay (14–16 ms), at which the maximum values of thrust (up to 40 N) and specific impulse (up to 550 s) were achieved. A reduction of the ignition delay with respect to the optimal value led to a loss of useful pressure in the DT, since the cycle active phase proceeded with a partially or fully open RV. An increase in the ignition delay with respect to the optimal value reduced the PDH thrust due to the overexpansion of detonation products in the DT with the formation of reverse water flow in the water guide, accompanied by casting of water films and drops into the DT. It is worth noting that with the deactivated (completely closed) RV, the time-averaged thrust and specific impulse of the PDH were 8 N and 150 s, respectively, i.e., they were much less.
4. Conclusions
The pulsed detonation hydroramjet, a new type of marine transportation engine, was investigated in terms of the improvement of its propulsive performance. The reasons for cycle-to-cycle variability during the operation of a pulse-detonation hydroramjet were clarified. It was found that the cycle-to-cycle variability was associated with gas overexpansion in the detonation tube due to the inertia of the water column. Gas overexpansion caused the reverse flow of water-gas mixture in the water guide and penetration of this mixture into the detonation tube, exerting a strong influence on the cyclic operation process. To eliminate the cycle-to-cycle variability, a new PDH model equipped with a passive flap valve and active rotary valve was developed, manufactured, and tested. Test fires of the model showed that, other things being equal (operation frequency 14 Hz, stoichiometric propane–oxygen mixture), the use of the valves made it possible to significantly reduce the cycle-to-cycle variability and nearly double the PDH time-averaged thrust and specific impulse: up to 40 N instead of 17 N and up to 550 s instead of 340 s.
Author Contributions
Conceptualization, S.M.F.; methodology, S.M.F. and V.S.A.; investigation, K.A.A., V.S.A., F.S.F., I.A.S. and I.O.S.; data curation, K.A.A., I.A.S. and I.O.S.; writing—original draft preparation, S.M.F.; writing—review and editing, S.M.F.; visualization, I.A.S. and I.O.S.; supervision, S.M.F.; project administration, S.M.F.; funding acquisition, S.M.F. All authors have read and agreed to the published version of the manuscript.
Funding
This research was funded by the Ministry of Science and Higher Education of Russian Federation under state contract N13.1902.21.0014 (agreement N075-15-2020-806).
Institutional Review Board Statement
Not applicable.
Informed Consent Statement
Not applicable.
Data Availability Statement
Not applicable.
Conflicts of Interest
The authors declare no conflict of interest.
Abbreviations
| CFD | Computational fluid dynamics |
| DT | Detonation tube |
| FV | Flap valve |
| IP | Ionization probe |
| PDH | Pulsed detonation hydroramjet |
| PS | Position sensor |
| R&D | Research and development |
| RV | Rotary valve |
| Nomenclature | |
| Time-averaged thrust of PDH | |
| F(t) | Thrust of PDH |
| Time-averaged thrust of PDH with a passive flap valve | |
| g | Acceleration of gravity |
| Isp | Time-averaged specific impulse of PDH |
| Isp,v | Time-averaged specific impulse of PDH with a passive flap valve |
| Mass flow rate of the explosive mixture | |
| P | Pressure pulse amplitude |
| P(t) | Measured pressure at DT exit |
| S | Cross-sectional area of water guide |
| t | Time |
| toff | Time interval when the RV is closed |
| ton | Time interval when the RV is open |
| T1, T2, T3, T4 | Time intervals in PDH operation cycle |
| T1/2 | half time of RV revolution |
| Vm | Fill volume of the DT with the explosive mixture |
| Δtign | Ignition delay |
References
- Zeldovich, Y.B. To the question of energy use of detonation combustion. J. Propul. Power 2006, 22, 588–592. [Google Scholar] [CrossRef]
- Frolov, S.M.; Aksenov, V.S.; Ivanov, V.S. Experimental proof of Zel’dovich cycle efficiency gain over cycle with constant pressure combustion for hydrogen-oxygen fuel mixture. Int. J. Hydrog. Energy 2015, 40, 6970–6975. [Google Scholar] [CrossRef]
- Bussing, T.R.A.; Pappas, G. An introduction to pulse detonation engines. In Proceedings of the 32nd Aerospace Sciences Meeting and Exhibit, AIAA Paper 94-0263, Reno, NV, USA, 10–13 January 1994. [Google Scholar]
- Kailasanath, K. Recent developments in the research on pulse detonation engines. AIAA J. 2003, 41, 145–159. [Google Scholar] [CrossRef]
- Roy, G.D.; Frolov, S.M.; Borisov, A.A.; Netzer, D.W. Pulse detonation propulsion: Challenges, current status, and future perspective. Prog. Energy Combust. Sci. 2004, 30, 545–672. [Google Scholar] [CrossRef]
- Voitsekhovskii, B.V. Stationary spin detonation. Sov. J. Appl. Mech. Tech. Phys. 1960, 3, 157–164. [Google Scholar]
- Bykovskii, F.A.; Zhdan, S.A.; Vedernikov, E.F. Continuous spin detonations. J. Propul. Power 2006, 22, 1204–1216. [Google Scholar] [CrossRef]
- Lu, F.K.; Braun, E.M. Rotating detonation wave propulsion: Experimental challenges, modeling, and engine concepts. J. Propul. Power 2014, 30, 1125–1142. [Google Scholar] [CrossRef]
- Zel’dovich, Y.B.; Kompaneets, A.S. The Theory of Detonation; Gostekhteorizdat: Moscow, Russia, 1955. [Google Scholar]
- Shchelkin, K.I. Fast Combustion and Spin Detonation of Gases; Voenizdat: Moscow, Russia, 1949. [Google Scholar]
- Lee, J.H. The Detonation Phenomenon; Cambridge University Press: Cambridge, UK, 2008. [Google Scholar]
- Borisov, A.A.; Gelfand, B.E. Review of papers on detonation of two-phase systems. Arch. Thermodyn. Spalania 1976, 7, 273–287. [Google Scholar]
- Benedick, W.B.; Tieszen, S.R.; Knystautas, R.; Lee, J.H.S. Detonation of unconfined large-scale fuel spray–air clouds. In Dynamics of Detonations and Explosions: Detonations; Kuhl, A.L., Leyer, J.-C., Borisov, A.A., Sirignano, W.A., Eds.; 133, Progress in Astronautics and Aeronautics; AIAA: New York, NY, USA, 1991; pp. 297–310. [Google Scholar]
- Kailasanath, K. Liquid-fueled detonations in tubes. J. Propul. Power 2006, 22, 1261–1268. [Google Scholar] [CrossRef]
- Frolov, S.M.; Aksenov, V.S.; Frolov, F.S.; Avdeev, K.A. Pumpjet Pulse Detonation Engine (Variants) and Method for Creating Hydro-Jet. Patent WO/2015/099552, 23 December 2013. Available online: https://patentscope.wipo.int/search/en/detail.jsf?docId=WO2015099552&cid=P10-KLWBNQ-86226-1 (accessed on 4 August 2022).
- Frolov, S.M.; Avdeev, K.A.; Aksenov, V.S.; Frolov, F.S.; Sadykov, I.A.; Shamshin, I.O.; Tukhvatullina, R.R. Direct conversion of fuel chemical energy into the energy of water motion. In Nonequilibrium Processes in Physics and Chemistry; Starik, A.M., Frolov, S.M., Eds.; Torus Press: Moscow, Russia, 2016; Volume 2, pp. 251–262. [Google Scholar]
- Frolov, S.; Avdeev, K.; Aksenov, V.; Frolov, F.; Sadykov, I.; Shamshin, I.; Tukhvatullina, R. Pulse-detonation hydrojet. In Scientific-Practical Conference “Research and Development-2016; Springer: Berlin/Heidelberg, Germany, 2016; p. 709. [Google Scholar]
- Frolov, S.M.; Aksenov, V.S.; Sadykov, I.A.; Avdeev, K.A.; Shamshin, I.O. Testing of experimental models of a hydrojet with pulsed-detonation combustion of liquid fuel. Combust. Explos. 2017, 10, 73–82. [Google Scholar]
- Frolov, S.M.; Aksenov, V.S.; Sadykov, I.A.; Avdeev, K.A.; Shamshin, I.O. Hydrojet engine with pulse detonation combustion of liquid fuel. Dokl. Phys. Chem. 2017, 475, 129–133. [Google Scholar] [CrossRef]
- Frolov, S.M.; Avdeev, K.A.; Aksenov, V.S.; Borisov, A.A.; Frolov, F.S.; Shamshin, I.O.; Tukhvatullina, R.R.; Basara, B.; Edelbauer, W.; Pachler, K. Experimental and computational studies of shock wave-to-bubbly water momentum transfer. Int. J. Multiph. Flow 2017, 92, 20–38. [Google Scholar] [CrossRef]
- Frolov, S.M.; Avdeev, K.A.; Aksenov, V.S.; Frolov, F.S.; Sadykov, I.A.; Shamshin, I.O.; Tukhvatullina, R.R. Pulsed detonation hydroramjet. In Advances in Pulsed and Continuous Detonations; Frolov, S.M., Ed.; Torus Press: Moscow, Russia, 2019; pp. 372–396. [Google Scholar]
- Frolov, S.M.; Aksenov, V.S.; Avdeev, K.A.; Sadykov, I.A.; Shamshin, I.O.; Tukhvatullina, R.R. Pulsed-detonation hydroramjet. In Recent Progress in Detonation for Propulsion; Frolov, S.M., Kasahara, J., Eds.; Torus Press: Moscow, Russia, 2019; pp. 68–70. [Google Scholar]
- Frolov, S.M.; Avdeev, K.A.; Aksenov, V.S.; Frolov, F.S.; Sadykov, I.A.; Shamshin, I.O.; Tukhvatullina, R.R. Pulsed detonation hydroramjet: Simulations and experiments. Shock Waves 2020, 30, 221–234. [Google Scholar] [CrossRef]
- Ando, K.; Colonius, T.; Brennen, C.E. Numerical simulation of shock propagation in a polydisperse bubbly liquid. Int. J. Multiph. Flow 2011, 37, 596–608. [Google Scholar] [CrossRef]
- Jourdan, G.; Mariani, C.; Houas, L.; Chinnayya, A.; Hadjadj, A.; Del Prete, E.; Haas, J.F.; Rambert, N.; Counilh, D.; Faure, S. Analysis of shock-wave propagation in aqueous foams using shock tube experiments. Phys. Fluids 2015, 27, 056101. [Google Scholar] [CrossRef]
- Borisov, A.A.; Gelfand, B.E.; Timofeev, E.I. Shock waves in liquids containing gas bubbles. Int. J. Multiph. Flow 1983, 9, 531–543. [Google Scholar] [CrossRef]
- Zhang, X.; Li, S.; Yu, D.; Yang, B.; Wang, N. The evolution of interfaces for underwater supersonic gas jets. Water 2020, 12, 488. [Google Scholar] [CrossRef]
- Wang, C.; Li, N.; Huang, X.; Liu, W.; Weng, C. Shock wave and bubble pulsation characteristics in a field generated by single underwater detonation. Phys. Fluids 2022, 34, 066108. [Google Scholar] [CrossRef]
- Wang, C.; Li, N.; Huang, X.; Weng, C. Investigation of the effect of nozzle on underwater detonation shock wave and bubble pulsation. Energies 2022, 15, 3194. [Google Scholar] [CrossRef]
- Hou, Z.; Li, N.; Huang, X.; Li, C.; Kang, Y.; Weng, C. Three-dimensional numerical simulation on near-field pressure evolution of dual-tube underwater detonation. Phys. Fluids 2022, 34, 033304. [Google Scholar] [CrossRef]
- Avdeev, K.A.; Aksenov, V.S.; Borisov, A.A.; Frolov, S.M.; Sadykov, I.A.; Frolov, F.S.; Shamshin, I.O. Propagation of high-frequency sequence of shock waves in water with gas bubbles. Combust. Explos. 2016, 9, 83–95. [Google Scholar]
- Liu, W.; Li, N.; Huang, X.; Kang, Y.; Li, C.; Qiang, W.; Weng, C. Experimental study of underwater pulse detonation gas jets: Bubble velocity field and time–frequency characteristics of pressure field. Phys. Fluids 2021, 33, 083324. [Google Scholar] [CrossRef]
- Liu, W.; Li, N.; Weng, C.; Huang, X.; Kang, Y. Bubble dynamics and pressure field characteristics of underwater detonation gas jet generated by a detonation tube. Phys. Fluids 2021, 33, 023302. [Google Scholar] [CrossRef]
- Nguyen, V.; Phan, H.; Duy, T.; Park, W. Numerical modeling for compressible two-phase flows and application to near-field underwater explosions. Comput. Fluids 2021, 215, 104805. [Google Scholar] [CrossRef]
- Phan, T.; Nguyen, V.; Park, W. Numerical study on dynamics of an underwater explosion bubble based on compressible homogeneous mixture model. Comput. Fluids 2019, 191, 104262. [Google Scholar] [CrossRef]
- Phan, H.; Nguyen, V.; Duy, T.; Kim, D.; Park, W. Numerical study on simultaneous thermodynamic and hydrodynamic mechanisms of underwater explosion. Int. J. Heat Mass Transfer 2021, 178, 121581. [Google Scholar] [CrossRef]
- Zhang, A.; Wang, S.; Huang, C.; Wang, B. Influences of initial and boundary conditions on underwater explosion bubble dynamics. Eur. J. Mech. B 2013, 42, 69. [Google Scholar] [CrossRef]
- Liu, N.N.; Zhang, A.M.; Liu, Y.L.; Li, T. Numerical analysis of the interaction of two underwater explosion bubbles using the compressible Eulerian finite-element method. Phys. Fluids 2020, 32, 046107. [Google Scholar]
- Liu, N.N.; Zhang, A.M.; Cui, P.; Wang, S.P.; Li, S. Interaction of two out-of-phase underwater explosion bubbles. Phys. Fluids 2021, 33, 106103. [Google Scholar] [CrossRef]
- Wu, W.; Liu, Y.; Zhang, A.; Liu, N.; Liu, L. Numerical investigation on underwater explosion cavitation characteristics near water wave. Ocean Eng. 2020, 205, 107321. [Google Scholar] [CrossRef]
- Wu, W.; Zhang, A.; Liu, Y.; Liu, M. Interaction between shock wave and a movable sphere with cavitation effects in shallow water. Phys. Fluids 2020, 32, 016103. [Google Scholar]
- Yu, J.; Liu, J.; Wang, H.; Wang, J.; Zhang, L.; Liu, G. Numerical simulation of underwater explosion cavitation characteristics based on phase transition model in compressible multicomponent fluids. Ocean Eng. 2021, 240, 109934. [Google Scholar] [CrossRef]
- Phan, H.; Nguyen, V.; Park, W. Numerical study on strong nonlinear interactions between spark-generated underwater explosion bubbles and a free surface. Int. J. Heat Mass Transfer 2020, 163, 120506. [Google Scholar] [CrossRef]
- Klaseboer, E.; Hung, K.C.; Wang, C.; Khoo, B.C.; Boyce, P.; Debono, S.; Charlier, H. Experimental and numerical investigation of the dynamics of an underwater explosion bubble near a resilient/rigid structure. J. Fluid Mech. 2005, 537, 387–413. [Google Scholar] [CrossRef]
- Nguyen, A. The application of CEL technique to simulate the behavior of an underwater explosion bubble in the vicinity of a rigid wall. Appl. Mech. Mater. 2020, 902, 126. [Google Scholar] [CrossRef]
- Li, S.; Liu, Y.; Wang, Q.; Zhang, A. Dynamics of a buoyant pulsating bubble near two crossed walls. Phys. Fluids 2021, 33, 073310. [Google Scholar] [CrossRef]
- Frolov, S.M.; Aksenov, V.S.; Dubrovskii, A.V.; Zangiev, A.E.; Ivanov, V.S.; Medvedev, S.N.; Shamshin, I.O. Chemiionization and acoustic diagnostics of the process in continuous- and pulse detonation combustors. Dokl. Phys. Chem. 2015, 465, 273. [Google Scholar] [CrossRef]
- Frolov, S.M.; Platonov, S.V.; Avdeev, K.A.; Aksenov, V.S.; Ivanov, V.S.; Zangiev, A.E.; Sadykov, I.A.; Tukhvatullina, R.R.; Frolov, F.S.; Shamshin, I.O. Pulsed combustion of fuel–air mixture in a cavity above water surface: Modeling and experiments. Shock Waves 2022, 32, 1–10. [Google Scholar] [CrossRef]
Figure 1.
Schematic of the pulsed-detonation hydroramjet.

Figure 2.
Schematic of the test rig.

Figure 3.
Photograph of the test rig with the PDH model installed.

Figure 4.
A model of pulsed detonation hydroramjet.

Figure 5.
Primary records of three ionization probes in the DT of the baseline PDH model in one operation cycle.
Figure 5.
Primary records of three ionization probes in the DT of the baseline PDH model in one operation cycle.

Figure 6.
Video frames of the flow structure in the PDH water guide in two successive cycles. The distance between horizontal marks is 100 mm: (a) 0 ms; (b) 67.5 ms; (c) 162.5 ms; (d) 345 ms.
Figure 6.
Video frames of the flow structure in the PDH water guide in two successive cycles. The distance between horizontal marks is 100 mm: (a) 0 ms; (b) 67.5 ms; (c) 162.5 ms; (d) 345 ms.

Figure 7.
Pressure records in the DT in the (a) first and (b) third operation cycles.

Figure 8.
(a) Schematic of the PDH model with a passive flap valve and (b) the photograph of the PDH model installed on the laboratory test rig.
Figure 8.
(a) Schematic of the PDH model with a passive flap valve and (b) the photograph of the PDH model installed on the laboratory test rig.

Figure 9.
Video frames of the flow structure in the PDH without flap valve: (a) shock-induced outflow of bubbly water and (b) back flow into the DT. Bright spots correspond to the backlight lamps. Arrows show flow direction.
Figure 9.
Video frames of the flow structure in the PDH without flap valve: (a) shock-induced outflow of bubbly water and (b) back flow into the DT. Bright spots correspond to the backlight lamps. Arrows show flow direction.

Figure 10.
Video frames of the flow structure in the PDH with a passive flap valve: (a) purging of the DT with nitrogen before the next cycle; (b) shock wave passes the flap valve; (c) penetration of some detonation products into the water intake, (d) closing of the water intake by the flap valve; and (e) closing of the DT by the flap valve. Bright spots correspond to the backlight lamps. Dashed lines indicate flap valve position. Arrows show flow direction.


Figure 11.
Cycle-to-cycle time-averaged thrust for the PDH without () and with () passive flap valve in test fire #2 of Table 2.
Figure 11.
Cycle-to-cycle time-averaged thrust for the PDH without () and with () passive flap valve in test fire #2 of Table 2.

Figure 12.
Schematic of PDH with a rotary valve.

Figure 13.
The PDH model installed at the laboratory test rig.

Figure 14.
Operation cyclograms of (a) PDH and (b) rotary valve: toff is the time interval when the valve is closed, ton is the time interval when the valve is open, Δtign is the time interval between ignition triggering and valve opening (ignition delay).
Figure 14.
Operation cyclograms of (a) PDH and (b) rotary valve: toff is the time interval when the valve is closed, ton is the time interval when the valve is open, Δtign is the time interval between ignition triggering and valve opening (ignition delay).

Figure 15.
Time histories of the PDH thrust (top) and pressure at the DT exit (bottom) for the PDH model with (a) deactivated (in the closed position) and (b) activated rotary valve; operation frequency 14 Hz.
Figure 15.
Time histories of the PDH thrust (top) and pressure at the DT exit (bottom) for the PDH model with (a) deactivated (in the closed position) and (b) activated rotary valve; operation frequency 14 Hz.

Figure 16.
Video frames of the PDH operation cycle (operation frequency 7 Hz, approaching water flow velocity 5 m/s) with deactivated (left column) and activated (right column) rotary valve: (a) t = 0 (shock wave enters the water guide); (b) 45 ms; (c) 55 ms. Arrows show flow direction. Bright spots correspond to the backlight lamps.


Figure 17.
Video frames of the flow structure in the PDH at five instants of time corresponding to the beginning of five successive cycles for PDH operating at 14 Hz at the approaching water flow velocity of 5 m/s. The upper diagram presents the synchronized time histories of the PDH thrust and pressure at the DT exit. Arrows show flow direction. Bright spots correspond to the backlight lamps.

Figure 18.
Experimental dependences of the PDH time-averaged (a) thrust and (b) specific impulse on the ignition delay Δtign: 1—frequency 7 Hz, 2—14 Hz; horizontal dashed lines correspond to the values of thrust and specific impulse for the PDH with deactivated rotary valve (frequency 14 Hz).
Figure 18.
Experimental dependences of the PDH time-averaged (a) thrust and (b) specific impulse on the ignition delay Δtign: 1—frequency 7 Hz, 2—14 Hz; horizontal dashed lines correspond to the values of thrust and specific impulse for the PDH with deactivated rotary valve (frequency 14 Hz).


Table 1.
Pressure pulse amplitude (P) and specific impulse (Isp) in three successive cycles of the baseline PDH model in three different test fires at same conditions.
Table 1.
Pressure pulse amplitude (P) and specific impulse (Isp) in three successive cycles of the baseline PDH model in three different test fires at same conditions.
| Test Fire | P#1/P#2/P#3, MPa | Isp,#1/Isp,#2/Isp,#3, s |
|---|---|---|
| 1 | 0.35/0.20/0.21 | 1160/200/250 |
| 2 | 0.33/0.19/0.17 | 980/510/390 |
| 3 | 0.33/0.18/0.16 | 1040/390/300 |
| Mean | 0.34/0.19/0.18 | 1060/360/310 |
Table 2.
Time-averaged thrust and specific impulse for the PDH without ( and Isp) and with ( and Isp,v) passive flap valve at three different values of the DT fill volume, Vm, with the explosive mixture.
Table 2.
Time-averaged thrust and specific impulse for the PDH without ( and Isp) and with ( and Isp,v) passive flap valve at three different values of the DT fill volume, Vm, with the explosive mixture.
| Test Fire | Vm, dm3 | N | Isp, s | Isp,v, s | |
|---|---|---|---|---|---|
| 1 | 0.4 | 17 | 20 | 340 | 390 |
| 2 | 0.5 | 18 | 23 | 310 | 440 |
| 3 | 0.6 | 19 | 22 | 270 | 340 |
Publisher’s Note: MDPI stays neutral with regard to jurisdictional claims in published maps and institutional affiliations. |
© 2022 by the authors. Licensee MDPI, Basel, Switzerland. This article is an open access article distributed under the terms and conditions of the Creative Commons Attribution (CC BY) license (https://creativecommons.org/licenses/by/4.0/).
Share and Cite
MDPI and ACS Style
Frolov, S.M.; Avdeev, K.A.; Aksenov, V.S.; Frolov, F.S.; Sadykov, I.A.; Shamshin, I.O. Pulsed Detonation Hydroramjet: Design Optimization. J. Mar. Sci. Eng. 2022, 10, 1171. https://doi.org/10.3390/jmse10091171
AMA Style
Frolov SM, Avdeev KA, Aksenov VS, Frolov FS, Sadykov IA, Shamshin IO. Pulsed Detonation Hydroramjet: Design Optimization. Journal of Marine Science and Engineering. 2022; 10(9):1171. https://doi.org/10.3390/jmse10091171
Chicago/Turabian StyleFrolov, Sergey M., Konstantin A. Avdeev, Viktor S. Aksenov, Fedor S. Frolov, Ilias A. Sadykov, and Igor O. Shamshin. 2022. "Pulsed Detonation Hydroramjet: Design Optimization" Journal of Marine Science and Engineering 10, no. 9: 1171. https://doi.org/10.3390/jmse10091171
Note that from the first issue of 2016, this journal uses article numbers instead of page numbers. See further details here.