
Development of Ultra-Lightweight and High Strength Engineered Cementitious Composites


School of Civil and Environmental Engineering, Nanyang Technological University, 50 Nanyang Avenue, Singapore 639798, Singapore
*
Author to whom correspondence should be addressed.
J. Compos. Sci. 2021, 5(4), 113; https://doi.org/10.3390/jcs5040113
Submission received: 16 March 2021
/
Revised: 14 April 2021
/
Accepted: 14 April 2021
/
Published: 18 April 2021
(This article belongs to the Special Issue High Performance Fiber-Reinforced Cementitious Composites)
Abstract
:In this study, ultra-lightweight and high strength Engineered Cementitious Composites (ULHS-ECCs) are developed via lightweight filler incorporation and matrix composition tailoring. The mechanical, physical, and micromechanical properties of the resulting ULHS-ECCs are investigated and discussed. ULHS-ECCs with a density below 1300 kg/m3, a compressive strength beyond 60 MPa, a tensile strain capacity above 1%, and a thermal conductivity below 0.5 w/mK are developed. The inclusion of lightweight fillers and the variation in proportioning of the ternary binder can lead to a change in micromechanical properties, including the matrix fracture toughness and the fiber/matrix interface properties. As a result, the tensile strain-hardening performance of the ULHS-ECCs can be altered.
1. Introduction
Lightweight cement-based material (LCM) is important for structures requiring a high strength-to-weight ratio such as high-rise buildings, long-span structures, and floating and offshore structures. LCM offers many advantages such as weight saving and thermal insulation. The lower density of LCM is typically achieved by incorporating porous lightweight aggregates or introducing air bubbles into the matrix phase [1,2,3,4,5]. However, the mechanical properties of LCM are also often considerably lower than those of normal weight cement-based material (NCM). In addition, LCM is more brittle than NCM with comparable strength [6,7,8]. These drawbacks limit the wider structural applications of LCM. It is of great interest to improve the mechanical properties of LCM with higher strength and ductility. Zhu et al. [9] developed a series of lightweight cement composites by incorporating hollow glass bubbles. The compressive strength of 100 mm cubes was in the range of 14–31 MPa with a density below 1500 kg/m3. The thermal conductivity was measured between 0.34 and 0.51 W/mK by means of the hot wired method. Wang et al. [10] developed a series of fiber-reinforced ultra-lightweight cement composites with a density below 1500 kg/m3 using cenospheres as the only lightweight aggregate. The compressive strength can achieve beyond 60 MPa.
Engineered Cementitious Composites (ECCs) are a kind of high-performance fiber-reinforced cement-based composite featuring ultra-high tensile ductility with moderate fraction of fiber inclusion (typically 2% by volume) and high compressive strength (typically 40–120 MPa) [11,12,13,14,15]. The density of normal weight ECCs is around 2100 kg/m3. Recent advances in additive manufacturing have drawn research interests in the development of lightweight ECCs [16,17,18,19,20]. Tensile ductility and density are the two critical criteria to evaluate the performance of lightweight ECCs. Generally, the uniaxial tension test and water displacement method are used to determine the tensile ductility and density, respectively. Wang and Li [17] developed lightweight polyvinyl alcohol (PVA) fiber-reinforced ECCs (PVA-ECCs) by incorporating lightweight aggregates and air entraining admixture to achieve a density of 930–1800 kg/m3, a tensile strain capacity of 3–4% and a compressive strength of around 40 MPa. Huang et al. [18] used lightweight industrial wastes such as fly ash cenospheres and iron ore tailings to produce lightweight PVA-ECCs with a density of 1649–1820 kg/m3, a tensile strain capacity of 3–4%, and a compressive strength of 25–48 MPa. Typically, the densities of ECCs with a compressive strength beyond 40 MPa and 50 MPa are more than 1500 kg/m3 and 1850 kg/m3, respectively [19,20].
This study reports the development of an ultra-lightweight and high strength ECC (ULHS-ECC). The matrix design of ECCs often adopts a binary binder system, such as ordinary Portland cement (OPC) with fly ash (FA), OPC with ground granulated blast-furnace slag (GGBS), or OPC with silica fume (SF). The ternary binder system in ECC mix design is rarely reported. It has been suggested that the ternary binder system can potentially enhance the matrix strength of ECCs [14]. Thus, in the current study, fly ash cenospheres (FACs) are used as lightweight aggregates to reduce the density while a ternary binder system is employed to enhance the strength of ULHS-ECCs. The mechanical properties in terms of the compressive strength and the tensile ductility as well as the physical properties in terms of dry density, thermal conductivity, and the rate of water absorption are determined to evaluate the performances of the resulting ULHS-ECCs.
2. Materials and Methods
2.1. Materials
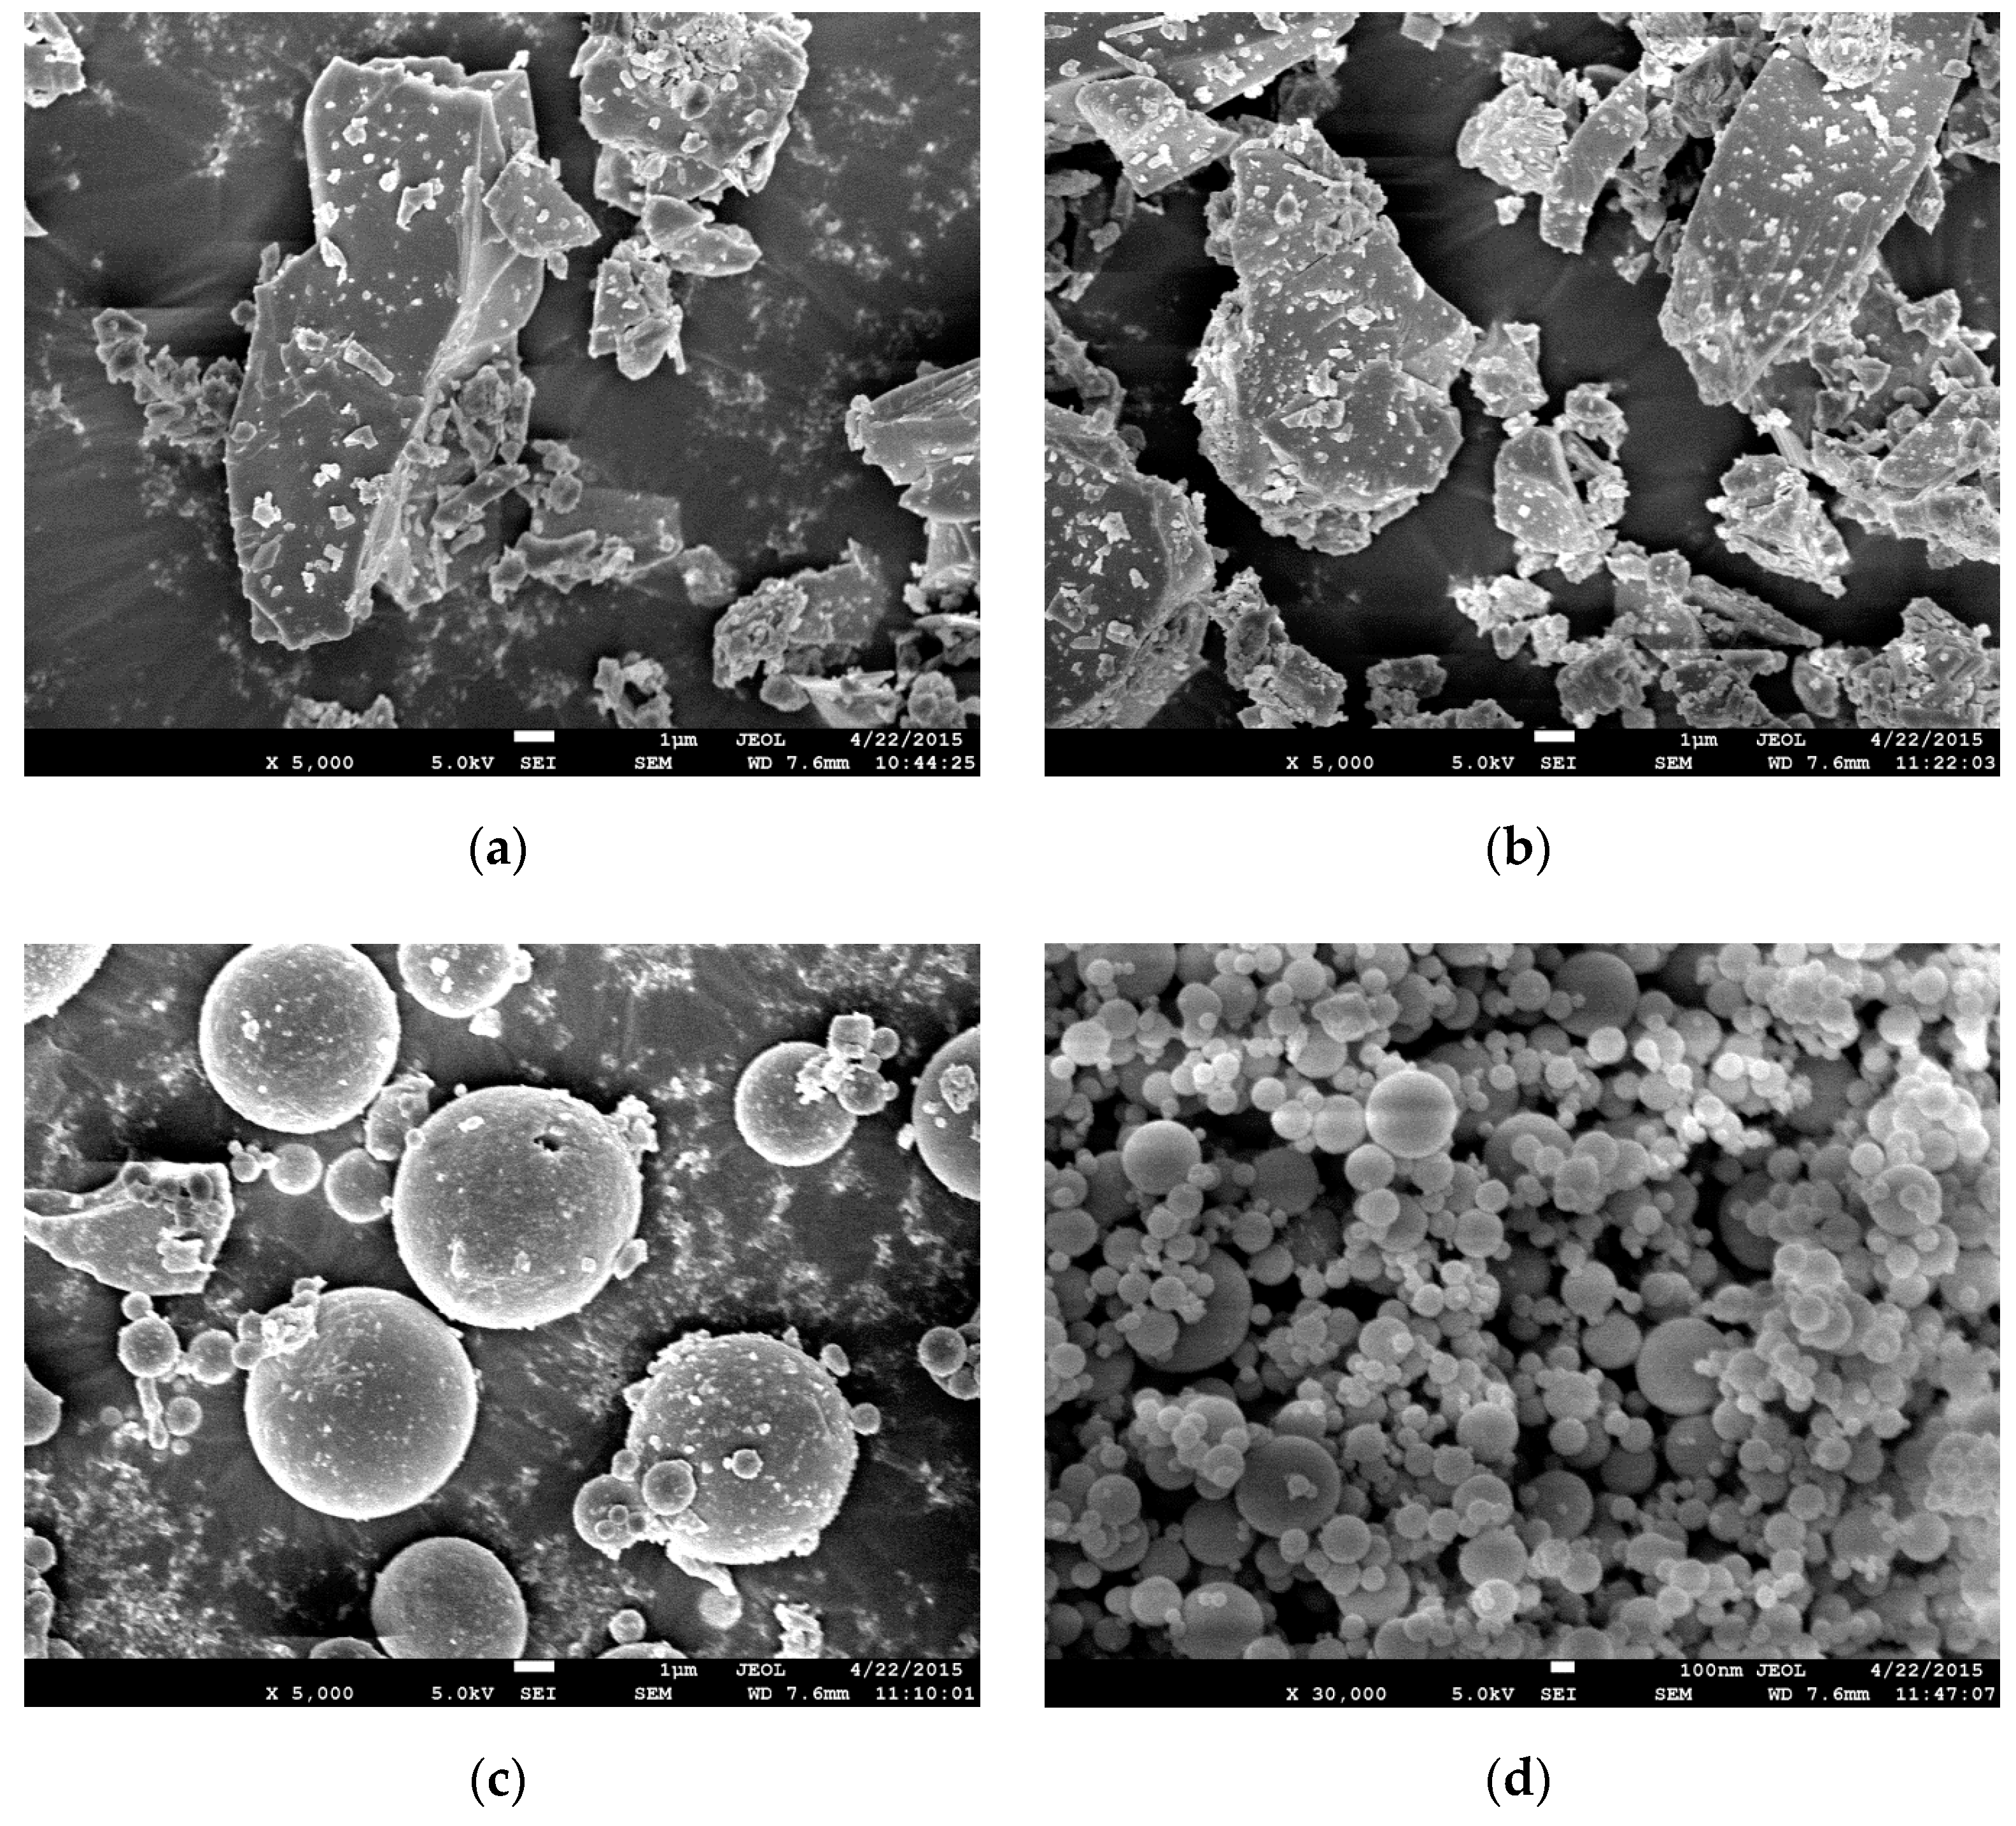
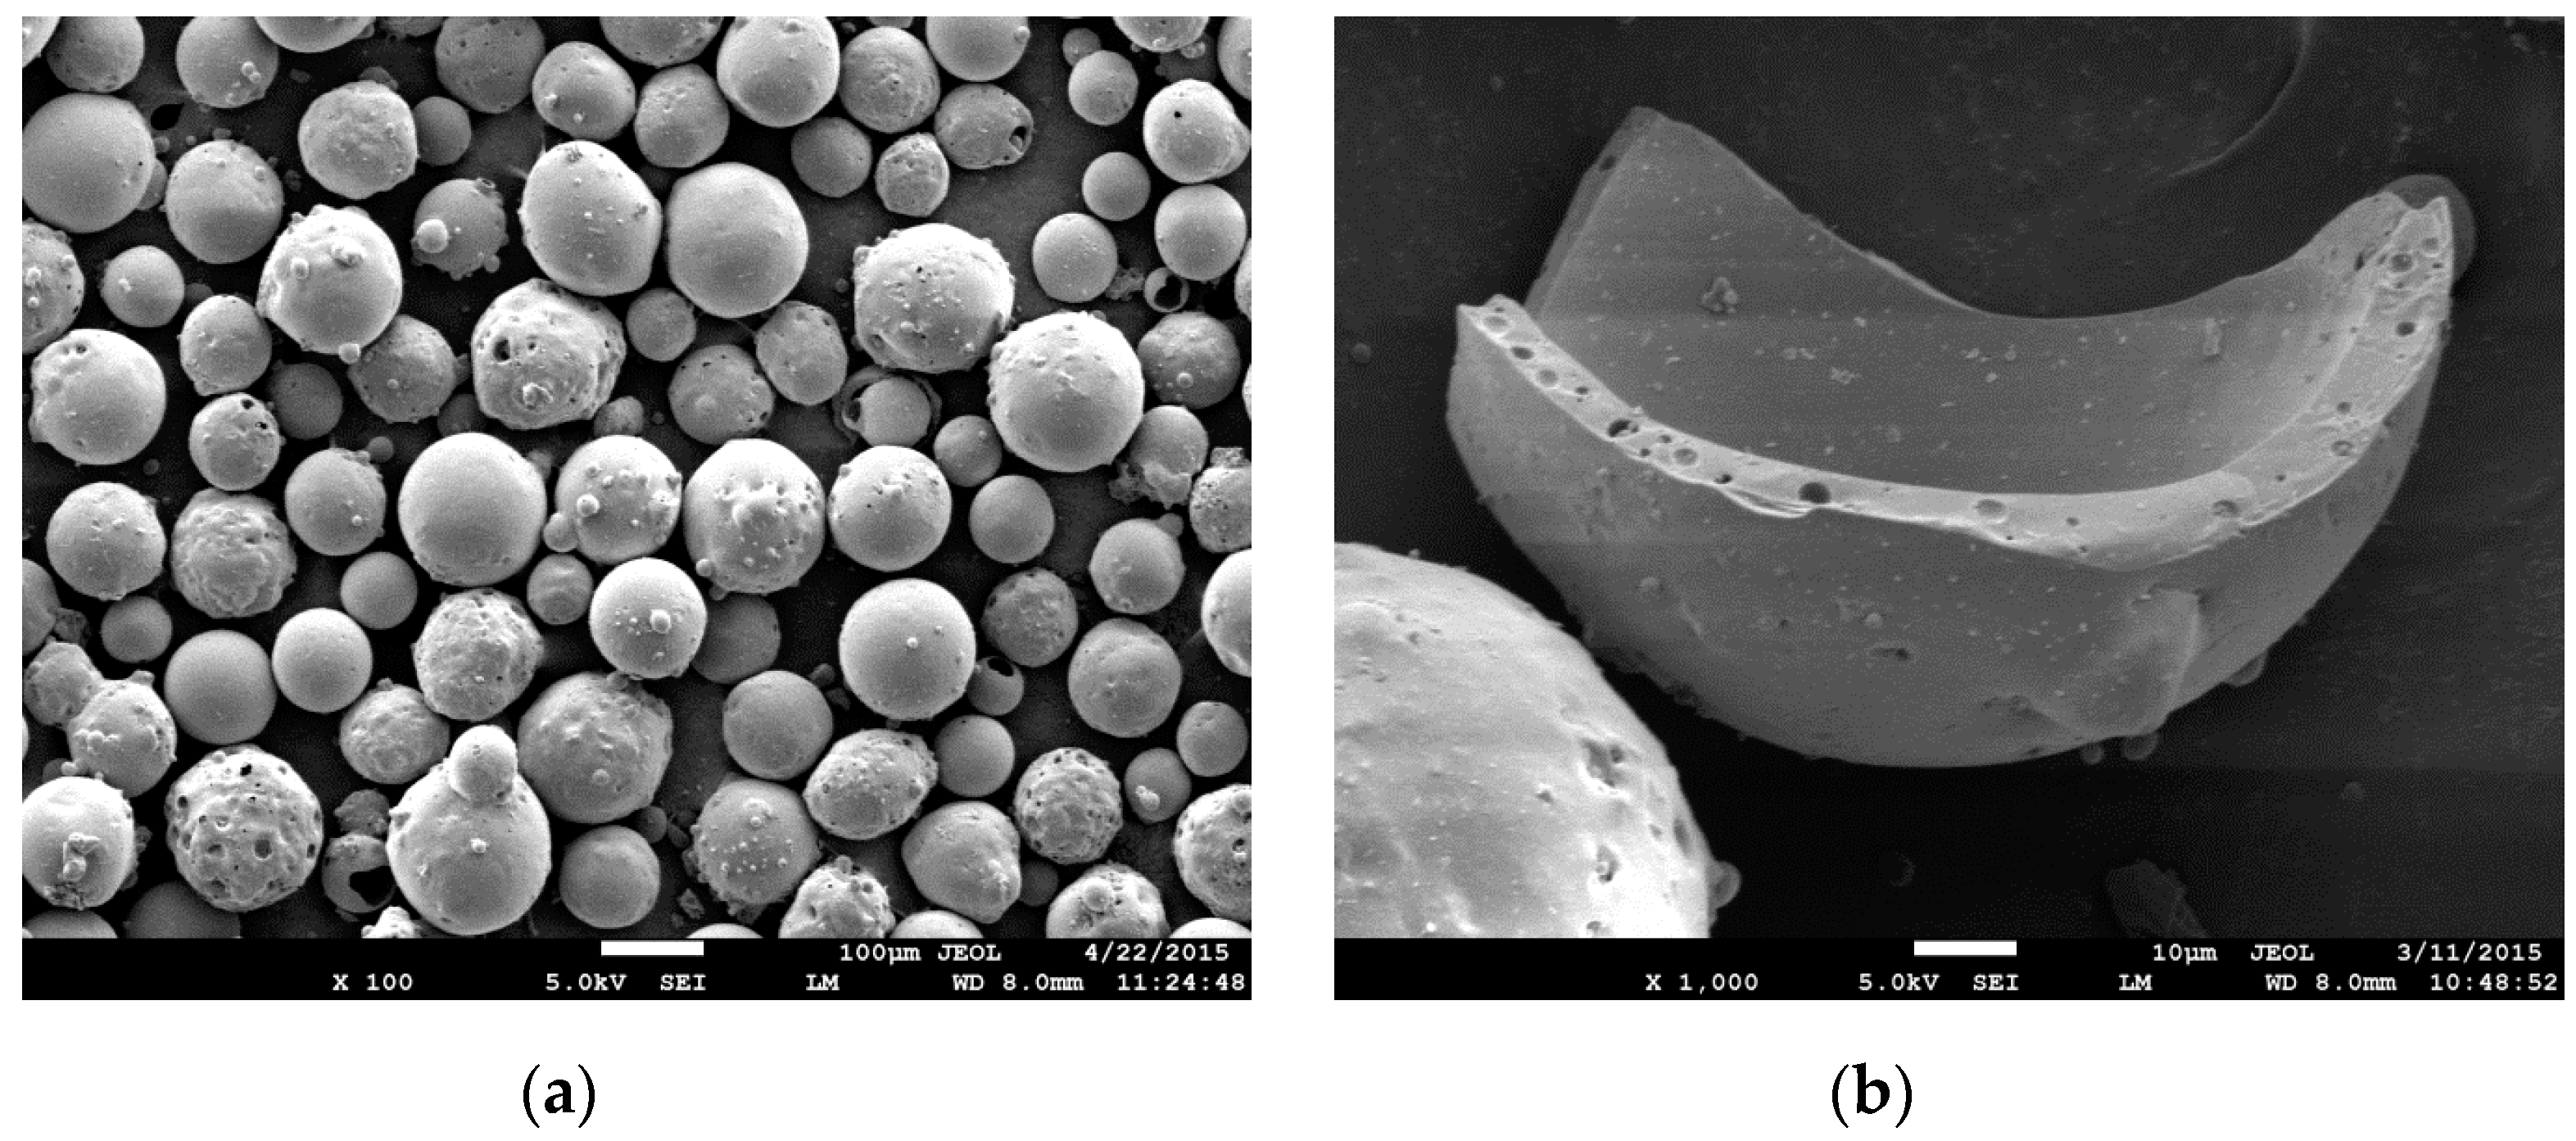
CEM I 52.5 N cement and undensified SF are used as the basic binder materials. GGBS or class F FA is used as supplementary cementitious material to partially replace cement. Figure 1 shows the morphology of the four binder materials. FACs with a bulk density of approximately 400 kg/m3 are used as lightweight aggregates in this study. The particle size of the FACs is in the range of 45 μm to 300 μm. Figure 2 shows the surface morphology and the hollow core-shell structure of the FAC particles. The chemical compositions of raw materials are listed in Table 1 and the physical properties of the FACs are shown in Table 2. Short PVA fibers with 12 mm in length and 39–44 µm in diameter are used in all mixtures. The surface of the PVA fibers is coated with oil (1.2% by weight) to reduce the bond between the fiber and the cement matrix to prevent premature fiber rupture, thus improving the tensile strain-hardening behavior of the resulting ULHS-ECCs. The physical and geometrical properties of PVA fibers are summarized in Table 3.
2.2. Mix Proportions and Specimen Preparation
Seven mixtures were prepared in this study and the mix proportions are given in Table 4. The control mix follows the mix design approach in Wang et al. [10]. The binder system is composed of 92% CEM I 52.5 N and 8% SF by mass. The weight fraction of FACs is 42% of the total binder. For the other six mixes, GGBS or FA is introduced in the mix design to form a ternary binder system in order to enhance the strength of the ULHS-ECCs. The GGBS or FA is used to replace 20–60% of the cement by weight and SF is kept at 8% of the total binder by weight [21,22]. The water-to-binder ratio is kept at 0.27 for all seven mixes. The volume fraction of PVA fiber is fixed at 2%. The polycarboxylate-based superplasticizer (SP) is used to adjust the rheological properties of the fresh paste for achieving homogenous fiber dispersion.
The solid ingredients including binder materials and FACs are dry-mixed for 1–2 min. The water and superplasticizer are added and mixed to achieve a consistent and flowable mix. The PVA fibers are then slowly added in the fresh mixture and mixed for another 5–6 min until the fibers are evenly dispersed without balling. After mixing, the fresh mixtures are poured into different molds and covered with a plastic sheet. The specimens are removed from molds after 24 h air curing and placed in a curing room (98% RH, 25–27 °C) for 28 days.
2.3. Tests
2.3.1. Density
The apparent density is determined in accordance with American Society for Testing and Materials (ASTM) C 642. The 50 mm cubes are used to determine the density of ULHS-ECCs. The cube specimen is dried in an oven at 105 °C until a constant mass is achieved. After which, the specimen is cooled in air. The specimen is then suspended in water by a wire, and the immersed apparent mass is determined. The apparent density can be determined in accordance with Equation (1):
where ρA is the apparent density of the sample (in g/cm3); ρw is the density of water (in g/cm3); A is the mass of the oven-dried sample in air (in g); and D is the apparent mass of the oven-dried sample in water (in g).
2.3.2. Compressive Strength Test
The compressive strength of ULHS-ECCs is determined using 50 mm cubes according to BS EN 12390–3:2009. The loading rate of the compressive strength test is 100 kN/min. At least three cubes are measured for each mix and the mean and the standard deviation of the compressive strength are reported.
2.3.3. Direct Tensile Test
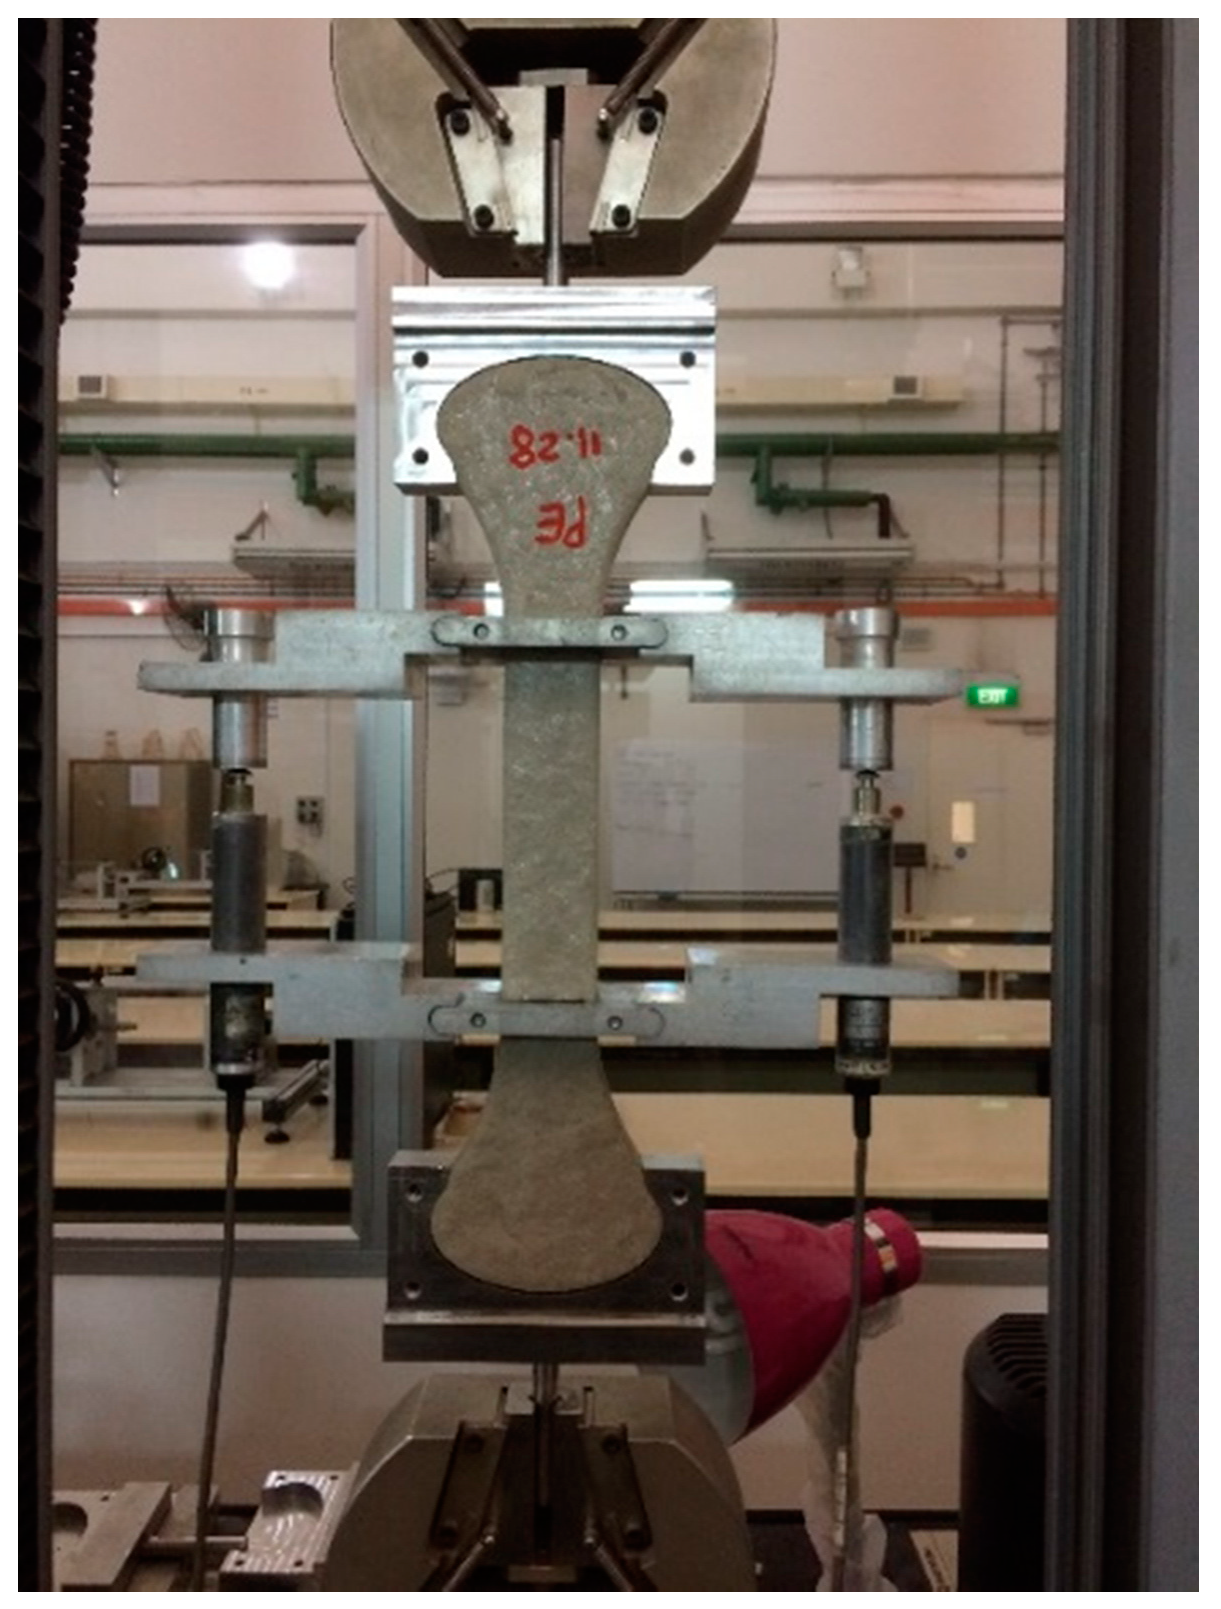
Uniaxial tensile test is carried out to determine the tensile stress–strain relationship of the composites by means of an Instron electronic universal testing machine with 50 kN capacity. Two linear variable differential transformers (LVTDs) are used to monitor the deformation of the dog-bone specimen with a gage length of 100 mm (Figure 3). The test is carried out under displacement control at a rate of 0.2 mm/min. Four specimens are tested for each mix. The representative tensile stress–strain curves and the corresponding crack pattern are reported.
2.3.4. Thermal Conductivity
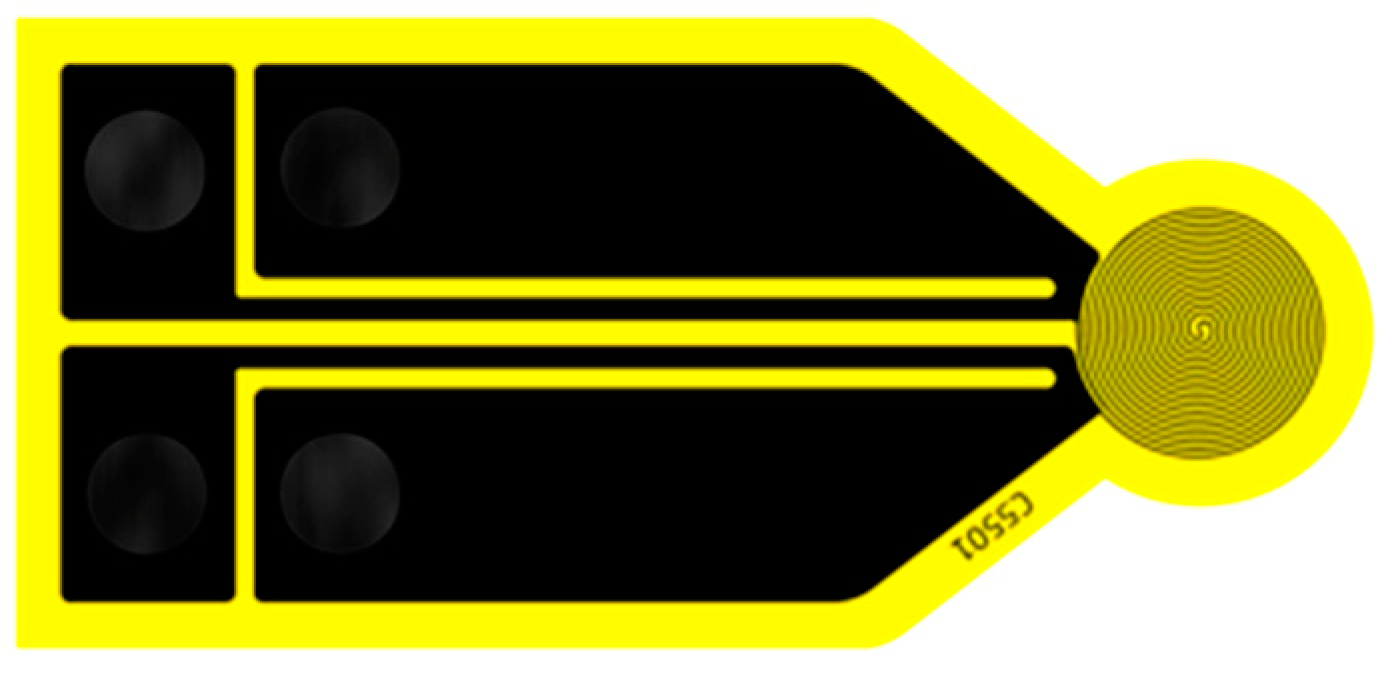
The thermal conductivity of ULHS-ECCs is determined by means of a Hot Disk TPS 2500S utilizing the transient plane heat source method in accordance with ISO 22007-2:2015. The 50 mm cubes are oven dried for 24 h before the test. The thermal conductivity of the specimen is determined by sandwiching a Kapton-insulated sensor (Figure 4) between two cube specimens with flat surfaces. The sensor is used both as a heat source and as a dynamic temperature sensor. The power output and temperature increase are recorded as a function of time. The thermal conductivity is determined by solving Equation (2):
where P0 is the power output of the sensor; r is the radius of the sensor; λ is the thermal conductivity of the specimen; D(τ) is the dimensionless specific time function; , characteristic time ratio, is a dimensionless parameter; k is the thermal diffusivity of the specimen; and t is the time.
2.3.5. Water Absorption Rate
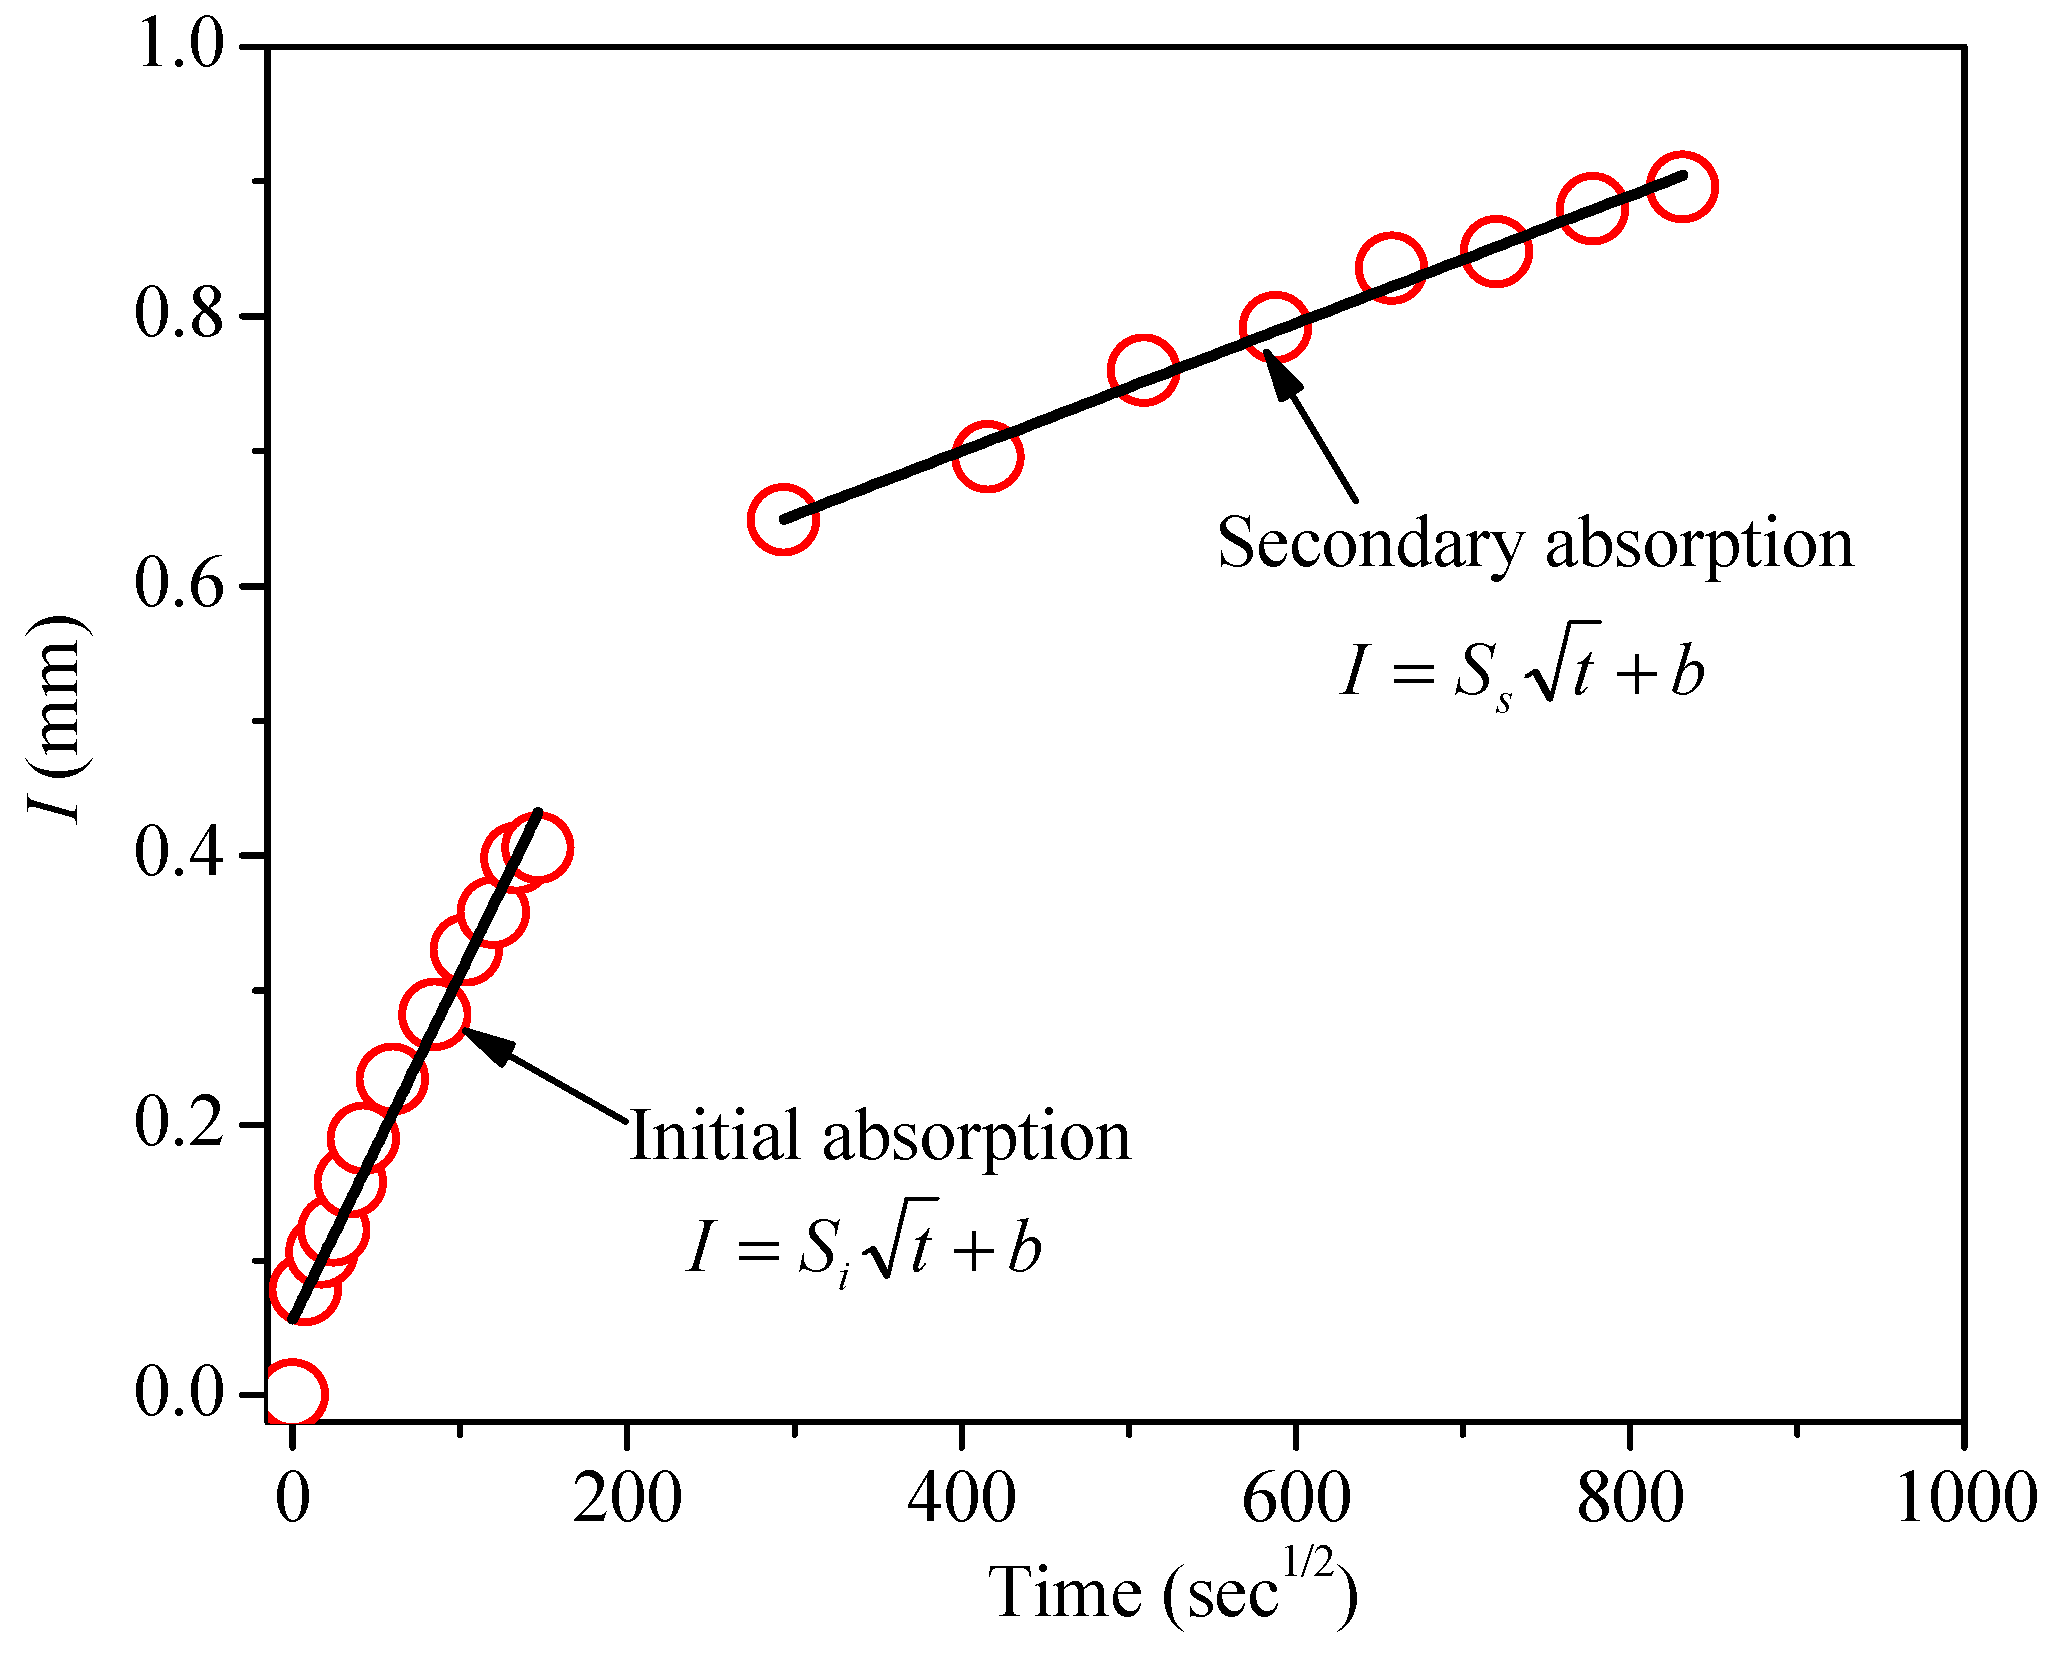
The rate of water absorption is determined in accordance with ASTM C 1585, except the cubic specimen is used in the current study. The specimens are cured in water for 28 days at room temperature. Before the water absorption test, the specimens are placed in an environmental chamber at 50 °C and 80% RH for 3 days. The specimens are then stored in a sealed container for another 15 days at 23 °C. After which, the four-side surfaces of the specimen are sealed with aluminum tape, and the top surface of the specimen which will not contact water is covered with a plastic sheet. The mass of sealed specimens is measured as a function of time. The absorption is defined as the change in mass divided by the product of the cross-sectional area of the specimen and the density of water expressed as Equation (3):
where I is the absorption (in mm); mt is the change in specimen mass at time t (in g); a is the cross-sectional area of the specimen that is exposed to water (in mm2); and ρw is the density of water (in g/cm3).
2.4. Micromechanical Properties Test
2.4.1. Single Fiber Pull-Out Test
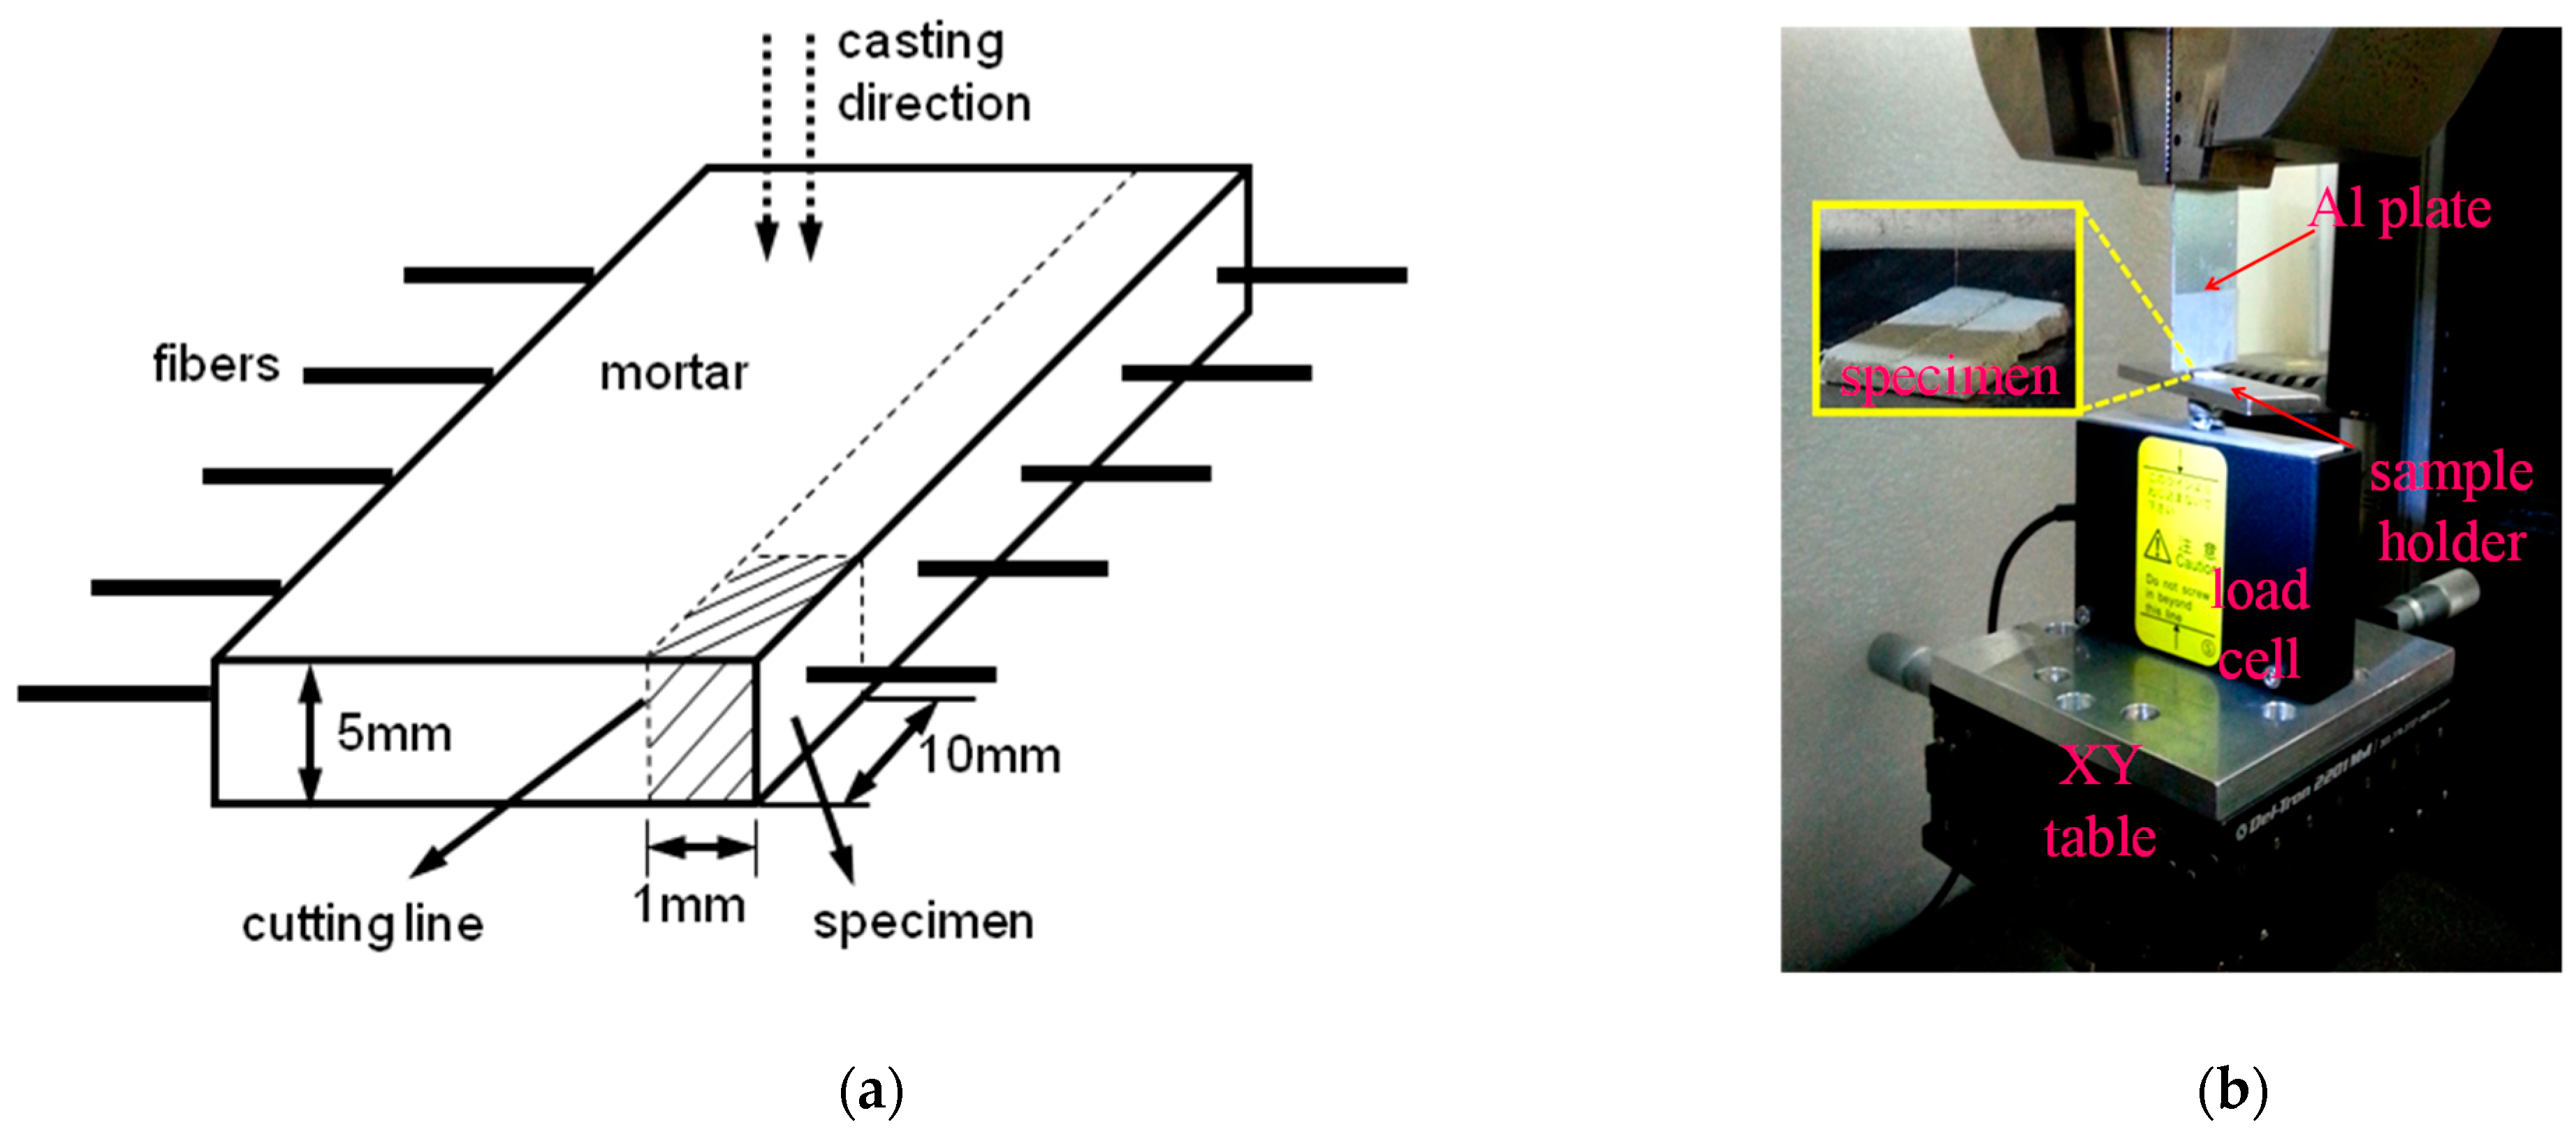
The single fiber pullout test is used to quantify the fiber/matrix interface properties (i.e., chemical debond energy Gd and frictional bond strength τ0), which are key inputs for the calculation of the fiber-bridging constitutive law and the evaluation of the strain-hardening performance of the resulting composites [23]. The same mix proportions as shown in Table 3 are used, except no fiber is included. The ready-mixed cement mortar is poured into a double-layer mold where a few continuous fibers are fixed between the two layers in advance. After casting, the continuous fibers are now surrounded and embedded in the cement mortar prism with a dimension of 50 mm × 20 mm × 5 mm (Figure 5a). The single fiber pullout test specimen is cut from the cement mortar plate with a diamond saw after 28 d curing. The specimen has a single fiber protrude from one side with an embedment length of around 1 mm to ensure full debonding can occur during the single fiber pullout test. The configuration of the apparatus for the single fiber pullout test is shown in Figure 5b. The single fiber pullout test is conducted under displacement control by using the MTS Acumen electrodynamic test system with a loading rate of 0.1 mm/min. The specimen is fixed on a T-shape sample holder which is attached to a 10 N load cell with an accuracy of 0.1 mN for measuring the fiber pullout force. The free end of the fiber is glued to an aluminum plate fixed at the upper grip, and the free length of the fiber is around 1 mm. An XY table is used to adjust the alignment of the fiber to ensure the fiber is pulled out vertically from the matrix as much as possible.
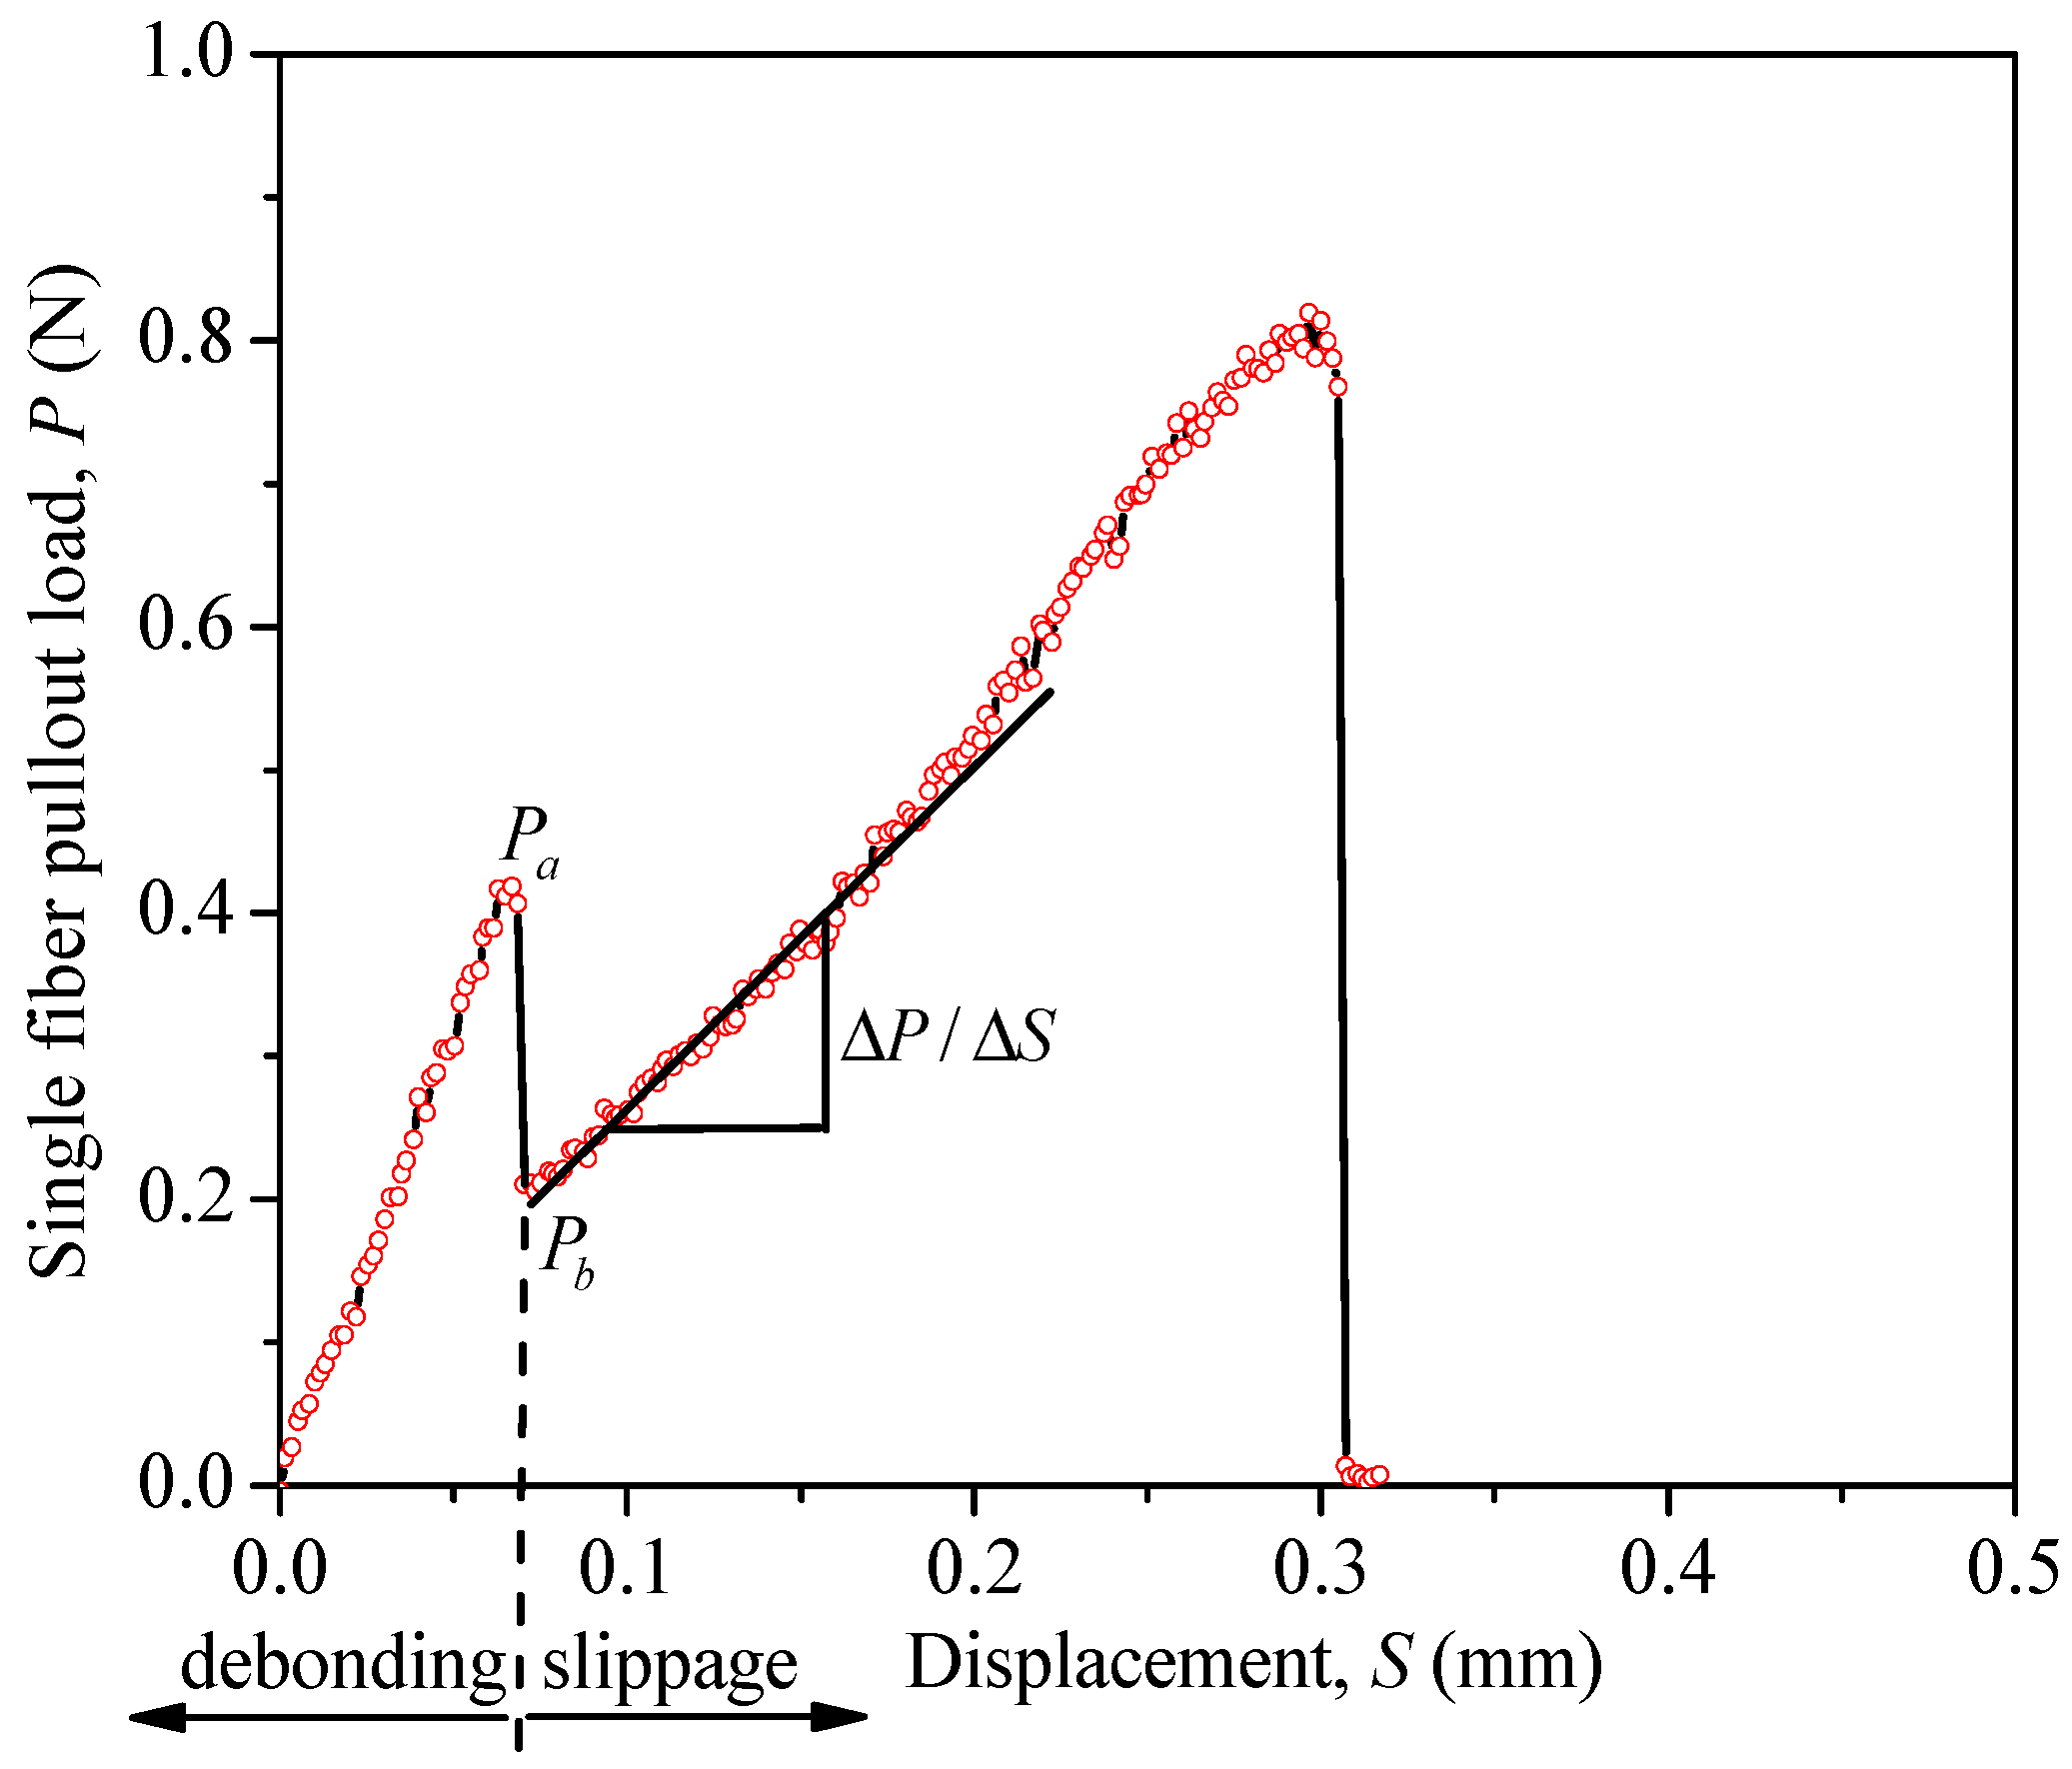
Figure 6 shows a typical single fiber pullout load–displacement curve. As can be seen, the curve consists of two stages: the debonding stage and the slippage stage. The load resistance of the fiber increases up to Pa, followed by a sudden load drop from Pa to Pb indicating full debonding between the fiber and the matrix. Gd can be determined from the difference between Pa and Pb using Equation (4), while τ0 is controlled by Pb in accordance with Equation (5) [24]:
where Ef is the fiber’s Young’s modulus; df is the fiber’s diameter; and le is the fiber’s embedment length.
2.4.2. Wedge Split Test
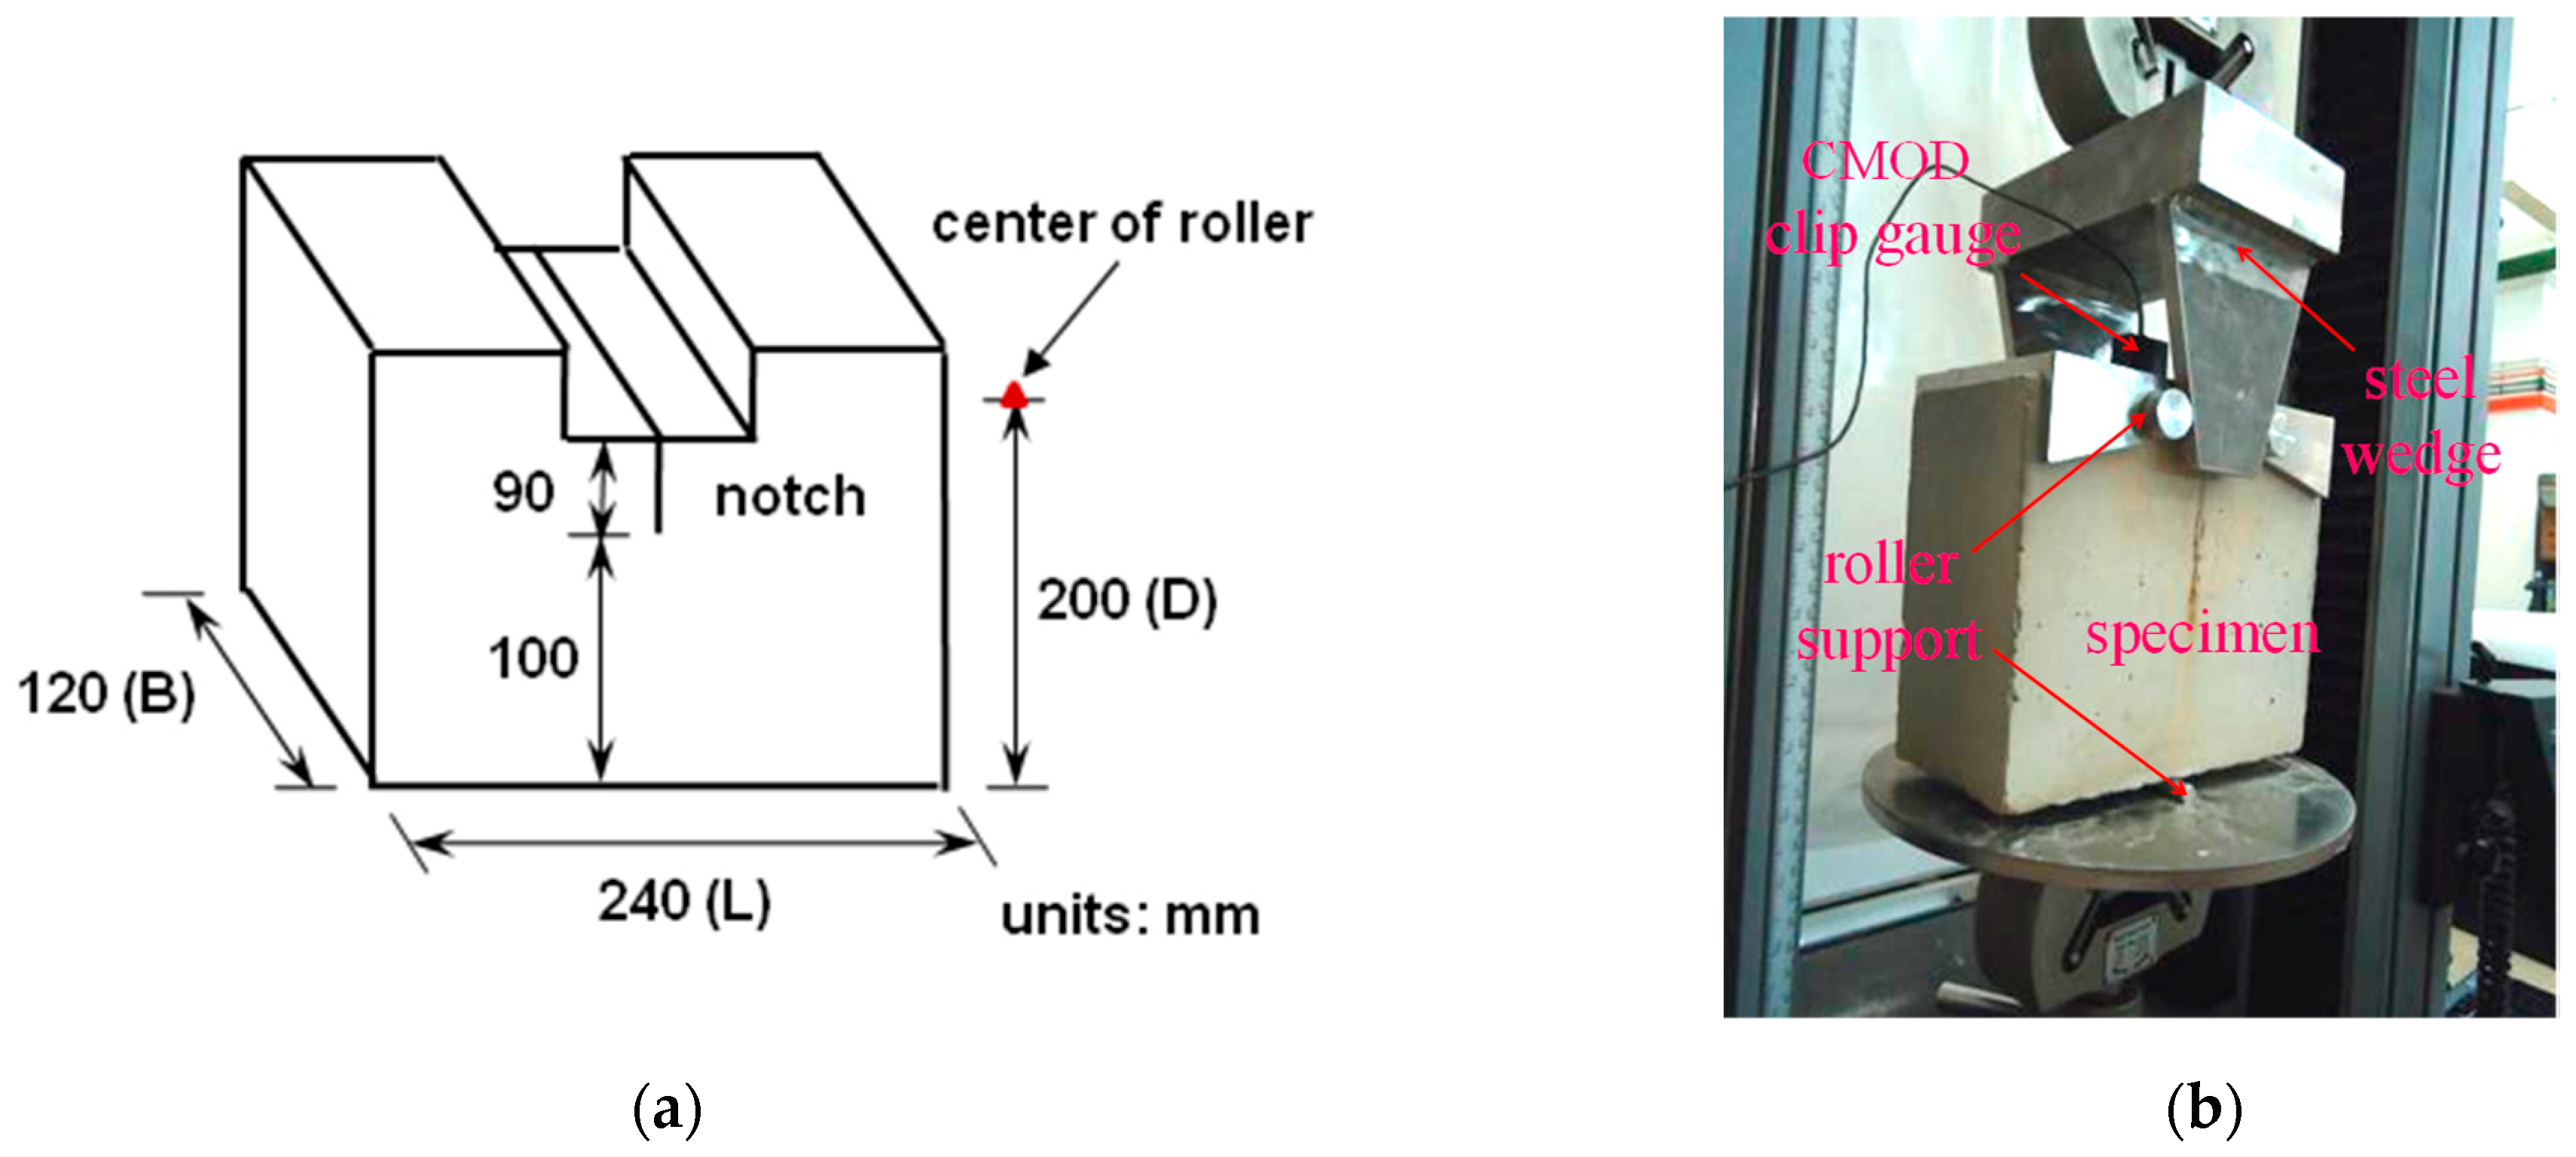
The wedge split test is used to determine the matrix fracture toughness KIc (= Km). The geometry of the specimen and the test apparatus for the matrix fracture toughness are shown in Figure 7. Figure 7a shows the dimension of the notch specimen for the wedge split test. The length (L) to depth (D) ratio of the specimen is 1.2. A 90 mm notch is created by inserting a 1 mm stainless steel plate in the mold during the casting of the specimen. The same mix proportions as shown in Table 3 are used, except no fiber is included. The ready-mixed cement mortar is poured into the mold, and the specimen is demolded after 24 h and the stainless steel plate is removed. After demolding, the notched specimens are cured in a sealed container for another 27 d before testing. The wedge split test is carried out by using an Instron electric servo universal testing machine with a capacity of 50 kN. The configuration of the test apparatus for the wedge split test is shown in Figure 7b. Two roller supports are covered on the top of the specimen. The steel wedge between the two roller supports is pressed downwards to introduce a horizontal splitting force component. A steel roller support is used at the bottom to resist the vertical force component. A crack mouth opening displacement (CMOD) clip gauge is used to measure the CMOD at notch surface. The load is applied under displacement control with a loading rate of 0.06 mm/min.
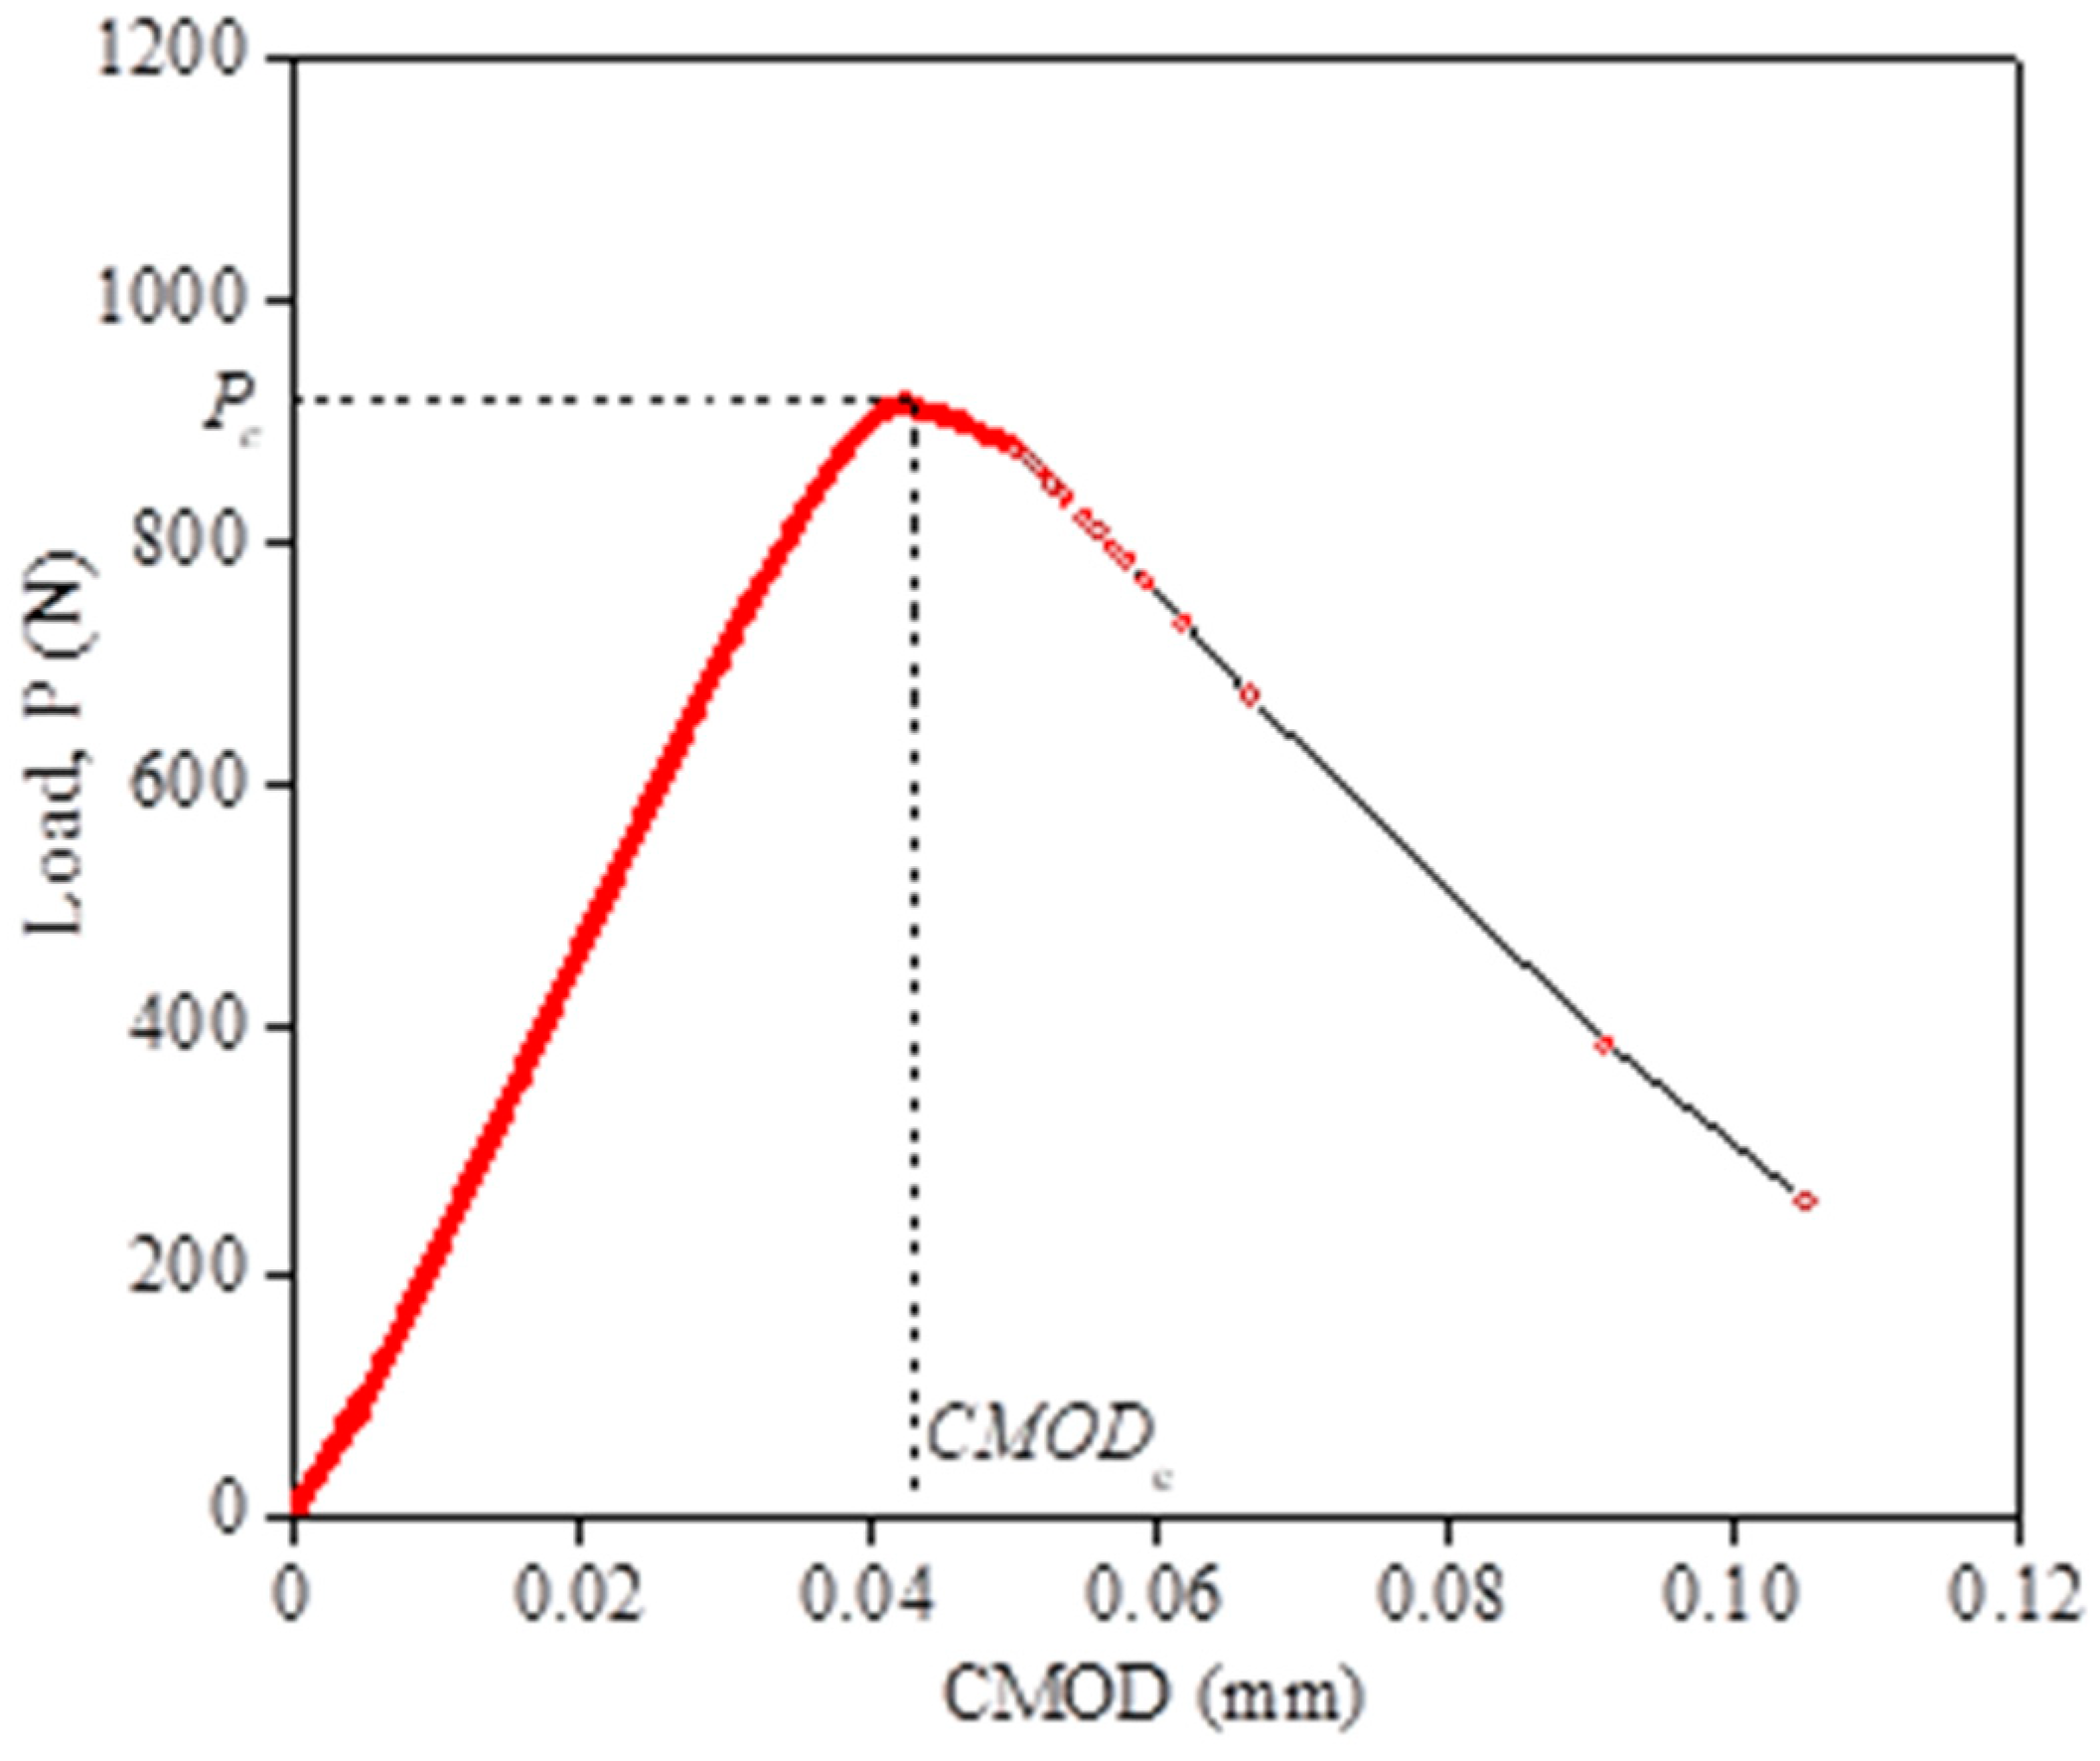
Figure 8 shows the typical load–CMOD curve obtained from the wedge split test. The peak load (Pc) and critical crack mouth opening displacement (CMODc) obtained from the load–CMOD curve are used to calculate the critical crack length ac in accordance with Equation (6). The fracture toughness KIc is then determined by Equation (7) [25]:
where E is the Young’s modulus; B is the thickness of the specimen; D is the depth of the specimen; ac is the critical crack length; and F(α) is a geometric coefficient. For specimens with L/D = 1.2, F(α) can be derived as Equation (8):
where α = ac/D.
2.5. Fiber-Bridging Analysis
The fiber-bridging behavior, i.e., stress-crack opening relationship σ(δ), which governs the multiple cracking and tensile strain-hardening of ULHS-ECCs, can be derived analytically once the relevant micromechanical parameters are obtained from the above tests. A numerical approach described in Li et al. [26] is used to calculate the fiber-bridging curves of the seven ULHS-ECC mixes for the evaluation of the influence of GGBS/FA substitution on fiber-bridging behavior.
3. Results
3.1. Density and Compressive Strength
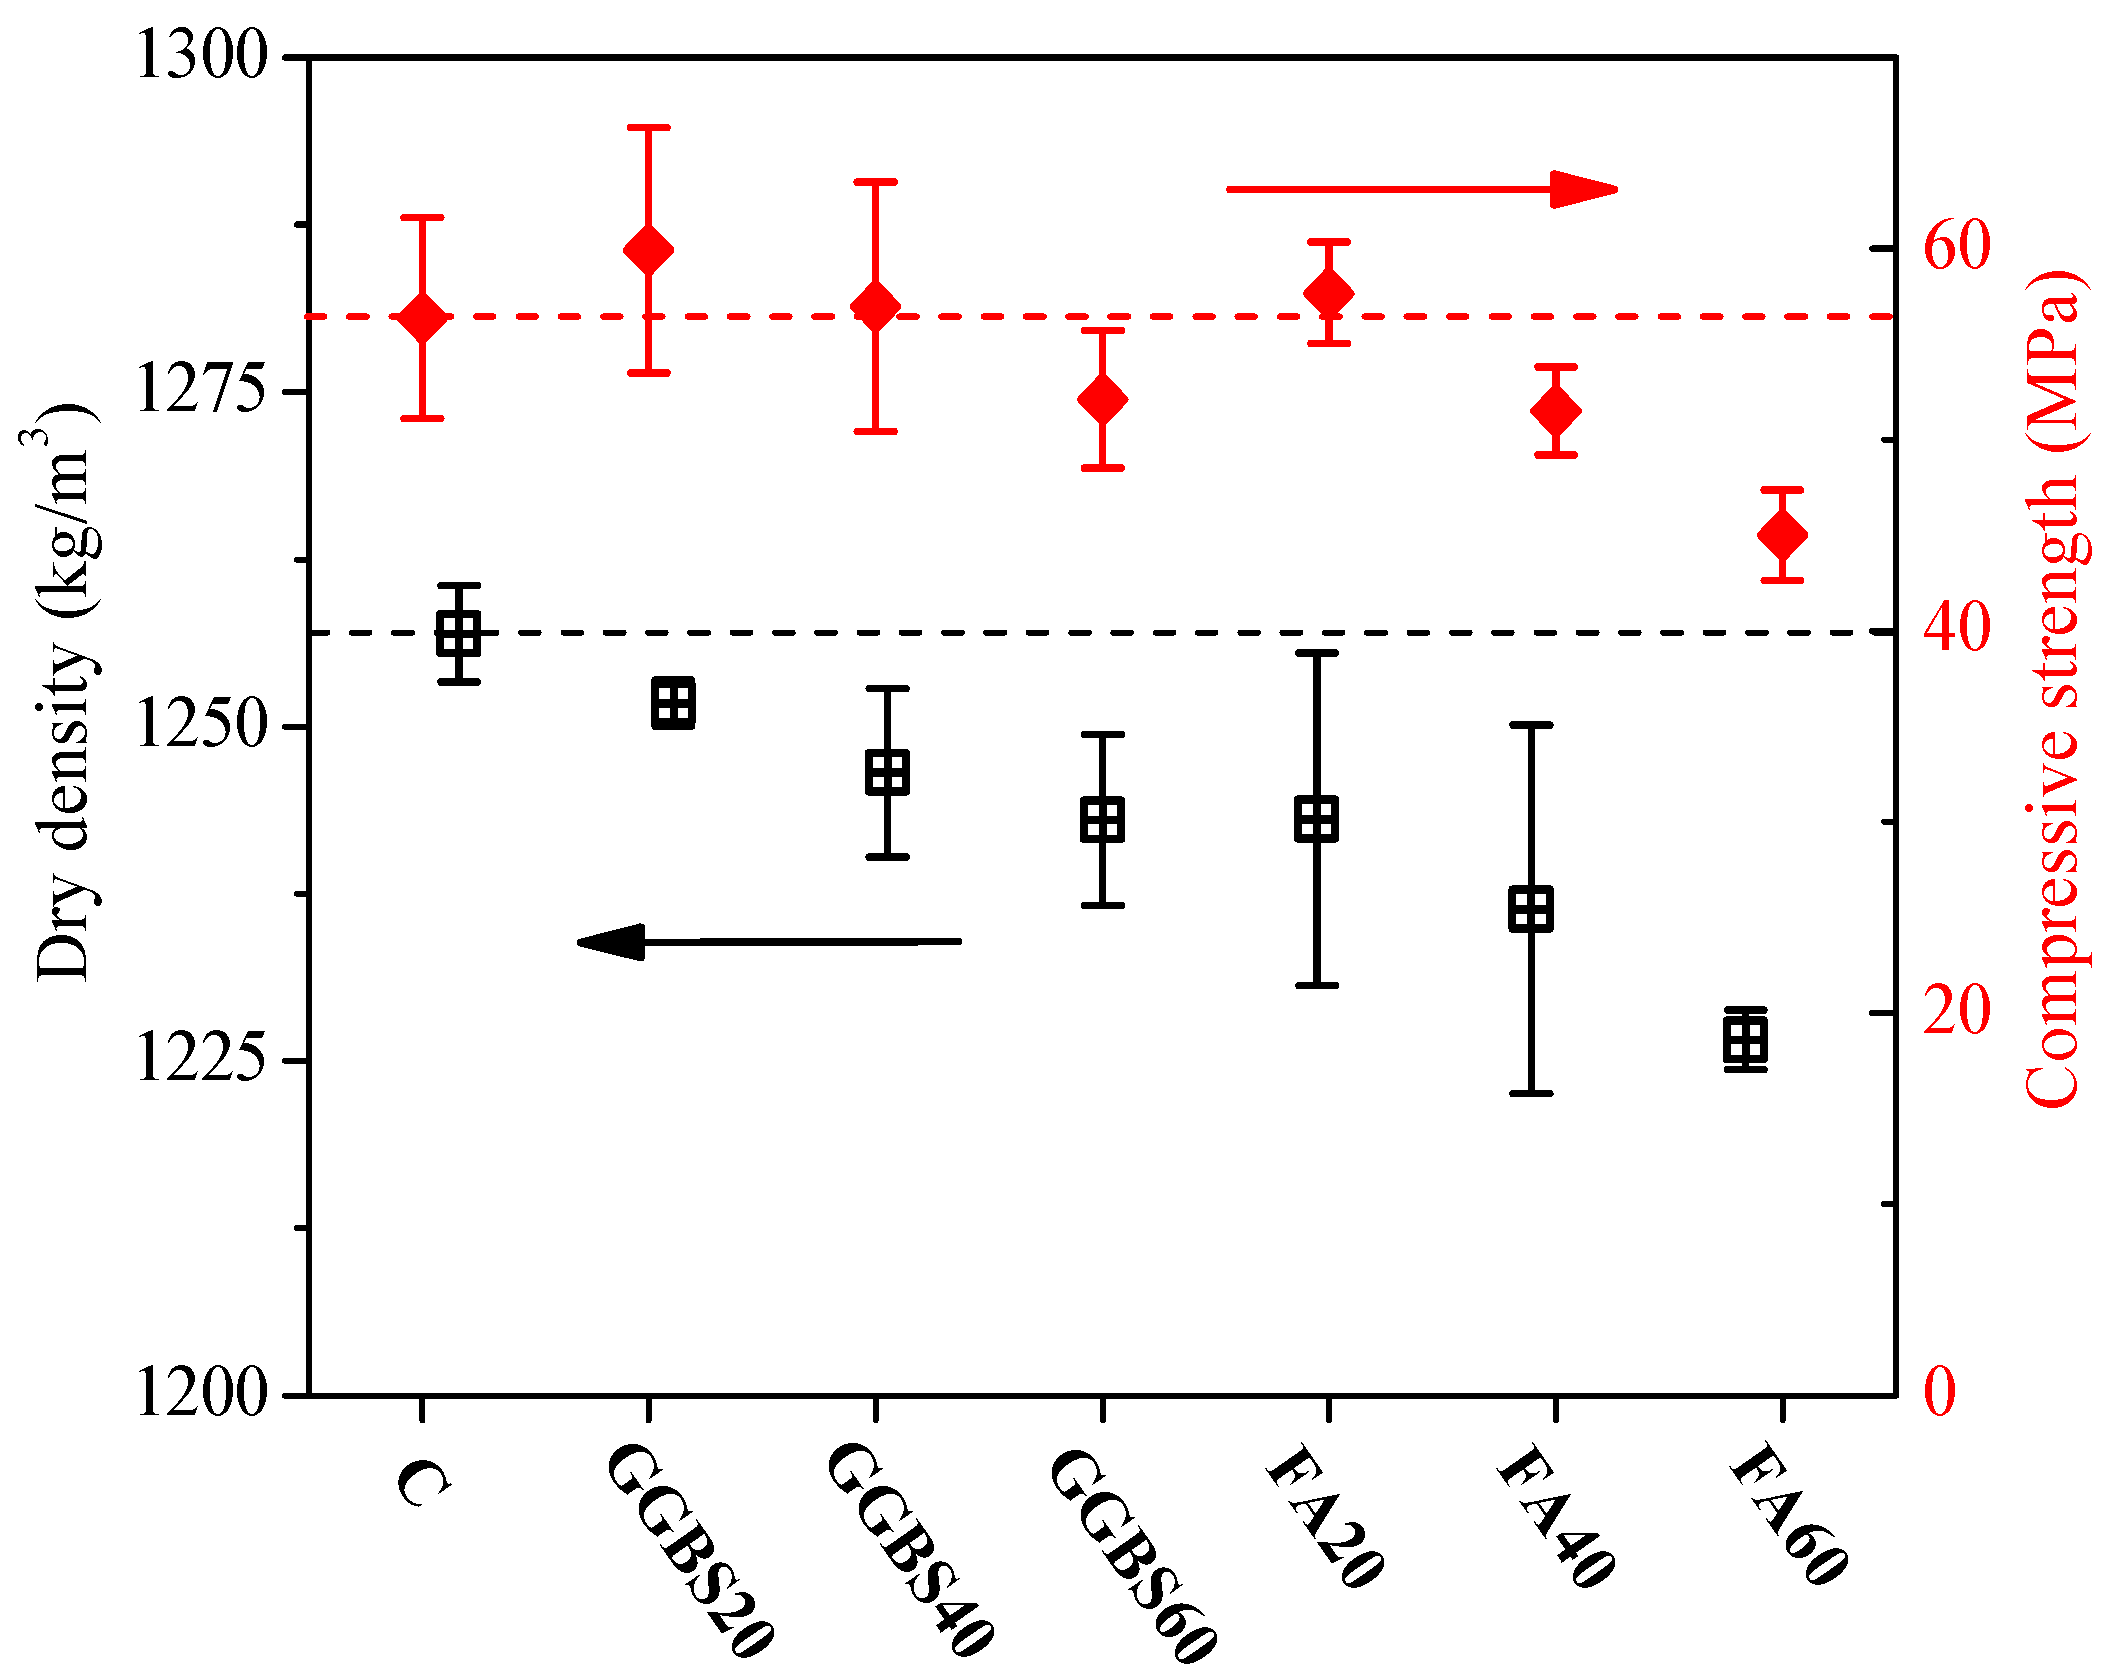
Figure 9 shows the density and 28-day compressive strength of the seven ULHS-ECCs. As can be seen, the density of the seven mixes is between 1225 and 1260 kg/m3 with a corresponding compressive strength of 45 to 60 MPa. The specific strength of ULHS-ECCs (i.e., strength per unit density) in this study is higher than that of ECCs reported in other studies [16,17,18,19,20]. The improved specific strength of ULHS-ECCs is attributed to the incorporation of lightweight FACs and the synergistic effect of the ternary binder system.
As can be seen, the density of the ULHS-ECCs decreases with increasing GGBS (or FA) replacement ratio, even though the reduction is moderate. This is because both GGBS and FA are lighter than cement. The FA substitution has a more pronounced effect than the GGBS substitution due to the lower density of FA than that of GGBS. As for the compressive strength, GGBS substitution up to 40% and FA substitution up to 20% result in enhanced strength as compared to the control. This is due to the synergistic effect of binder materials. Generally, the synergy is attributed to both chemical and physical effects. The chemical effect is mainly the pozzolanic reaction of supplementary cementitious materials (SCMs), which converts portlandite to C-S-H [27]. The formation of an increased amount of hydration products results in the improvement of compressive strength. As for the physical effect, it is plausible that the optimum particle size distribution results in the closest packing of the ternary binder system or smaller initial inter-particle spacing and lower volumetric water-to-binder ratio of the ternary binder system [28], leading to the improvement of compressive strength. At a high replacement ratio, however, the dilution of cement by SCMs results in reduced strength. At the same replacement ratio, ULHS-ECCs with GGBS substitution possess higher compressive strength than those with FA substitution. This is because GGBS possesses higher reactivity than FA. GGBS exhibits obvious hydraulicity in the presence of a small amount of alkalis, while FA is a pozzolan.
3.2. Tensile Strain-Hardening Behavior
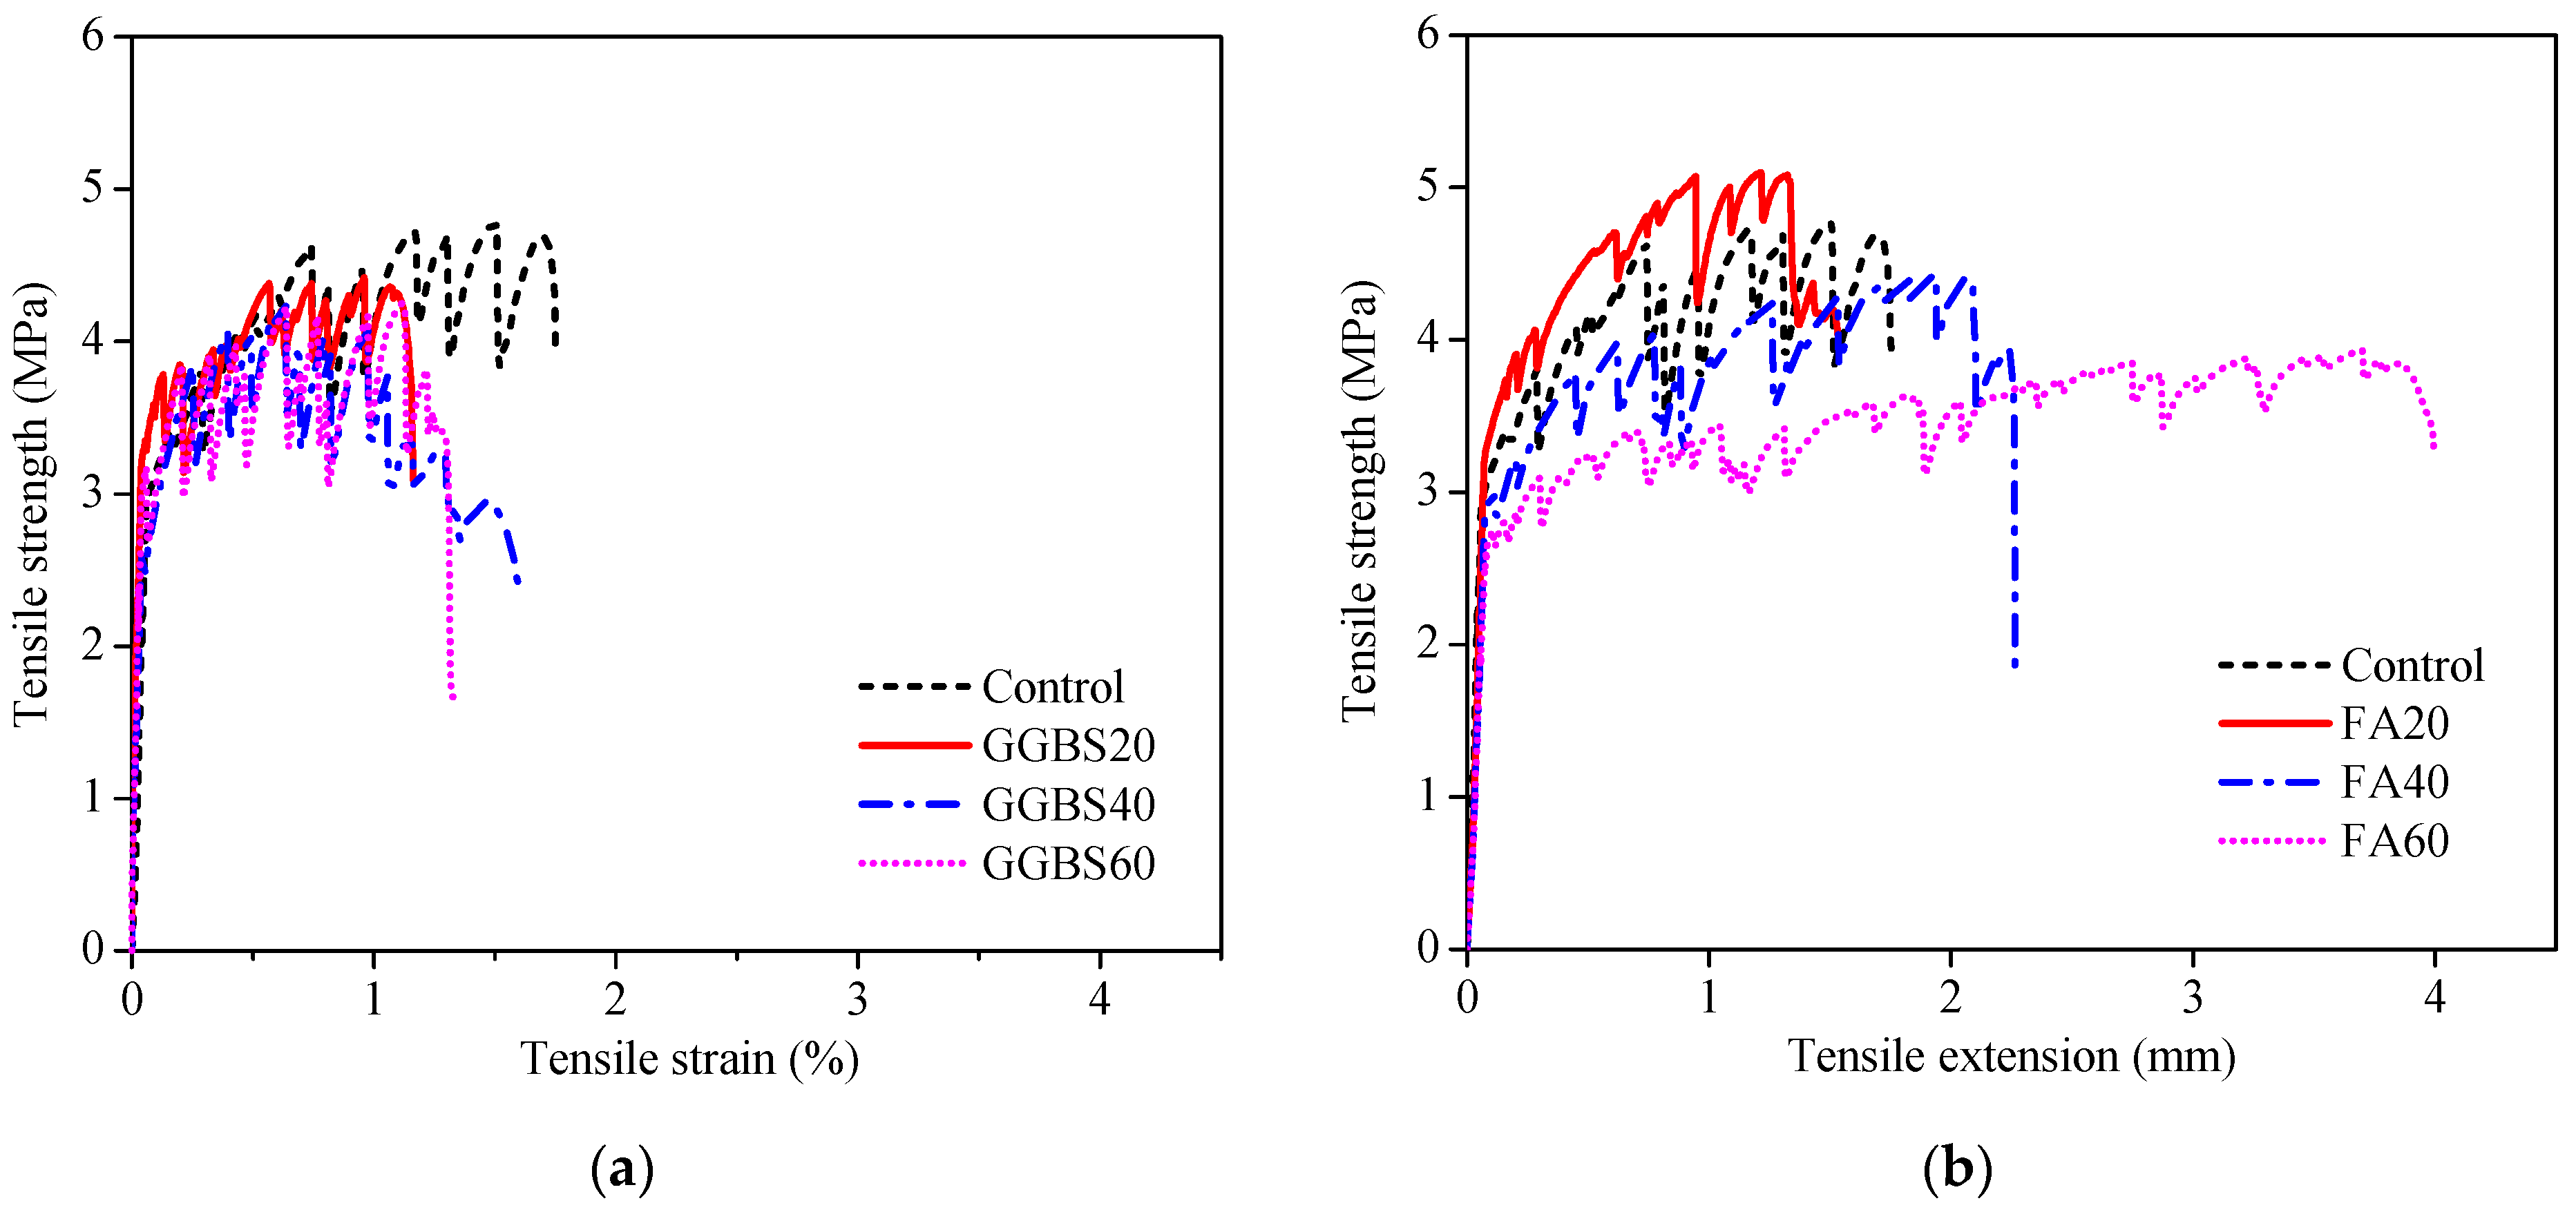
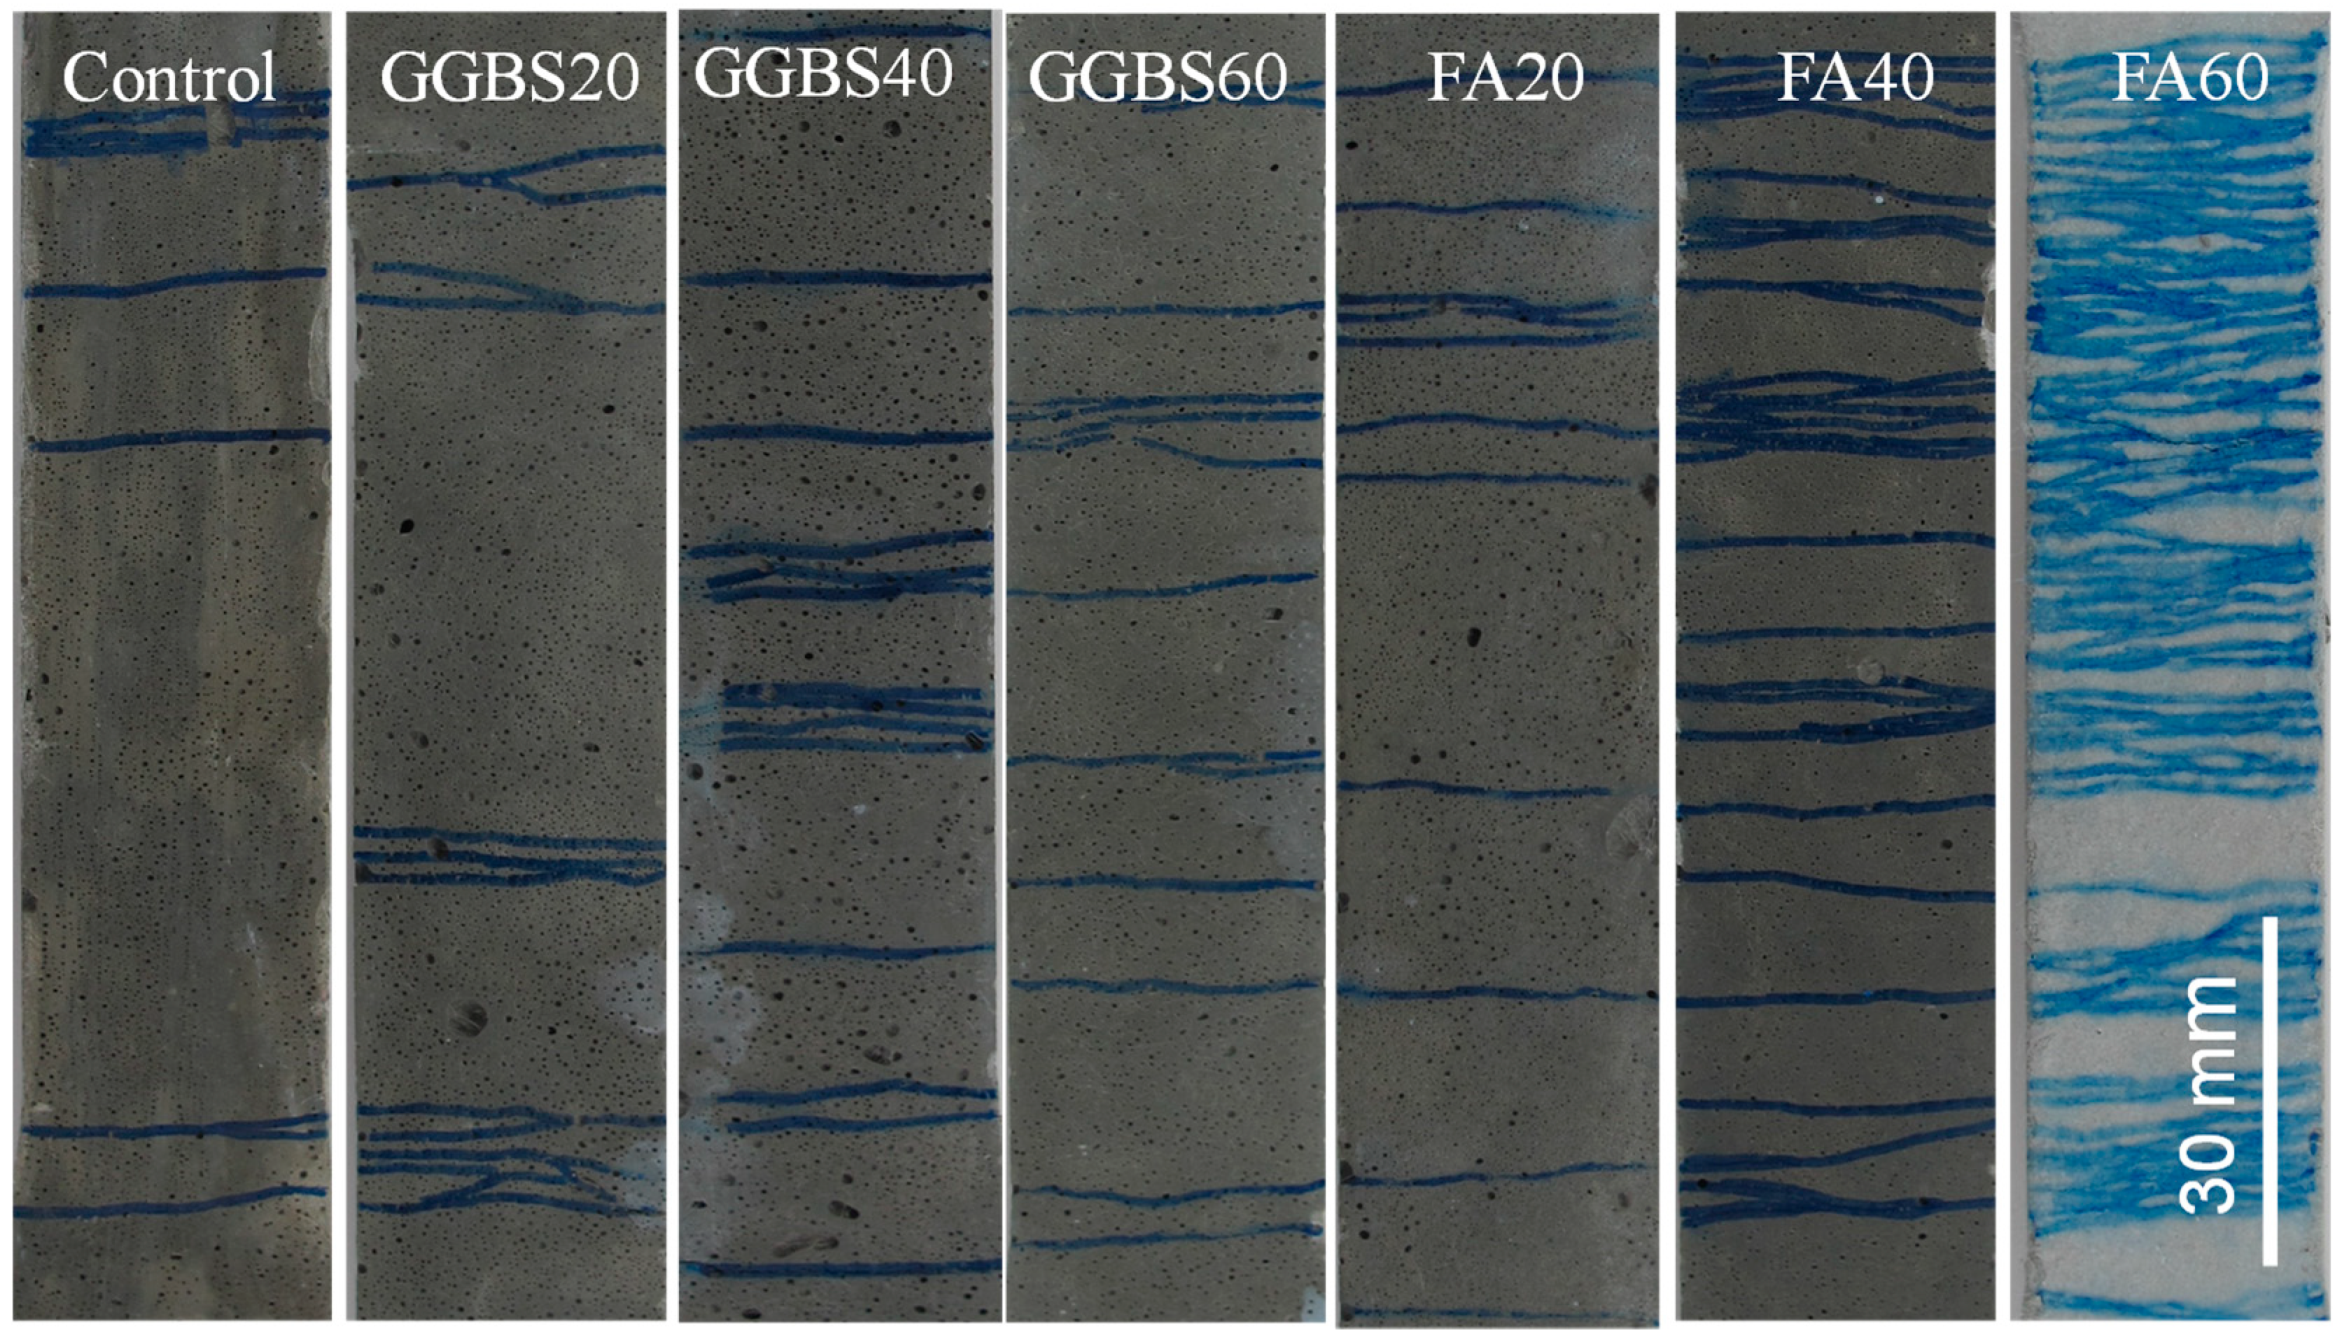
Figure 10 and Figure 11 show the representative uniaxial tensile stress–strain curves of the seven ULHS-ECCs and the corresponding crack patterns, respectively. As can be seen, all ULHS-ECCs exhibit tensile strain-hardening behavior with strain capacity beyond 1% and tensile strength above 4 MPa. Specimens with GGBS substitution generally show lower strain capacity as GGBS20, GGBS40 and GGBS60 possess a similar tensile strain capacity of around 1% and tensile strength of 4.3–4.5 MPa. FA substitution generally results in enhanced tensile strain capacity but reduced tensile strength [13]. For example, the tensile strain capacity and tensile strength of FA60 are 3.8% and 3.9 MPa, respectively.
3.3. Thermal Conductivity
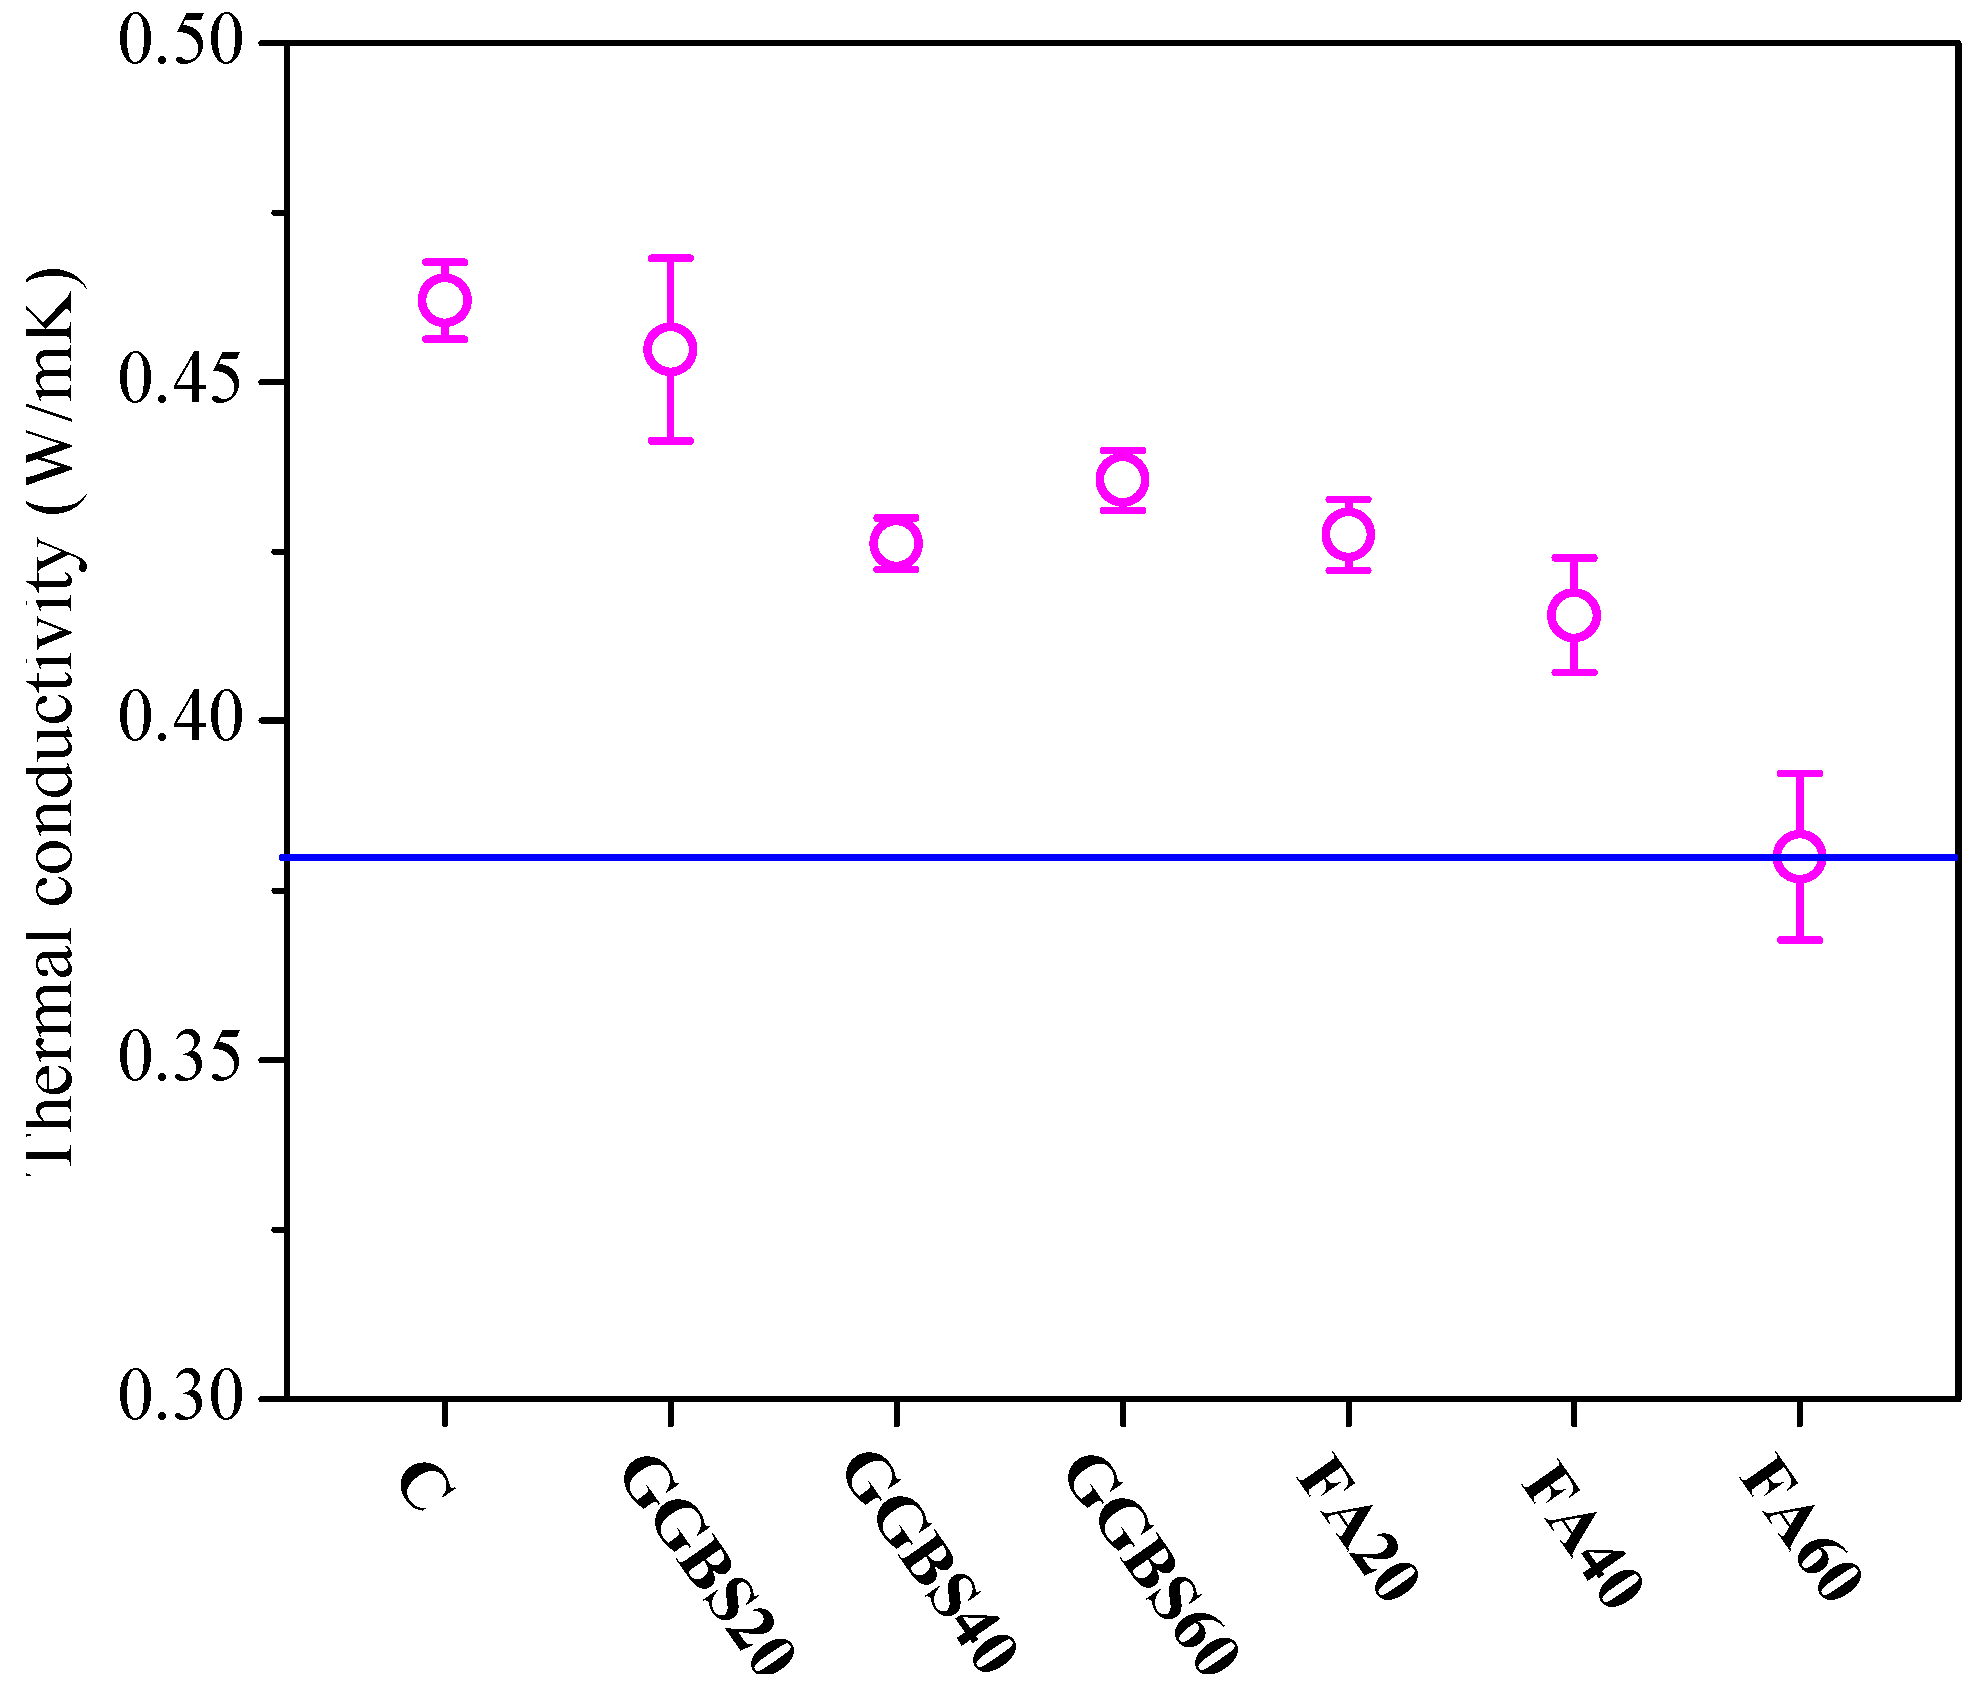
The thermal conductivity of the seven ULHS-ECCs in the current study is in the range of 0.38–0.46 w/mK (Figure 12), which is much lower than that of normal concrete (1.28–1.51 w/mK) and is comparable to the porous clay brick and porous masonry [29,30,31]. The low thermal conductivity of ULHS-ECCs is due to the inclusion of FACs which have a very low thermal conductivity of 0.08 w/mK because of their hollow core-shell structure. As can be seen, GGBS or FA substitution reduces the thermal conductivity of ULHS-ECCs marginally due to the lower thermal conductivity of GGBS and FA when compared to cement. Furthermore, FA substitution shows a more pronounced effect than GGBS substitution. On one hand, the thermal conductivity of FA is lower than that of GGBS. On the other hand, the blended binder systems can possess higher total porosities than typical PC pastes, perhaps due to higher viscosity leading to higher air content [32].
3.4. Water Absorption Rate
Figure 13 shows the typical water absorption–time curve of ULHS-ECCs. As can be seen, the curve has two distinctive stages, i.e., initial absorption and secondary absorption. The initial absorption rate is defined as the slope of the curve for the first 6 h. The secondary absorption rate is defined as the slope of the curve from 1 to 7 d. The slope of the curve is obtained by means of the linear regression analysis. The results of the water absorption rate for all seven ULHS-ECC mixes are summarized in Table 5. As can be seen, the initial absorption rate (10−3 mm/s1/2) is one order higher than that of the secondary absorption rate (10−4 mm/s1/2). This is because the specimens absorb water quickly in the initial stage due to capillary action [33]. Specimens with GGBS or FA substitution show a similar initial absorption rate to the control mix. Nevertheless, the water absorption rate of ULHS-ECCs is much lower than that of normal lightweight concrete (15.2–17.5 mm/min1/2) [33,34]. This is because the ULHS-ECCs in the current study use a ternary binder system with a low water-to-binder ratio of 0.27, and thus the capillary porosity in the matrix is greatly reduced. Furthermore, unlike lightweight aggregates, which are porous, the micro-aggregate FACs used in the current study have a well-defined core-shell structure with a solid shell wall. The FAC particles dispersed in the matrix are not interconnected. Both contribute to the low water absorption rate of ULHS-ECCs.
3.5. Fiber/Matrix Interface Properites
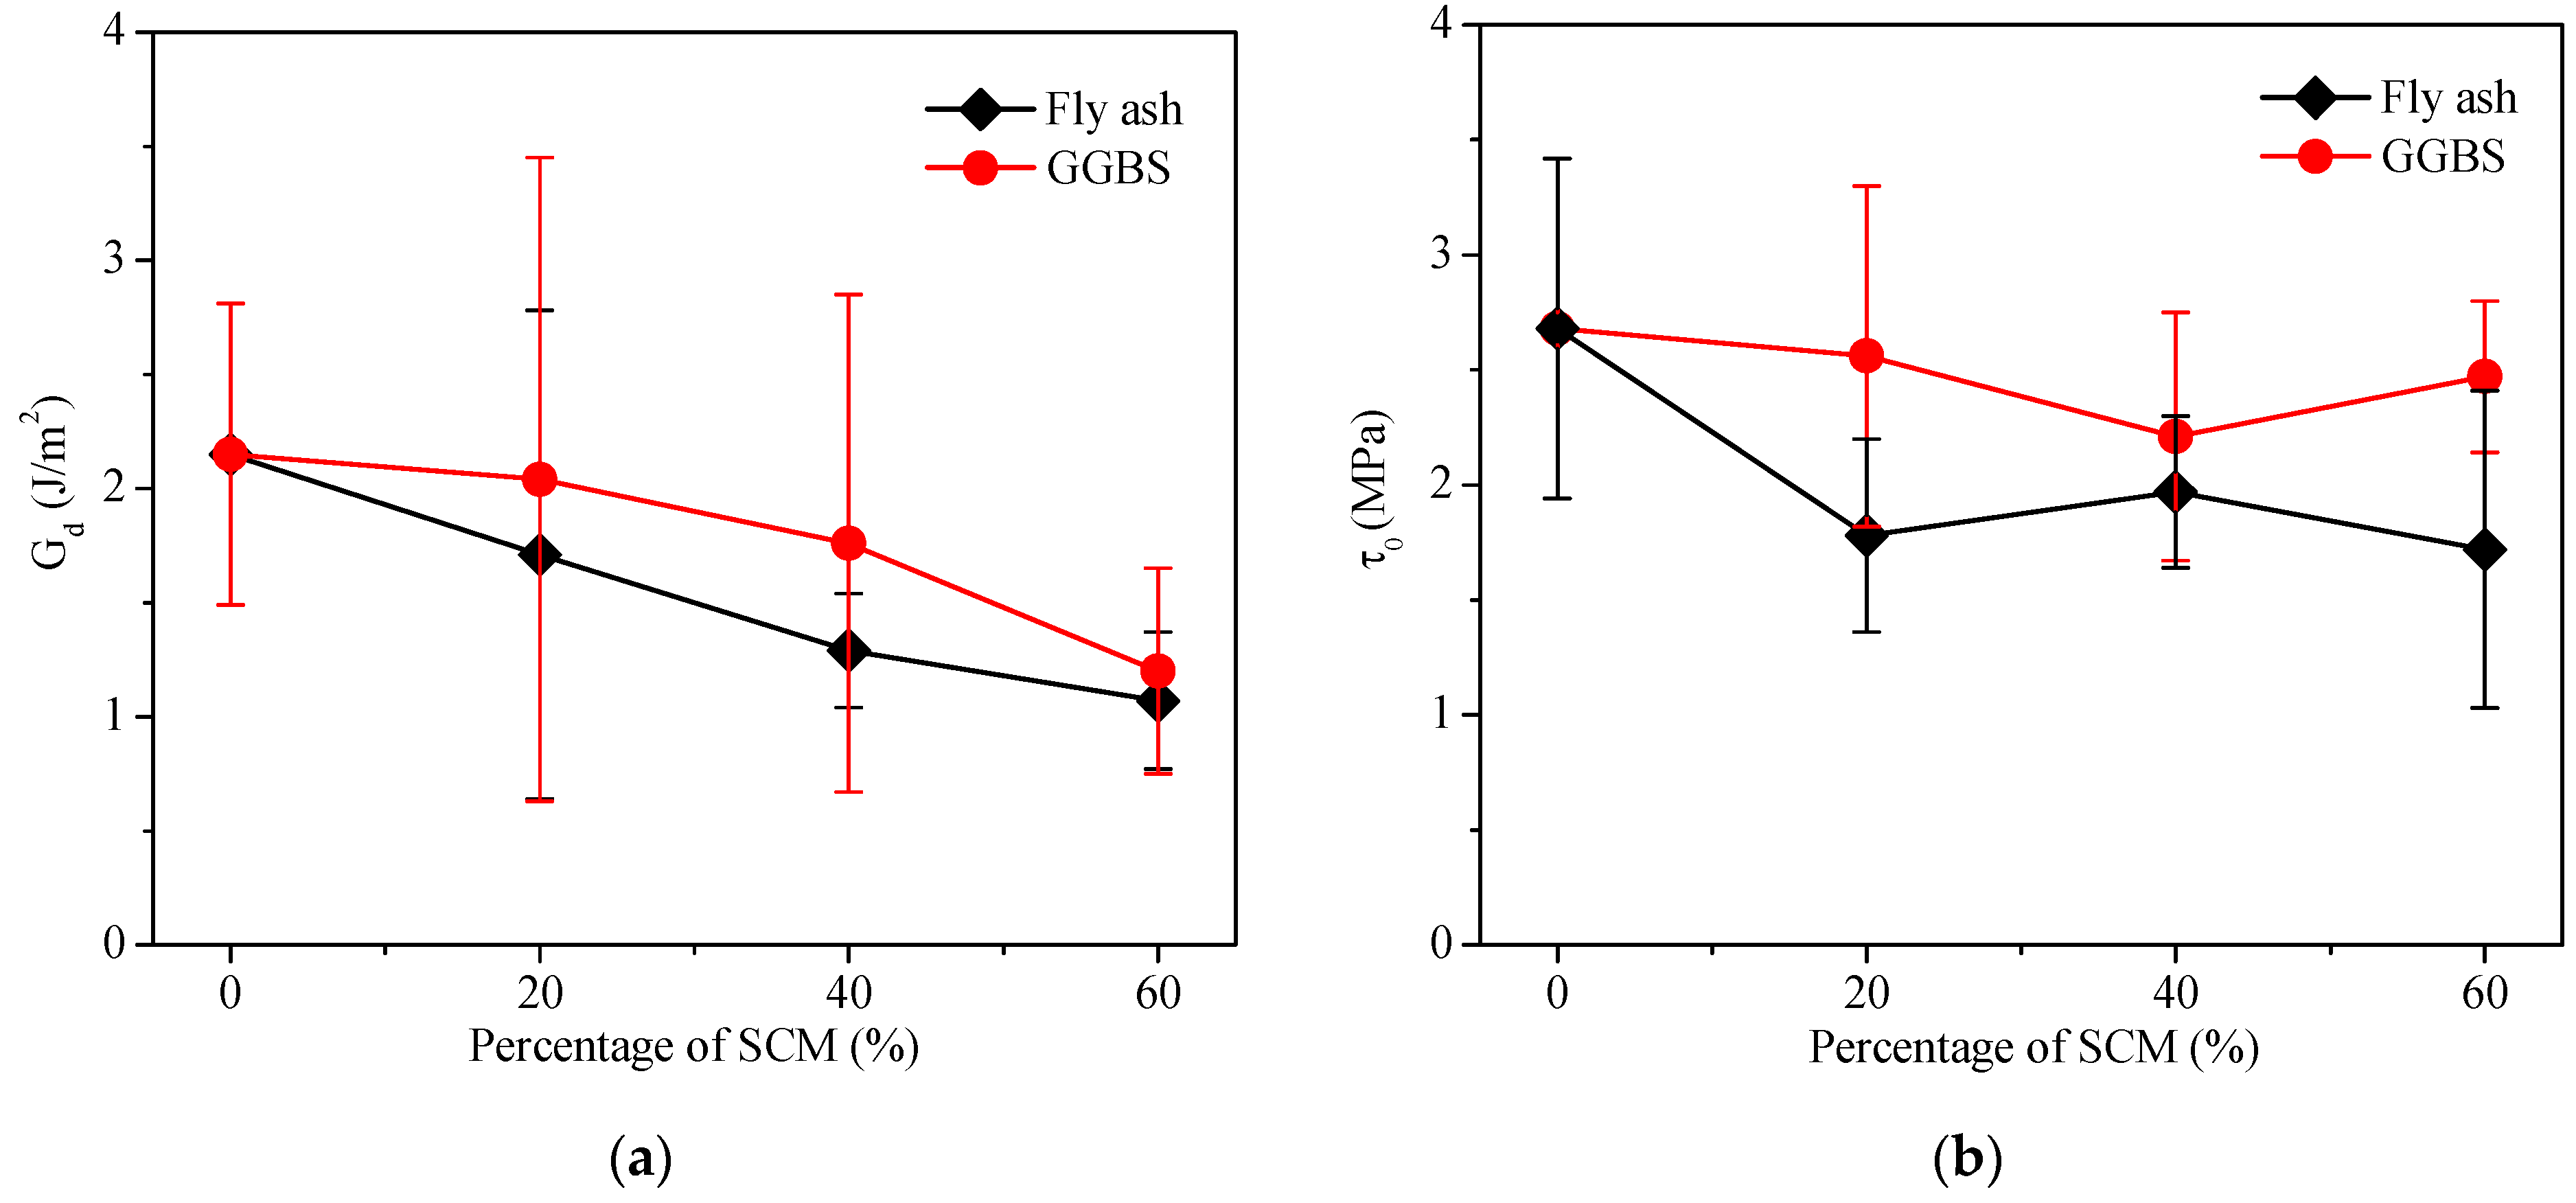
Figure 14 shows the fiber/matrix interface bond of the seven ULHS-ECCs. As can be seen in Figure 14a, the chemical bond between the PVA fiber and lightweight high strength cement matrix is about 2.1 J/m2, which is similar to that of normal ECCs [35]. The chemical bond is attributed to the chemical interaction between the PVA fiber and the surrounding cement matrix. The PVA fiber surface contains a large number of hydroxyl functional groups, which are able to chemically bond with cement hydration products. The chemical bond strength Gd is primarily determined by the chemical structures between the fiber surface and cement matrix. It seems that FAC inclusion has no significant impact on the fiber/matrix interface chemical bond. Furthermore, Gd decreases with increasing GGBS or FA replacement dosage in the matrix. This may be attributed to the dilution effect of GGBS/FA on cement in the ternary binder system, which results in fewer hydration products and reduces the valid chemical interaction between the PVA fiber surface and cement matrix. At the same substitution ratio, the cement–GGBS matrix exhibits a stronger Gd than the cement–FA matrix. This is again due to the higher reactivity of GGBS than that of FA.
As can be seen in Figure 14b, the frictional bond between the PVA fiber and lightweight high strength cement matrix is about 2.0 MPa, which is slightly lower than that of normal ECCs [36]. The frictional bond is attributed to the clamping force from the matrix to the fiber and the interface roughness. Thus, the frictional bond strength is dominated by the water-to-binder ratio and the fiber/matrix interface microstructure, such as fiber surface morphology.
3.6. Matrix Fracture Toughness
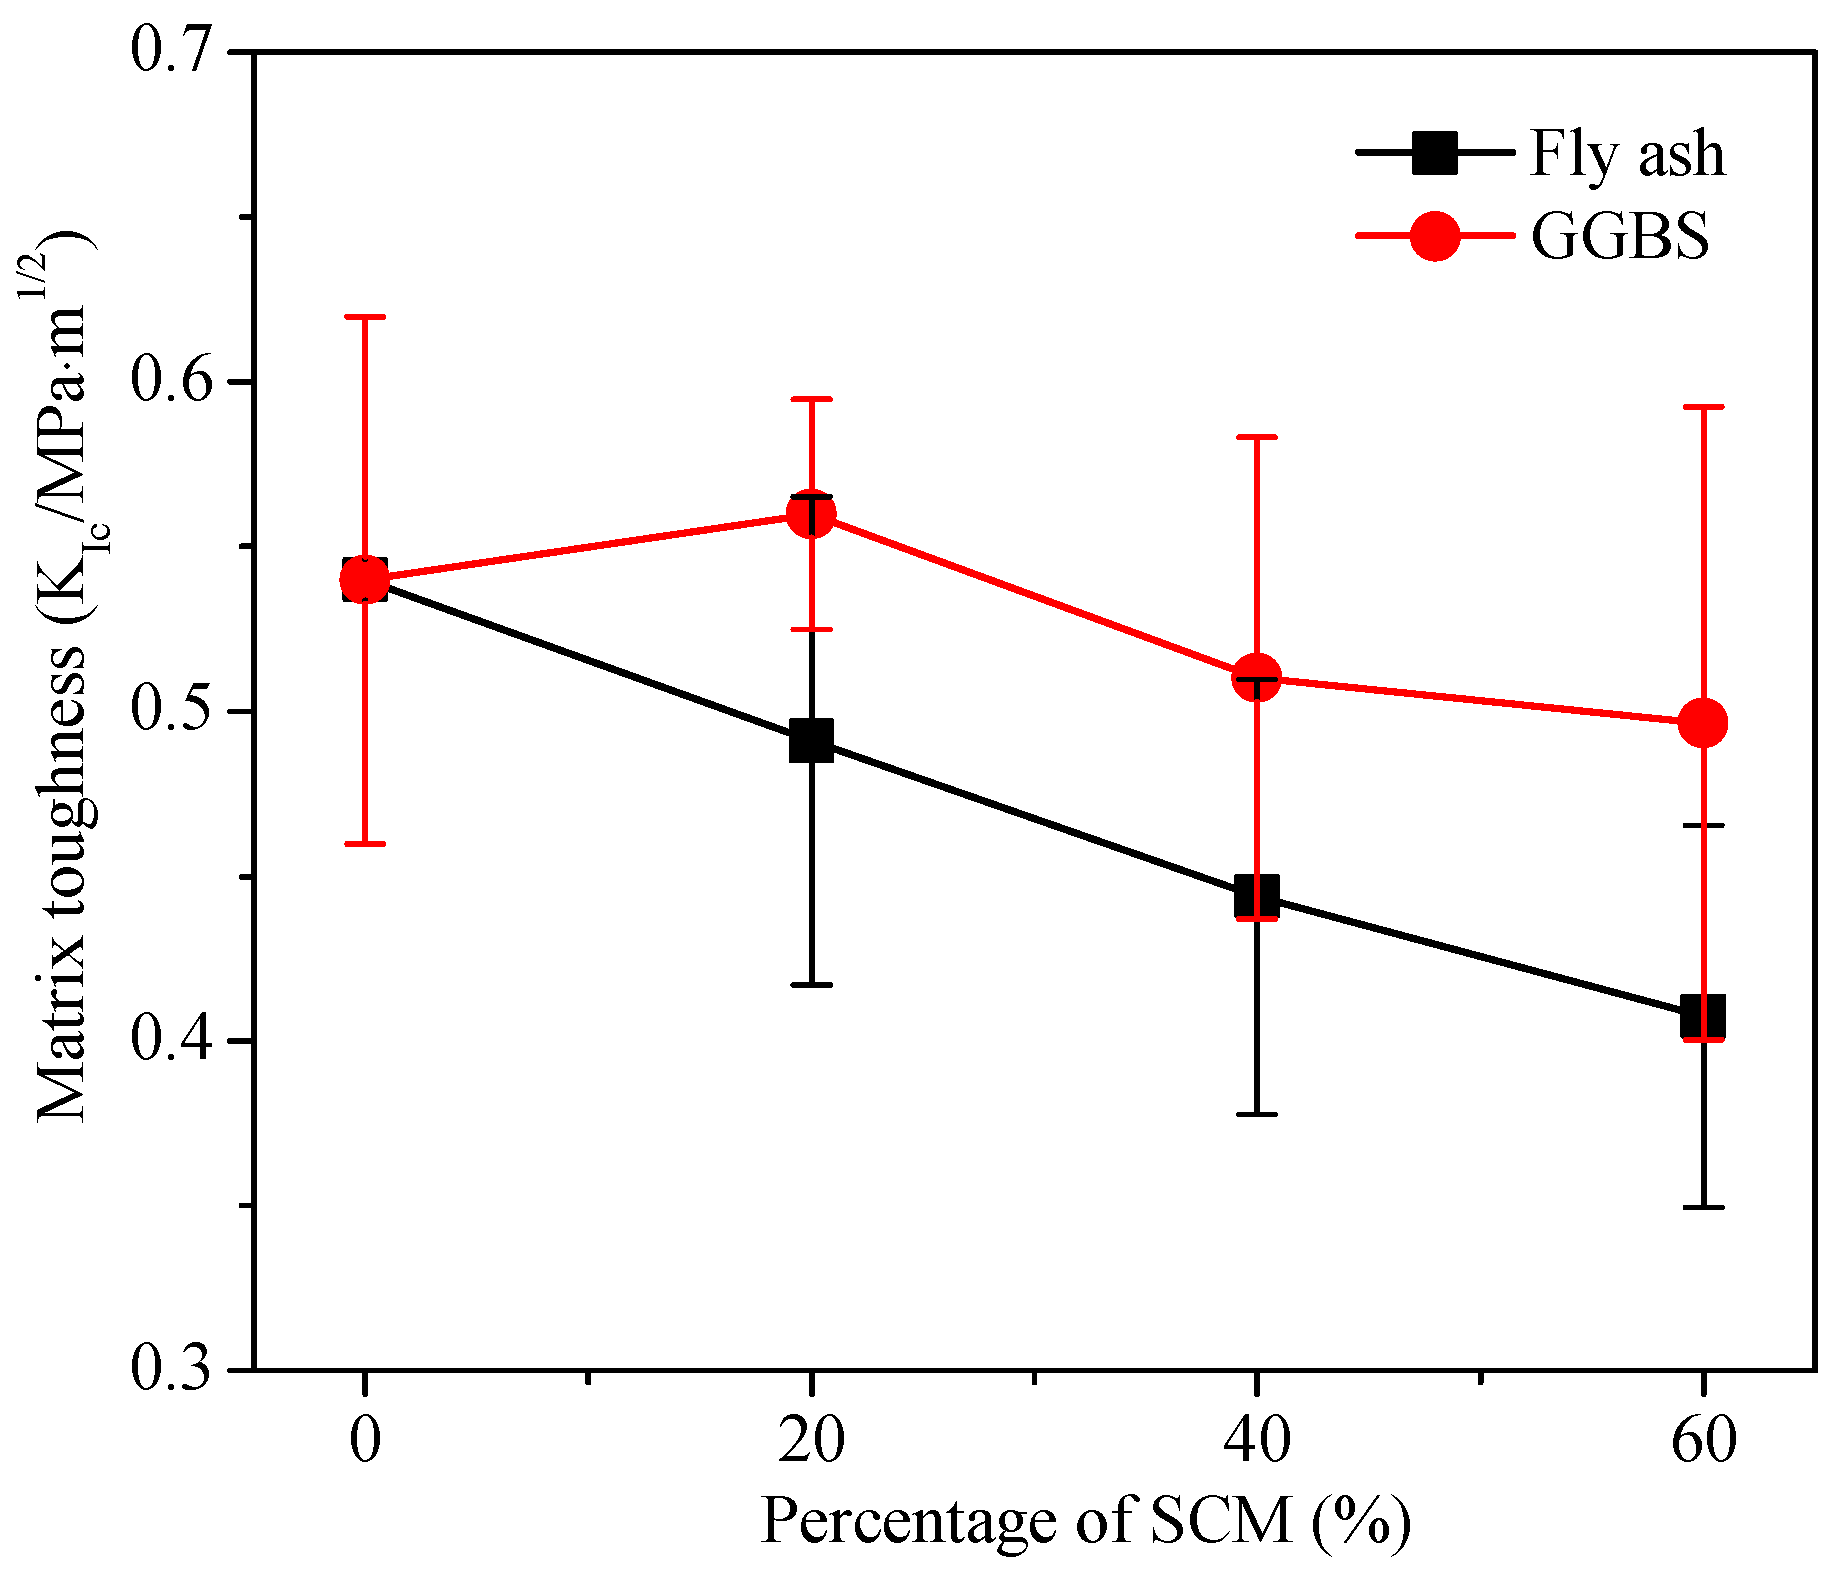
The fracture toughness of the ULHS-ECC matrix is in the range of 0.4–0.55 MPa·m1/2 (Figure 15), which is lower than that of the normal ECC matrix (0.6–0.8 MPa·m1/2) [37]. This is because micro-silica sand in the normal ECC matrix is fully replaced by FACs in the ULHS-ECC matrix. The micro-silica sand induced toughening effects [38] such as crack deflection and microcrack shielding in the normal ECC matrix. Compared to micro-silica sand, however, FACs are weaker than the surrounding matrix and thus cracks usually propagate through the FACs without deflection, and thus the ULHS-ECC matrix possesses a lower fracture toughness. Furthermore, GGBS or FA substitution generally results in reduced matrix fracture toughness. However, the GGBS–cement matrix shows higher fracture toughness than the FA–cement matrix. This is again due to the higher reactivity of GGBS than that of FA.
3.7. Fiber-Bridging Analysis
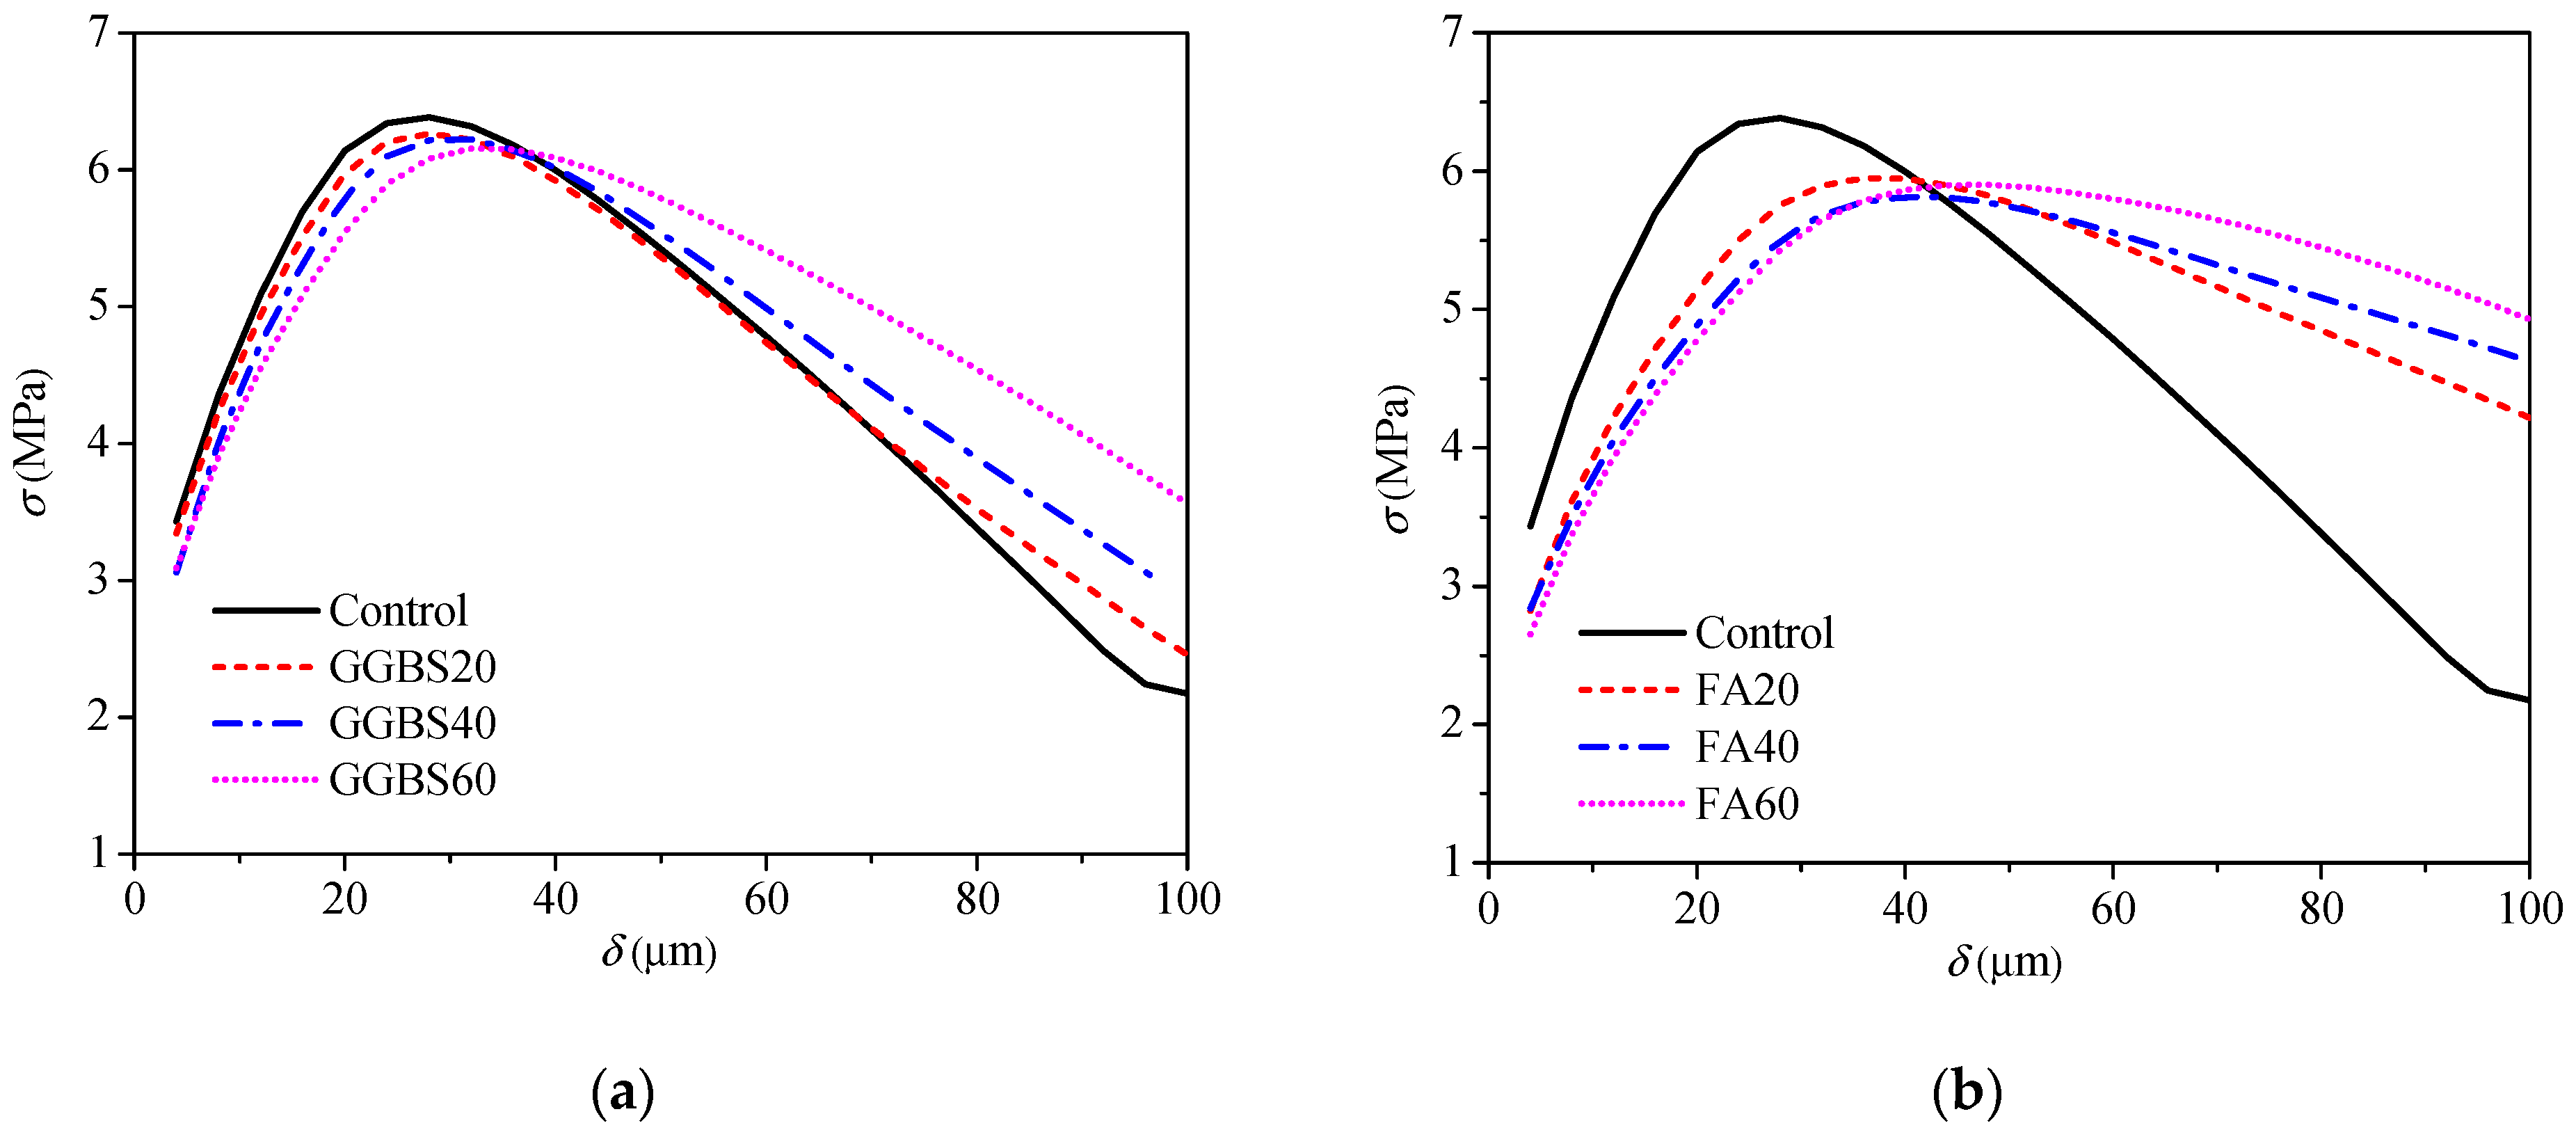
The fiber-bridging curves (σ-δ) of the seven ULHS-ECCs are calculated based on the corresponding micromechanical parameters and are presented in Figure 16. As can be seen, FA substitution generally results in reduced peak bridging strength and increased complimentary energy, while GGBS substitution only causes a slight change in the fiber-bridging curves. Figure 17a plots the crack tip toughness Jtip and the complementary energy J′b of the seven ULHS-ECCs. As can be seen, J′b increases while Jtip decreases with increasing GGBS/FA substitution ratio, and FA substitution has more profound effects on both. Figure 17b further compares the J′b/Jtip ratio of the seven ULHS-ECCs. It is found that the J′b/Jtip ratio of all mixtures is larger than 1, which indicates that seven ULHS-ECCs satisfied the strain-hardening criterion [39]. However, ECCs with a larger margin between J′b and Jtip should have a better chance to achieve saturated multiple cracking and robust tensile strain-hardening behavior. Kanda and Li [39] suggest a J′b/Jtip > 3 is necessary to achieve saturated multiple cracking. As can be seen, the J′b/Jtip ratio generally increases with increasing GGBS/FA substitution ratio, and FA substitution has more profound effects. With J′b/Jtip > 3, specimens with high FA substitution should exhibit more saturated multiple cracking with higher strain capacity, which coincides with the test results shown in Figure 10.
4. Conclusions
In this study, ULHS-ECCs are developed via the use of lightweight fillers and ternary binder systems. The mechanical, physical, and micromechanical properties of the resulting ULHS-ECCs are investigated and discussed. ULHS-ECCs with a density below 1300 kg/m3, a compressive strength beyond 60 MPa, a tensile strain capacity above 1%, a thermal conductivity below 0.5 w/mK, and a low water absorption rate can be realized. The inclusion of lightweight fillers and the variation in proportioning of the ternary binder can lead to a change in micromechanical properties, including the matrix fracture toughness and the fiber/matrix interface properties. As a result, the tensile strain-hardening performance of the ULHS-ECCs can be altered.
Author Contributions
Conceptualization, E.-H.Y.; methodology, Z.C.; formal analysis, Z.C. and J.L.; investigation, Z.C. and J.L.; resources, E.-H.Y.; data curation, Z.C. and J.L.; writing—original draft preparation, Z.C. and J.L.; writing—review and editing, E.-H.Y.; supervision, E.-H.Y.; project administration, E.-H.Y.; funding acquisition, E.-H.Y. All authors have read and agreed to the published version of the manuscript.
Funding
The authors would like to acknowledge the financial support from the NTUitive Gap Fund (NGF-2020-08-013) for the completion of this research project.
Conflicts of Interest
The authors declare no conflict of interest.
References
- Patel, S.K.; Majhi, R.K.; Satpathy, H.P.; Nayak, A.N. Durability and microstructural properties of lightweight concrete manufactured with fly ash cenosphere and sintered fly ash aggregate. Constr. Build. Mater. 2019, 226, 579–590. [Google Scholar] [CrossRef]
- Hanif, A.; Lu, Z.; Cheng, Y.; Diao, S.; Li, Z. Effects of Different Lightweight Functional Fillers for Use in Cementitious Composites. Int. J. Concr. Struct. Mater. 2017, 1191, 99–113. [Google Scholar] [CrossRef] [Green Version]
- Youm, K.; Moon, J.; Cho, J.; Kim, J. Experimental study on strength and durability of lightweight aggregate concrete containing silica fume. Constr. Build. Mater. 2016, 114, 517–527. [Google Scholar] [CrossRef]
- Maaloufa, Y.; Mounir, S.; Khabbazi, A.; Kettar, J.; Khaldoun, A. Thermal characterization of materials based on clay and granular, cork or expanded perlite. Energy Procedia 2015, 74, 1150–1161. [Google Scholar] [CrossRef] [Green Version]
- Narayanan, N.; Ramamurthy, K. Structure and properties of aerated concrete, a review. Cem. Concr. Compos. 2000, 22, 321–329. [Google Scholar] [CrossRef]
- Domagala, L. Modification of properties of structural lightweight concrete with steel fibers. J. Civ. Eng. Manag. 2011, 17, 36–44. [Google Scholar] [CrossRef]
- Balendran, R.V.; Zhou, F.P.; Nadeem, A.; Leung, A.Y.T. Influence of steel fibers on strength and ductility of normal and lightweight high strength concrete. Build. Environ. 2002, 37, 1361–1367. [Google Scholar] [CrossRef]
- Cui, H.Z.; Lo, T.Y.; Memon, S.A.; Xu, W. Effect of lightweight aggregates on the mechanical properties and brittleness of lightweight aggregate concrete. Constr. Build. Mater. 2012, 35, 149–158. [Google Scholar] [CrossRef]
- Zhu, H.; Wan, K.T.; Satekenova, E.; Zhang, D.; Leung, C.K.Y.; Kim, J. Development of lightweight strain hardening cementitious composite for structural retrofit and energy efficiency improvement of unreinforced masonry housings. Constr. Build. Mater. 2018, 167, 791–812. [Google Scholar] [CrossRef] [Green Version]
- Wang, J.; Chia, K.; Liew, J.; Zhang, M. Flexural performance of fiber-reinforced ultra lightweight cement composites with low fiber content. Cem. Concr. Compos. 2013, 43, 39–47. [Google Scholar] [CrossRef]
- Li, V.C.; Wu, H.; Chan, Y. Effect of plasma treatment of polyethylene fibers on interface and cementitious composite properties. J. Am. Ceram. Soc. 1996, 79, 700–704. [Google Scholar] [CrossRef] [Green Version]
- Lepech, M.D.; Li, V.C. Large-scale processing of engineered cementitious composites. ACI Mater. J. 2008, 105, 358–366. [Google Scholar]
- Yang, E.; Yang, Y.; Li, V.C. Use of high volumes of fly ash to improve ECC mechanical properties and material greenness. ACI Mater. J. 2007, 104, 303–311. [Google Scholar]
- Li, L.; Cai, Z.; Yu, K.; Zhang, Y.X.; Ding, Y. Performance-based design of all-grade strain hardening cementitious composites with compressive strengths from 40 MPa to 120 MPa. Cem. Concr. Compos. 2019, 97, 202–217. [Google Scholar] [CrossRef]
- Zhou, J.; Qian, S.; Beltran, M.G.S.; Ye, G.; Breugel, K.; Li, V.C. Development of engineered cementitious composites with limestone powder and blast furnace slag. Mater. Struct. 2010, 43, 803–814. [Google Scholar] [CrossRef] [Green Version]
- Jin, Q.; Li, V.C. Development of lightweight engineered cementitious composite for durability enhancement of tall concrete wind towers. Cem. Concr. Compos. 2019, 96, 87–94. [Google Scholar] [CrossRef]
- Wang, S.; Li, V.C. Lightweight engineered cementitious composites (ECC). In Proceedings of the 4th International RILEM Workshop on High Performance Fiber Reinforced Cement Composites (HPFRCC 4), Ann Arbor, MI, USA, 16–18 June 2003; RILEM Publications: Paris, France, 2003; pp. 379–390. [Google Scholar]
- Huang, X.; Ranade, R.; Zhang, Q.; Ni, W.; Li, V.C. Mechanical and thermal properties of green lightweight engineered cementitious composites. Constr. Build. Mater. 2013, 48, 954–960. [Google Scholar] [CrossRef]
- Zhou, Y.; Xi, B.; Sui, L.; Zheng, S.; Xing, F.; Li, L. Development of high strain-hardening lightweight engineered cementitious composites: Design and performance. Cem. Concr. Compos. 2019, 104, 103370. [Google Scholar] [CrossRef]
- Zhang, Z.; Yuvarai, A.; Di, J.; Qian, S. Matrix design of light weight, high strength, high ductility ECC. Constr. Build. Mater. 2019, 210, 188–197. [Google Scholar] [CrossRef]
- Papatzani, S.; Paine, K. A step by step methodology for building sustainable cementitious matrices. Appl. Sci. 2020, 10, 2955. [Google Scholar] [CrossRef]
- Papatzani, S.; Grammatikos, S.; Paine, K. Permeable nanomontmorillonite and fibre reinforced cementitious binders. Materials 2019, 12, 3245. [Google Scholar] [CrossRef] [Green Version]
- Piggott, M.R. The single-fibre pull-out method: Its advantages, interpretation and experimental realization. Compos. Interfaces 1993, 1, 211–223. [Google Scholar] [CrossRef]
- Kim, J.; Kim, J.; Ha, G.J.; Kim, Y.Y. Tensile and fiber dispersion performance of ECC (engineered cementitious composites) produced with ground granulated blast furnace slag. Cem. Concr. Res. 2007, 37, 1096–1105. [Google Scholar] [CrossRef]
- Li, J.; Yang, E. Macroscopic and microstructural properties of engineered cementitious composites incorporating recycled concrete fines. Cem. Concr. Compos. 2017, 78, 33–42. [Google Scholar] [CrossRef]
- Li, J.; Weng, J.; Yang, E. Stochastic model of tensile behavior of strain hardening cementitious composites. Cem. Concr. Res. 2019, 124, 105856. [Google Scholar] [CrossRef]
- Lothenbach, B.; Scrivener, K.; Hooton, R.D. Supplementary cementitious materials. Cem. Concr. Res. 2011, 41, 1244–1256. [Google Scholar] [CrossRef]
- Radlinski, M.; Olek, J. Investigation into the synergistic effects in ternary cementitious systems containing portland cement, fly ash and silica fume. Cem. Cocnr. Compos. 2012, 34, 452–459. [Google Scholar] [CrossRef]
- Sutcu, M.; Ozturk, S.; Yalamac, E.; Gencel, O. Effect of olive mill waste addition on the properties of porous fired clay bricks using Taguchi method. J. Environ. Manag. 2016, 181, 185–192. [Google Scholar] [CrossRef] [PubMed]
- Dondi, M.; Mazzanti, F.; Principi, P.; Rainondo, M.; Zanarini, G. Thermal conductivity of clay bricks. J. Mater. Civ. Eng. 2004, 16, 8–14. [Google Scholar] [CrossRef] [Green Version]
- Santos, P.; Martins, C.; Julio, E. Enhancement of the thermal performance of perforated clay brick walls through the addition of industrial nano-crystalline aluminium sludge. Constr. Build. Mater. 2015, 101, 227–238. [Google Scholar] [CrossRef]
- Ouellet, S.; Bussière, B.; Aubertin, M.; Benzaazoua, M. Microstructural evolution of cemented paste backfill: Mercury intrusion porosimetry test results. Cem. Concr. Res. 2007, 37, 1654–1665. [Google Scholar] [CrossRef]
- Liu, X.; Chia, K.; Zhang, M. Water absorption, permeability, and resistance to chloride-ion penetration of lightweight aggregate concrete. Constr. Build. Mater. 2011, 25, 335–343. [Google Scholar] [CrossRef]
- Bogas, J.A.; Gomes, M.G.; Real, S. Capillary absorption of structural lightweight aggregate concrete. Mater. Struct. 2015, 48, 2869–2883. [Google Scholar] [CrossRef]
- Yang, E.; Wang, S.; Yang, Y.; Li, V.C. Fiber bridging constitutive law of engineered cementitious composites. J. Adv. Cocnr. Tech. 2008, 6, 181–193. [Google Scholar] [CrossRef] [Green Version]
- Li, V.C.; Wu, C.; Wang, S.X.; Ogawa, A.; Saito, T. Interface tailoring for strain-hardening polyvinyl alcohol -Engineered cementitious composite (PVA-ECC). ACI Mater. J. 2002, 99, 463–472. [Google Scholar]
- Wang, S.X.; Li, V.C. Engineered cementitious composites with high volume fly ash. ACI Mater. J. 2007, 104, 233–241. [Google Scholar]
- Li, V.C.; Maalej, M. Toughening in cement based composites, Part I: Cement, mortar and Concrete. Cem. Concr. Compos. 1996, 18, 223–237. [Google Scholar] [CrossRef]
- Kanda, T.; Li, V.C. A new micromechanics design theory for pseudo strain hardening cementitious composite. ASCE J. Eng. Mech. 1999, 125, 373–381. [Google Scholar] [CrossRef] [Green Version]
Figure 1.
Morphology of (a) cement; (b) GGBS; (c) FA; and (d) SF.

Figure 2.
(a) Morphology of FAC particles; and (b) their hollow core-shell structure.

Figure 3.
Test apparatus for the direct tensile test.

Figure 4.
Appearance of Kapton-insulated Hot Disk sensor.

Figure 5.
(a) Specimen and (b) test apparatus for single fiber pullout test.

Figure 6.
Typical single fiber pullout load–displacement curve.

Figure 7.
(a) Specimen and (b) test apparatus for wedge split test.

Figure 8.
Typical wedge split load–CMOD curve.

Figure 9.
Density and compressive strength of seven ULHS-ECCs in the current study.

Figure 10.
Typical tensile stress–strain curves of ULHS-ECCs with (a) GGBS; and (b) FA substitutions.
Figure 10.
Typical tensile stress–strain curves of ULHS-ECCs with (a) GGBS; and (b) FA substitutions.

Figure 11.
Typical crack patterns of ULHS-ECCs in the current study.

Figure 12.
Thermal conductivity of the seven ULHS-ECCs in the current study.

Figure 13.
Typical water absorption vs. time curve of ULHS-ECCs.

Figure 14.
(a) Chemical bond strength, Gd and (b) frictional bond strength, τ0 as a function of dosage of SCM.
Figure 14.
(a) Chemical bond strength, Gd and (b) frictional bond strength, τ0 as a function of dosage of SCM.

Figure 15.
Matrix toughness of ULHS-ECCs as a function of dosage of SCM.

Figure 16.
Predicted fiber-bridging stress versus crack opening curve of ULHS-ECCs: (a) GGBS; (b) FA.
Figure 16.
Predicted fiber-bridging stress versus crack opening curve of ULHS-ECCs: (a) GGBS; (b) FA.

Figure 17.
(a) Crack tip toughness Jtip and complementary energy Jb’ of all mixtures; (b) Toughness ratio as a function of GGBS/FA replace ratio for all mixtures.
Figure 17.
(a) Crack tip toughness Jtip and complementary energy Jb’ of all mixtures; (b) Toughness ratio as a function of GGBS/FA replace ratio for all mixtures.


Table 1.
Chemical compositions of raw materials in wt. %.
| Oxides | Cement | FA | GGBS | SF | FAC |
|---|---|---|---|---|---|
| SiO2 | 22.9 | 58.6 | 34.8 | >85% | 58.0 |
| Fe2O3 | 2.6 | 4.7 | - | - | 2.0–3.8 |
| Al2O3 | 3.7 | 30.4 | - | - | 35.0 |
| CaO | 65.9 | 1.2 | 37.7 | - | 1.1 |
| TiO2 | - | 2.0 | - | - | 1.0 |
| MgO | 1.2 | 0.8 | 10.9 | - | - |
| LOI | - | 3.8 | 0.18 | <5% | 0.8 |
Table 2.
Physical properties of FAC.
| Bulk Density | True Density | Thermal Conductivity | Strength | Melting Point |
|---|---|---|---|---|
| g/cm3 | g/cm3 | W/mK | MPa | °C |
| 0.4 | 0.85 | 0.08 | 17.2 | 1600 |
Table 3.
Physical and geometrical properties of polyvinyl alcohol (PVA) fibers.
| Length mm | Diameter μm | Young’s Modulus | Elongation | Tensile Strength MPa | Density |
|---|---|---|---|---|---|
| GPa | % | g/cm3 | |||
| 12 | 39–44 | 42 | 7 | 1600 | 1.3 |
Table 4.
Mix proportion of ULHS-ECCs, kg/m3.
| Mix ID | Cement | FA | GGBS | SF | FAC | Water | SP | Fiber |
|---|---|---|---|---|---|---|---|---|
| Control | 828 | - | - | 72 | 378 | 243 | 7 | 26 |
| GGBS20 | 658 | - | 164 | 71 | 375 | 241 | 5 | 26 |
| GGBS40 | 490 | - | 327 | 71 | 373 | 240 | 4 | 26 |
| GGBS60 | 324 | - | 487 | 71 | 371 | 238 | 4 | 26 |
| FA20 | 652 | 163 | - | 71 | 372 | 239 | 7 | 26 |
| FA40 | 482 | 321 | - | 70 | 367 | 236 | 6 | 26 |
| FA60 | 316 | 475 | - | 69 | 361 | 232 | 6 | 26 |
Table 5.
Initial and secondary absorption rates of ULHS-ECCs.
| Mix ID | Initial Absorption Rate Si, mm/s1/2 | Secondary Absorption Rate Ss, mm/s1/2 |
|---|---|---|
| Control | 3.0 × 10⁻³ | 5.1 × 10⁻⁴ |
| GGBS20 | 2.8 × 10⁻³ | 5.1 × 10⁻⁴ |
| GGBS40 | 2.8 × 10⁻³ | 7.7 × 10⁻⁴ |
| GGBS60 | 3.0 × 10⁻³ | 6.8 × 10⁻⁴ |
| FA20 | 2.6 × 10⁻³ | 4.7 × 10⁻⁴ |
| FA40 | 2.9 × 10⁻³ | 4.9 × 10⁻⁴ |
| FA60 | 2.7 × 10⁻³ | 7.5 × 10⁻⁴ |
Publisher’s Note: MDPI stays neutral with regard to jurisdictional claims in published maps and institutional affiliations. |
© 2021 by the authors. Licensee MDPI, Basel, Switzerland. This article is an open access article distributed under the terms and conditions of the Creative Commons Attribution (CC BY) license (https://creativecommons.org/licenses/by/4.0/).
Share and Cite
MDPI and ACS Style
Chen, Z.; Li, J.; Yang, E.-H. Development of Ultra-Lightweight and High Strength Engineered Cementitious Composites. J. Compos. Sci. 2021, 5, 113. https://doi.org/10.3390/jcs5040113
AMA Style
Chen Z, Li J, Yang E-H. Development of Ultra-Lightweight and High Strength Engineered Cementitious Composites. Journal of Composites Science. 2021; 5(4):113. https://doi.org/10.3390/jcs5040113
Chicago/Turabian StyleChen, Zhitao, Junxia Li, and En-Hua Yang. 2021. "Development of Ultra-Lightweight and High Strength Engineered Cementitious Composites" Journal of Composites Science 5, no. 4: 113. https://doi.org/10.3390/jcs5040113