Accuracy of Pulse Wave Velocity Predicting Cardiovascular and All-Cause Mortality. A Systematic Review and Meta-Analysis

 ,
,  , ,
, ,  , and
, and
Abstract
:1. Introduction
2. Methods
2.1. Literature Search
2.2. Selection Criteria
2.3. Data Extraction and Quality Assessment
2.4. Statistical Analysis and Data Synthesis
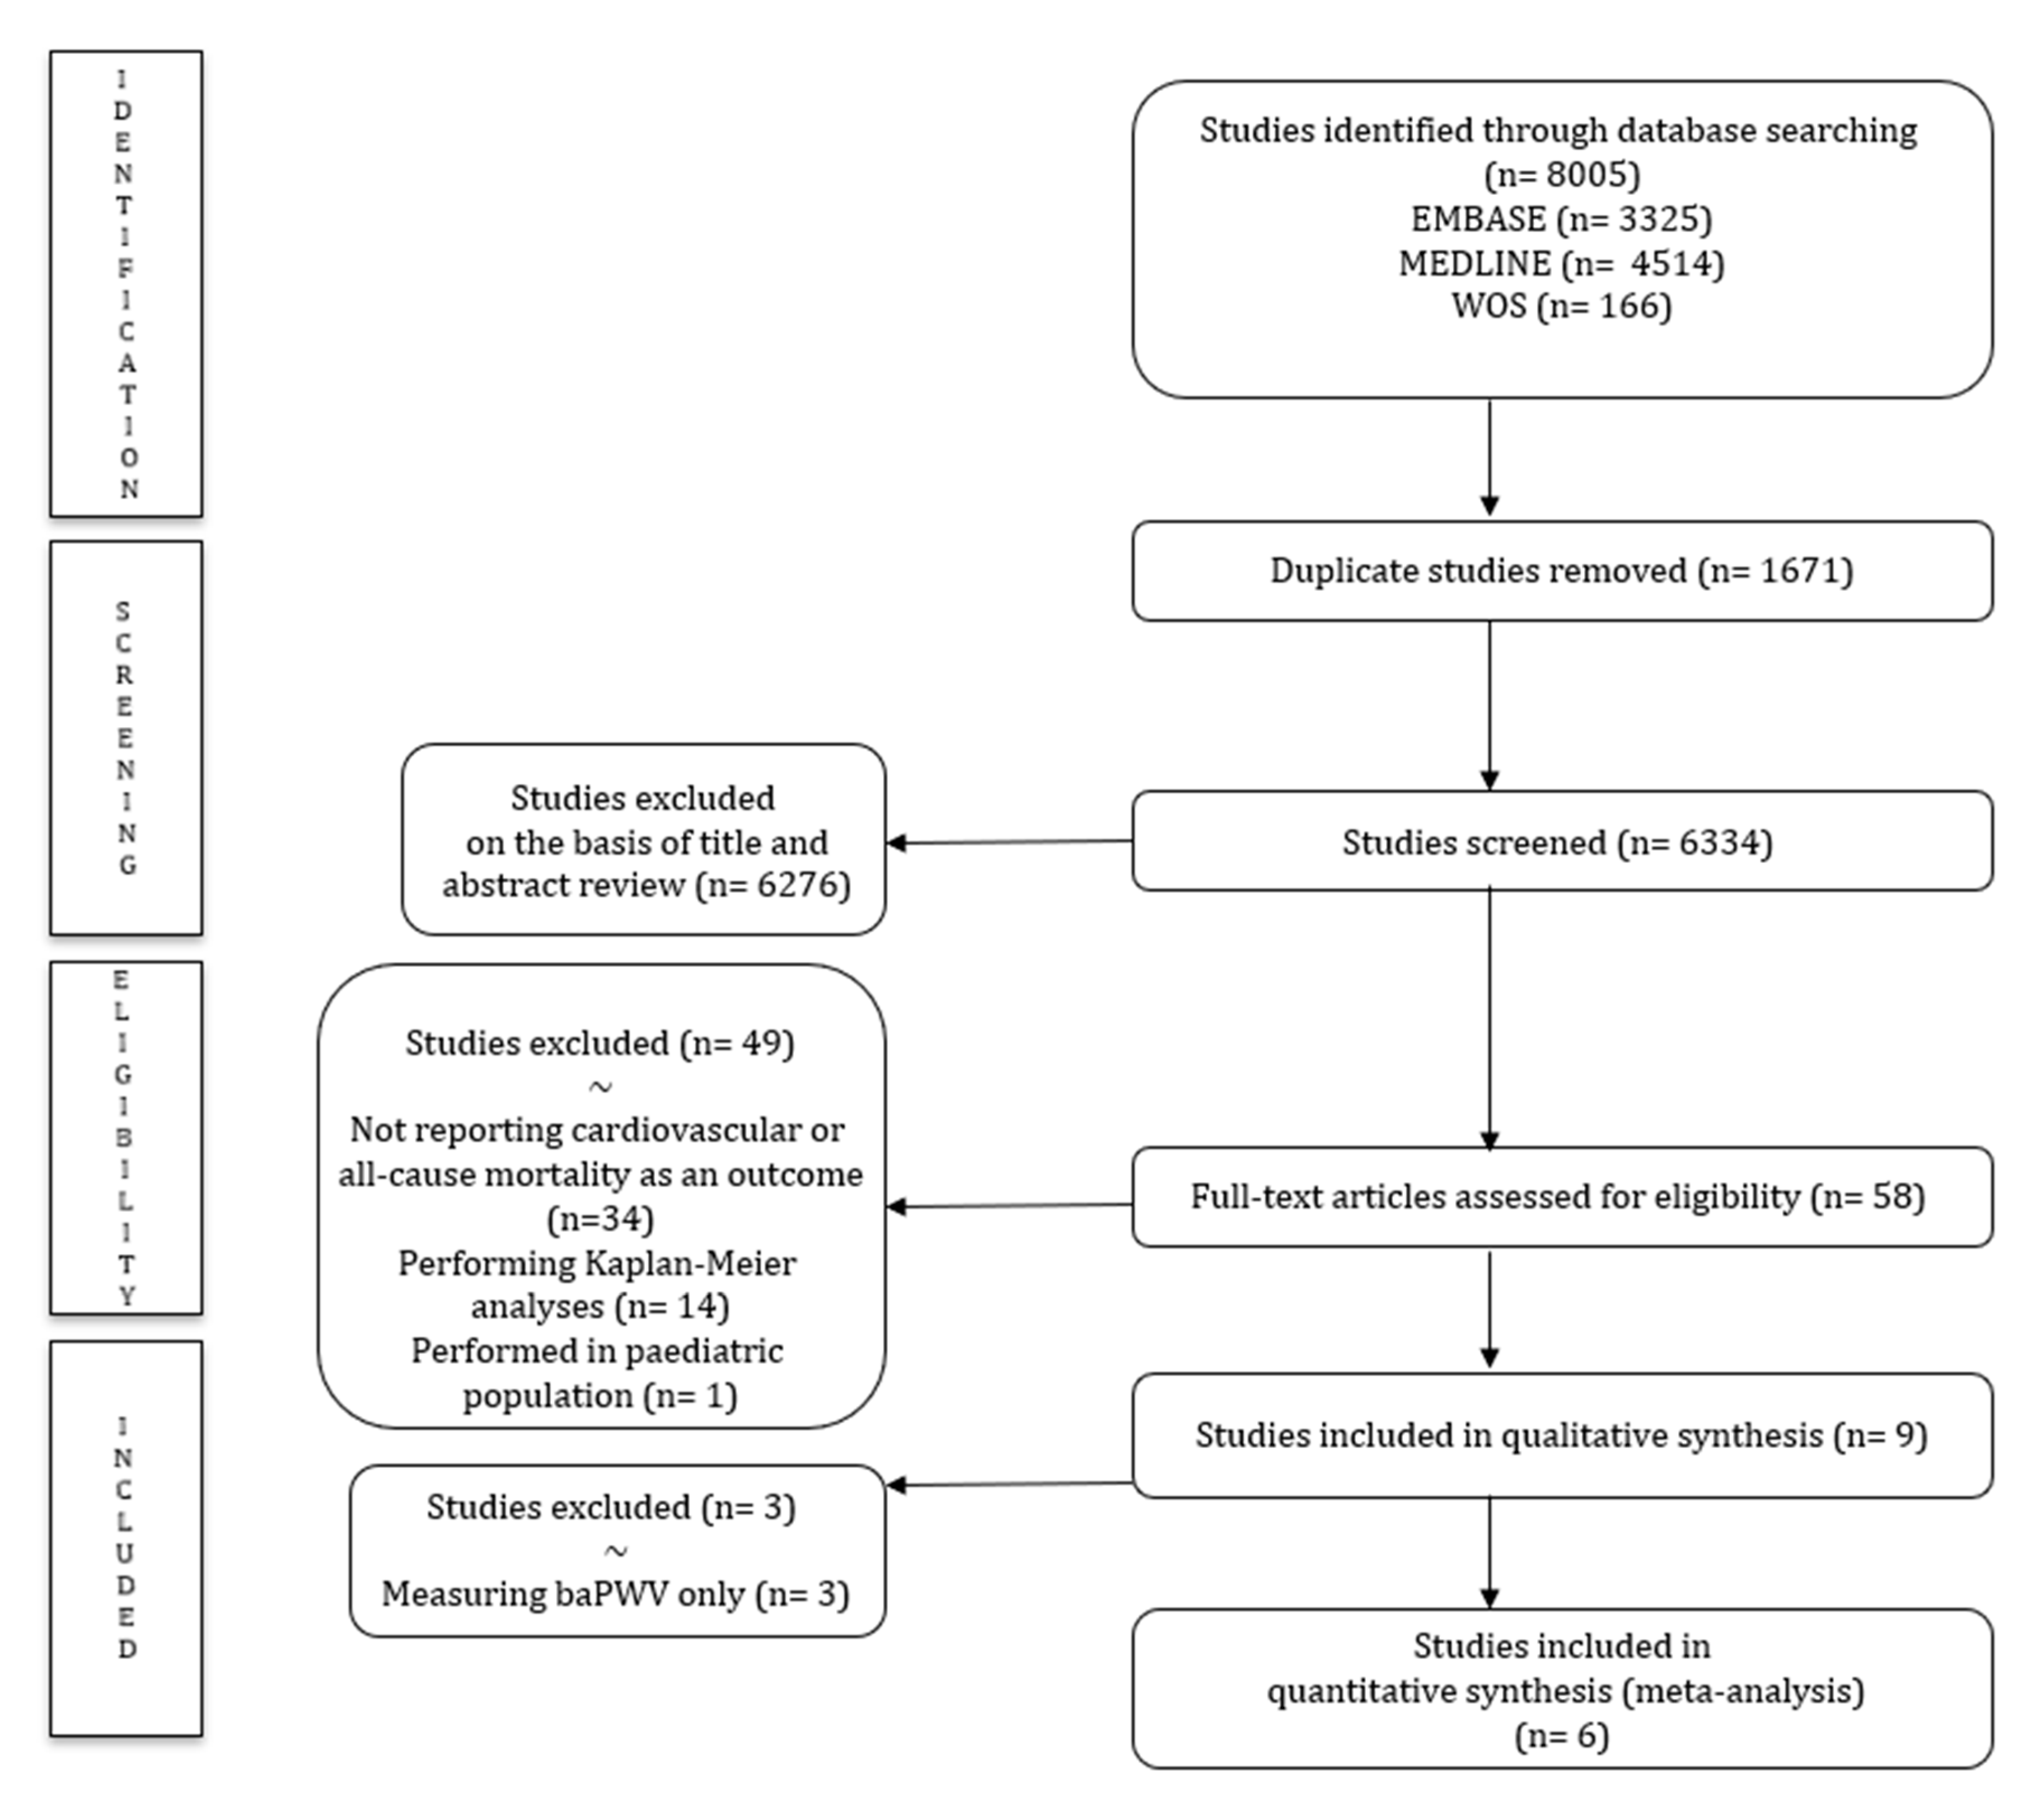
3. Results
3.1. Baseline Characteristics
3.2. Risk of Bias
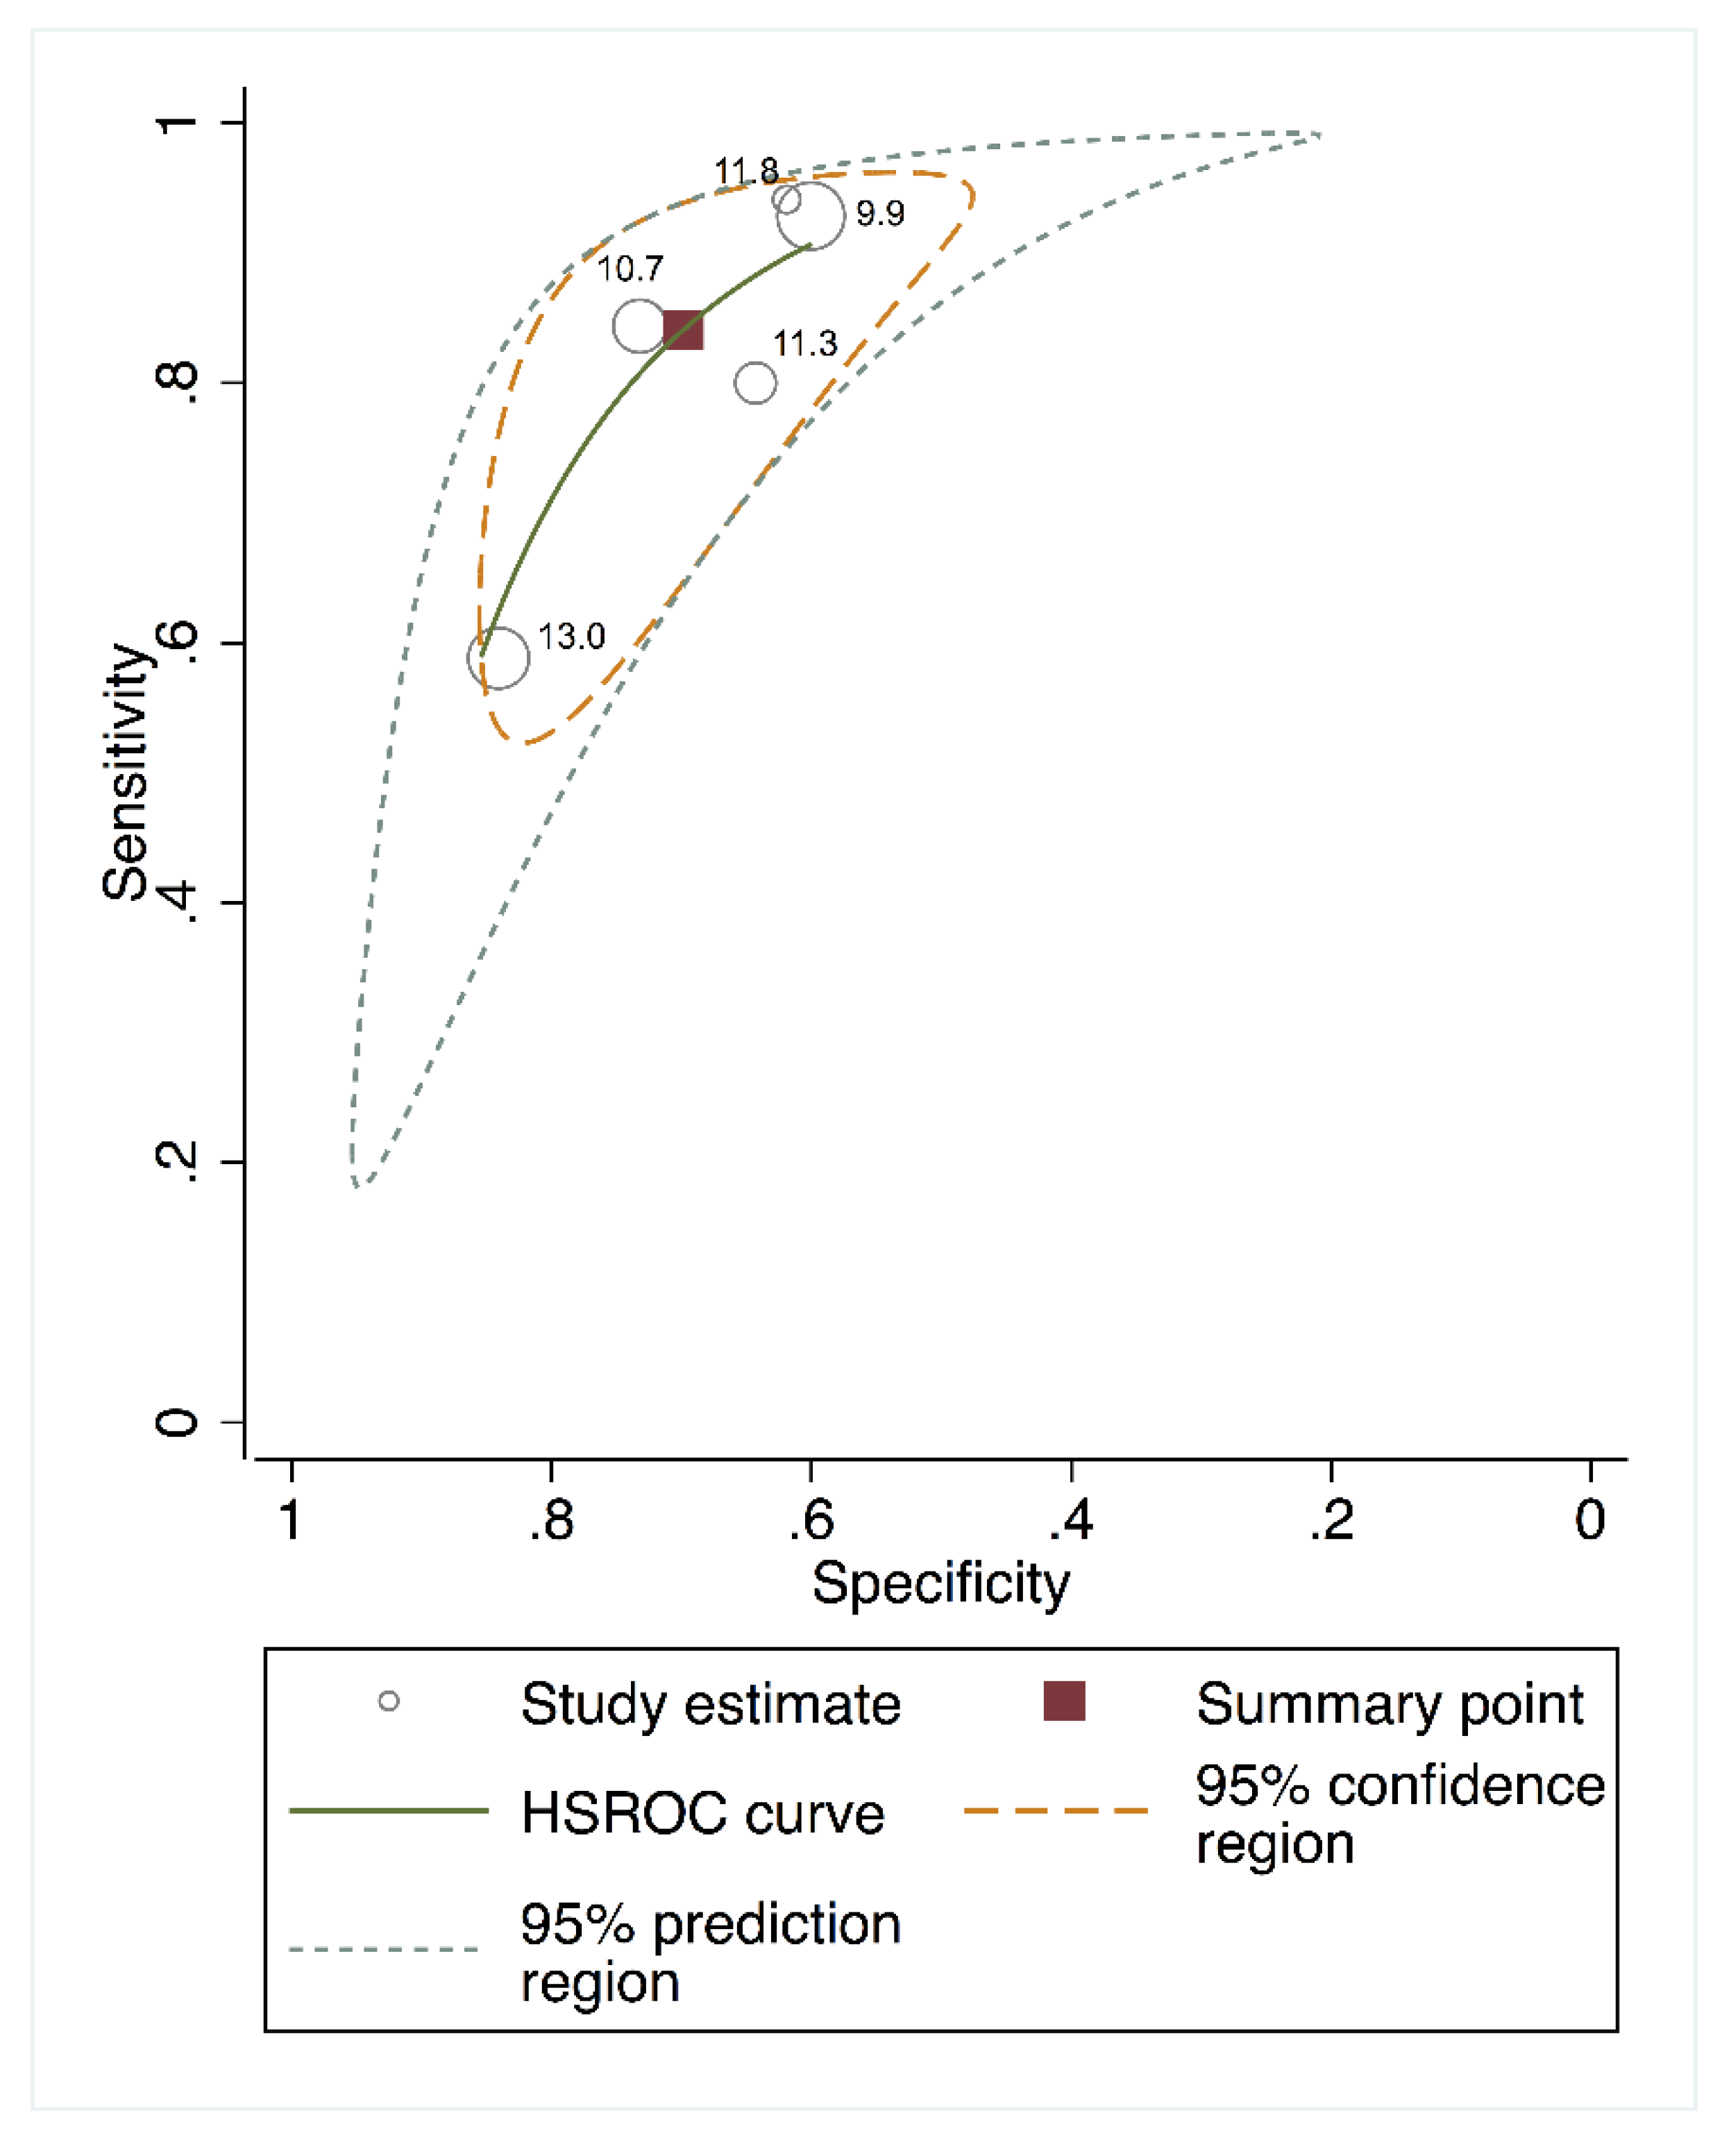
3.3. Meta-Analysis
3.4. Sensitivity Analyses for the Effect of Individual Studies
3.5. Random Effects Meta-Regression Model
3.6. Publication Bias
4. Discussion
5. Conclusions
Supplementary Materials
Author Contributions
Funding
Acknowledgments
Conflicts of Interest
References
- Cecelja, M.; Chowienczyk, P. Role of arterial stiffness in cardiovascular disease. JRSM Cardiovasc Dis. 2012, 1, 1–10. [Google Scholar] [CrossRef]
- Weber, T.; Auer, J.; O’Rourke, M.F.; Kvas, E.; Lassnig, E.; Berent, R.; Eber, B. Arterial stiffness, wave reflections, and the risk of coronary artery disease. Circulation 2004, 109, 184–189. [Google Scholar] [CrossRef] [PubMed] [Green Version]
- Mattace-Raso, F.U.S.; Van Der Cammen, T.J.M.; Hofman, A.; van Popele, V.M.; Bos, M.L.; Schalekamp, M.A.D.H.; Asmar, R.; Reneman, R.S.; Hoeks, A.P.G.; Breteler, M.M.B.; et al. Arterial Stiffness and Risk of Coronary Heart Disease and Stroke: The Rotterdam Study. Circulation 2006, 113, 657–663. [Google Scholar] [CrossRef] [PubMed] [Green Version]
- Wada, T.; Kodaira, K.; Fujishiro, K.; Maie, K.I.; Tsukiyama, E.; Fukumoto, T.; Uchida, T.; Yamazaki, S. Correlation of ultrasound-measured common carotid artery stiffness with pathological findings. Arter. Thromb. 1994, 14, 479–482. [Google Scholar] [CrossRef] [Green Version]
- Lacolley, P.; Regnault, V.; Avolio, A.P. Smooth muscle cell and arterial aging: Basic and clinical aspects. Cardiovasc Res. 2018, 114, 513–528. [Google Scholar] [CrossRef] [Green Version]
- Avramovski, P.; Janakievska, P.; Sotiroski, K.; Zafirova-Ivanovska, B.; Sikole, A. Aortic pulse wave velocity is a strong predictor of all—Cause and cardiovascular mortality in chronic dialysis patients. Ren. Fail. 2014, 36, 176–186. [Google Scholar] [CrossRef] [Green Version]
- Adragao, T.; Pires, A.; Birne, R.; Curto, J.D.; Lucas, C.; Goncalves, M.; Negrao, A.P. A plain X-ray vascular calcification score is associated with arterial stiffness and mortality in dialysis patients. Nephrol. Dial. Transplant. 2008, 24, 997–1002. [Google Scholar] [CrossRef] [PubMed]
- Vlachopoulos, C.; Aznaouridis, K.; Stefanadis, C. Prediction of Cardiovascular Events and All-Cause Mortality With Arterial Stiffness. A Systematic Review and Meta-Analysis. J. Am. Coll. Cardiol. 2010, 55, 1318–1327. [Google Scholar] [CrossRef] [PubMed] [Green Version]
- Mancia, G.; De Backer, G.; Dominiczak, A.; Cifkova, R.; Fagard, R.; Germano, G.; Grassi, G.; Heagerty, A.M.; Kjeldsen, S.E.; Laurent, S.; et al. 2007 Guidelines for the Management of Arterial Hypertension: The Task Force for the Management of Arterial Hypertension of the European Society of Hypertension (ESH) and of the European Society of Cardiology (ESC). Eur. Heart J. 2007, 28, 1462–1536. [Google Scholar] [CrossRef]
- Townsend, R.R.; Wilkinson, I.B.; Schiffrin, E.L.; Avolio, A.P.; Chirinos, J.A.; Cockcroft, J.R.; Heffernan, K.S.; Lakatta, E.G.; McEniery, C.M.; Mitchell, G.F.; et al. Recommendations for Improving and Standardizing Vascular Research on Arterial Stiffness: A Scientific Statement from the American Heart Association. Hypertension 2015, 66, 698–722. [Google Scholar] [CrossRef] [Green Version]
- Pereira, T.; Correia, C.; Cardoso, J. Novel methods for pulse wave velocity measurement. J. Med. Biol. Eng. 2015, 35, 555–565. [Google Scholar] [CrossRef] [PubMed] [Green Version]
- Mattace-Raso, F.U.S.; Hofman, A.; Verwoert, G.C.; Wittemana, J.C.M.; Wilkinson, I.; Cockcroft, J.; Mceniery, C.; Yasmin; Laurent, S.; Boutouyrie, P.; et al. Determinants of pulse wave velocity in healthy people and in the presence of cardiovascular risk factors: ‘Establishing normal and reference values’. Eur. Heart J. 2010, 31, 2338–2350. [Google Scholar]
- Van Bortel, L.M.; Laurent, S.; Boutouyrie, P.; Chowienczyk, P.; Cruickshank, J.K.; De Backer, T.; Filipovsky, J.; Huybrechts, S.; Mattace-Raso, F.U.; Protogerou, A.D.; et al. Expert consensus document on the measurement of aortic stiffness in daily practice using carotid-femoral pulse wave velocity. J. Hypertens. 2012, 30, 445–448. [Google Scholar] [CrossRef] [PubMed] [Green Version]
- Moher, D.; Liberati, A.; Tetzlaff, J.; Altman, D.G. Preferred Reporting Items for Systematic Reviews and Meta-Analyses: The PRISMA Statement. Ann. Intern. Med. 2009, 151, 264. [Google Scholar] [CrossRef] [Green Version]
- Macaskill, P.; Gatsonis, C.; Deeks, J.; Harbord, R.; Takwoingi, Y. Chapter 10: Analysing and Presenting Results. In Cochrane Handbook for Systematic Reviews of Diagnostic Test Accuracy Version 1.0; Deeks, J.J., Bossuyt, P.M., Gatsonis, C., Eds.; The Cochrane Collaboration: London, UK, 2010; Available online: http://srdta.cochrane.org/ (accessed on 10 March 2020).
- Hayden, J.A.; van der Windt, D.A.; Cartwright, J.L.; Côté, P.; Bombardier, C. Assessing bias in studies of prognostic factors. Ann. Intern. Med. 2013, 158, 280–286. [Google Scholar] [CrossRef]
- Lijmer, J.G.; Bossuyt, P.M.M.; Heisterkamp, S.H. Exploring sources of heterogeneity in systematic reviews of diagnostic tests. Stat. Med. 2002, 21, 1525–1537. [Google Scholar] [CrossRef] [PubMed]
- Jones, C.M.; Athanasiou, T. Summary receiver operating characteristic curve analysis techniques in the evaluation of diagnostic tests. Ann. Thorac. Surg. 2005, 79, 16–20. [Google Scholar] [CrossRef]
- Reitsma, J.B.; Glas, A.S.; Rutjes, A.W.S.; Scholten, R.J.P.M.; Bossuyt, P.M.; Zwinderman, A.H. Bivariate analysis of sensitivity and specificity produces informative summary measures in diagnostic reviews. J. Clin. Epidemiol. 2005, 58, 982–990. [Google Scholar] [CrossRef]
- DerSimonian, R.; Laird, N. Meta-analysis in clinical trials. Control. Clin. Trials 1986, 7, 177–188. [Google Scholar] [CrossRef]
- Higgins, J.P.T.; Thompson, S.G. Quantifying heterogeneity in a meta-analysis. Stat. Med. 2002, 21, 1539–1558. [Google Scholar] [CrossRef]
- Deeks, J.J.; Macaskill, P.; Irwig, L. The performance of tests of publication bias and other sample size effects in systematic reviews of diagnostic test accuracy was assessed. J. Clin. Epidemiol. 2005, 58, 882–893. [Google Scholar] [CrossRef] [PubMed]
- Blacher, J.; Asmar, R.; Djane, S.; London, G.M.; Safar, M.E. Aortic pulse wave velocity as a marker of cardiovascular risk in hypertensive patients. Hypertension 1999, 33, 1111–1117. [Google Scholar] [CrossRef] [Green Version]
- London, G.M.; Blacher, J.; Pannier, B.; Guérin, A.P.; Marchais, S.J.; Safar, M.E. Arterial wave reflections and survival in end-stage renal failure. Hypertension 2001, 38, 434–438. [Google Scholar] [CrossRef] [PubMed] [Green Version]
- Pannier, B.; Guérin, A.P.; Marchais, S.J.; Safar, M.E.; London, G.M. Stiffness of capacitive and conduit arteries: Prognostic significance for end-stage renal disease patients. Hypertens 2005, 45, 592–596. [Google Scholar] [CrossRef] [PubMed] [Green Version]
- Shokawa, T.; Imazu, M.; Yamamoto, H.; Toyofuku, M.; Tasaki, N.; Okimoto, T.; Yamane, K.; Kohno, N. Pulse Wave Velocity Predicts Cardiovascular Mortality. Circ. J. 2005, 69, 259–264. [Google Scholar] [CrossRef] [Green Version]
- Kawai, T.; Ohishi, M.; Onishi, M.; Ito, N.; Takeya, Y.; Maekawa, Y.; Rakugi, H. Cut-Off Value of Brachial-Ankle Pulse Wave Velocity to Predict Cardiovascular Disease in Hypertensive Patients: A Cohort Study. J. Atheroscler. Thromb. 2013, 20, 391–400. [Google Scholar] [CrossRef] [Green Version]
- Miyano, I.; Nishinaga, M.; Takata, J.; Shimizu, Y.; Okumiya, K.; Matsubayashi, K.; Ozawa, T.; Sugiura, T.; Yasuda, N.; Doi, Y. Association between brachial-ankle pulse wave velocity and 3-year mortality in community-dwelling older adults. Hypertens. Res. 2010, 33, 678–682. [Google Scholar] [CrossRef] [PubMed]
- Seo, H.J.; Ki, Y.J.; Han, M.A.; Choi, D.H.; Ryu, S.W. Brachial-ankle pulse wave velocity and mean platelet volume as predictive values after percutaneous coronary intervention for long-term clinical outcomes in Korea: A comparable and additive study. Platelets 2015, 26, 665–671. [Google Scholar] [CrossRef] [PubMed]
- Thompson, S.G.; Higgins, J.P.T. How should meta-regression analyses be undertaken and interpreted? Stat. Med. 2002, 21, 1559–1573. [Google Scholar] [CrossRef] [PubMed]
- Dogui, A.; Kachenoura, N.; Frouin, F.; Lefort, M.; De Cesare, A.; Mousseaux, E.; Herment, A. Consistency of aortic distensibility and pulse wave velocity estimates with respect to the Bramwell-Hill theoretical model: A cardiovascular magnetic resonance study. J. Cardiovasc. Magn. Reson. 2011, 13, 11. [Google Scholar] [CrossRef] [PubMed] [Green Version]
- Zhong, Q.; Hu, M.-J.; Cui, Y.-J.; Liang, L.; Zhou, M.-M.; Yang, Y.-W.; Huang, F. Carotid-Femoral Pulse Wave Velocity in the Prediction of Cardiovascular Events and Mortality: An Updated Systematic Review and Meta-Analysis. Angiology 2018, 69, 617–629. [Google Scholar] [CrossRef] [PubMed]
- Ben-Shlomo, Y.; Spears, M.; Boustred, C.; May, M.; Anderson, S.G.; Benjamin, E.J.; Boutouyrie, P.; Cameron, J.; Chen, C.-H.; Cruickshank, J.K.; et al. Aortic pulse wave velocity improves cardiovascular event prediction: An individual participant meta-analysis of prospective observational data from 17,635 subjects. J. Am. Coll. Cardiol. 2014, 63, 636–646. [Google Scholar] [CrossRef] [PubMed]
- Laurent, S.; Cockcroft, J.; Van Bortel, L.; Boutouyrie, P.; Giannattasio, C.; Hayoz, D.; Pannier, B.; Vlachopoulos, C.; Wilkinson, I.; Struijker-Boudier, H. Expert consensus document on arterial stiffness: Methodological issues and clinical applications. Eur. Heart J. 2006, 27, 2588–2605. [Google Scholar] [CrossRef] [PubMed] [Green Version]
- Williams, B.; Mancia, G.; Spierinnng, W.; Agabiti Rosei, E.; Azizi, M.; Burnier, M.; Clement, D.L.; Coca, A.; De Simone, G.; Dominiczak, A.; et al. 2018 ESC/ESH Guidelines for the management of arterial hypertension: The Task Force for the management of arterial hypertension of the European Society of Cardiology (ESC) and the European Society of Hypertension (ESH). Eur. Heart J. 2018, 33, 3021–3104. [Google Scholar] [CrossRef]
- Guerin, A.P.; Blacher, J.; Pannier, B.; Marchais, S.J.; Safar, M.E.; London, G.M. Impact of aortic stiffness attenuation on survival of patients in end-stage renal failure. Circulation 2001, 103, 987–992. [Google Scholar] [CrossRef] [PubMed] [Green Version]
- Sugawara, J.; Tanaka, H. Brachial-Ankle Pulse Wave Velocity: Myths, Misconceptions, and Realities. Pulse 2015, 3, 106–113. [Google Scholar] [CrossRef] [Green Version]
- Reshetnik, A.; Gohlisch, C.; Tölle, M.; Zidek, W.; Van Der Giet, M. Oscillometric assessment of arterial stiffness in everyday clinical practice. Hypertens. Res. 2017, 40, 140–145. [Google Scholar] [CrossRef] [PubMed]
- Vlachopoulos, C.; Aznaouridis, K.; Stefanadis, C. Clinical appraisal of arterial stiffness: The Argonauts in front of the Golden Fleece. Heart 2006, 92, 1544–1550. [Google Scholar] [CrossRef] [Green Version]
- Rhee, T.M.; Kim, H.L.; Oh, S.; Lim, W.H.; Seo, J.-B.; Chung, W.Y.; Kim, S.H.; Kim, M.A.; Zo, J.H. Gender difference in the association between brachial-ankle pulse wave velocity and cardiovascular risk scores. Korean J. Intern. Med. 2019, 34, 539–548. [Google Scholar] [CrossRef] [PubMed] [Green Version]
- Pereira, T.; Maldonado, J.; Polónia, J.; Silva, J.A.; Morais, J.; Rodrigues, T.; Marques, M. Aortic pulse wave velocity and heart SCORE: Improving cardiovascular risk stratification. a sub-analysis of the EDIVA (Estudo de DIstensibilidade VAscular) project. Blood Press. 2014, 23, 109–115. [Google Scholar] [CrossRef] [PubMed]


| Method | Description | Measure | |
|---|---|---|---|
| Non-invasive methods | Applanation tonometry | Apply a pressure sensor through the skin and applanate a superficial artery by applying a downward pressure sufficient to flatten the artery. | baPWV, cfPWV |
| Computerized oscillometry | Simultaneous acquisition and analysis of the pulsation of the artery, which is caused by the heart, as the pressure oscillation in the cuff. | Heart-brachial PWV, heart-ankle PWV, brachial-ankle PWV, cfPWV | |
| Mechanotransducer | Two dedicated piezoelectric pressure mechanotransducers directly applied to the skin in a simultaneous measurement of pressure pulses | carotid–femoral, carotid–brachial or femoral–dorsalis pedis PWV | |
| Ultrasound | Doppler pulses are recorded sequentially in 2 different arterial sites and compared using the R-wave of the ECG | baPWV, cfPWV | |
| Photoplethysmography | DVP measured by the photoplethysmography transducer | DVP associated with aPWV | |
| Magnetic Resonance Imaging | Assessment of the blood flow velocity with an enough temporal and spatial resolution to study the propagation of the aortic systolic flow wave | Local PWV | |
| Invasive methods | Aortic angiography | Intra-aortic catheter measurements | Local PWV |
| Author | Country | Population | Age | n (% Female) | n Mortality | Index Test (Device) | Cut-Off Point | Sens (%) | Spec (%) | AUC | dOR |
|---|---|---|---|---|---|---|---|---|---|---|---|
| Adragão et al. 2008 | Portugal | Dialysis patients | 58.9 | 101 (29.7) | All-cause: 31 | cfPWV (Complior) | 10.5 | 71.0 | 69.0 | 0.738 | 5.33 |
| Avramoski et al. 2013 | Macedonia | Dialysis patients | 61.3 | 80 (33.75) | All-cause: 23 | cfPWV (pulsed-Doppler ultrasound synchronized with ECG) | 11.8 | 82.6 | 61.4 | 0.722 | 7.56 |
| CV: 17 | 11.8 | 94.1 | 61.4 | 0.820 | 26.00 | ||||||
| Blacher et al. 1999 | France | Hypertensive patients | 62.0 | 710 (41.8) | CV: NA | cfPWV (Complior) | 13 | 60.0 | 84.0 | 0.780 | 7.54 |
| Kawai et al. 2012 | Japan | Hypertensive patients | 61.0 | 400 (45.5) | All-cause: 17 | baPWV (FCP-4731) | 18 | 71.0 | 71.0 | 0.719 | 5.88 |
| London et al. 2001 | France | End-stage renal failure patients | 54.0 | 180 (40) | All-cause: 70 | cfPWV (SPT-301) | 11.5 | 80.0 | 74.0 | 0.820 | 11.17 |
| CV: 40 | 11.3 | 79.0 | 64.0 | 0.760 | 7.20 | ||||||
| Miyano et al. 2010 | Japan | Elderly population | 76.4 | 530 (31) | All-cause: 30 | baPWV (BP-203I) | 19.6 | 73.0 | 63.0 | 0.673 | 4.68 |
| CV: 11 | 19.6 | 91.0 | 62.0 | 0.795 | 16.34 | ||||||
| Pannier et al. 2005 | France | End-stage renal failure patients | 53.1 | 305 (38) | CV: 96 | cfPWV (SEGA M842 8MHz Doppler unit and Gould 8188 recorder) | 10.7 | 84.0 | 73.0 | 0.834 | 14.75 |
| Seo et al. 2014 | Korea | Post-percutaneous coronary intervention patients | 65.2 | 372 (36.8) | CV: 21 | baPWV (BP-203RPE II) | 16.7 | 85.7 | 60.1 | 0.778 | 9.04 |
| Shokawa et al. 2005 | USA/Japan | General population | 64.5 | 492 (55.3) | All-cause: 43 | cfPWV (MCG400) | 9.9 | 72.0 | 62.0 | 0.690 | 4.20 |
| CV: 14 | 9.9 | 93.0 | 60.0 | 0.770 | 19.53 |
| Sensitivity (%) | Specificity (%) | PLR | NLR | dOR | AUC | |
|---|---|---|---|---|---|---|
| All-cause mortality | 77.00 (65.00–91.00) | 65.00 (59.00–71.00) | 2.33 (0.66–8.19) | 0.34 (0.09–1.25) | 6.50 (4.30–9.83) | 0.750 (0.690–0.810) |
| CV mortality | 83.00 (71.00–97.00) | 71.00 (66.00–75.00) | 2.68 (0.90–8.00) | 0.21 (0.07–0.65) | 11.23 (7.29–17.29) | 0.780 (0.740–0.830) |
© 2020 by the authors. Licensee MDPI, Basel, Switzerland. This article is an open access article distributed under the terms and conditions of the Creative Commons Attribution (CC BY) license (http://creativecommons.org/licenses/by/4.0/).
Share and Cite
Sequí-Domínguez, I.; Cavero-Redondo, I.; Álvarez-Bueno, C.; Pozuelo-Carrascosa, D.P.; Nuñez de Arenas-Arroyo, S.; Martínez-Vizcaíno, V. Accuracy of Pulse Wave Velocity Predicting Cardiovascular and All-Cause Mortality. A Systematic Review and Meta-Analysis. J. Clin. Med. 2020, 9, 2080. https://doi.org/10.3390/jcm9072080
Sequí-Domínguez I, Cavero-Redondo I, Álvarez-Bueno C, Pozuelo-Carrascosa DP, Nuñez de Arenas-Arroyo S, Martínez-Vizcaíno V. Accuracy of Pulse Wave Velocity Predicting Cardiovascular and All-Cause Mortality. A Systematic Review and Meta-Analysis. Journal of Clinical Medicine. 2020; 9(7):2080. https://doi.org/10.3390/jcm9072080
Chicago/Turabian StyleSequí-Domínguez, Irene, Iván Cavero-Redondo, Celia Álvarez-Bueno, Diana P Pozuelo-Carrascosa, Sergio Nuñez de Arenas-Arroyo, and Vicente Martínez-Vizcaíno. 2020. "Accuracy of Pulse Wave Velocity Predicting Cardiovascular and All-Cause Mortality. A Systematic Review and Meta-Analysis" Journal of Clinical Medicine 9, no. 7: 2080. https://doi.org/10.3390/jcm9072080