The Effect of the Paleolithic Diet vs. Healthy Diets on Glucose and Insulin Homeostasis: A Systematic Review and Meta-Analysis of Randomized Controlled Trials

 ,
,  ,
,
Abstract
:1. Introduction
2. Methods
2.1. Search Strategy
2.2. Study Selection
- Types of studies: randomized controlled trial (RCTs; parallel or crossover), irrespective of publication status;
- Types of interventions: Paleolithic diet (regardless of the duration of the intervention) versus another type of diet (e.g., the Mediterranean diet, diabetes diets, national dietary recommendation);
- Population: studies conducted in humans with glucose metabolism disorders (diabetes mellitus (criteria for the diagnosis: fasting plasma glucose concentrations ≥126 mg/dL (7.0 mmol/L) or 2-h glucose levels ≥200 mg/dL (11.1 mmol/L) during OGTT or HbA1c ≥6.5% (in the absence of unequivocal hyperglycemia; for these parameters, diagnosis requires two abnormal test results from the same sample or in two separate test samples) or a random plasma glucose ≥200 mg/dL (11.1 mmol/L)), prediabetes state (impaired fasting glucose (fasting plasma glucose concentrations from 100 mg/dL (5.6 mmol/L) to 125 mg/dL (6.9 mmol/L)), or impaired glucose tolerance (2-h plasma glucose levels during OGTT from 140 mg/dL (7.8 mmol/L) to 199 mg/dL (11.0 mmol/L)) or HbA1c from 5.7% to 6.4%) [2], or studies which included participants where the majority had at least two characteristics of metabolic syndrome (waist circumference ≥102 cm for men and ≥88 cm for women, triglyceride levels ≥150 mg/dL (1.7 mmol/L), high-density lipoprotein (HDL) cholesterol <40 mg/dL (1.0 mmol/L) for men and <50 mg/dL (1.3 mmol/L) for women, hypertension or blood pressure ≥130/85 mmHg, or fasting plasma glucose ≥100 mg/dL (5.6 mmol/L)) [24], with no restrictions on age, gender, and race/ethnicity of study participants, location of study, or sample size.
- Types of studies: non-RCTs, uncontrolled trials, observational studies (e.g., ecologic study, cohort study, case–control study, case reports, case series, editorials, commentaries, letters to the editor, qualitative research), conference papers, or publications available only in abstract form (no possible contact with authors);
- Population: studies conducted in animal models or studies performed in healthy subjects or a specific group of patients (e.g., pregnant or breastfeeding women).
2.3. Quality Assessment
2.4. Data Extraction
- General information: first author’s name, publication year, country;
- Study characteristics: study design and method of blinding;
- Characteristics of study participants: sample size (total sample size and number of subjects in each group), age, sex, body mass index (BMI), body weight, ethnicity, and health status (diabetes mellitus type 1, diabetes mellitus type 2, impaired fasting glucose, and impaired glucose tolerance or other);
- Type of intervention: type of diet, the macronutrient composition of diet (the energy value of the diet, percentage energy from carbohydrate, protein and fat, dietary fiber intake (g/day)), recommended and excluded food products, time of intervention, duration of intervention;
- Pre- and post-intervention fasting glucose and insulin levels, HbA1c values, the area under the curve (AUC; 0–120 min) for glucose and insulin during OGTT and homeostasis model assessment of insulin resistance (HOMA-IR).
2.5. Risk of Bias
2.6. Data Analysis
2.7. Outcomes
2.8. Statistical Analysis
3. Results
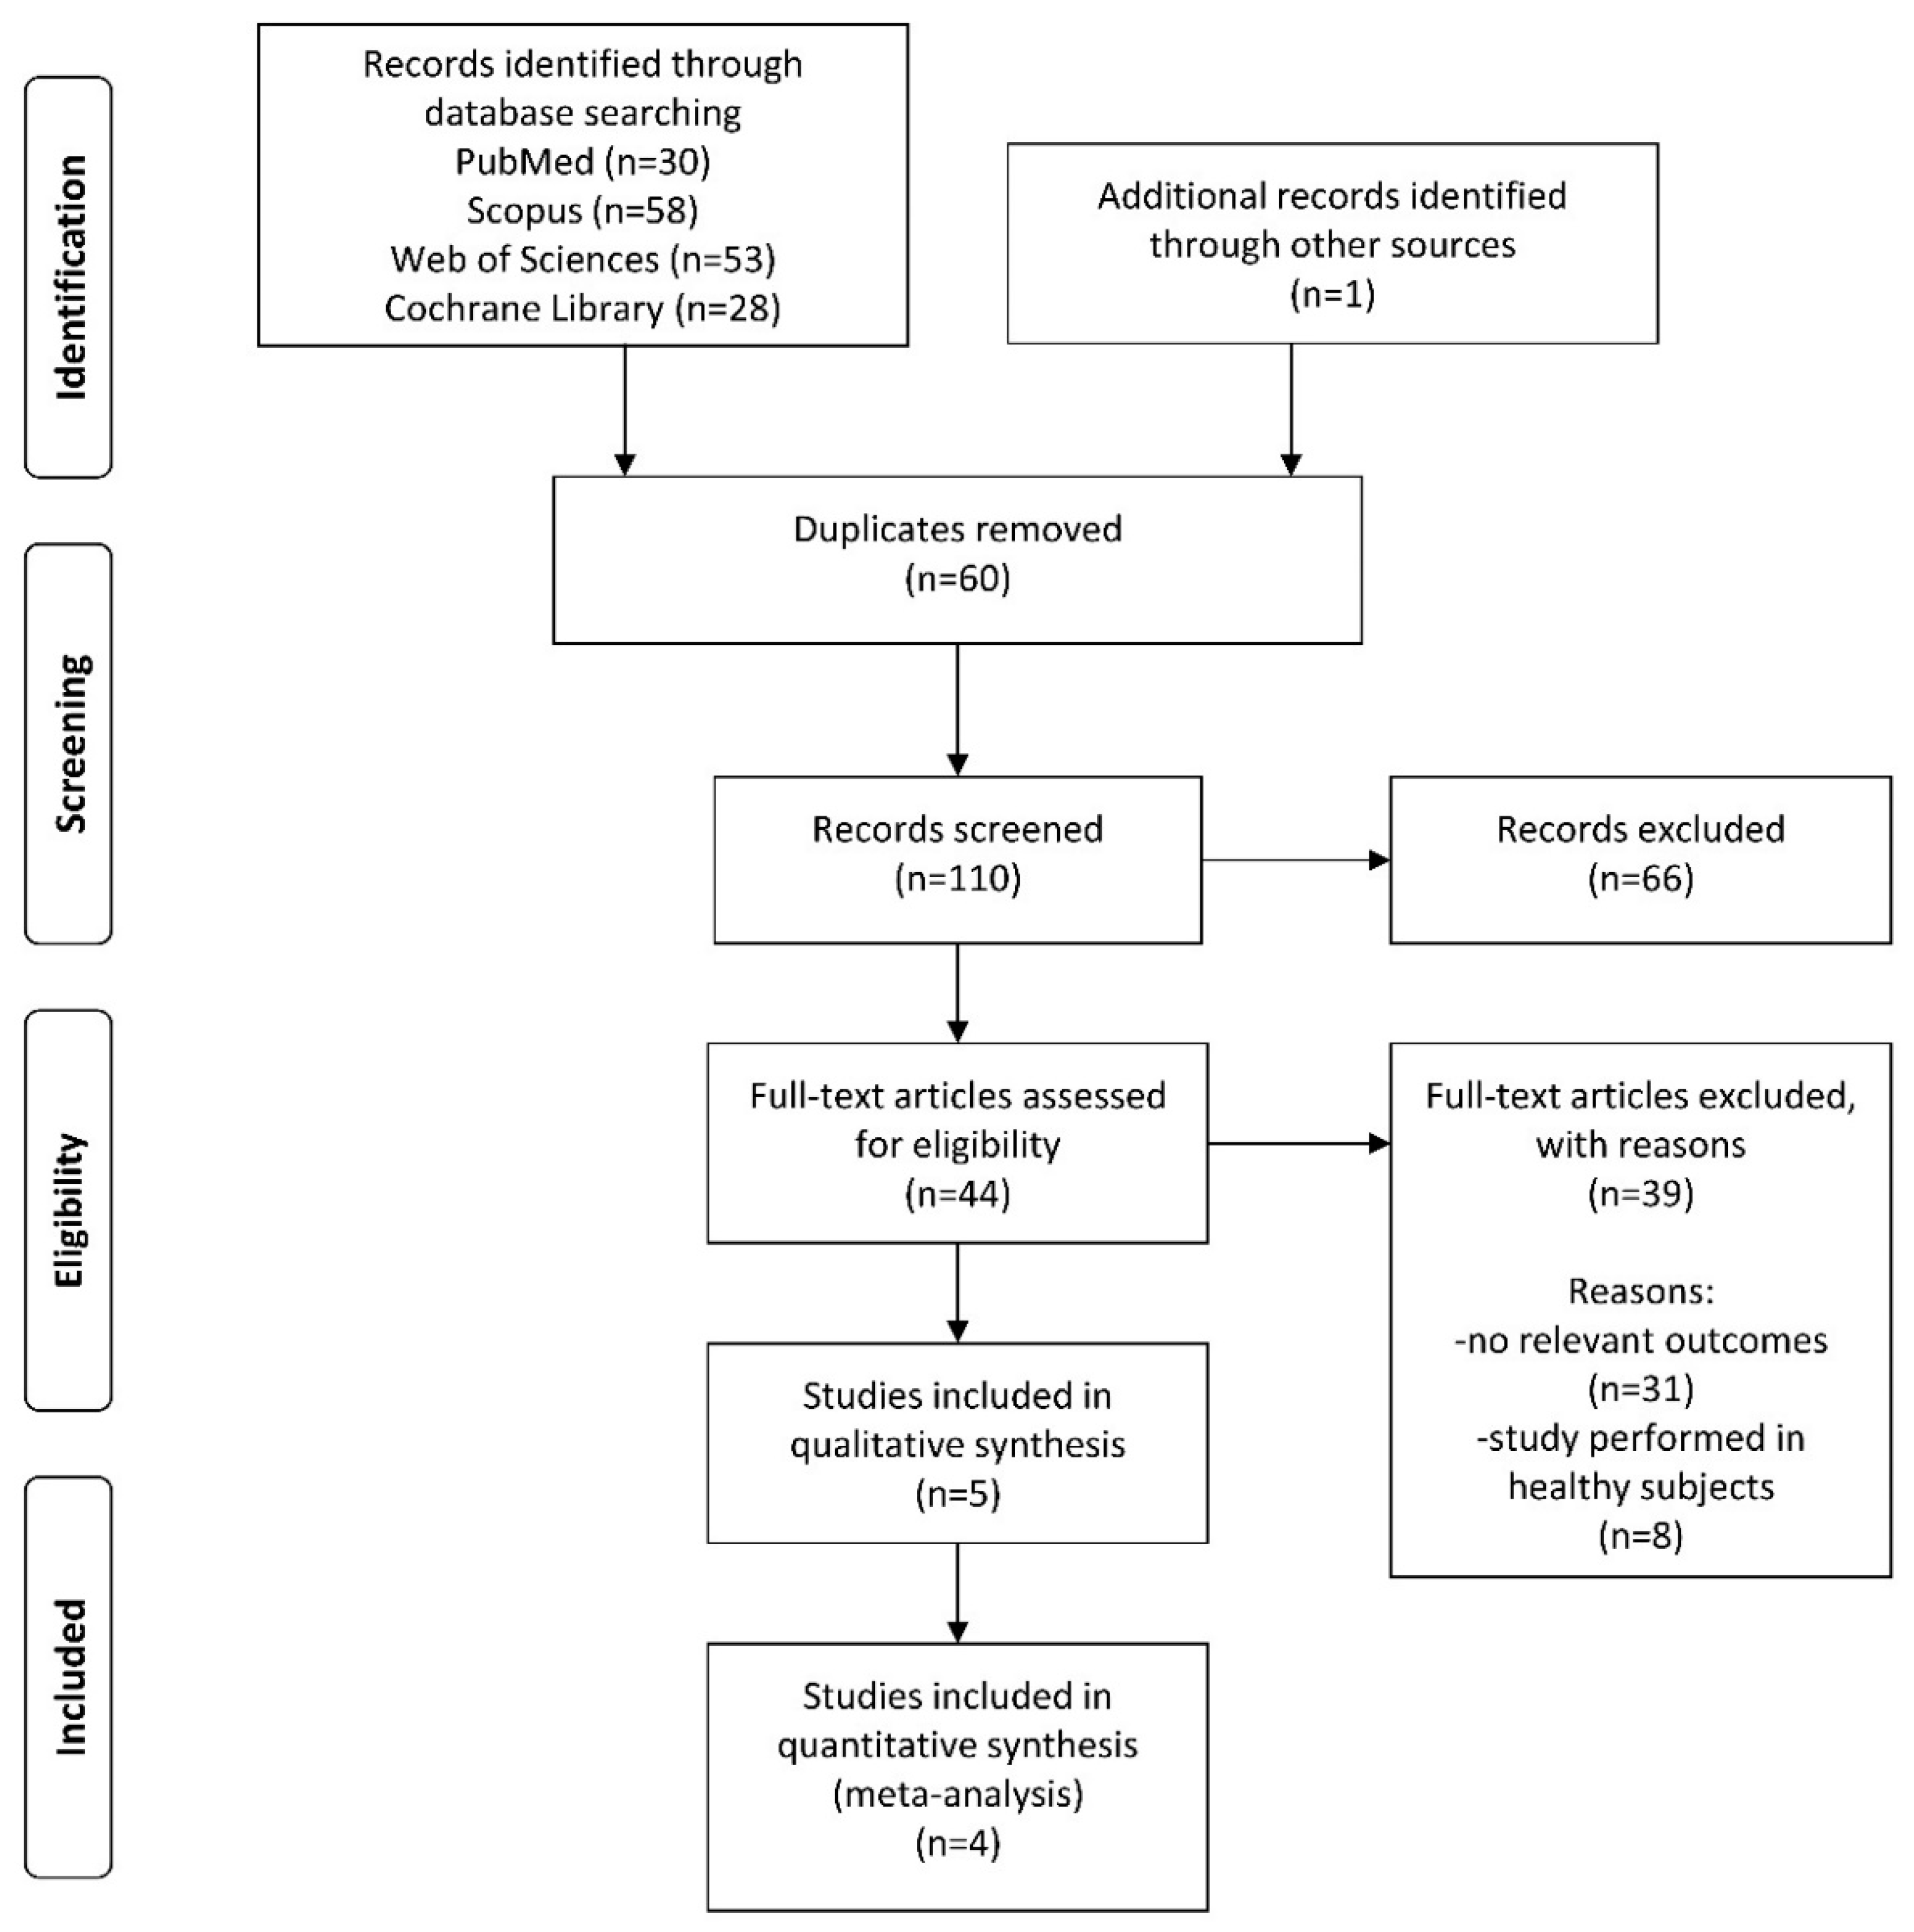
3.1. Search Results
3.2. Characteristics of Included Studies
3.3. Characteristics of Study Participants
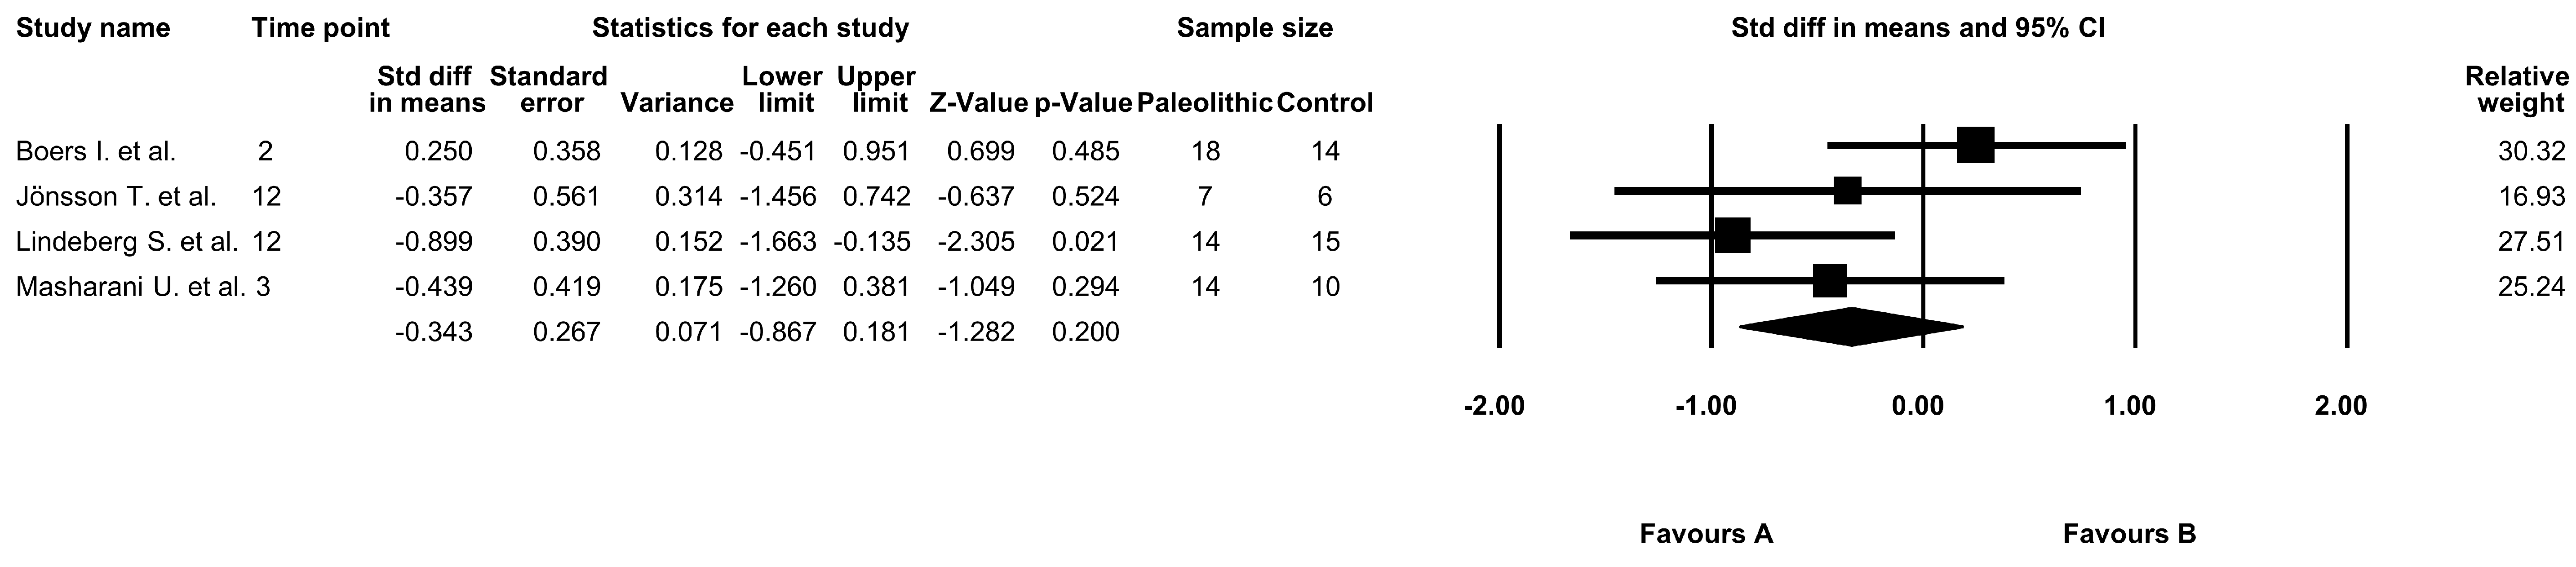
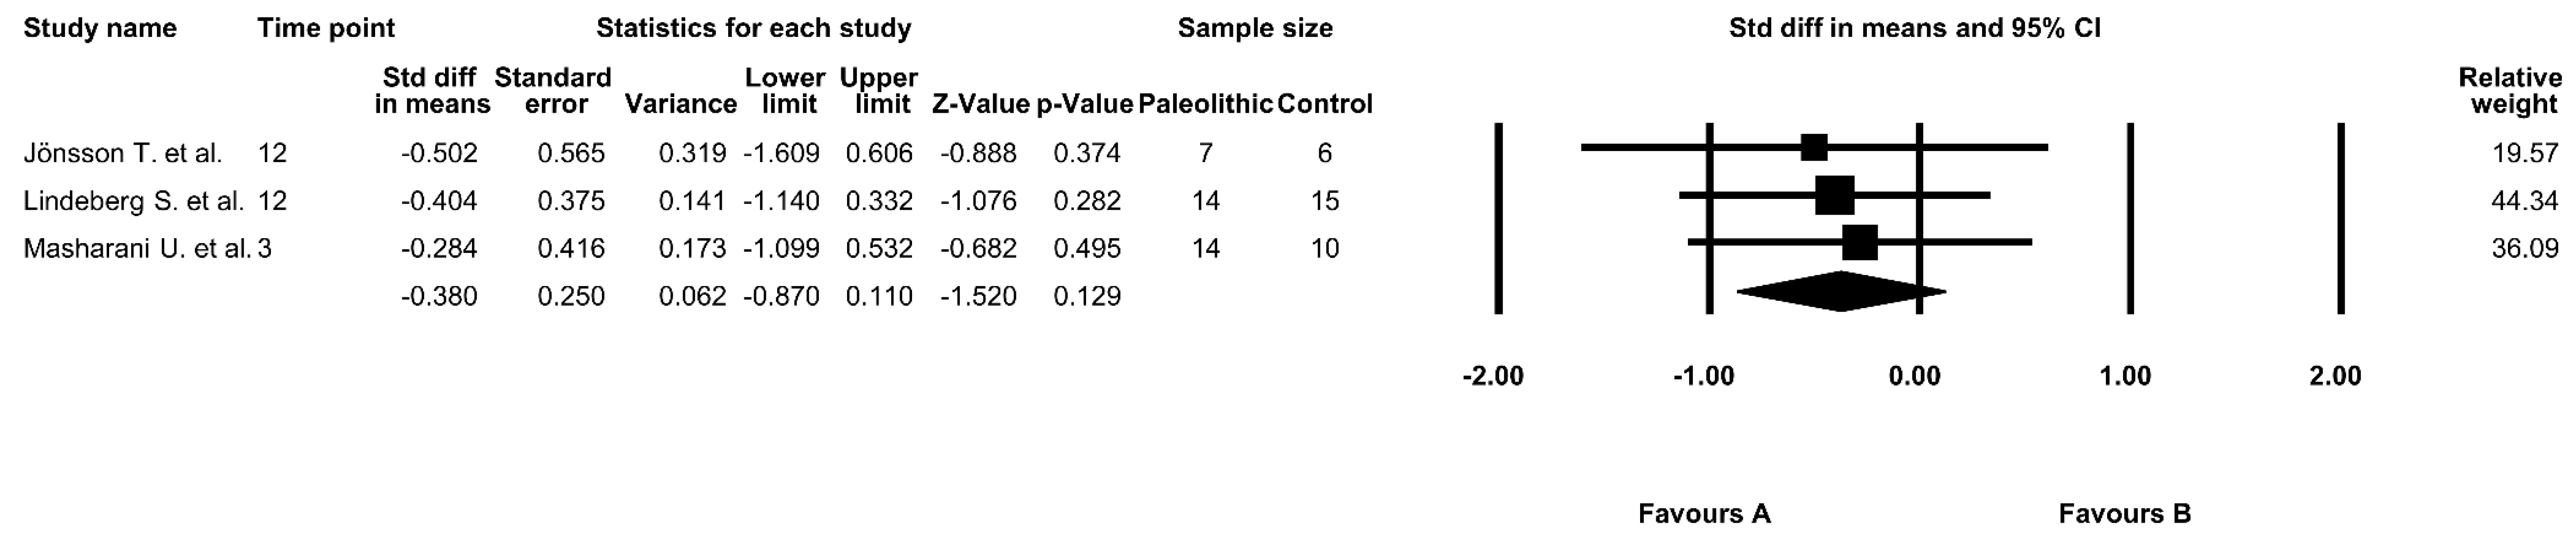
3.4. The Effect of the Paleolithic Diet on Fasting Glucose Levels
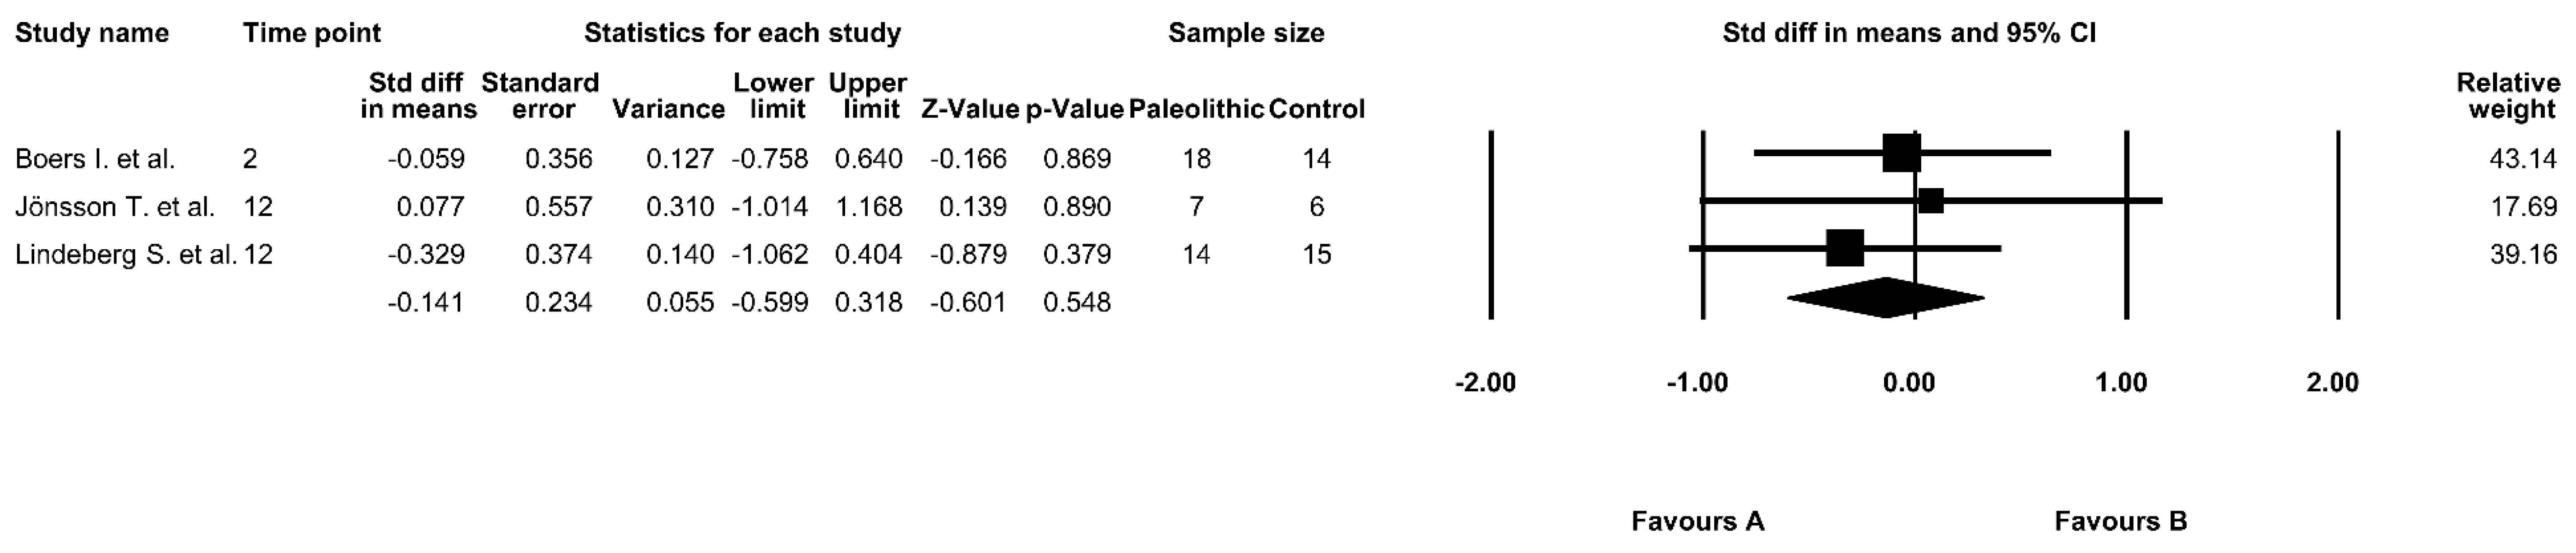
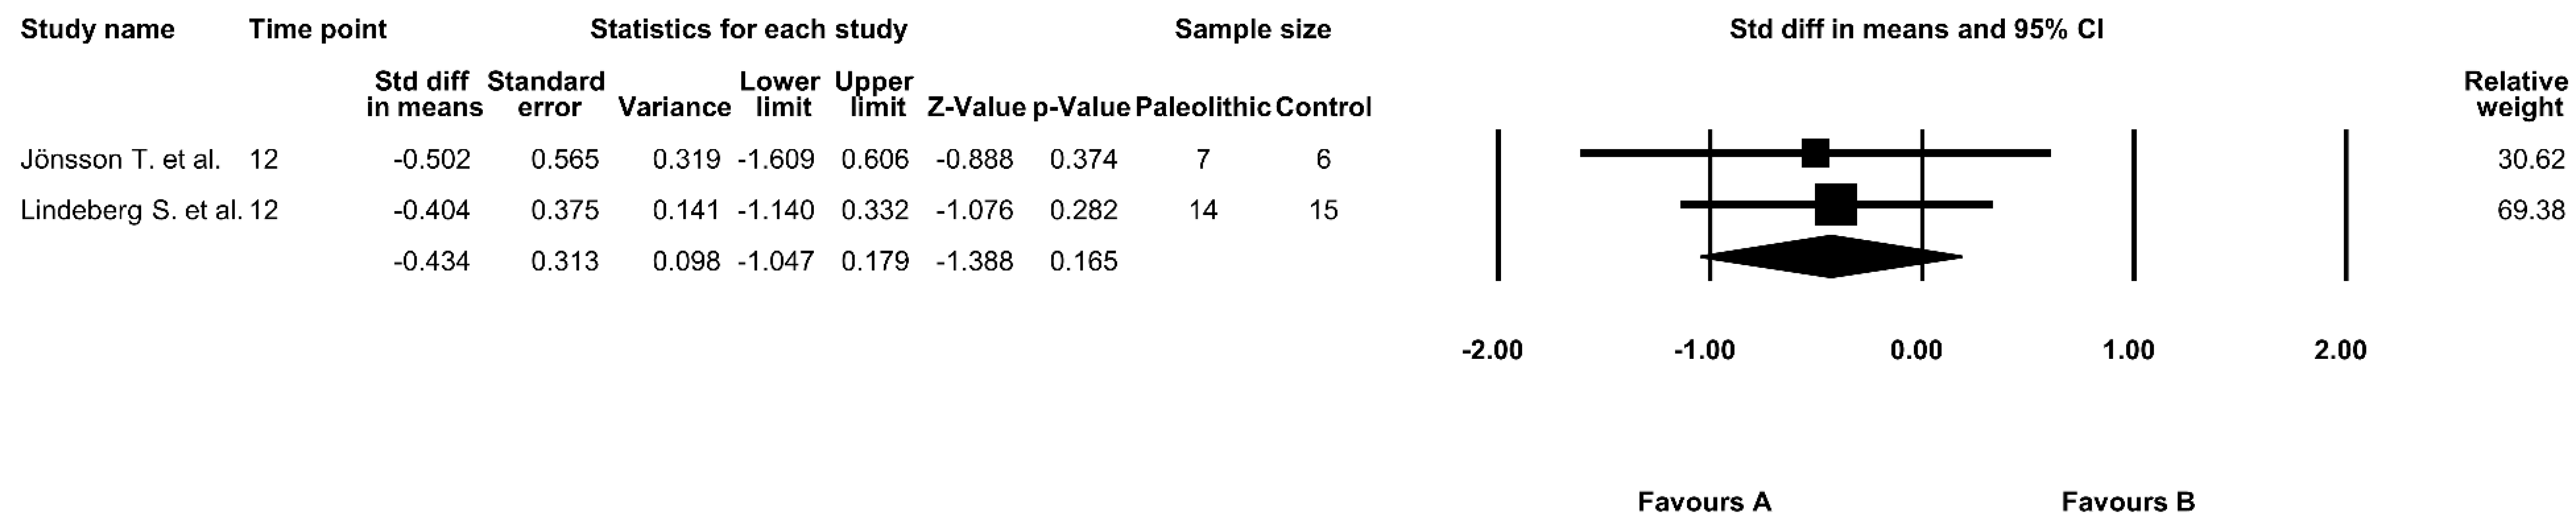
3.5. The Effect of the Paleolithic Diet on Fasting Insulin Levels
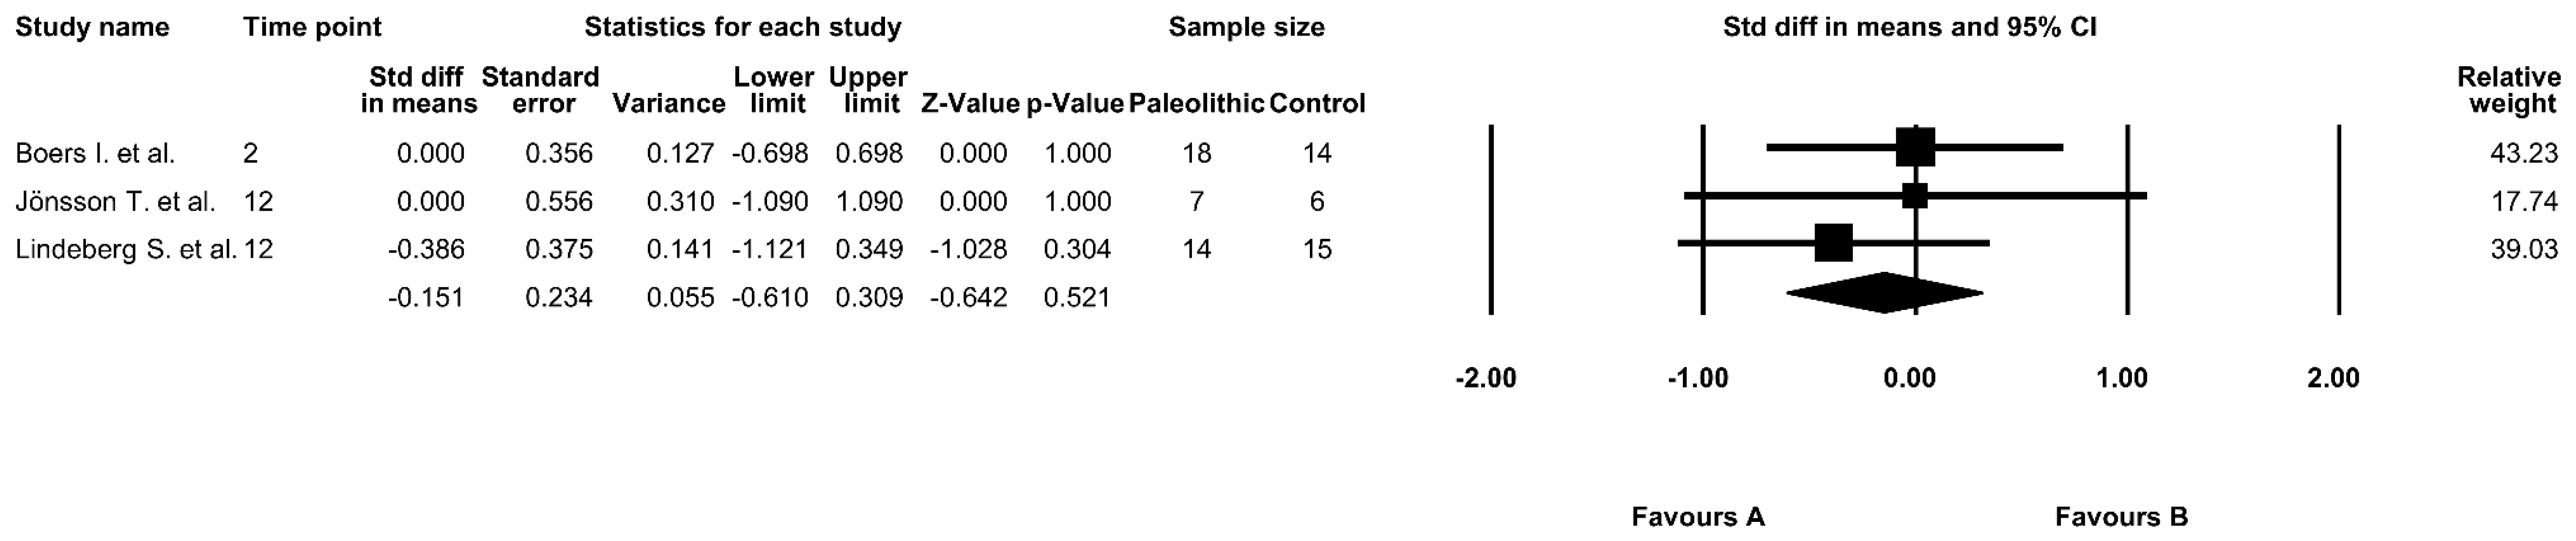
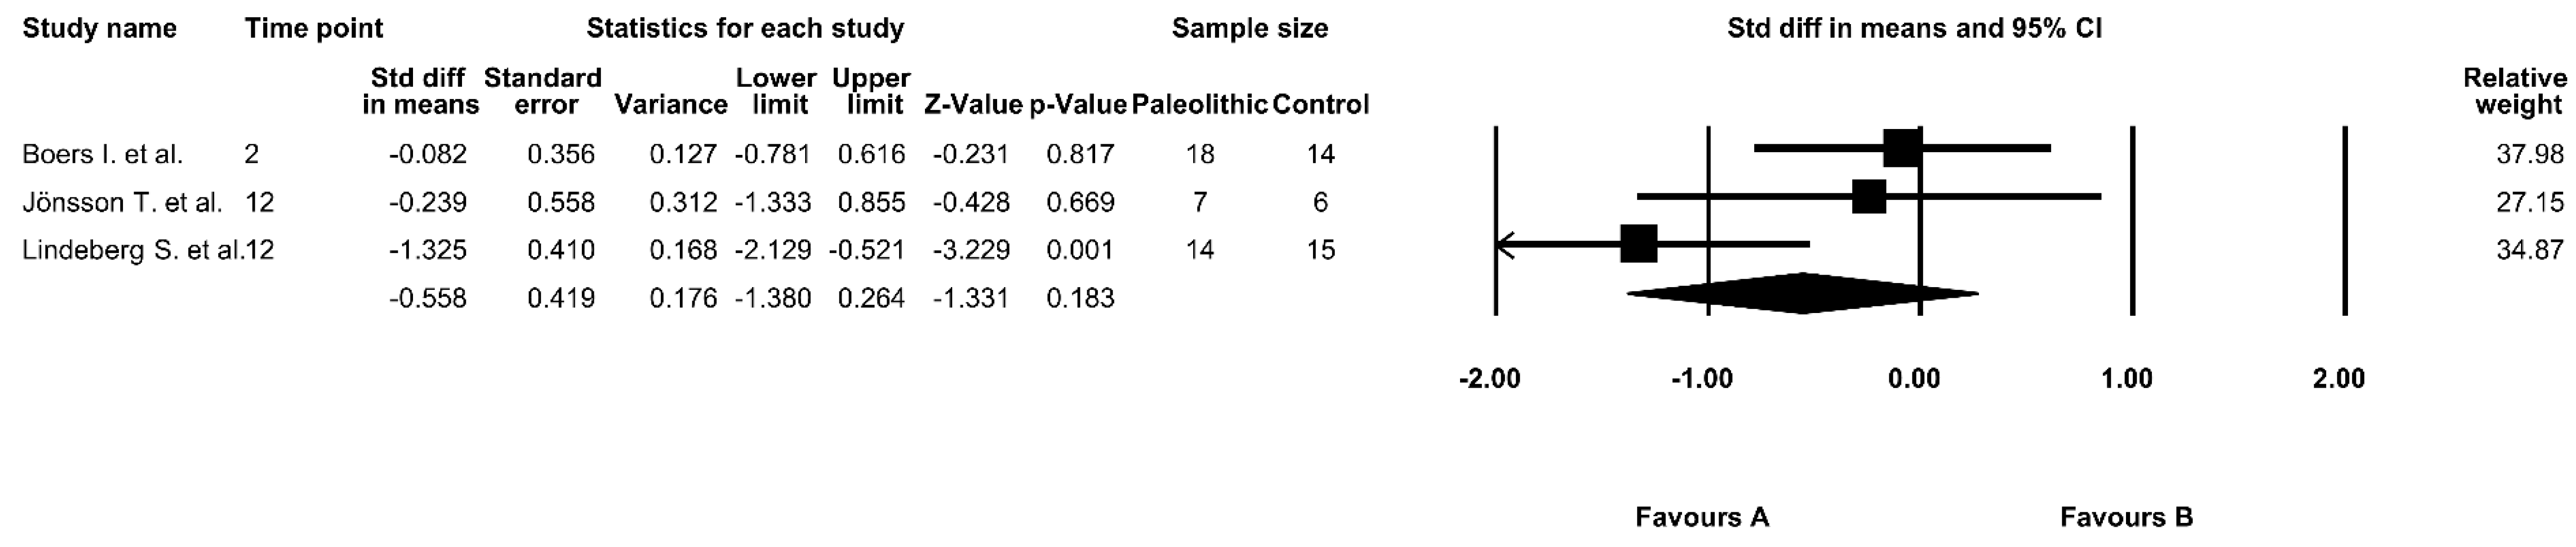
3.6. The Effect of the Paleolithic Diet on HOMA-IR
3.7. The Effect of the Paleolithic Diet on HbA1c Values
3.8. The Effect of the Paleolithic Diet on AUC 0–120 Glucose Levels
3.9. The Effect of the Paleolithic Diet on AUC 0–120 Insulin Levels
3.10. Risk of Bias
4. Discussion
5. Conclusions
Supplementary Materials
Author Contributions
Funding
Conflicts of Interest
References
- International Diabetes Federation. IDF Diabetes Atlas, 8th ed.; International Diabetes Federation: Brussels, Belgium, 2017. [Google Scholar]
- American Diabetes Association. Standards of medical care in diabetes—2019. Diabetes Care 2019, 42 (Suppl. 1), S1–S193. [Google Scholar] [CrossRef] [PubMed] [Green Version]
- Luger, M.; Holstein, B.; Schindler, K.; Kruschitz, R.; Ludvik, B. Feasibility and efficacy of an isocaloric high-protein vs. standard diet on insulin requirement, body weight and metabolic parameters in patients with type 2 diabetes on insulin therapy. Exp. Clin. Endocrinol. Diabetes 2013, 121, 286–294. [Google Scholar] [CrossRef] [PubMed]
- Dong, J.Y.; Zhang, Z.L.; Wang, P.Y.; Qin, L.Q. Effects of high-protein diets on body weight, glycaemic control, blood lipids and blood pressure in type 2 diabetes: Meta-analysis of randomised controlled trials. Br. J. Nutr. 2013, 110, 781–789. [Google Scholar] [CrossRef] [PubMed]
- Vega-López, S.; Venn, B.; Slavin, J. Relevance of the glycemic index and glycemic load for body weight, diabetes, and cardiovascular disease. Nutrients 2018, 10, 1361. [Google Scholar] [CrossRef] [Green Version]
- Challa, H.J.; Uppaluri, K.R. Paleolithic Diet; 2019. Available online: https://www.ncbi.nlm.nih.gov/books/NBK482457/ (accessed on 1 September 2019).
- Raubenheimer, D.; Rothman, J.M.; Pontzer, H.; Simpson, S.J. Macronutrient contributions of insects to the diets of hunter-gatherers: A geometric analysis. J. Hum. Evol. 2014, 71, 70–76. [Google Scholar] [CrossRef]
- Manheimer, E.W.; van Zuuren, E.J.; Fedorowicz, Z.; Pijl, H. Paleolithic nutrition for metabolic syndrome: Systematic review and meta-analysis. Am. J. Clin. Nutr. 2015, 102, 922–932. [Google Scholar] [CrossRef] [Green Version]
- Jönsson, T.; Granfeldt, Y.; Ahrén, B.; Branell, U.C.; Pålsson, G.; Hansson, A.; Söderström, M.; Lindeberg, S. Beneficial effects of a Paleolithic diet on cardiovascular risk factors in type 2 diabetes: A randomized cross-over pilot study. Cardiovasc. Diabetol. 2009, 8, 35. [Google Scholar] [CrossRef] [Green Version]
- Genoni, A.; Lyons-Wall, P.; Lo, J.; Devine, A. Cardiovascular, metabolic effects and dietary composition of ad-libitum Paleolithic vs. Australian Guide to healthy eating diets: A 4-week randomised trial. Nutrients 2016, 8, 314. [Google Scholar] [CrossRef] [Green Version]
- Whalen, K.A.; McCullough, M.L.; Flanders, W.D.; Hartman, T.J.; Judd, S.; Bostick, R.M. Paleolithic and Mediterranean diet pattern scores are inversely associated with biomarkers of inflammation and oxidative balance in adults. J. Nutr. 2016, 146, 1217–1226. [Google Scholar] [CrossRef]
- Bligh, H.F.J.; Godsland, I.F.; Frost, G.; Hunter, K.J.; Murray, P.; MacAulay, K.; Hyliands, D.; Talbot, D.C.; Casey, J.; Mulder, T.P.; et al. Plant-rich mixed meals based on Palaeolithic diet principles have a dramatic impact on incretin, peptide YY and satiety response, but show little effect on glucose and insulin homeostasis: An acute-effects randomised study. Br. J. Nutr. 2015, 113, 574–584. [Google Scholar] [CrossRef]
- Boers, I.; Muskiet, F.A.; Berkelaar, E.; Schut, E.; Penders, R.; Hoenderdos, K.; Wichers, H.J.; Jong, M.C. Favourable effects of consuming a Palaeolithic-type diet on characteristics of the metabolic syndrome: A randomized controlled pilot-study. Lipids Health Dis. 2014, 13, 160. [Google Scholar] [CrossRef] [PubMed] [Green Version]
- Chorell, E.; Ryberg, M.; Larsson, C.; Sandberg, S.; Mellberg, C.; Lindahl, B.; Antti, H.; Olsson, T. Plasma metabolomic response to postmenopausal weight loss induced by different diets. Metabolomics 2016, 12, 85. [Google Scholar] [CrossRef]
- Boraxbekk, C.J.; Stomby, A.; Ryberg, M.; Lindahl, B.; Larsson, C.; Nyberg, L.; Olsson, T. Diet-induced weight loss alters functional brain responses during an episodic memory task. Obes. Facts 2015, 8, 261–272. [Google Scholar] [CrossRef] [PubMed]
- Fontes-Villalba, M.; Lindeberg, S.; Granfeldt, Y.; Knop, F.K.; Memon, A.A.; Carrera-Bastos, P.; Picazo, Ó.; Chanrai, M.; Sunquist, J.; Sundquist, K.; et al. Palaeolithic diet decreases fasting plasma leptin concentrations more than a diabetes diet in patients with type 2 diabetes: A randomised cross-over trial. Cardiovasc. Diabetol. 2016, 15, 80. [Google Scholar] [CrossRef] [PubMed] [Green Version]
- Lindeberg, S.; Jönsson, T.; Granfeldt, Y.; Borgstrand, E.; Soffman, J.; Sjöström, K.; Ahrén, B. A Palaeolithic diet improves glucose tolerance more than a Mediterranean-like diet in individuals with ischaemic heart disease. Diabetologia 2007, 50, 1795–1807. [Google Scholar] [CrossRef] [PubMed]
- Masharani, U.; Sherchan, P.; Schloetter, M.; Stratford, S.; Xiao, A.; Sebastian, A.; Nolte Kennedy, M.; Frassetto, L. Metabolic and physiologic effects from consuming a hunter-gatherer (Paleolithic)-type diet in type 2 diabetes. Eur. J. Clin. Nutr. 2015, 69, 944–948. [Google Scholar] [CrossRef] [PubMed]
- Otten, J.; Mellberg, C.; Ryberg, M.; Sandberg, S.; Kullberg, J.; Lindahl, B.; Larsson, C.; Hauksson, J.; Olsson, T. Strong and persistent effect on liver fat with a Paleolithic diet during a two-year intervention. Int. J. Obes. 2016, 40, 747–753. [Google Scholar] [CrossRef] [Green Version]
- Stomby, A.; Simonyte, K.; Mellberg, C.; Ryberg, M.; Stimson, R.H.; Larsson, C.; Lindahl, B.; Andrew, R.; Walker, B.R.; Olsson, T. Diet-induced weight loss has chronic tissue-specific effects on glucocorticoid metabolism in overweight postmenopausal women. Int. J. Obes. 2015, 39, 814–819. [Google Scholar] [CrossRef]
- Ford, E.S.; Li, C.; Sattar, N. Metabolic syndrome and incident diabetes: Current state of the evidence. Diabetes Care 2008, 31, 1898–1904. [Google Scholar] [CrossRef] [Green Version]
- Moher, D.; Liberati, A.; Tetzlaff, J.; Altman, D.G.; PRISMA Group. Preferred reporting items for systematic reviews and meta-analyses: The PRISMA statement. PLoS Med. 2009, 6, e1000097. [Google Scholar] [CrossRef] [Green Version]
- Jamka, M.; Juruc, A.; Kulczynski, B. Effect of Paleo Diet on Glucose and Insulin Homeostasis; PROSPERO; CRD42019126412. 2019. Available online: https://www.crd.york.ac.uk/prospero/display_record.php?RecordID=126412 (accessed on 22 June 2019).
- National Cholesterol Education Program (NCEP) Expert Panel on Detection, Treatment E and T of HBC in A (Adult, Panel III). Third Report of the National Cholesterol Education Program (NCEP) Expert Panel on Detection, Evaluation, and Treatment of High Blood Cholesterol in Adults (Adult Treatment Panel III) final report. Circulation 2002, 106, 3143–3421. [Google Scholar] [CrossRef]
- Shuster, J.J. Review: Cochrane handbook for systematic reviews for interventions, Version 5.1.0, published 3/2011. Julian, P.T. Higgins and Sally Green, Editors. Res. Synth. Methods 2011, 2, 126–130. [Google Scholar] [CrossRef]
- World Health Organization. Global Database on Body Mass Index; World Health Organization: Geneva, Switzerland, 2006; Available online: https://www.who.int/nutrition/databases/bmi/en/ (accessed on 7 January 2019).
- Melmed, S.; Polonsky, K.S.; Larsen, P.R.; Kronenberg, H. Williams Textbook of Endocrinology; Elsevier: Philadelphia, PA, USA, 2015. [Google Scholar]
- Gayoso-Diz, P.; Otero-González, A.; Rodriguez-Alvarez, M.X.; Gude, F.; García, F.; De Francisco, A.; Quintela, A.G. Insulin resistance (HOMA-IR) cut-off values and the metabolic syndrome in a general adult population: Effect of gender and age: EPIRCE cross-sectional study. BMC Endocr. Disord. 2013, 13, 47. [Google Scholar] [CrossRef] [PubMed] [Green Version]
- DerSimonian, R.; Laird, N. Meta-analysis in clinical trials. Control Clin. Trials 1986, 7, 177–188. [Google Scholar] [CrossRef]
- Higgins, J.P.T.; Thompson, S.G.; Deeks, J.J.; Altman, D.G. Measuring inconsistency in meta-analyses. BMJ 2003, 327, 557–560. [Google Scholar] [CrossRef] [Green Version]
- McPherson, R.A.; Pincus, M.R. Henry’s Clinical Diagnosis and Management by Laboratory Methods; Elsevier: Amsterdam, The Netherlands, 2017. [Google Scholar]
- Wang, L.L.; Wang, Q.; Hong, Y.; Ojo, O.; Jiang, Q.; Hou, Y.Y.; Huang, Y.H.; Wang, X.H. The effect of low-carbohydrate diet on glycemic control in patients with type 2 diabetes mellitus. Nutrients 2018, 10, 661. [Google Scholar] [CrossRef] [Green Version]
- Boden, G.; Sargrad, K.; Homko, C.; Mozzoli, M.; Stein, T.P. Effect of a low-carbohydrate diet on appetite, blood glucose levels, and insulin resistance in obese patients with type 2 diabetes. Ann. Intern. Med. 2005, 142, 403–411. [Google Scholar] [CrossRef]
- Otten, J.; Andersson, J.; Ståhl, J.; Stomby, A.; Saleh, A.; Waling, M.; Ryberg, M.; Hauksson, J.; Svensson, M.; Johansson, B.; et al. Exercise training adds cardiometabolic benefits of a Paleolithic diet in type 2 diabetes mellitus. J. Am. Heart Assoc. 2019, 8, e010634. [Google Scholar] [CrossRef] [Green Version]
- Gérard, C.; Vidal, H. Impact of gut microbiota on host glycemic control. Front. Endocrinol. 2019, 10, 29. [Google Scholar] [CrossRef]
- Genoni, A.; Christophersen, C.T.; Lo, J.; Coghlan, M.; Boyce, M.C.; Bird, A.R.; Lyons-Wall, P.; Devine, A. Long-term Paleolithic diet is associated with lower resistant starch intake, different gut microbiota composition and increased serum TMAO concentrations. Eur. J. Nutr. 2019, 1–14. [Google Scholar] [CrossRef] [Green Version]
- Ghaedi, E.; Mohammadi, M.; Mohammadi, H.; Ramezani-Jolfaie, N.; Malekzadeh, J.; Hosseinzadeh, M.; Salehi-Abargouei, A. Effects of a Paleolithic diet on cardiovascular disease risk factors: A systematic review and meta-analysis of randomized controlled trials. Adv. Nutr. 2019, 10, 634–646. [Google Scholar] [CrossRef] [PubMed]
- Halton, T.L.; Hu, F.B. The effects of high protein diets on thermogenesis, satiety and weight loss: A critical review. J. Am. Coll. Nutr. 2004, 23, 373–385. [Google Scholar] [CrossRef] [PubMed]
- Clamp, L.D.; Hume, D.J.; Lambert, E.V.; Kroff, J. Enhanced insulin sensitivity in successful, long-term weight loss maintainers compared with matched controls with no weight loss history. Nutr. Diabetes 2017, 7, e282. [Google Scholar] [CrossRef] [PubMed] [Green Version]
- Rader, D.J. Effect of insulin resistance, dyslipidemia, and intra-abdominal adiposity on the development of cardiovascular disease and diabetes mellitus. Am. J. Med. 2007, 120, S12–S18. [Google Scholar] [CrossRef]
- Roberts, C.K.; Hevener, A.L.; Barnard, R.J. Metabolic syndrome and insulin resistance: Underlying causes and modification by exercise training. Compr. Physiol. 2013, 3, 1–58. [Google Scholar]
- Zhang, X.; Li, J.; Zheng, S.; Luo, Q.; Zhou, C.; Wang, C. Fasting insulin, insulin resistance, and risk of cardiovascular or all-cause mortality in non-diabetic adults: A meta-analysis. Biosci. Rep. 2017, 37, BSR20170947. [Google Scholar] [CrossRef] [Green Version]
- Blomquist, C.; Chorell, E.; Ryberg, M.; Mellberg, C.; Worrsjö, E.; Makoveichuk, E.; Larsson, C.; Lindahl, B.; Olivecrona, G.; Olsson, T. Decreased lipogenesis-promoting factors in adipose tissue in postmenopausal women with overweight on a Paleolithic-type diet. Eur. J. Nutr. 2018, 57, 2877–2886. [Google Scholar] [CrossRef] [Green Version]
- Wallace, T.M.; Levy, J.C.; Matthews, D.R. Use and abuse of HOMA modeling. Diabetes Care 2004, 27, 1487–1495. [Google Scholar] [CrossRef] [Green Version]
- Penno, G.; Solini, A.; Bonora, E.; Fondelli, C.; Orsi, E.; Zerbini, G.; Morano, S.; Cavalot, F.; Lamacchia, O.; Laviola, L. HbA1c variability as an independent correlate of nephropathy, but not retinopathy, in patients with type 2 diabetes: The Renal Insufficiency and Cardiovascular Events (RIACE) Italian Multicenter Study. Diabetes Care 2013, 36, 2301–2310. [Google Scholar] [CrossRef] [Green Version]
- Schwingshackl, L.; Chaimani, A.; Hoffmann, G.; Schwedhelm, C.; Boeing, H. A network meta-analysis on the comparative efficacy of different dietary approaches on glycaemic control in patients with type 2 diabetes mellitus. Eur. J. Epidemiol. 2018, 33, 157–170. [Google Scholar] [CrossRef] [Green Version]
- Otten, J.; Ryberg, M.; Mellberg, C.; Andersson, T.; Chorell, E.; Lindahl, B.; Larsson, C.; Holst, J.J.; Olsson, T. Postprandial levels of GLP-1, GIP and glucagon after 2 years of weight loss with a Paleolithic diet: A randomised controlled trial in healthy obese women. Eur. J. Endocrinol. 2019, 180, 417–427. [Google Scholar] [CrossRef] [PubMed] [Green Version]


| Study | Year | Type of Study | Duration of Intervention (week) | Groups | Subjects (n) a | Description | Energy (kcal) | Protein (%) | Fat (%) | Carbohydrate (%) | Fiber (g) | Meals Supplied by Researchers |
|---|---|---|---|---|---|---|---|---|---|---|---|---|
| Boers et al. [13] | 2014 | RCT, parallel | 2 | PD group | 18 | Based on lean meat, fish, fruit, leafy and cruciferous vegetables, root vegetables, eggs, and nuts. Dairy products, cereal grains, legumes, refined fats, extra salt, and sugar were excluded. | 2079 | 24 | 41 | 32 | 34 | Yes |
| Control group | 14 | The reference diet was based on the guidelines for a healthy diet of the Dutch Health Council. | 2079 | 17 | 29 | 50 | 28 | |||||
| Fontes-Villalba et al. [16] b | 2016 | RCT, crossover | 12 | PD group | 7 | Paleolithic diet based on lean meat, fish, fruits, vegetables, root vegetables, eggs, and nuts. | 1581 ± 295 c,d | 24 ± 3 c,d | 39 ± 5 c,d | 32 ± 7 c,d | 21 ± 8 c,d | No |
| Control group | 6 | Diabetes diet stated that it aimed to provide evenly distributed meals with an increased intake dietary fiber from vegetables, root vegetables, wholegrain bread, and other wholegrain cereal products, fruits, and berries, and a decreased intake of total fat with more emphasis on unsaturated fat. | 1878 ± 379 c,d | 20 ± 4 c,d | 34 ± 6 c,d | 42 ± 7 c,d | 26 ± 8 c,d | |||||
| Jönsson et al. [9] b | 2009 | RCT, crossover | 12 | PD group | 7 | Based on lean meat, fish, fruit, leafy and cruciferous vegetables, root vegetables, eggs, and nuts, while excluding dairy products, cereal grains, beans, refined fats, sugar, sweets, soft drinks, beer, and extra addition of salt. | 1581 ± 295 c,d | 24 ± 3 c,d | 39 ± 5 c,d | 32 ± 7 c,d | 21 ± 8 c,d | No |
| Control group | 6 | Diabetes diet, meals with increased intake of vegetables, root vegetables, wholegrain bread and other wholegrain cereal products, fruits, and berries, and decreased intake of total fat with more unsaturated fat. | 1878 ± 379 c,d | 20 ± 4 c,d | 34 ± 6 c,d | 42 ± 7 c,d | 26 ± 8 c,d | |||||
| Lindeberg et al. [17] | 2007 | RCT, parallel | 12 | PD group | 14 | Based on lean meat, fish, fruits, leafy and cruciferous vegetables, root vegetables (including restricted potatoes), eggs, and nuts. | 1344 ± 521 c | 27.9 ± 6.8 v | 26.9 ± 6.4 c | 40.2 ± 8.3 c | 21.4 ± 13.2 c | No |
| Control group | 15 | Consensus (Mediterranean diet) diet based on wholegrain cereals, low-fat dairy products, potatoes, legumes, vegetables, fruits, fatty fish, and refined fats rich in monounsaturated fatty acids and alpha-linolenic acid. | 1795 ± 306 c | 20.5 ± 3.6 c | 24.7 ± 4.3 c | 51.7 ± 5.3 c | 26.8 ± 7.4 c | |||||
| Masharani et al. [18] | 2015 | RCT, parallel | 3 | PD group | 14 | The Paleolithic diet consisted of meat, fish, poultry, eggs, fruit, vegetables, tree nuts, canola oil, mayonnaise, and honey. Excluded dairy products, legumes, cereals, grains, potatoes, and products containing potassium chloride. A series of ramp diets (with increasing levels of potassium and fiber) were developed. Ramp 1 diet was 1 day, ramp 2 for 3 days, and ramp 3 for 3 days. | N/A | N/A | N/A | N/A | N/A | Yes |
| Control group | 10 | Non-Paleolithic-type diet consisting of cereal grains, dairy, or legumes, moderate salt intake, low-fat dairy, whole grains, and legumes; no ramp up for the American Diabetes Association (ADA) diet. Diet based on recommendations by the ADA. |
| Study | Country | Analysed Groups | Age (years) Mean ± SD | Sex (% of Women) | BMI (kg/m2) Mean ± SD | Body Weight (kg) Mean ± SD | Race/Ethnicity (%) | Health Status | |
|---|---|---|---|---|---|---|---|---|---|
| Preintervention | Postintervention | ||||||||
| Boers et al. [13] | The Netherlands | PD group | 52.0 ± 10.2 | 72% | 33.7 ± 5.9 | 98.0 ± 18.2 * | 95.3 ± 17.5 * | Caucasian 100% | At least two of the following characteristics of metabolic syndrome: waist circumference ≥102 cm for men and ≥88 cm for women, triglycerides ≥1.7 mmol/L, HDL cholesterol <1.0 mmol/L for men and <1.3 mmol/L for women, blood pressure ≥130/85 mmHg or medication, fasting plasma glucose ≥5.6 mmol/L |
| Control group | 55.4 ± 9.0 | 75% | 29.8 ± 4.9 | 86.0 ± 14.2 | 84.3 ± 12.5 | Caucasian 87.5%, Asian 12.5% | |||
| Fontes-Villalba et al. [16] a | Sweden | PD group | 66.0 ± 6.0 | 14% | 28.0 ± 4.0 | 92.0 ± 20.0 | 81.0 ± 13.0 *,# | Caucasian 100% | Subjects with type 2 diabetes without insulin treatment |
| Jönsson et al. [9] a | Control group | 63.0 ± 6.0 | 33% | 32.0 ± 8.0 | 82.0 ± 13.0 | 84.0 ± 15.0 # | |||
| Lindeberg et al. [17] | Sweden | PD group | 65.0 ± 10.0 | 0% | 29.0 ± 4.0 | 91.7 ± 11.2 | 88.0 ± 10.7 # | Caucasian 100% | Subjects with ischemic heart disease plus either glucose intolerance or type 2 diabetes |
| Control group | 57.0 ± 7.0 | 30.0 ± 2.0 | 96.1 ± 12.4 | 93.5 ± 12.8 # | |||||
| Masharani et al. [18] | USA | PD group | 58.0 ± 8.0 | N/A | 31.0 ± 5.0 | N/A | −2.4 ± 0.7 b,# | Caucasian 62.5%, African American 12.5%, Asian 12.5%, Hispanic 12.5% | Subjects with type 2 diabetes |
| Control group | 56.0 ± 13.0 | 34.0 ± 7.0 | −2.1± 1.9 b,# | ||||||
| Study | Analyzed Groups | Fasting Glucose (mmol/L) | Fasting Insulin (pmol/L) | HOMA-IR | HbA1c (%) | ||||
|---|---|---|---|---|---|---|---|---|---|
| Pre-Intervention | Post-Intervention | Pre-Intervention | Post-Intervention | Pre-Intervention | Post-Intervention | Pre-Intervention | Post-Intervention | ||
| Boers et al. [13] | PD group | 6.1 ± 0.8 | 5.7 ± 0.8 | 82.64 ± 38.19 | 63.89 ± 34.03 | 3.30 ± 1.70 | 2.40 ± 1.60 | N/A | |
| Control group | 5.8 ± 0.7 | 5.5 ± 0.8 | 70.83 ± 45.14 | 65.97 ± 36.80 | 2.70 ± 1.80 | 2.40 ± 1.30 | |||
| Fontes-Villalba et al. [16] a | PD group | N/A | 118.00 ± 53.00 * | 69.00 ± 30.00 # | N/A | N/A | |||
| Control group | 75.00 ± 12.00 | 67.00 ± 20.00 | |||||||
| Jönsson et al. [9] a | PD group | 7.1 ± 0.7 * | 7.0 ± 1.4 * | 118.00 ± 53.00 * | 69.00 ± 30.00 # | 2.40 ± 1.00 | 1.40 ± 0.60 # | 6.20 ± 0.20 | 5.50 ± 0.70 *,# |
| Control group | 8.6 ± 1.2 | 7.5 ± 1.4 | 75.00 ± 12.00 | 67.00 ± 20.00 | 1.60 ± 0.30 | 1.40 ± 0.40 | 6.90 ± 0.70 | 5.90 ± 0.90 # | |
| Lindeberg et al. [17] | PD group b | 6.8 ± 1.3 | 5.2 ± 1.1 | 102.00 ± 36.00 | 91.00 ± 32.00 | 0.62 ± 0.38 | 0.47 ± 0.33 | 4.76 ± 0.26 | 4.61 ± 0.25 |
| PD group c | 5.1 ± 1.0 *,# | 86.00 ± 36.00 # | 0.39 ± 0.36 # | 4.64 ± 0.22 | |||||
| Control group b | 7.1 ± 1.8 | 5.8 ± 1.2 | 123.00 ± 68.00 | 100.00 ± 45.00 | 0.75 ± 0.53 | 0.55 ± 0.42 | 4.89 ± 0.79 | 4.84 ± 0.72 | |
| Control group c | 6.2 ± 1.4 | 101.00 ± 53.00 | 0.55 ± 0.46 # | 4.85 ± 0.69 | |||||
| Masharani et al. [18] | PD group | 8.4± 4.2 | −1.3 ± 1.4 d,* | N/A | N/A | 7.30± 2.10 | −0.30 ± 0.49 d,# | ||
| Control group | 7.7 ± 2.5 | 0.6 ± 1.8 d | 7.00 ± 1.50 | −0.18 ± 0.24 d,# | |||||
| Study | Year | Analyzed Groups | AUC 0–120 Glucose (mmol/L × min) | AUC 0–120 Insulin (pmol/L × min) | ||
|---|---|---|---|---|---|---|
| Pre-Intervention | Post-Intervention | Pre-Intervention | Post-Intervention | |||
| Boers et al. [13] | 2014 | PD group | 263 ± 208 | 245 ± 199 | 61,047 ± 43,056 | 47,729 ± 18,694 |
| Control group | 249 ± 162 | 262 ± 216 | 43,542 ± 25,132 | 48,299 ± 23,368 | ||
| Jönsson et al. [9] | 2009 | PD group | 1498 ± 227 | 1398 ± 314 # | 35,000 ± 13,000 | 26,000 ± 14,000 |
| Control group | 1734 ± 128 | 1478 ± 358 | 24,000 ± 8000 | 27,000 ± 13,000 | ||
| Lindeberg et al. [17] | 2007 | PD group a | 1104 ± 118 | 877 ± 161 # | 80,500 ± 41,100 | 63,100 ± 30,000 # |
| PD group b | 807 ± 107 *,# | 56,100 ± 30,100 # | ||||
| Control group a | 1145 ± 298 | 1024 ± 339 | 69,700 ± 44,700 | 54,100 ± 37,200 # | ||
| Control group b | 1065 ± 250 | 60,400 ± 46,400 | ||||
| Study | Selection Bias | Performance Bias | Detection Bias | Attrition Bias | Reporting Bias | Quality | |
|---|---|---|---|---|---|---|---|
| Random Sequence Generation | Allocation Concealment | Blinding of Participants and Personnel | Blinding of Outcome Assessment | Incomplete Outcome Data Addressed | Selective Reporting | ||
| Boers et al. [13] | + | − | − | + | + | + | Good |
| Fontes-Villalba et al. [16] a | + | − | − | + | + | + | Good |
| Jönsson et al. [9] a | + | − | − | + | + | + | Good |
| Lindeberg et al. [17] | + | − | − | + | ? | + | Good |
| Masharani et al. [18] | ? | − | − | − | + | + | Fair |
© 2020 by the authors. Licensee MDPI, Basel, Switzerland. This article is an open access article distributed under the terms and conditions of the Creative Commons Attribution (CC BY) license (http://creativecommons.org/licenses/by/4.0/).
Share and Cite
Jamka, M.; Kulczyński, B.; Juruć, A.; Gramza-Michałowska, A.; Stokes, C.S.; Walkowiak, J. The Effect of the Paleolithic Diet vs. Healthy Diets on Glucose and Insulin Homeostasis: A Systematic Review and Meta-Analysis of Randomized Controlled Trials. J. Clin. Med. 2020, 9, 296. https://doi.org/10.3390/jcm9020296
Jamka M, Kulczyński B, Juruć A, Gramza-Michałowska A, Stokes CS, Walkowiak J. The Effect of the Paleolithic Diet vs. Healthy Diets on Glucose and Insulin Homeostasis: A Systematic Review and Meta-Analysis of Randomized Controlled Trials. Journal of Clinical Medicine. 2020; 9(2):296. https://doi.org/10.3390/jcm9020296
Chicago/Turabian StyleJamka, Małgorzata, Bartosz Kulczyński, Agata Juruć, Anna Gramza-Michałowska, Caroline S. Stokes, and Jarosław Walkowiak. 2020. "The Effect of the Paleolithic Diet vs. Healthy Diets on Glucose and Insulin Homeostasis: A Systematic Review and Meta-Analysis of Randomized Controlled Trials" Journal of Clinical Medicine 9, no. 2: 296. https://doi.org/10.3390/jcm9020296