Article

CMR Tissue Characterization in Patients with HFmrEF

1
Department of Internal Medicine/Cardiology, German Heart Center Berlin, 13353 Berlin, Germany
2
DZHK (German Center for Cardiovascular Research), Partner Site Berlin, 10115 Berlin, Germany
3
Department of Internal Medicine/Cardiology, Charité Campus Virchow Klinikum, 13353 Berlin, Germany
4
Department of Cardiology, Medical Academy, Lithuanian University of Health Sciences, 50161 Kaunas, Lithuania
5
Philips Healthcare, 22335 Hamburg, Germany
*
Authors to whom correspondence should be addressed.
J. Clin. Med. 2019, 8(11), 1877; https://doi.org/10.3390/jcm8111877
Submission received: 11 September 2019 / Revised: 19 October 2019 / Accepted: 30 October 2019 / Published: 5 November 2019
(This article belongs to the Special Issue Acute and Chronic Heart Failure)

Abstract

:
The characteristics and optimal management of heart failure with a moderately reduced ejection fraction (HFmrEF, LV-EF 40–50%) are still unclear. Advanced cardiac MRI offers information about function, fibrosis and inflammation of the myocardium, and might help to characterize HFmrEF in terms of adverse cardiac remodeling. We, therefore, examined 17 patients with HFpEF, 18 with HFmrEF, 17 with HFrEF and 17 healthy, age-matched controls with cardiac MRI (Phillips 1.5 T). T1 and T2 relaxation time mapping was performed and the extracellular volume (ECV) was calculated. Global circumferential (GCS) and longitudinal strain (GLS) were derived from cine images. GLS (−15.7 ± 2.1) and GCS (−19.9 ± 4.1) were moderately reduced in HFmrEF, resembling systolic dysfunction. Native T1 relaxation times were elevated in HFmrEF (1027 ± 40 ms) and HFrEF (1033 ± 54 ms) compared to healthy controls (972 ± 31 ms) and HFpEF (985 ± 32 ms). T2 relaxation times were elevated in HFmrEF (55.4 ± 3.4 ms) and HFrEF (56.0 ± 6.0 ms) compared to healthy controls (50.6 ± 2.1 ms). Differences in ECV did not reach statistical significance. HFmrEF differs from healthy controls and shares similarities with HFrEF in cardiac MRI parameters of fibrosis and inflammation.

1. Introduction

Heart failure is a clinical entity with a diverse spectrum of etiologies and phenotypes. Classification systems and diagnostic criteria have been established paralleling better understanding of its pathophysiology. Early on, the significance of the left ventricular ejection fraction (LV-EF) in the classification of heart failure was acknowledged. The European Society of Cardiology recently suggested to define heart failure with moderately reduced ejection fraction (HFmrEF, LV-EF 40–50%) as a distinct category between heart failure with preserved (HFpEF, LV-EF > 50%) and reduced (HFrEF, LV-EF < 40%) ejection fractions [1]. Patients with HFrEF exhibit functional, structural, cellular and interstitial changes that are summarized as left ventricular remodeling and treatments targeted against remodeling are a mainstay of HFrEF therapy [2]. Unfortunately, these treatments have shown markedly less benefits in patients with HFpEF [3]. Patients with HFmrEF have only recently been proposed as a distinct category, and while debate is still ongoing about whether it truly represents a distinct category or merely a transition zone between HFpEF and HFrEF, available data suggests a possible benefit from treatment against remodeling [4].
Cardiac magnetic resonance (CMR) imaging is a noninvasive method to assess cardiac function, structure, inflammation, and fibrosis. The development of T1 and T2 relaxation time mapping techniques has greatly improved the ability to detect changes in tissue composition, most notably fibrosis and edema [5]. The combination of pre-contrast (native) and post-contrast T1 relaxation time mapping allows an estimation of the extracellular volume (ECV) [6]. While elevations in ECV and native T1 relaxation time seem more related to fibrosis and are strong predictors of adverse outcome, the T2 relaxation time seems more sensitive for the diagnosis of edema and inflammation [7,8,9]. In addition, strain-analysis is a promising new method of functional analysis whose clinical significance is currently still under investigation and which might provide additional prognostic and diagnostic information in heart failure patients [10].
The purpose of our study was to further characterize HFmrEF patients in terms of advanced CMR imaging markers of adverse cardiac remodeling, with a focus on T2 mapping as a potential biomarker in heart failure.

2. Experimental Section

From a contemporary trial, a total of 52 well characterized patients with HFpEF, HFmrEF and HFrEF, along with 17 controls, were included in this analysis (EMPATHY-HF, German Clinical Trials Register ID: DRKS00015615) [11]. HFrEF, HFmrEF and HFpEF were defined according to the 2016 ESC guidelines [1]. The study complies with the declaration of Helsinki and was approved by the ethics committee of the Charité-Universitätsmedizin Berlin. All analyses and procedures are covered by the informed consent obtained prior to inclusion. All patients were >45 years, had signs and symptoms of heart failure NYHA II or III (at least 30 d prior to screening), had been stable for at least 7 d (defined as no i.v. diuretics or inotropics, no hospitalization and no medication change). The complete inclusion and exclusion criteria are accessible through the German Clinical Trials Register [11]. All patients received a screening-echocardiography, a cardiac MRI and a comprehensive laboratory evaluation as part of the main study protocol. Quality of life was assessed using the Minnesota Living with Heart Failure Questionnaire. For our analysis, the patients were reclassified based on the results of the cardiac MRI derived LV-EF, leading to 17 patients with HFpEF, 18 with HFmrEF and 17 with HFrEF. When comparing MRI-derived LV-EF to echocardiography-derived LV-EF, roughly one third of HFpEF patients were reclassified as HFmrEF and half of the HFmrEF patients were reclassified as HFrEF.
All patients were examined with a clinical 1.5 Tesla MRI scanner (Achieva, Philips Healthcare, Best, The Netherlands) equipped with a cardiac, five-element phased array coil. Cine images were acquired using a retrospectively gated cine-CMR in cardiac short-axis, vertical long-axis and horizontal long-axis orientations using a steady-state free precession (SSFP) sequence. Native and 15 min post contrast T1-mapping were performed using a modified Look-Locker (MOLLI) 5s(3s)3s-scheme [12]. Typical imaging parameters were as follows: Acquired voxel size = 2.0 × 2.0 × 10 mm3, reconstructed voxel size = 0.5 × 0.5 × 10 mm3, balanced SSFP readout, flip angle = 35°, parallel imaging (SENSE) factor = 2 and effective inversion times between 150 and 3382 ms. T2-mapping was performed before administration of contrast media using a black-blood-prepared, navigator-gated, free-breathing hybrid gradient (echo planar imaging, EPI) and a spin-echo multi-echo sequence (GraSE), as described previously, with the following typical imaging parameters: TR = 1 heartbeat, 9 echoes (TE1 = 15 ms, delta TE = 7.7 ms), FA 90°, parallel imaging (SENSE = 2), EPI factor = 7, black-blood prepulse and breath-hold (scan duration about 14 s). [13] Patients received 0.15 mmol/kg of gadolinium-based contrast agent (Gadobutrol 1.0 mmol/mL, Gadovist®, Bayer AG, Leverkusen, Germany). Quantitative modified DIXON-imaging (mDIXON) for late enhancement was performed using a black-blood prepared, T1-weighted, spoiled-gradient, multi-echo sequence with 6 echoes starting 10 min post contrast agent application. Typical imaging parameters were as follows: Acquired voxel size = 2.0 × 2.0 × 8 mm3, reconstructed voxel size = 1.1 × 1.1 × 8 mm3, flip angle = 15° and effective echo time 4.75 ms.
Image analysis was performed offline using commercially available software (Medis Suite version 3.1, Medis Medical Imaging Systems bv Leiden, The Netherlands, and Extended MR WorkSpace version 2.6.3.5, Philips Medical Systems Nederland B.V., Best, The Netherlands). Late gadolinium enhancement (LGE) was assessed visually from mDIXON images. Segments with LGE were excluded from analysis, resulting in a total of 659 analyzed segments using a 16-segment-model. Mapping parameters were measured using QMap RE version 2.0 (Medis Medical Imaging Systems bv, Leiden, the Netherlands). Pre and post-contrast MOLLI images were manually corrected for in-plane-motion. The T1 and T2 relaxation times were calculated using nonlinear fitting with a maximum likelihood estimator (MLE). Extracellular volume (ECV) was calculated from pre and post-contrast T1-maps and the hematocrit, as described previously [6]. Due to possible harm, healthy controls received no contrast agent and were, therefore, not included in the ECV analysis. For comparison, data from a previous study using the same scanner model and contrast agent were used [14]. Exemplary images of patients with HFpEF, HFmrEF and HFpEF, and controls, are given in Figure 1A–L. For T1 native, T2 and ECV, the median value of all segments without late enhancement was calculated for each patient and used for all further analyses. In case of extensive artifacts in an imaging sequence, the patient was excluded from the respective analysis at the discretion of the analyzing physician. Peak left ventricular endocardial global longitudinal (GLS) and circumferential (GCS) strain were analyzed in accordance with a recent consensus document for the quantification of LV function using CMR [15]. Strain analysis included 2-chamber, 3-chamber and 4-chamber cine images and three preselected slices from the LV short-axis stack to correspond to basal, mid-ventricular and apical levels. The endocardial contours were drawn on the long and short-axis cine images with QMass version 8.1 (Medis Medical Imaging Systems bv, Leiden, the Netherlands) and were subsequently transferred to QStrain RE version 2.0 (Medis Medical Imaging Systems bv, Leiden, the Netherlands), where endocardial and epicardial borders were detected throughout the whole cardiac cycle using a tissue tracking algorithm. From these, global longitudinal and circumferential endocardial strain curves were calculated and the maximal amplitude was considered as the respective peak global strain. The strain ratio (SR = GLS/GCS) was calculated to assess for possible differences between heart failure groups.
Statistical analysis was performed using SPSS 24 (IBM, Armonk, NY, USA) and R 3.5.1 (The R Foundation for Statistical Computing, Vienna, Austria) [7]. Baseline data were reported as means ± standard deviations (SD) for interval and ratio-scaled parameters and as numbers and percentages for nominal and ordinal-scaled parameters. For comparisons between groups, ANOVA with Tukey–Kramer post-hoc analysis was performed. Pearson correlation coefficients were calculated for correlations between continuous variables and were tested for significance under the null hypothesis of r = 0. For quality of life, Spearman correlation was used. p-values below 0.05 were considered statistically significant.
Sample size calculations were performed for the detection of significant differences in native T1 relaxation time, T2 relaxation time and ECV between groups with a power of 80%. For native T1 relaxation time, previous studies have shown standard deviations between 20 and 50 ms and effect sizes of 30 to 40 ms [14,16]. For T2 relaxation time, standard deviations ranged from 3 to 7 ms and effect sizes from 3 to 5 ms [17,18]. For ECV, previous studies have shown standard deviations of 3–4% with effect sizes of about 4% [19,20]. Assuming a ratio of effect size to standard deviation of 1 for all three parameters, the minimum sample size is 16 per group.

3. Results

3.1. Patients

17 patients with HFpEF, 18 with HFmrEF, 17 with HFrEF and 17 controls were included in the analysis. The baseline data of the patients and controls are given in Table 1. Overall, controls were healthier, younger and more likely to be female than HF patients. Between HF groups, there were relevant differences in sex, age, coronary artery disease, history of smoking, lab values (most notably hematocrit and N-terminal pro brain natriuritic peptide—NT-proBNP) and medication use. NT-proBNP was log-normally distributed and transformed to logarithmic for correlation analysis. A correlation matrix of all continuous baseline and imaging parameters is given in Figure S1.

3.2. CMR-Parameters

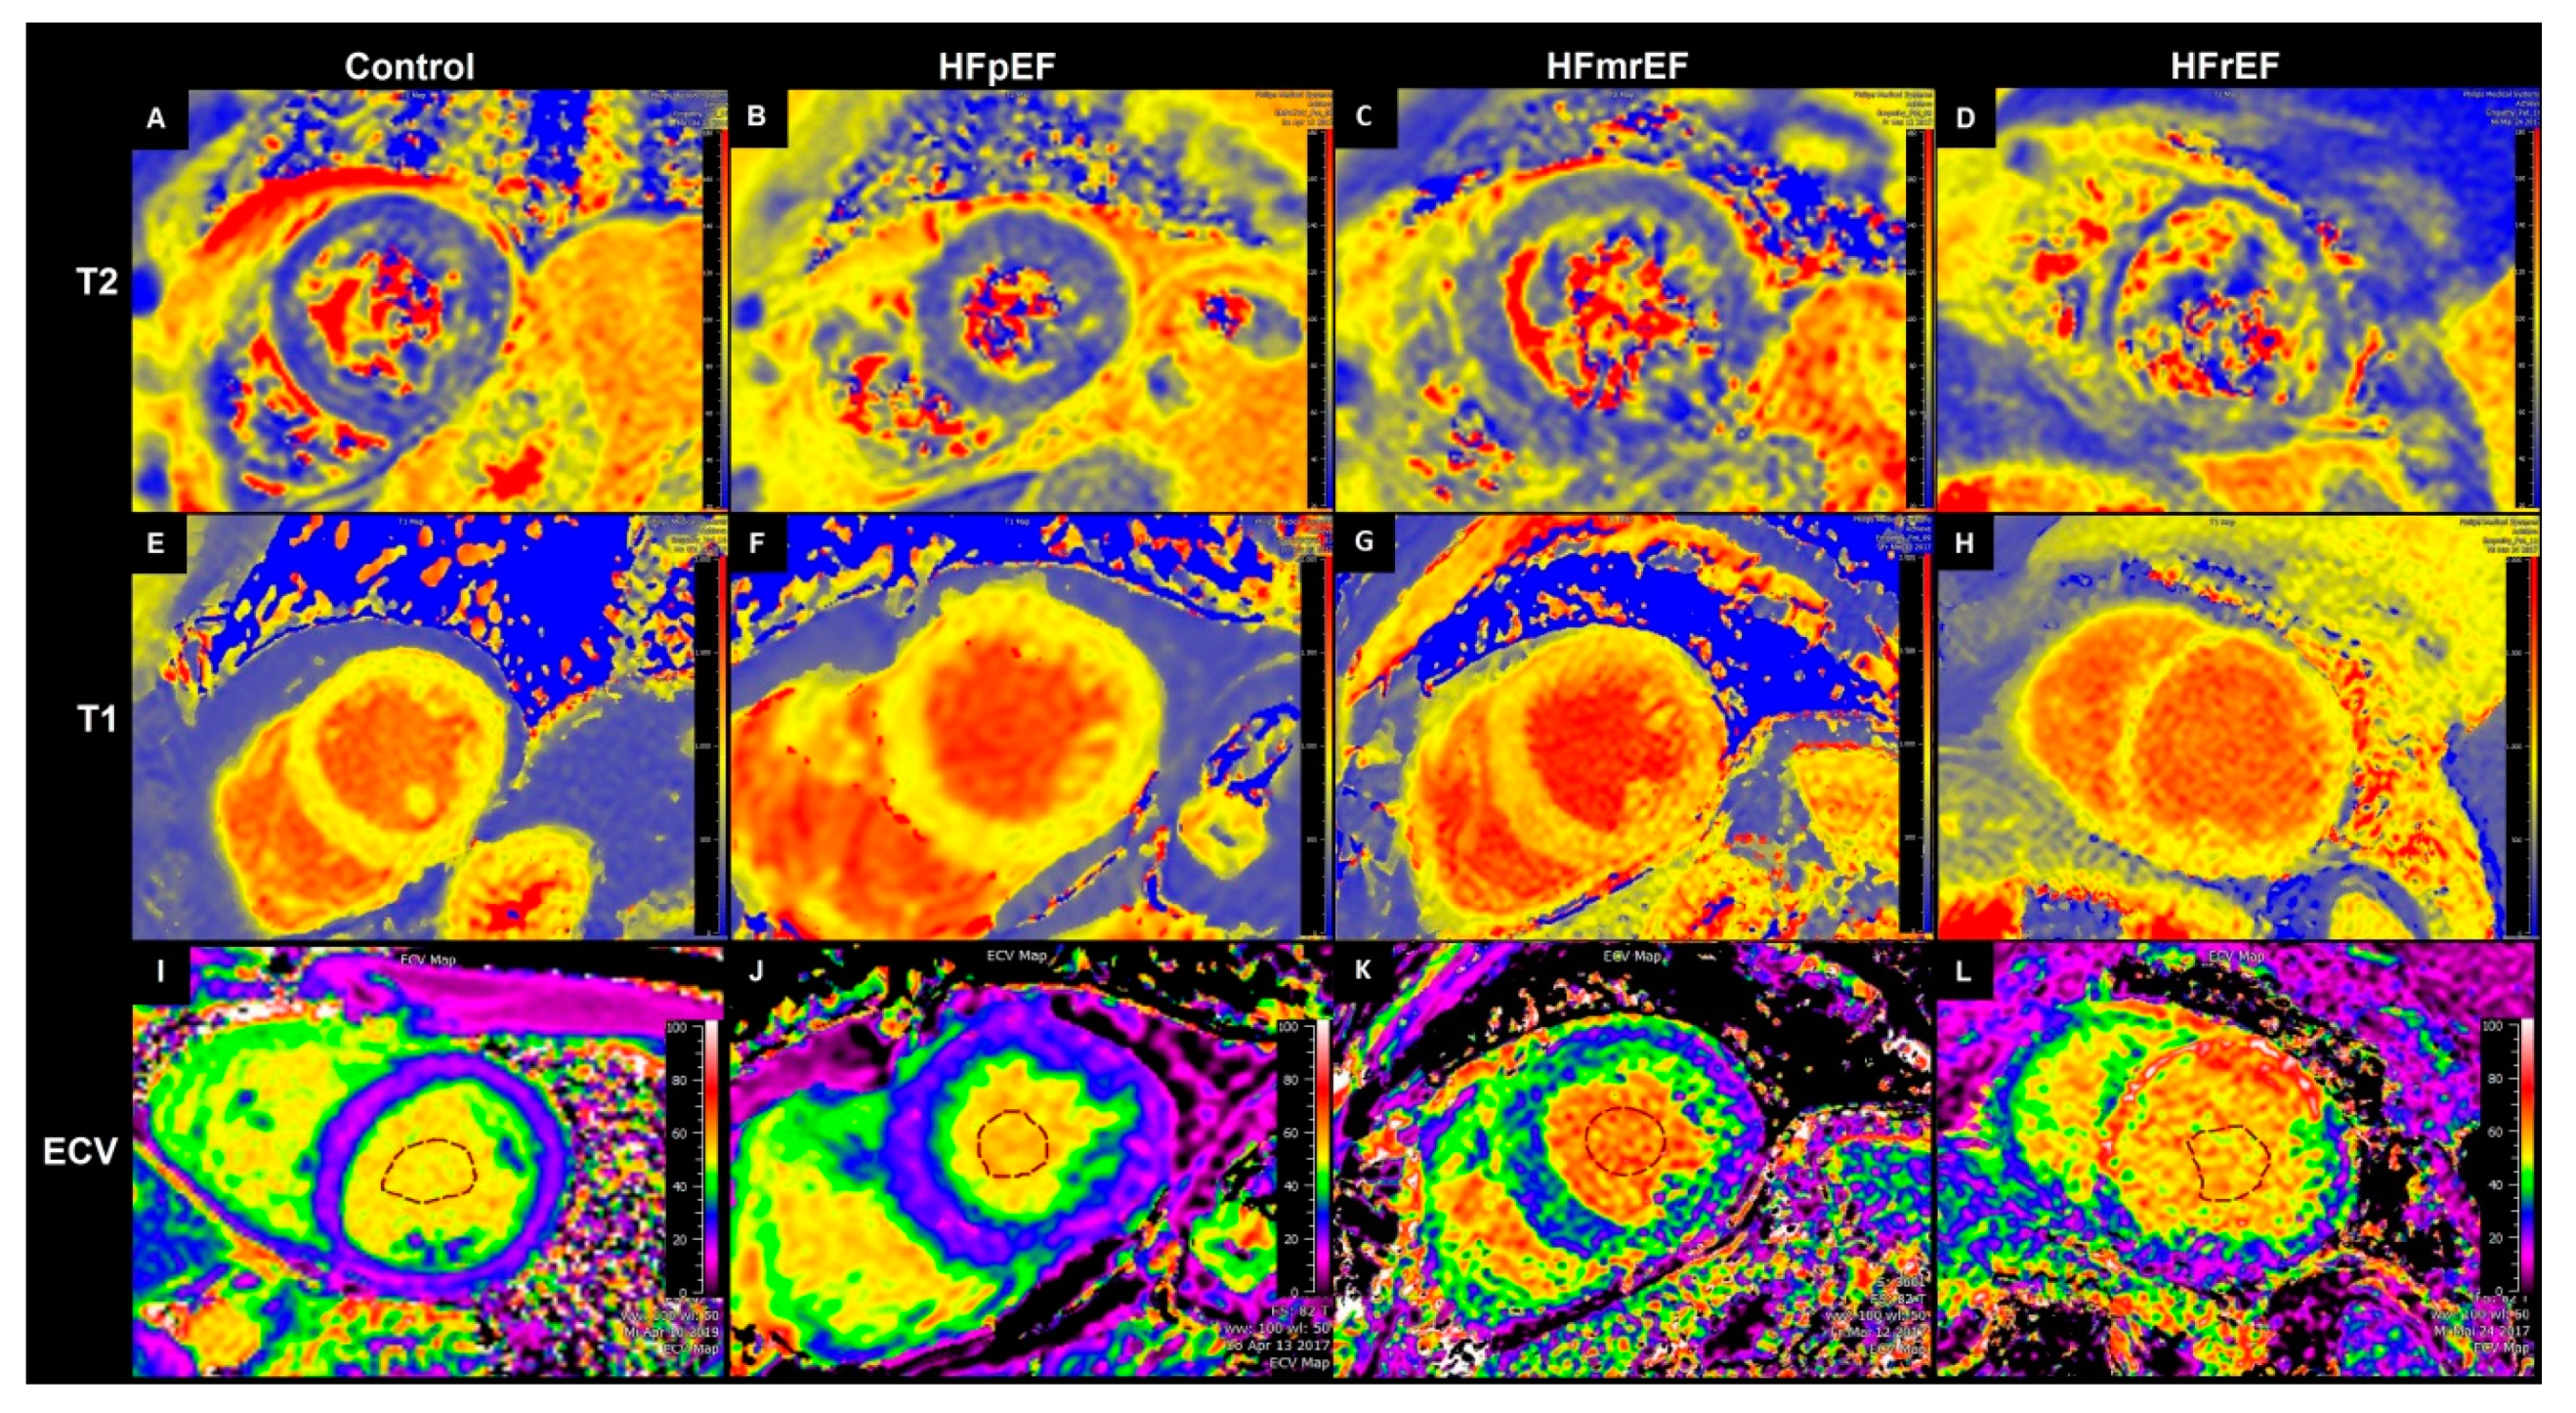
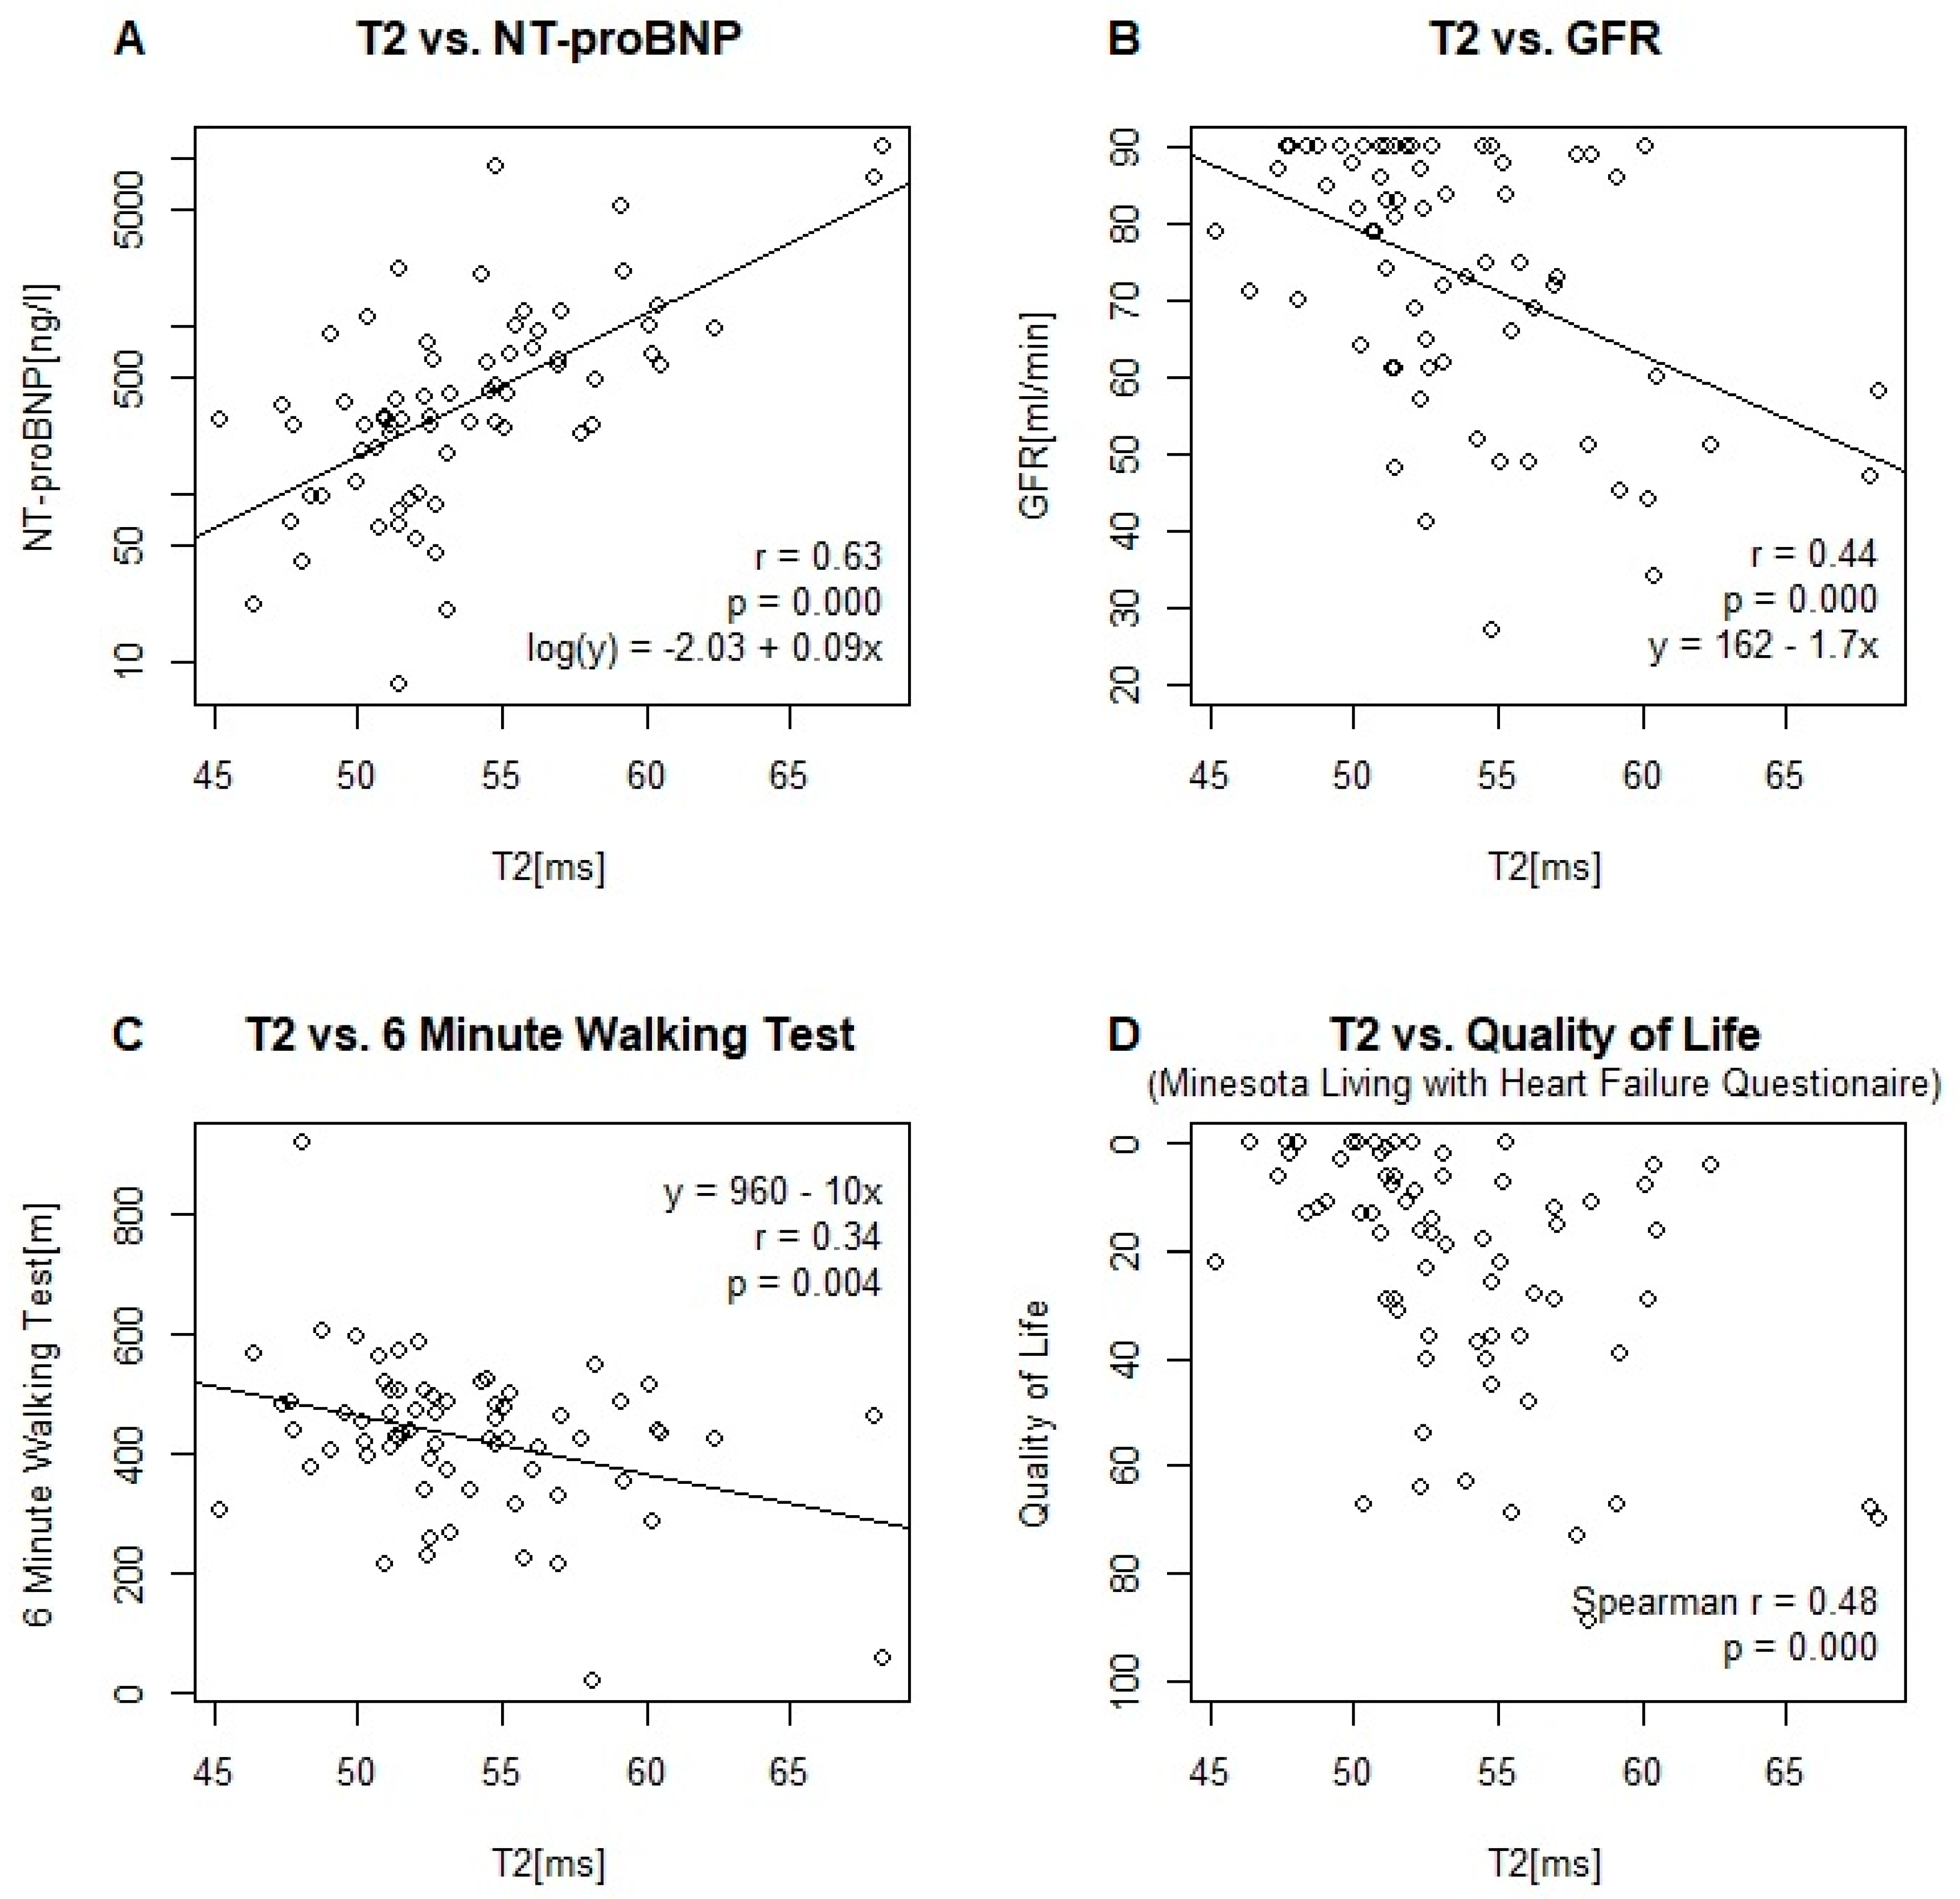
3.2.1. T2 Relaxation Time

One patient with HFpEF was excluded from analysis due to extensive artifacts. A boxplot of the measurements by group is given in Figure 2A. T2 relaxation times in HFmrEF and HFrEF patients were significantly elevated compared to healthy controls (Table 2). HFpEF patients did not differ significantly from healthy controls. Correlations of T2 with other MRI and baseline-parameters are given in Table 3. Scatter plots, and where appropriate, linear model parameter estimates are given in Figure 3 for the relationship between T2 and NT-proBNP, glomerular filtration rate (GFR), the 6 min walking test and quality of life.

3.2.2. T1 Relaxation Time

One patient with HFpEF and one patient with HFmrEF were excluded from analysis due to extensive artifacts. A boxplot of the measurements by group is given in Figure 2B. Patients with both HFmrEF and HFrEF showed significantly higher T1 relaxation times than controls and HFpEF patients (Table 2). The difference between HFrEF and HFmrEF patients and the difference between HFpEF patients and controls was not statistically significant. The correlations of the T1 relaxation time with MRI and baseline-parameters are given in Table 3.

3.2.3. Extracellular Volume (ECV)

The ECV was calculated for patients with HFpEF, HFmrEF and HFrEF. One patient with HFpEF and one with HFmrEF were excluded from analysis due to extensive artifacts in the T1 mapping sequences, from which ECV would be calculated. A boxplot of the measurements by group is given in Figure 2C and compared to historical data by Dabir et al. for volunteers [14]. None of the differences reached statistical significance (Table 2). The correlations of the ECV with MRI and baseline-parameters are given in Table 3.

3.2.4. Strain

Boxplots for the measurements of GCS, GLS and SR (GLS/GCS) are given in Figure 2D–F. There were no statistically significant differences between HFpEF and controls. Patients with HFmrEF showed significant impairment in both circumferential and longitudinal strain, with further impairment being present in HFrEF patients, reflecting systolic dysfunction. The SR in HFpEF was significantly lower than in HFmrEF and HFrEF. The correlations of the strain parameters with MRI and baseline-parameters are given in Table 3.

4. Discussion

Our study is the first to date to examine advanced imaging markers of remodeling in patients with HFmrEF.
Differences in ECV did not reach statistical significance. The ECV values in our HFpEF patients were lower than those reported in other studies, ranging from 28.3% to 32.9% (Table S1) [19,20,21,22,23]. The difference might be partly explained by differences in the applied scanners, sequences, contrast agents, image analysis, exclusion of LGE and LF-EF cut-off values for HFpEF. The lower ECV might also reflect our slightly healthier HFpEF group compared to previous studies. In our study, great effort was taken to manually adjust MOLLI-images for in-plane motion, thereby reducing artifacts by blood-signal. Blood has higher T1 and ECV values compared to myocardium, leading to falsely elevated myocardial ECV and T1 measurements in case of uncorrected in-plane motion. Additionally, while many studies used mid-ventricular septal measurements, our study measured the median value of all 16 myocardial segments, excluding segments with late enhancement. We chose our approach to be more representative of global left ventricular remodeling and less susceptible to artifacts and focal changes. One study comparing ECV in HFpEF versus HFrEF found a higher ECV in HFrEF, most likely representing advanced fibrosis in HFrEF [22]. Our study did not assess ECV in healthy volunteers. However, data from another study using the same scanner, mapping-sequence and contrast agent found a mean ECV of 27% ± 4% in healthy volunteers [14].
Native T1 relaxation times in HFmrEF were closer to HFrEF than HFpEF. A summary of studies examining native T1 relaxation times is given in Table S1. One study using the same field strength and MRI manufacturer found higher T1 relaxation times for both controls and HFpEF patients compared to our data [19]. Another study using the same field strength and a different MRI manufacturer found similar T1 relaxation times [21]. Yet another study of healthy volunteers found lower T1 relaxation times compared to our controls [14]. The reason for the difference might be attributable to the local setup, as T1 relaxation times are known to be highly setup dependent [24]. Assuming that elevations in native T1 relaxation times truly reflect fibrosis, our findings suggest that HFmrEF shares common pathophysiological changes with HFrEF, while HFpEF seems to resemble a different pathophysiological entity. The lower values for fibrosis markers in HFpEF compared to HFrEF might at least partly explain the lower effectiveness of renin-angiotensin-aldosterone system (RAAS) inhibitors in HFpEF [3,25]. On the other hand, if our findings were to be confirmed in further studies, patients with HFmrEF would be expected to benefit from RAAS inhibitors. This would be in line with the findings of the PARAGON-HF trial, which showed no overall benefit of angiotensin-neprilysin inhibition in all patients with an LV-EF > 45% but a possible benefit for the subgroup with an LV-EF below the median [26].
T2 relaxation times were significantly elevated in HFmrEF and HFrEF compared to healthy controls. Our values for T2 relaxation times in controls were within the published reference range for our mapping sequence [27]. To our knowledge, no studies examining T2 relaxation time in HFpEF and HFmrEF have been published to date. An increase in T2 relaxation time is likely to reflect increased myocardial water content, as it is commonly seen in inflammatory states and myocardial edema [9,28]. Elevated T2 relaxation times have also been found in dilated cardiomyopathy and acute myocardial infarction [29,30]. Current evidence suggests a coincidence of myocardial inflammation and heart failure, although the exact mechanism remains unclear [31]. Consequently, our observed increase in myocardial T2 relaxation times might reflect subclinical myocardial inflammation in heart failure. Of all MRI parameters, T2 relaxation time showed the highest correlation with NT-proBNP and quality of life, and was the only MRI parameter significantly correlated with the 6 min walking test and the GFR. The latter warrants further investigation and might reflect cardiac involvement in renal disease. Irrespective of the exact underlying mechanism, our findings provide further evidence for pathophysiological similarities between HFmrEF and HFrEF.
The observed increase in both longitudinal and circumferential strain in HFmrEF and HFrEF reflects the reduced ejection fraction. Our strain values for controls and patients with HFpEF were within previously published reference values for cardiac MRI-derived endocardial strain [10]. Impairment of both GCS and GLS has been reported in patients with HFpEF both for MRI and speckle tracking echocardiography (STE) derived strain values. [32,33] Of note, while STE and MRI-derived measurements for GLS and GCS generally show good correlations, the absolute values may differ depending on the technique applied [34].
In our study, GLS and GCS seem to increase at different rates as the LV-EF decreases, so that the ratio of longitudinal to circumferential strain (strain ratio, SR) differs in HFpEF compared to HFmrEF and HFrEF. To our knowledge, no previous study has examined the strain ratio as a cardiac parameter. The significance of this remains to be determined in future studies.
One limitation of all parametric mapping studies is the inherent dependence of the measurements on the local setup. Our study does not intend to provide diagnostic criteria but to characterize the heart failure subtypes in relation to each other in terms of pathophysiological targets.
Another obvious limitation of our study is its small sample size. Consequently, small differences between groups and correlations between parameters may have been missed. Yet, despite the small sample size, we found significant differences between heart failure subgroups and hope to contribute towards the characterization of HFmrEF. Our p-values were not corrected for multiple testing and should be confirmed in further studies.
The groups differed in baseline parameters, such as age, sex, comorbidities, laboratory values and medication use. The differences observed are mostly consistent with previous studies, showing intermediate values in HFmrEF compared to HFpEF and HFrEF for the parameters age, sex and NT-proBNP [35,36,37]. Our HFpEF group seems to be slightly healthier compared to previous studies in regard to mean NT-proBNP, GFR and diuretic use, which might explain some of the differences. Regarding the prevalence of coronary artery disease, previous studies have shown mixed results, with some showing the highest prevalence in HFmrEF, and others in HFrEF [36,38,39]. Mapping parameters were not influenced by the presence of transmural LGE in the excluded segments (Table S2). While mapping and strain parameters showed no relevant correlation with sex (Table S3), hematocrit and age (Table 3), they were indeed highly correlated with NT-proBNP (Table 3). Due to the small sample size, no multivariate analysis was performed and our results may be confounded by these differences, which might be inherent to the underlying pathology.
The high number of patients reclassified with MRI-derived LV-EF compared to echocardiography-derived LV-EF diminishes the comparability of our results with trials relying on echocardiography alone. Furthermore, the question arises as to how many HFpEF patients in the general population actually do have a moderate reduction in LV-EF that is missed by echocardiography.

5. Conclusions

Despite the small sample size, our study was able to show significant adverse remodeling beyond systolic functional impairment in patients with HFmrEF that resembles the changes seen in HFrEF.

Supplementary Materials

The following are available online at https://www.mdpi.com/2077-0383/8/11/1877/s1, Figure S1: Correlation matrix for all continuous baseline and imaging parameters. Table S1: Comparator studies for native T1 (ms) and ECV (%). Table S2: Differences in MRI-parameters by transmural LGE. Table S3: Differences in MRI-parameters between females and males.

Author Contributions

Conceptualization, D.H., F.E., H.-D.D. and S.K.; data curation, R.T., T.L., L.A.M., M.B., E.T., A.D., R.K. and S.M.Z.; formal analysis, P.D.; funding acquisition, S.K.; investigation, P.D., D.H., R.T. and T.L.; methodology, C.S.; project administration, F.E., H.-D.D. and S.K.; resources, R.G., B.P. and S.K.; supervision, S.K.; validation, S.M.Z.; visualization, P.D.; writing—original draft, P.D.; writing—review and editing, P.D., M.B., F.E., H.-D.D. and S.K.

Funding

This work was supported by an unrestricted grant of Philips Healthcare to S.K. T.L. received support from the Lithuanian University of Health Sciences. P.D., D.H., T.L., S.K., F.E., H.-D.D. and B.P. received support from the DZHK (German Center for Cardiovascular Research), Partner Site Berlin. C.S. is an employee of Philips Healthcare.

Acknowledgments

We thank all study participants, the MRI-technicians Gudrun Großer and Corinna Else and our study nurse Monica Post for their time and effort.

Conflicts of Interest

P.D. received a travel grant from Biotronic and owns stock of Siemens AG and Bayer AG. P.D., D.H., T.L., S.K., F.E., H.-D.D. and B.P. received support from the DZHK (German Centre for Cardiovascular Research). C.S. is an employee of Philips Healthcare. B.P. has received advisory board and lecture honoraria from Bayer Healthcare, Novartis, Merck Sharp and Dohme, Stealth Peptides, Sanofi and Servier. F.E. has received advisory board and lecture honoraria from Boehringer Ingelheim, Bayer Healthcare, Novartis, Merck Sharp and Dohme, Vifor, and Servier. H.-D.D. received advisory board honoraria from Bayer, Novartis, Stealt and Berlin Cures. S.K. was supported by an unrestricted research grant from Philips Health Care. All other authors declare that they have no financial or non-financial competing interest to disclose.

References

  1. Ponikowski, P.; Voors, A.A.; Anker, S.D.; Bueno, H.; Cleland, J.G.; Coats, A.J.; Falk, V.; Gonzalez-Juanatey, J.R.; Harjola, V.P.; Jankowska, E.A.; et al. ESC Guidelines for the diagnosis and treatment of acute and chronic heart failure: The Task Force for the diagnosis and treatment of acute and chronic heart failure of the European Society of Cardiology (ESC). Developed with the special contribution of the Heart Failure Association (HFA) of the ESC. Eur. J. Heart Fail. 2016, 18, 891–975. [Google Scholar] [CrossRef]
  2. Cohn, J.N.; Ferrari, R.; Sharpe, N. Cardiac remodeling—Concepts and clinical implications: A consensus paper from an international forum on cardiac remodeling. Behalf of an International Forum on Cardiac Remodeling. J. Am. Coll. Cardiol. 2000, 35, 569–582. [Google Scholar] [CrossRef]
  3. Zheng, S.L.; Chan, F.T.; Nabeebaccus, A.A.; Shah, A.M.; McDonagh, T.; Okonko, D.O.; Ayis, S. Drug treatment effects on outcomes in heart failure with preserved ejection fraction: A systematic review and meta-analysis. Heart 2018, 104, 407–415. [Google Scholar] [CrossRef]
  4. Altaie, S.; Khalife, W. The prognosis of mid-range ejection fraction heart failure: A systematic review and meta-analysis. ESC Heart Fail. 2018, 5, 1008–1016. [Google Scholar] [CrossRef]
  5. Messroghli, D.R.; Moon, J.C.; Ferreira, V.M.; Grosse-Wortmann, L.; He, T.; Kellman, P.; Mascherbauer, J.; Nezafat, R.; Salerno, M.; Schelbert, E.B.; et al. Clinical recommendations for cardiovascular magnetic resonance mapping of T1, T2, T2* and extracellular volume: A consensus statement by the Society for Cardiovascular Magnetic Resonance (SCMR) endorsed by the European Association for Cardiovascular Imaging (EACVI). J. Cardiovasc. Magn. Reson. 2017, 19, 75. [Google Scholar] [CrossRef]
  6. Ugander, M.; Oki, A.J.; Hsu, L.Y.; Kellman, P.; Greiser, A.; Aletras, A.H.; Sibley, C.T.; Chen, M.Y.; Bandettini, W.P.; Arai, A.E. Extracellular volume imaging by magnetic resonance imaging provides insights into overt and sub-clinical myocardial pathology. Eur. Heart J. 2012, 33, 1268–1278. [Google Scholar] [CrossRef] [Green Version]
  7. Puntmann, V.O.; Carr-White, G.; Jabbour, A.; Yu, C.Y.; Gebker, R.; Kelle, S.; Hinojar, R.; Doltra, A.; Varma, N.; Child, N.; et al. T1-Mapping and Outcome in Nonischemic Cardiomyopathy: All-Cause Mortality and Heart Failure. JACC 2016, 9, 40–50. [Google Scholar] [CrossRef]
  8. Schelbert, E.B.; Piehler, K.M.; Zareba, K.M.; Moon, J.C.; Ugander, M.; Messroghli, D.R.; Valeti, U.S.; Chang, C.C.; Shroff, S.G.; Diez, J.; et al. Myocardial Fibrosis Quantified by Extracellular Volume Is Associated With Subsequent Hospitalization for Heart Failure, Death, or Both Across the Spectrum of Ejection Fraction and Heart Failure Stage. J. Am. Heart Assoc. 2015, 4, e002613. [Google Scholar] [CrossRef]
  9. Bohnen, S.; Radunski, U.K.; Lund, G.K.; Kandolf, R.; Stehning, C.; Schnackenburg, B.; Adam, G.; Blankenberg, S.; Muellerleile, K. Performance of t1 and t2 mapping cardiovascular magnetic resonance to detect active myocarditis in patients with recent-onset heart failure. Circ. Cardiovasc. Imaging 2015, 8, e003073. [Google Scholar] [CrossRef]
  10. Scatteia, A.; Baritussio, A.; Bucciarelli-Ducci, C. Strain imaging using cardiac magnetic resonance. Heart Fail. Rev. 2017, 22, 465–476. [Google Scholar] [CrossRef]
  11. DRKS-German Clinical Trials Register. DRKS00015615. Available online: https://www.drks.de (accessed on 10 September 2019).
  12. Messroghli, D.R.; Radjenovic, A.; Kozerke, S.; Higgins, D.M.; Sivananthan, M.U.; Ridgway, J.P. Modified Look-Locker inversion recovery (MOLLI) for high-resolution T1 mapping of the heart. Magn. Reson. Med. 2004, 52, 141–146. [Google Scholar] [CrossRef] [PubMed]
  13. Baessler, B.; Schaarschmidt, F.; Stehning, C.; Schnackenburg, B.; Maintz, D.; Bunck, A.C. Cardiac T2-mapping using a fast gradient echo spin echo sequence-first in vitro and in vivo experience. J. Cardiovasc. Magn. Reson. 2015, 17, 67. [Google Scholar] [CrossRef] [PubMed]
  14. Dabir, D.; Child, N.; Kalra, A.; Rogers, T.; Gebker, R.; Jabbour, A.; Plein, S.; Yu, C.Y.; Otton, J.; Kidambi, A.; et al. Reference values for healthy human myocardium using a T1 mapping methodology: Results from the International T1 Multicenter cardiovascular magnetic resonance study. J. Cardiovasc. Magn. Reson. 2014, 16, 69. [Google Scholar] [CrossRef] [PubMed]
  15. Suinesiaputra, A.; Bluemke, D.A.; Cowan, B.R.; Friedrich, M.G.; Kramer, C.M.; Kwong, R.; Plein, S.; Schulz-Menger, J.; Westenberg, J.J.; Young, A.A.; et al. Quantification of LV function and mass by cardiovascular magnetic resonance: Multi-center variability and consensus contours. J. Cardiovasc. Magn. Reson. 2015, 17, 63. [Google Scholar] [CrossRef]
  16. aus dem Siepen, F.; Buss, S.J.; Messroghli, D.; Andre, F.; Lossnitzer, D.; Seitz, S.; Keller, M.; Schnabel, P.A.; Giannitsis, E.; Korosoglou, G.; et al. T1 mapping in dilated cardiomyopathy with cardiac magnetic resonance: Quantification of diffuse myocardial fibrosis and comparison with endomyocardial biopsy. Eur. Heart J. Cardiovasc. Imaging 2015, 16, 210–216. [Google Scholar] [CrossRef] [PubMed]
  17. Lurz, P.; Luecke, C.; Eitel, I.; Fohrenbach, F.; Frank, C.; Grothoff, M.; de Waha, S.; Rommel, K.P.; Lurz, J.A.; Klingel, K.; et al. Comprehensive Cardiac Magnetic Resonance Imaging in Patients With Suspected Myocarditis: The MyoRacer-Trial. J. Am. Coll. Cardiol. 2016, 67, 1800–1811. [Google Scholar] [CrossRef] [PubMed]
  18. Mordi, I.; Carrick, D.; Bezerra, H.; Tzemos, N. T1 and T2 mapping for early diagnosis of dilated non-ischaemic cardiomyopathy in middle-aged patients and differentiation from normal physiological adaptation. Eur. Heart J. Cardiovasc. Imaging 2016, 17, 797–803. [Google Scholar] [CrossRef]
  19. Rommel, K.P.; von Roeder, M.; Latuscynski, K.; Oberueck, C.; Blazek, S.; Fengler, K.; Besler, C.; Sandri, M.; Lucke, C.; Gutberlet, M.; et al. Extracellular Volume Fraction for Characterization of Patients With Heart Failure and Preserved Ejection Fraction. J. Am. Coll. Cardiol. 2016, 67, 1815–1825. [Google Scholar] [CrossRef]
  20. Roy, C.; Slimani, A.; de Meester, C.; Amzulescu, M.; Pasquet, A.; Vancraeynest, D.; Beauloye, C.; Vanoverschelde, J.L.; Gerber, B.L.; Pouleur, A.C. Associations and prognostic significance of diffuse myocardial fibrosis by cardiovascular magnetic resonance in heart failure with preserved ejection fraction. J. Cardiovasc. Magn. Reson. 2018, 20, 55. [Google Scholar] [CrossRef]
  21. Duca, F.; Kammerlander, A.A.; Zotter-Tufaro, C.; Aschauer, S.; Schwaiger, M.L.; Marzluf, B.A.; Bonderman, D.; Mascherbauer, J. Interstitial Fibrosis, Functional Status, and Outcomes in Heart Failure With Preserved Ejection Fraction: Insights From a Prospective Cardiac Magnetic Resonance Imaging Study. Circ. Cardiovasc. Imaging 2016, 9, e005277. [Google Scholar] [CrossRef]
  22. Su, M.Y.; Lin, L.Y.; Tseng, Y.H.; Chang, C.C.; Wu, C.K.; Lin, J.L.; Tseng, W.Y. CMR-verified diffuse myocardial fibrosis is associated with diastolic dysfunction in HFpEF. JACC Cardiovasc. Imaging 2014, 7, 991–997. [Google Scholar] [CrossRef] [PubMed]
  23. Schelbert, E.B.; Fridman, Y.; Wong, T.C.; Abu Daya, H.; Piehler, K.M.; Kadakkal, A.; Miller, C.A.; Ugander, M.; Maanja, M.; Kellman, P.; et al. Temporal Relation Between Myocardial Fibrosis and Heart Failure With Preserved Ejection Fraction: Association With Baseline Disease Severity and Subsequent Outcome. JAMA Cardiol. 2017, 2, 995–1006. [Google Scholar] [CrossRef] [PubMed]
  24. Kawel-Boehm, N.; Maceira, A.; Valsangiacomo-Buechel, E.R.; Vogel-Claussen, J.; Turkbey, E.B.; Williams, R.; Plein, S.; Tee, M.; Eng, J.; Bluemke, D.A. Normal values for cardiovascular magnetic resonance in adults and children. J. Cardiovasc. Magn. Reson. 2015, 17, 29. [Google Scholar] [CrossRef] [PubMed]
  25. Butler, J.; Fonarow, G.C.; Zile, M.R.; Lam, C.S.; Roessig, L.; Schelbert, E.B.; Shah, S.J.; Ahmed, A.; Bonow, R.O.; Cleland, J.G.; et al. Developing therapies for heart failure with preserved ejection fraction: Current state and future directions. JACC Heart Fail. 2014, 2, 97–112. [Google Scholar] [CrossRef] [PubMed]
  26. Solomon, S.D.; McMurray, J.J.V.; Anand, I.S.; Ge, J.; Lam, C.S.P.; Maggioni, A.P.; Martinez, F.; Packer, M.; Pfeffer, M.A.; Pieske, B.; et al. Angiotensin-Neprilysin Inhibition in Heart Failure with Preserved Ejection Fraction. N. Engl. J. Med. 2019, 381, 65–72. [Google Scholar] [CrossRef]
  27. Baessler, B.; Schaarschmidt, F.; Stehning, C.; Schnackenburg, B.; Maintz, D.; Bunck, A.C. A systematic evaluation of three different cardiac T2-mapping sequences at 1.5 and 3T in healthy volunteers. Eur. J. Radiol. 2015, 84, 2161–2170. [Google Scholar] [CrossRef]
  28. Thavendiranathan, P.; Walls, M.; Giri, S.; Verhaert, D.; Rajagopalan, S.; Moore, S.; Simonetti, O.P.; Raman, S.V. Improved detection of myocardial involvement in acute inflammatory cardiomyopathies using T2 mapping. Circ. Cardiovasc. Imaging 2012, 5, 102–110. [Google Scholar] [CrossRef]
  29. Nishii, T.; Kono, A.K.; Shigeru, M.; Takamine, S.; Fujiwara, S.; Kyotani, K.; Aoyama, N.; Sugimura, K. Cardiovascular magnetic resonance T2 mapping can detect myocardial edema in idiopathic dilated cardiomyopathy. Int. J. Cardiovasc. Imaging 2014, 30, 65–72. [Google Scholar] [CrossRef]
  30. Verhaert, D.; Thavendiranathan, P.; Giri, S.; Mihai, G.; Rajagopalan, S.; Simonetti, O.P.; Raman, S.V. Direct T2 quantification of myocardial edema in acute ischemic injury. JACC Cardiovasc. Imaging 2011, 4, 269–278. [Google Scholar] [CrossRef]
  31. Dick, S.A.; Epelman, S. Chronic Heart Failure and Inflammation: What Do We Really Know? Circ. Res. 2016, 119, 159–176. [Google Scholar] [CrossRef]
  32. Mordi, I.R.; Singh, S.; Rudd, A.; Srinivasan, J.; Frenneaux, M.; Tzemos, N.; Dawson, D.K. Comprehensive Echocardiographic and Cardiac Magnetic Resonance Evaluation Differentiates Among Heart Failure With Preserved Ejection Fraction Patients, Hypertensive Patients, and Healthy Control Subjects. JACC Cardiovasc. Imaging 2018, 11, 577–585. [Google Scholar] [CrossRef] [PubMed]
  33. DeVore, A.D.; McNulty, S.; Alenezi, F.; Ersboll, M.; Vader, J.M.; Oh, J.K.; Lin, G.; Redfield, M.M.; Lewis, G.; Semigran, M.J.; et al. Impaired left ventricular global longitudinal strain in patients with heart failure with preserved ejection fraction: Insights from the RELAX trial. Eur. J. Heart Fail. 2017, 19, 893–900. [Google Scholar] [CrossRef] [PubMed]
  34. Obokata, M.; Nagata, Y.; Wu, V.C.; Kado, Y.; Kurabayashi, M.; Otsuji, Y.; Takeuchi, M. Direct comparison of cardiac magnetic resonance feature tracking and 2D/3D echocardiography speckle tracking for evaluation of global left ventricular strain. Eur. Heart J. Cardiovasc. Imaging 2016, 17, 525–532. [Google Scholar] [CrossRef] [PubMed]
  35. Hamatani, Y.; Nagai, T.; Shiraishi, Y.; Kohsaka, S.; Nakai, M.; Nishimura, K.; Kohno, T.; Nagatomo, Y.; Asaumi, Y.; Goda, A.; et al. Long-Term Prognostic Significance of Plasma B-Type Natriuretic Peptide Level in Patients With Acute Heart Failure With Reduced, Mid-Range, and Preserved Ejection Fractions. Am. J. Cardiol. 2018, 121, 731–738. [Google Scholar] [CrossRef]
  36. Guisado-Espartero, M.E.; Salamanca-Bautista, P.; Aramburu-Bodas, O.; Conde-Martel, A.; Arias-Jimenez, J.L.; Llacer-Iborra, P.; Davila-Ramos, M.F.; Cabanes-Hernandez, Y.; Manzano, L.; Montero-Perez-Barquero, M.; et al. Heart failure with mid-range ejection fraction in patients admitted to internal medicine departments: Findings from the RICA Registry. Int. J. Cardiol. 2018, 255, 124–128. [Google Scholar] [CrossRef]
  37. Lauritsen, J.; Gustafsson, F.; Abdulla, J. Characteristics and long-term prognosis of patients with heart failure and mid-range ejection fraction compared with reduced and preserved ejection fraction: A systematic review and meta-analysis. ESC Heart Fail. 2018, 4, 685–694. [Google Scholar] [CrossRef]
  38. Choi, K.H.; Lee, G.Y.; Choi, J.O.; Jeon, E.S.; Lee, H.Y.; Cho, H.J.; Lee, S.E.; Kim, M.S.; Kim, J.J.; Hwang, K.K.; et al. Outcomes of de novo and acute decompensated heart failure patients according to ejection fraction. Heart 2018, 104, 525–532. [Google Scholar] [CrossRef]
  39. Farmakis, D.; Simitsis, P.; Bistola, V.; Triposkiadis, F.; Ikonomidis, I.; Katsanos, S.; Bakosis, G.; Hatziagelaki, E.; Lekakis, J.; Mebazaa, A.; et al. Acute heart failure with mid-range left ventricular ejection fraction: Clinical profile, in-hospital management, and short-term outcome. Clin. Res. Cardiol. 2017, 106, 359–368. [Google Scholar] [CrossRef]
Figure 1. Exemplary medial short axis images of T2 relaxation time maps (first row, (AD)), T1 relaxation time maps (second row, EH) and extracellular volume (ECV) maps (third row, (IL)). First column (A,E,I): Healthy control (ECV image from a patient from clinical routine, as no contrast agent was given to healthy controls in our study). Second column (B,F,J): Patient number 3 (HFpEF). Third column (C,G,K): Patient number 9 (HFmrEF). Fourth column (D,H,L): Patient number 11 (HFrEF). Segments with scars excluded from analysis. ECV = Extracellular volume. HFmrEF = Heart failure with moderately reduced Ejection fraction, HFpEF = Heart failure with preserved ejection fraction, HFrEF = Heart failure with reduced ejection fraction.
Jcm 08 01877 g001
Figure 2. Boxplots of heart failure groups and controls versus (A) T2 relaxation time, (B) Native T1 relaxation time, (C) ECV (controls from Dabir et al. 2014) [14], (D) GLS, (E) GCS and (F) strain ratio (GLS/GCS). * Significant at α = 0.05. ** Significant at α = 0.01. n.s. = not significant at 0.05. GCS = global circumferential strain, GLS = global longitudinal strain. Other abbreviations as in Figure 1.
Jcm 08 01877 g002
Figure 3. Scatter Plots and linear model parameters of T2 relaxation time versus (A) NT-proBNP (logarithmic scale), (B) glomerular filtration rate (GFR) and (C) 6 min walking test. (D) Scatter plot and Spearman’s correlation coefficient of T2 relaxation time versus quality of life, as assessed by the Minnesota Living with Heart Failure Questionnaire.
Jcm 08 01877 g003
Table 1. Baseline characteristics.
Clinical DataControlHFpEFHFmrEFHFrEF
Female8/17 (47%)9/17 (53%)6/18 (33%)3/17 (18%)
AgeMean ± SD61.7 ± 8.578.1 ± 8.267.8 ± 9.064.4 ± 10.3
LVEFMean ± SD63.8 ± 5.461.7 ± 6.144.7 ± 2.933.1 ± 4.8
LA (cm2)Mean ± SD19.5 ± 6.523.4 ± 4.922.8 ± 8.325.2 ± 6.6
RVEDD (mm)Mean ± SD31.5 ± 4.730.6 ± 3.829.6 ± 3.731.4 ± 5.4
Any LGE 7/17 (41%)16/18 (89%)15/17 (88%)
Transmural LGE 4/17 (24%)7/18 (39%)8/17 (47%)
Coronary Artery Disease0/17 (0%)11/17 (65%)16/18 (89%)11/17 (65%)
6 min Walking Test (m)Mean ± SD524 ± 126345 ± 122414 ± 88414 ± 125
NYHA Class2 9/17 (53%)15/18 (83%)12/17 (71%)
3 8/17 (47%)3/18 (17%)5/16 (29%)
Quality of Life 1Mean ± SD5.0 ± 5.927.3 ± 22.828.3 ± 22.828.5 ± 24.9
Borg ScoreMean ± SD7.5 ± 1.712.4 ± 2.410.67 ± 2.310.9 ± 2.5
Laboratory Values
Hemoglobin (g/dL)Mean ± SD13.9 ± 1.112.8 ± 1.213.6 ± 1.115.0 ± 1.1
HematocritMean ± SD0.40 ± 0.030.38 ± 0.030.40 ± 0.030.43 ± 0.04
Creatinin (mg/dL)Mean ± SD0.87 ± 0.200.92 ± 0.181.07 ± 0.331.09 ± 0.38
GFR (mL/min)Mean ± SD81 ± 1071 ± 1670 ± 1872 ± 21
NT-proBNP (ng/L)Mean ± SD91 ± 62614 ± 607829 ± 11582257 ± 3447
Troponin T (ng/L)Mean ± SD7 ± 316 ± 1219 ± 2018 ± 12
CRP (mg/dL)Mean ± SD1.3 ± 1.42.9 ± 2.73.0 ± 4.21.0 ± 0.7
WBC (/nL)Mean ± SD6.1 ± 1.67.2 ± 2.48.5 ± 2.48.4 ± 2.3
Medication
ACE-Inhibitors2/17 (12%)4/17 (24%)7/18 (39%)9/17 (53%)
Angiotensin-Receptor-Blocker4/17 (24%)11/17 (65%)7/18 (39%)8/17 (47%)
Calcium-Antagonist4/17 (24%)3/17 (18%)3/18 (17%)1/17 (6%)
Mineralocorticoid-Receptor-Antagonist0/17 (0%)2/17 (12%)4/18 (22%)11/17 (65%)
Angiotensin-Receptor-Neprilysin-Inhibitor0/17 (0%)0/17 (0%)0/18 (0%)4/17 (24%)
Beta-Blocker6/17 (35%)10/17 (59%)14/18 (78%)17/17 (100%)
Statin2/17 (12%)8/17 (47%)15/18 (83%)11/17 (65%)
Thiazide Diuretic4/17 (24%)4/17 (24%)2/18 (11%)1/17 (6%)
Loop Diuretic0/17 (0%)3/17 (18%)7/18 (39%)6/17 (35%)
Discrete values given as absolute number and percentage of respective HF group. Continuous values given as mean and standard deviation. ACE = angiotensin-converting-enzyme. CRP = C reactive protein. GFR = glomerular filtration rate. LA = left atrium. LGE = late gadolinium enhancement. LVEF = left ventricular ejection fraction. NT-proBNP = N-terminal pro brain natriuritic peptide. NYHA = New York Heart Association. RVEDD = right ventricular end diastolic diameter (MRI, three chamber view). WBC = white blood cell count. 1 Minnesota Living with Heart Failure Questionnaire.
Table 2. Group means and p-values for group-wise comparisons.
Heart Failure Groupp-Value
ControlHFpEFHFmrEFHFrEFControls vs. HFpEFControls vs. HFmrEFHFpEF vs. HFmrEFHFpEF vs. HFrEFHFmrEF vs. HFrEF
T2 (ms)50.6 ± 2.152.6 ± 3.655.4 ± 3.456.0 ± 6.00.4990.005 **0.1900.0780.967
T1 native (ms)972 ± 31985 ± 321027 ± 401033 ± 540.7760.001 **0.023 *0.005 **0.954
ECV (%)27 ± 4 27.3 ± 2.629.2 ± 2.629.3 ± 3.40.9930.1860.3030.271>0.999
GLS (%)−23.0 ± 3.5−20.8 ± 3.9−15.7 ± 2.1−11.0 ± 3.60.252<0.001 **<0.001 **<0.001 **<0.001 **
GCS (%)−34.5 ± 6.2−35.8 ± 6.7−19.9 ± 4.1−12.4 ± 4.60.902<0.001 **<0.001 **<0.001 **0.001 **
SR0.68 ± 0.090.59 ± 0.110.82 ± 0.170.96 ± 0.330.6000.1590.007 **<0.001 **0.151
Data reported as means ± standard deviations. p-values calculated from one-way ANOVA with Tukey–Kramer post-hoc analysis. GCS = global circumferential strain, GLS = global longitudinal strain, ECV = extracellular volume, SR = strain ratio (GLS/GCS), T1 = T1 relaxation time and T2 = T2 relaxation time; other abbreviations as in Table 1. * Significant at α = 0.05. ** Significant at α = 0.01. Data from Dabir et al. 2014
Table 3. Correlations of parameters.
T2ECVT1 NativeGLSGCSSRLV-EF
ECVPearson r0.353 **
p Value0.010
T1 nativePearson r0.660 **0.472 **
p Value<0.001<0.001
GLSPearson r0.351 **0.294 *0.518 **
p Value0.0030.034<0.001
GCSPearson r0.372 **0.2560.484 **0.868 **
p Value0.0020.067<0.001<0.001
SRPearson r0.309 **0.0620.308 **0.353 **0.698 **
p Value0.0090.6630.0100.003<0.001
LV-EFPearson r−0.422 **−0.242−0.518 **−0.882 **−0.929 **−0.614 **
p Value<0.0010.090<0.001<0.001<0.001<0.001
AgePearson r0.234−0.1000.064−0.199−0.270 *−0.2020.246 *
p Value0.0520.4830.6030.0950.0230.0910.020
log(NT-proBNP)Pearson r0.642 **0.287 *0.601 **0.544 **0.544 **0.234 *−0.538 **
p Value<0.0010.039<0.001<0.001<0.0010.050<0.001
Glomerular filtration ratePearson r−0.441 **0.106−0.123−0.065−0.057−0.0540.085
p Value<0.0010.4550.3140.5890.6370.6550.487
C-reactive protein (mg/dL)Pearson r0.105−0.154−0.006−0.044−0.087−0.1120.062
p Value0.3930.2810.9610.7150.4730.3570.614
HematocritPearson r0.101−0.1800.1500.330 **0.405 **0.343 **−0.471 **
p Value0.4070.2010.2190.005<0.0010.003<0.001
6 min walking testPearson r−0.345 **0.273-0.150−0.1020.0140.1380.037
p Value0.0040.0550.2240.4030.9120.2580.765
Quality of lifeSpearman r0.484 **0.1870.359 **0.1840.1680.097−0.230
p Value<0.0010.1850.0020.1240.1620.4200.058
p-values are given for the significance of the correlation coefficient. NT-proBNP was transformed to logarithmic scale. Abbreviations as in Table 1 and Table 2. * Significant at α = 0.05. ** Significant at α = 0.01.

