Article

Isoniazid Concentration and NAT2 Genotype Predict Risk of Systemic Drug Reactions during 3HP for LTBI

1
Department of Internal Medicine, National Taiwan University Hospital, Hsinchu Branch, Hsinchu 30059, Taiwan
2
Division of Pulmonary and Critical Care Medicine, Department of Internal Medicine, Kaohsiung Medical University Hospital, Kaohsiung 80708, Taiwan
3
Graduate Institute of Medicine, College of Medicine, Kaohsiung Medical University, Kaohsiung 80708, Taiwan
4
Kaohsiung Municipal Ta-Tung Hospital, Kaohsiung 80145, Taiwan
5
School of Pharmacy, College of Medicine, National Taiwan University, Taipei 10050, Taiwan
6
School of Medicine, College of Medicine, Kaohsiung Medical University, Kaohsiung 80708, Taiwan
7
Departments of Respiratory Therapy, Kaohsiung Medical University, Kaohsiung 80708, Taiwan
8
Institute of Biochemistry and Molecular Biology, National Taiwan University Medical College, Taipei 10051, Taiwan
9
Department of Laboratory Medicine, Kaohsiung Medical University Hospital, Kaohsiung 80756, Taiwan
10
Department of Internal Medicine, National Taiwan University Hospital, Taipei 10002, Taiwan
*
Author to whom correspondence should be addressed.
Meng-Rui Lee and Hung-Ling Huang contributed equally to this manuscript.
J. Clin. Med. 2019, 8(6), 812; https://doi.org/10.3390/jcm8060812
Submission received: 17 May 2019 / Revised: 29 May 2019 / Accepted: 3 June 2019 / Published: 6 June 2019
(This article belongs to the Special Issue Tuberculosis: Clinical Applications in the Diagnosis and Treatment)

Abstract

:
Weekly rifapentine and isoniazid therapy (known as 3HP) for latent tuberculosis infection (LTBI) is increasingly used, but systemic drug reactions (SDR) remain a major concern. Methods: We prospectively recruited two LTBI cohorts who received the 3HP regimen. In the single-nucleotide polymorphism (SNP) cohort, we collected clinical information of SDRs and examined the NAT2, CYP2E1, and AADAC SNPs. In the pharmacokinetic (PK) cohort, we measured plasma drug and metabolite levels at 6 and 24 h after 3HP administration. The generalised estimating equation model was used to identify the factors associated with SDRs. Candidate SNPs predicting SDRs were validated in the PK cohort. A total of 177 participants were recruited into the SNP cohort and 129 into the PK cohort, with 14 (8%) and 13 (10%) in these two cohorts developing SDRs, respectively. In the SNP cohort, NAT2 rs1041983 (TT vs. CC+CT, odds ratio [OR] [95% CI]: 7.00 [2.03–24.1]) and CYP2E1 rs2070673 (AA vs. TT+TA, OR [95% CI]: 3.50 [1.02–12.0]) were associated with SDR development. In the PK cohort, isoniazid level 24 h after 3HP administration (OR [95% CI]: 1.61 [1.15–2.25]) was associated with SDRs. Additionally, the association between the NAT2 SNP and SDRs was validated in the PK cohort (rs1041983 TT vs. CC+CT, OR [95% CI]: 4.43 [1.30–15.1]). Conclusions: Isoniazid played a role in the development of 3HP-related SDRs. This could provide insight for further design of a more optimal regimen for latent TB infection.

1. Introduction

Tuberculosis (TB) remains one of the deadliest infectious diseases, with an estimated 10.0 million new cases and 1.6 million deaths in 2017 [1]. The World Health Organization (WHO) has set the goal of eliminating TB as a public health problem, aiming to achieve 90% and 95% reductions in the TB incidence and number of TB deaths by 2035 [2]. Latent tuberculosis infection (LTBI), a status of persistent immune response to stimulation by Mycobacterium tuberculosis antigens without clinically manifest active TB [3], has a 10% risk of progressing to active TB [4] and has thus emerged as a critical target for improving TB control and elimination [5]. The importance of targeting LTBI toward TB control has extended from countries with low TB prevalence to TB-endemic areas [6,7]. LTBI treatment, therefore, is being advocated as a universal policy in TB control [6,7].
The effectiveness of LTBI programmes has long been limited. Real-world data published in 1999 and obtained from an inner-city population in Atlanta, Georgia in the United States revealed that only 27% of subjects who received isoniazid (INH) preventive therapy completed their treatment [8]. A 2016 meta-analysis including 748,572 subjects in 58 studies also found poor completion of LTBI programmes, with a 60% treatment completion rate [9]. With the introduction of rifapentine (RPT), a rifamycin with much longer half-life than rifampin, the duration of a modern preventive regimen termed 3HP comprising RPT and INH could be shortened to 12 doses administered weekly, with the completion rate approaching 90% [10,11,12]. Also, for the four LTBI regimens currently suggested by WHO, 3HP remained the one with the fewest total doses required [13]. Though 3HP is less hepatotoxic, 3.8% of those receiving 3HP experience systemic drug reactions (SDRs) [14], which usually, if not always, requires treatment interruption or termination. The risk of a severe adverse event (AE) and SDR are even higher among subjects > 35 years old [12,14].
To date, little has been discovered regarding the risk factors or predictors of SDRs due to 3HP therapy. In a pharmacokinetics study of RPT treatment in 35 TB patients during once-weekly continuation phase therapy, serious AEs were not linked with a higher area under the plasma concentration–time curve (AUC0~∞) of RPT [15]. Furthermore, no studies have reported on plasma INH levels after once-weekly INH treatment or the association between plasma INH level and AE development. Therefore, we conducted this study to determine the predictors of SDRs during 3HP therapy by measuring the plasma levels of drugs and their major metabolites and by genotyping the three key drug-metabolising enzymes.

2. Methods

2.1. Study Design

This was a prospective, multicentre, observational study recruiting individuals in close contact with index patients who received a new diagnosis of acid-fast smear (AFS)-positive pulmonary TB between September 2016 and August 2018. The study was conducted in two medical centres—the National Taiwan University Hospital in northern Taiwan and Kaohsiung Medical University Hospital in southern Taiwan—and their four branch hospitals. The study was approved by the institutional ethics committees of both medical centres (NTUH REC 201609044RINB and KMUHIRB-G[II]-20170033).

2.2. Study Population

Individuals were eligible for enrollment if they were (1) aged ≥12 years; (2) in close contact with patients diagnosed with AFS-positive pulmonary TB; and (3) diagnosed with LTBI using either a tuberculin skin test (TST) or QuantiFERON-TB Gold in-tube assay (QFT; Cellestis/Qiagen, Carnegie, Australia). Close contact was defined as unprotected exposure of ≥8 h in a single day or a cumulative duration of ≥40 h. A positive TST was defined as an induration of ≥10 mm read at 48–72 h according to current guidelines in Taiwan. QFT was performed according to the manufacturer’s instructions. All close contacts enrolled in this study were tested with either TST or QFT. This study excluded participants who were suspected to have active TB because of their clinical symptoms or image examinations; to be concurrently using drugs with severe drug–drug interactions; to be allergic to INH, rifampin, or RPT (https://www.micromedexsolutions.com/); or who had a life expectancy <3 years.

2.3. Protocol

After written informed consent was obtained, participants were enrolled into the pharmacokinetics cohort (PK cohort) if they could comply with the blood sampling schedule required in the PK study. For this cohort, a plasma sample was collected to determine the concentrations of RPT, INH, and their metabolites (25-desacetyl-rifapentine [DeAcRPT] and acetyl-isoniazid [AcINH]) at either 23–25 h (C24, preferred) or 5–7 h (C6, Tmax of RPT) or both after administration of the study drugs at weeks 4 and 8 (refer to Supplement File for laboratory methods, including Table S1 and Figure S1) [15,16], or while SDR developed. For participants not enrolled in the PK cohort, genotyping for single-nucleotide polymorphisms (SNPs) of drug-metabolising enzymes, including N-acetyltransferase 2 (NAT2), cytochrome P450 2E1 (CYP2E1), and arylacetamide deacetylase (AADAC), was performed at baseline (SNP cohort) (refer to Supplement File for laboratory method, including Table S2).
Under supervision, each participant received weekly RPT (900 mg for participants with body weight >50.0 kg; 750 mg for 32.1–50.0 kg; 600 mg for 25.1–32.0 kg; and 450 mg for 14.1–25.0 kg) plus INH (15 mg/kg, rounded up to nearest 150 mg; maximum 900 mg) for a total of 12 doses, constituting the 3HP regimen. The drugs were administered by government-paid supporters under the National TB Program of Taiwan. The research assistants contacted all participants every week in person or by telephone to inquire about any AEs after the treatment. The participants were followed up until treatment completion or termination.

2.4. Outcome

The primary endpoint was development of SDRs during 3HP treatment, defined as AEs that met either of the following: (1) hypotension (systolic blood pressure < 90 mmHg), urticaria, angioedema, acute bronchospasm, or conjunctivitis; and (2) >4 of the following symptoms occurring concurrently (>1 of which had to be grade 2 or higher): weakness, fatigue, nausea, vomiting, headache, fever, aches, sweats, dizziness, shortness of breath, flushing, or chills [14]. The probability of AEs to the study drugs was determined using the Naranjo algorithm [17]. A Naranjo score of 5–8 indicates probable AEs, whereas a score of >9 indicates definite AEs. AEs were graded using the Division of AIDS Table for Grading the Severity of Adult and Pediatric Adverse Events [18].

2.5. Statistical Analysis

Collected data included age, sex, height, weight, smoking status, comorbidities, concurrent medication, laboratory test and imaging results, study drugs, AEs, and medical records. The dataset was independently sampled. For continuous variables with normal distribution and homogeneity of variance, we used independent-sample t test or one-way ANOVA for comparison of intergroup differences. Otherwise we used non-parametric methods including Mann–Whitney U test or Kruskal–Wallis test for comparison. For categorical variables, we used chi-square for intergroup comparison and in case that more than 20% of the expected cell counts for the table are less than five, we used Fisher’s exact test. Plasma drug concentration after 1 and 2 months of 3HP treatment was compared using the Wilcoxon rank-sum test. To accommodate correlation of values within subjects, generalised estimating equation (GEE) models were fitted to explore the risk factors of SDRs (binary outcome) during 3HP treatment, adjusting for age, sex, body mass index (BMI), smoking status, INH and RPT dosage (which was exactly the same), taking 3HP before or after meal, comorbidity and concomitant medications. We also performed time-dependent Cox proportional hazard model to explore SDRs risk factors with adjustment of abovementioned variables in the GEE model. For handling the issue of low extrapolated drug concentration level below limit of quantification (BLQ) (in Supplementary File), we performed two sensitivity analyses, including: 1. Assuming drug concentrations BLQ to be zero and; 2. Excluding drug concentrations BLQ. Statistical significance was set at two-sided p  < 0.05. All statistical analyses were performed using SAS version 9.4 (SAS Institute Inc., Cary, NC, USA).

3. Results

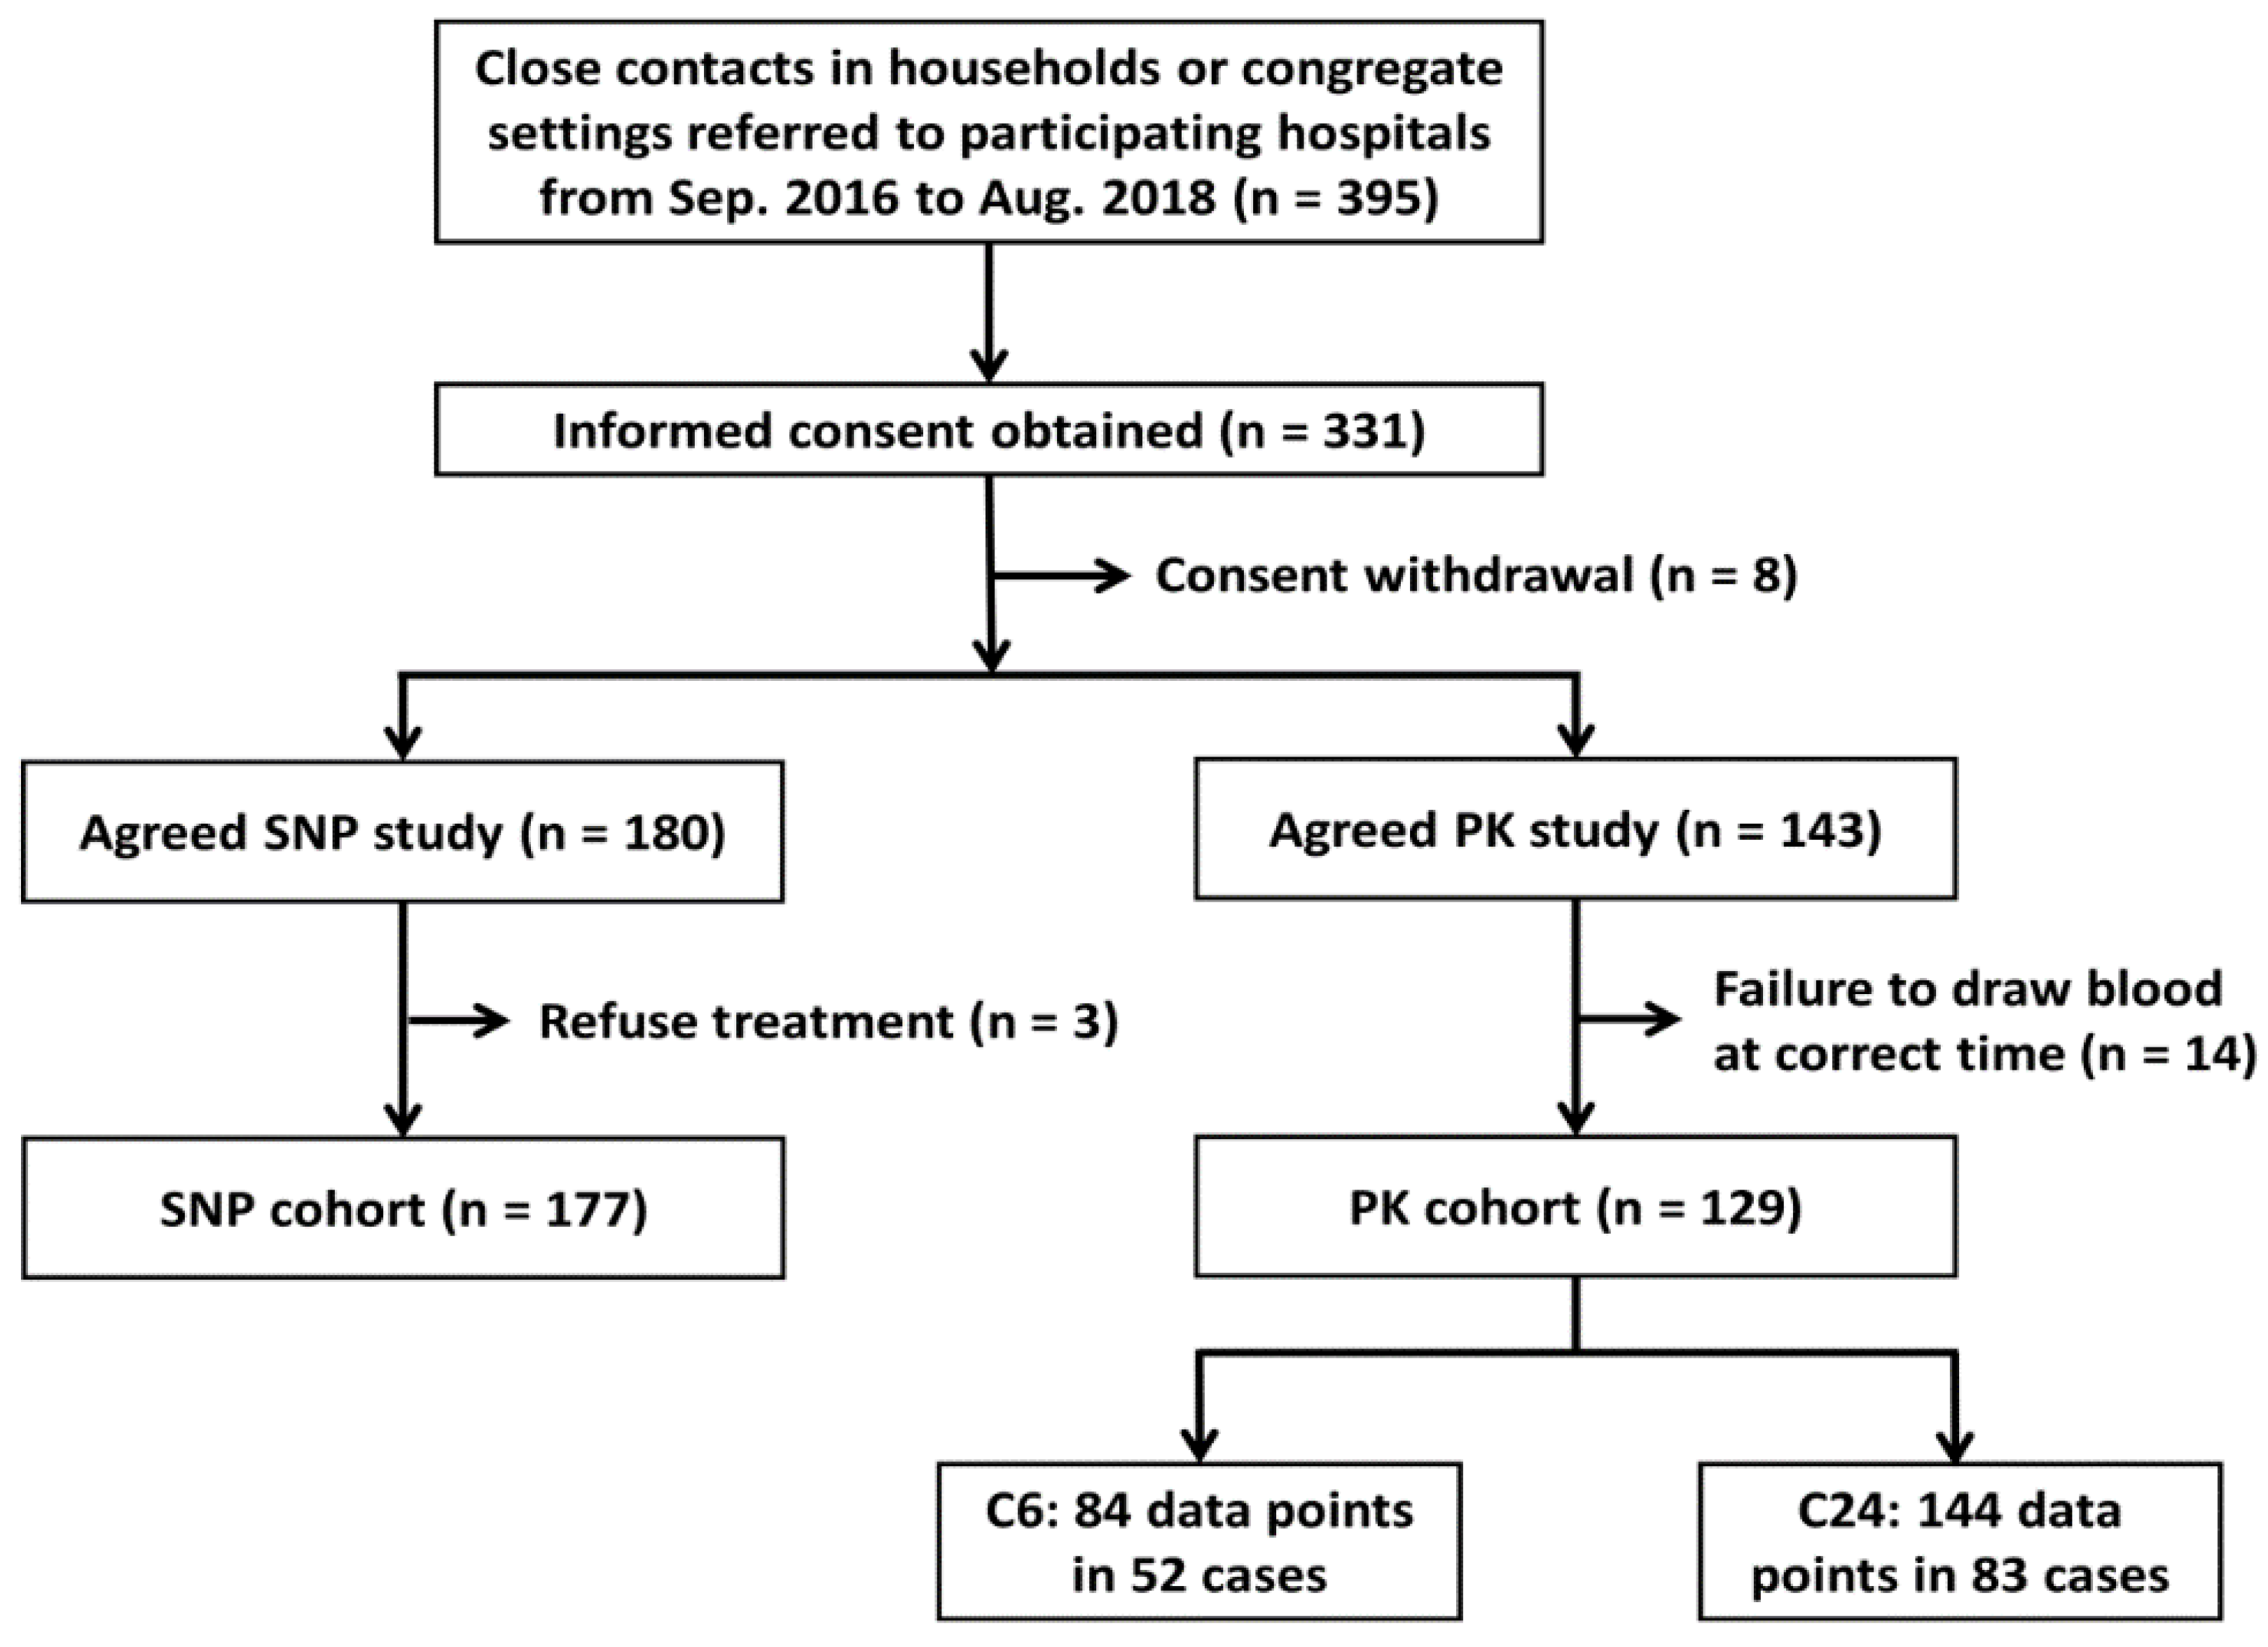
3.1. Selection of Study Participants

During the study period, 177 participants were recruited to the SNP cohort and 129 to the PK cohort (Figure 1). The clinical characteristics of the two cohorts are summarised in Table 1.

3.2. Clinical Characteristics of the SNP Cohort

Among the 177 participants in the SNP cohort, 14 (8%) developed an SDR; seven were flu-like syndrome, three were shock, three were urticaria, and the remaining SDR was conjunctivitis. The majority of the participants were young (mean age 37.1 ± 17.8 years) and had good nutritional status (mean BMI 23.2 ± 3.52). Few (n = 11, 6%) had an underlying comorbidity, and the laboratory data were generally within normal limits. Compared with the participants who developed an SDR, those who did not were younger (p = 0.038) and had superior renal function (p = 0.009).

3.3. Association of SNPs with SDRs in the SNP Cohort

In the SNP cohort, two SNPs were significantly associated with SDR development (Table 2). In a recessive model, NAT2 rs1041983 was associated with SDR development in both univariate analysis (TT vs. CC+CT, odds ratio [OR] [95% CI]: 8.47 [2.55–28.1], p = 0.0005) and multivariate analysis (TT vs. CC+CT, OR [95% CI]: 7.00 [2.03–24.1], p = 0.002). Additionally, CYP2E1 rs2070673 was associated with SDR development in both univariate analysis (AA vs. TT+TA, OR [95% CI]: 3.51 [1.05–11.7], p = 0.041) and multivariate analysis (AA vs. TT+TA, OR [95% CI]: 3.50 [1.02–12.0], p = 0.047). The results of SNPs with nonsignificant associations with SDRs are summarised in Table S3 of the Supplementary File.

3.4. Clinical Characteristics of the PK Cohort

Among the 129 participants in the PK cohort, 13 (10.1%) developed an SDR (shock: two; flu-like syndrome: eight; both: three) (Table 1). The treatment completion rate was 83% (107/129). A total of 52 participants with 84 C6 blood samples were available, of which four samples were collected while they were experiencing an SDR. In C24 blood sampling, 144 samples from 83 participants were available; 11 samples were collected during an SDR. Among the 13 cases experiencing SDRs, ten (77%) occurred in the 3rd dose, 11 (85%) had the onset of SDRs less than 6 h after 3HP administration, and ten (77%) completely recovered within 2 days after onset (Table 3).
Among the C6 blood samples, 50 samples were collected in the first month, whereas 34 were collected in the second month. Three SDRs developed among the participants who supplied 50 first-month C6 blood samples, whereas one SDR developed among the participants who supplied the 34 s-month blood samples (6% vs. 3%, p = 0.644). Among the C24 blood samples, 80 samples were collected in the first month, whereas 64 were collected in the second month. Seven SDRs developed among the participants who supplied the 80 first-month C24 blood samples, whereas four SDRs developed among the participants who supplied the 64 s-month blood samples (9% vs. 6%, p = 0.755). The correlations between plasma concentrations of drugs and metabolites are illustrated in Figure 2.

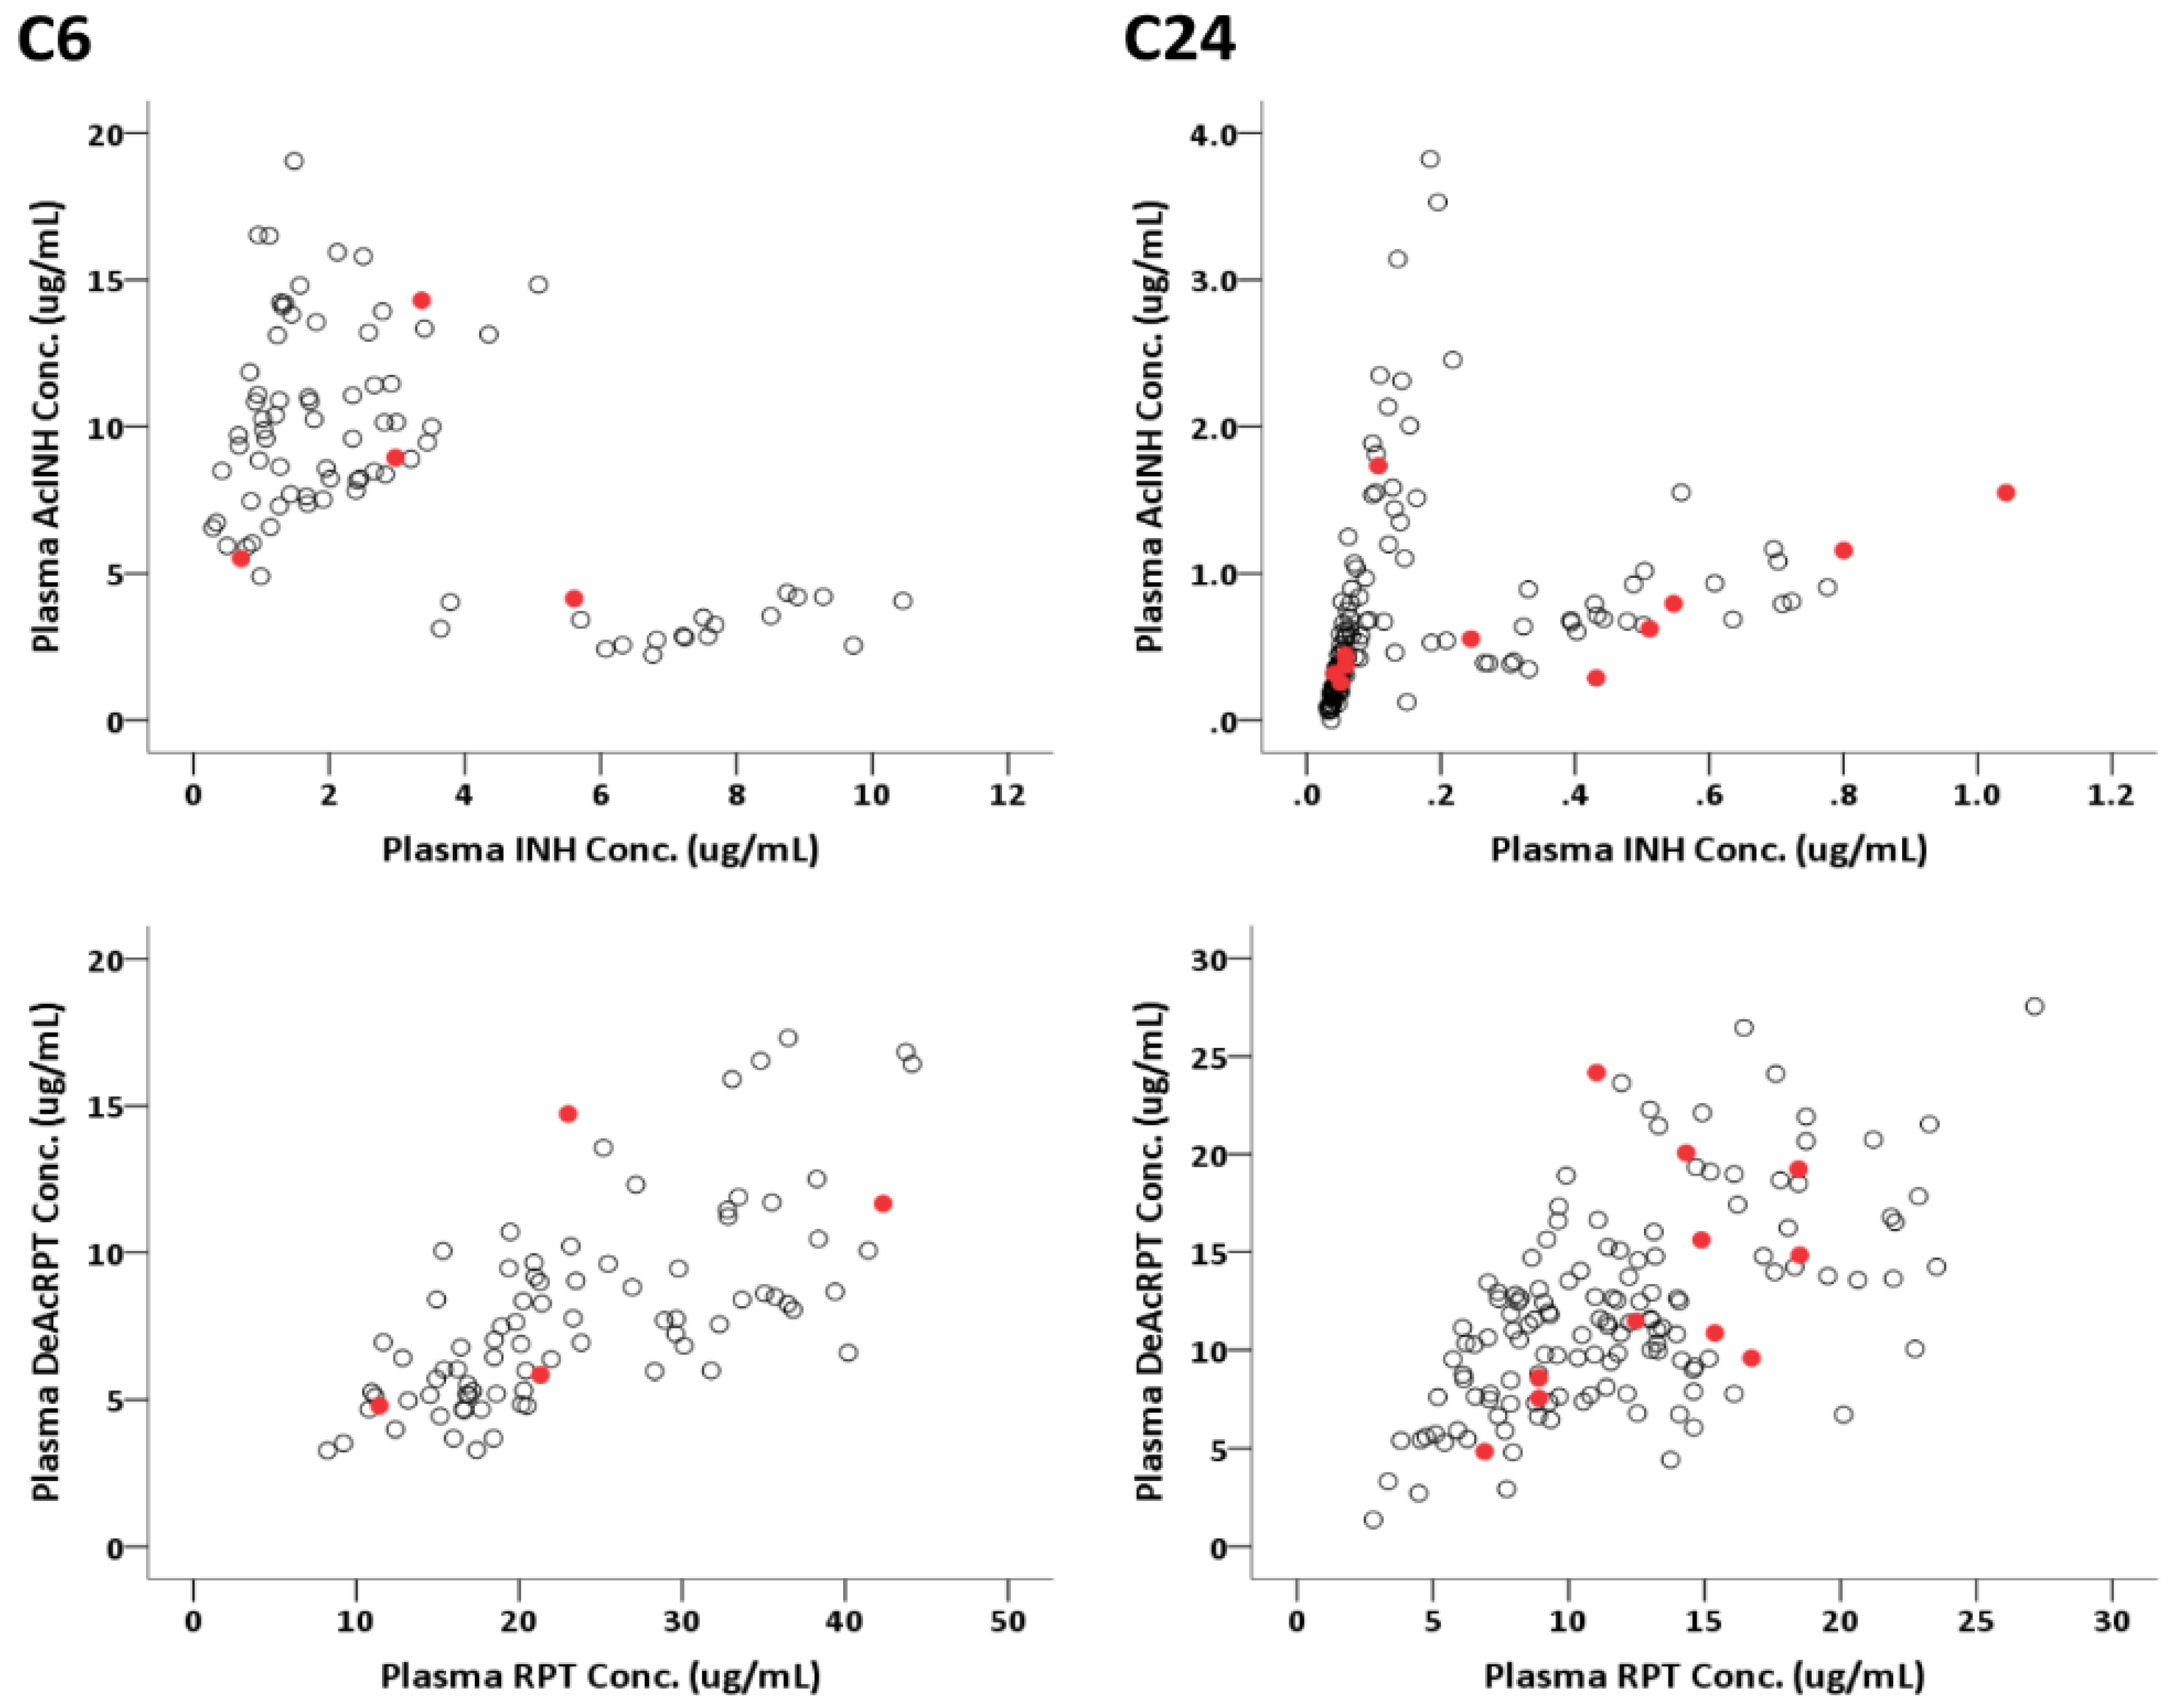
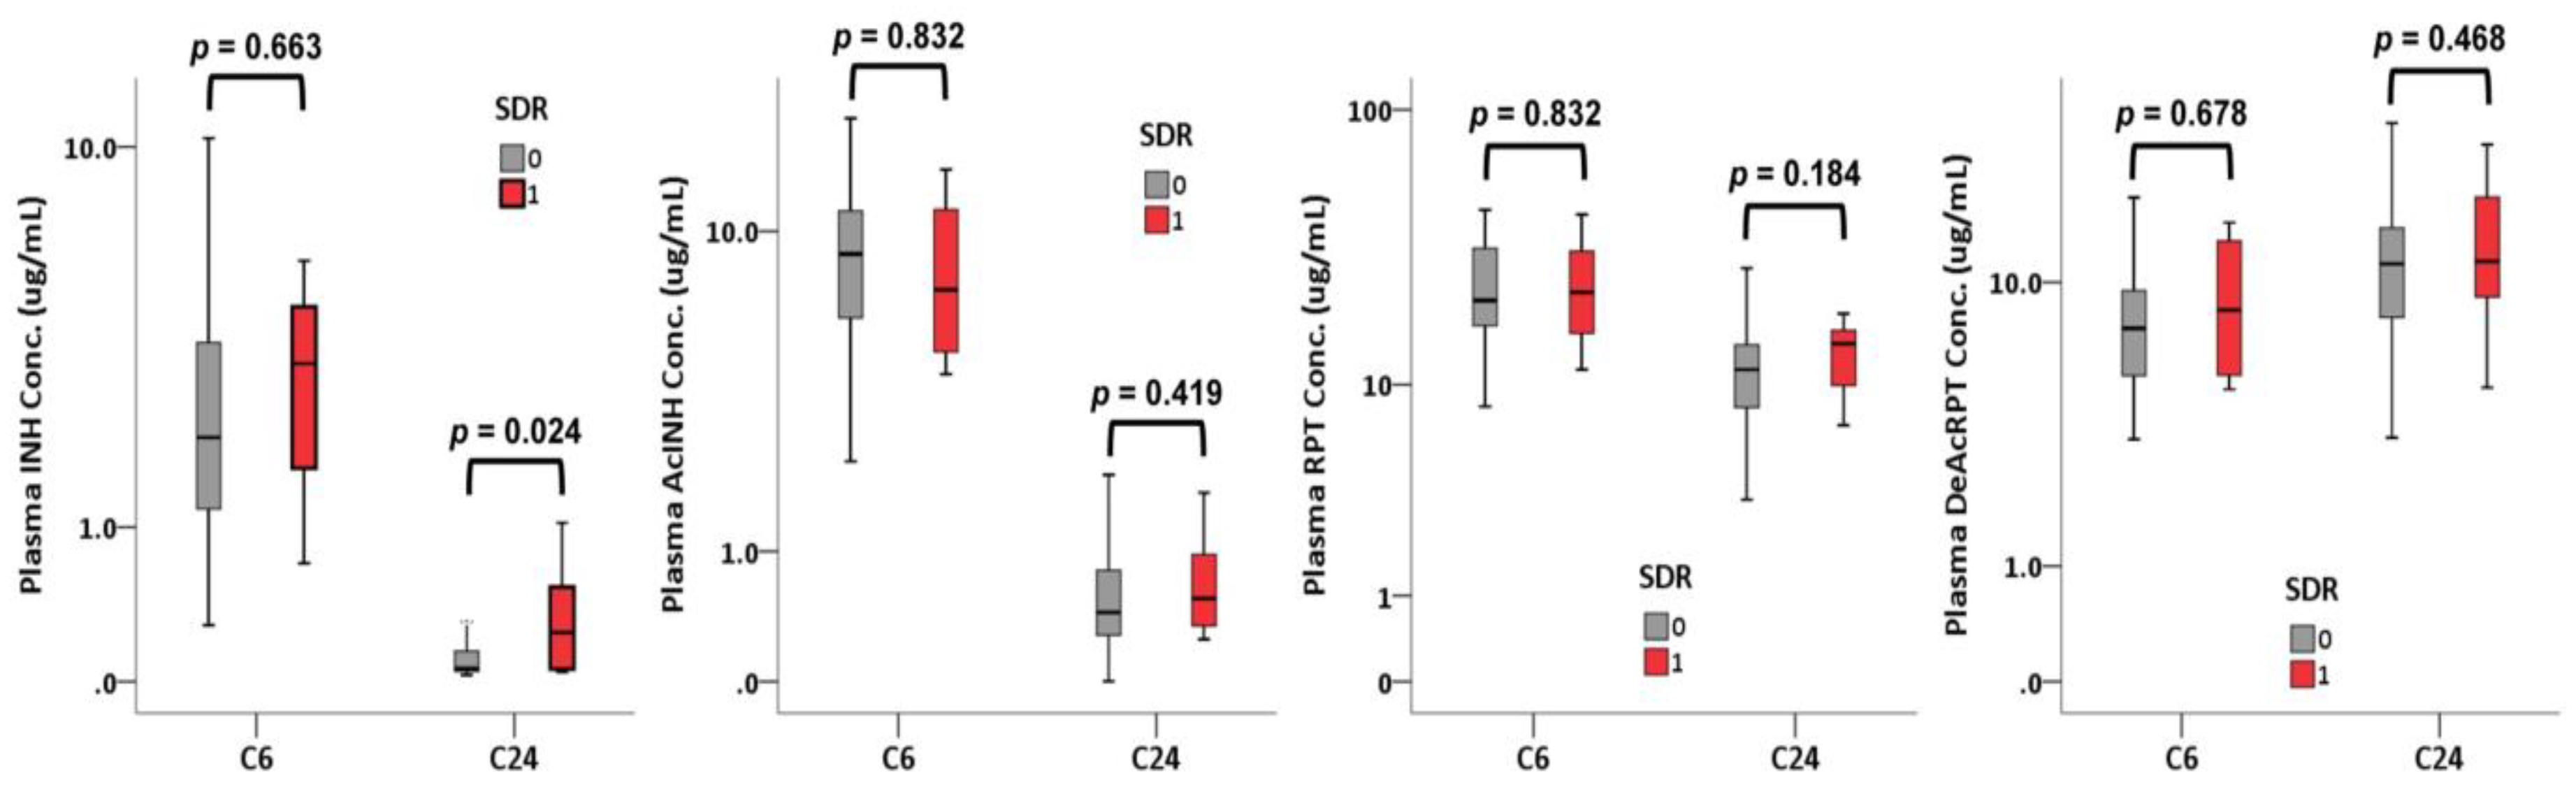
3.5. Pharmacodynamical Results of the PK Cohort

Regarding C6 drug concentrations, no differences were discovered between the participants with and without an SDR in INH, AcINH, RPT, or DeAcRPT (INH: 3.2 [2.4–3.9] vs. 2.0 [1.2–3.5] µg/mL, p = 0.663; RPT: 22.2 [18.8–27.8] vs. 20.7 [16.7–31.9] µg/mL, p = 0.832; Figure 3). Regarding C24 drug concentrations, INH level was significantly higher in the participants with an SDR compared with those without (0.25 [0.06–0.53] vs. 0.06 [0.05–0.15] µg/mL, p = 0.024). RPT level was not significantly different between the SDR and SDR-free participants (p = 0.184) in the C24 samples.
In C24 blood sampling, plasma INH level was higher among age >50 compared with age 30–50 and age <30. C24 RPT level, C6 INH level, and C6 RPT level, however, were not different between different age groups (Table S4 in Supplement File).
The C6 drug concentrations of AcINH and C24 drug concentrations of INH, AcINH, RPT, and DeAcRPT were significantly different between participants with differing renal function, being the highest in those with eGFR < 60 (Table S5 in Supplement File).
The plasma levels of INH, RPT and their metabolites were not significantly altered by taking 3HP before or after meal, except that the C6 RPT level was significantly higher in participants taking 3HP after meal (p = 0.038) (Figure S2 in Supplement File).
Comparing PK results for the first-month and second-month C6 blood samples (n = 32), the concentrations of INH, AcINH, RPT, and DeAcRPT were not significantly different (Table S6 in Supplement File).

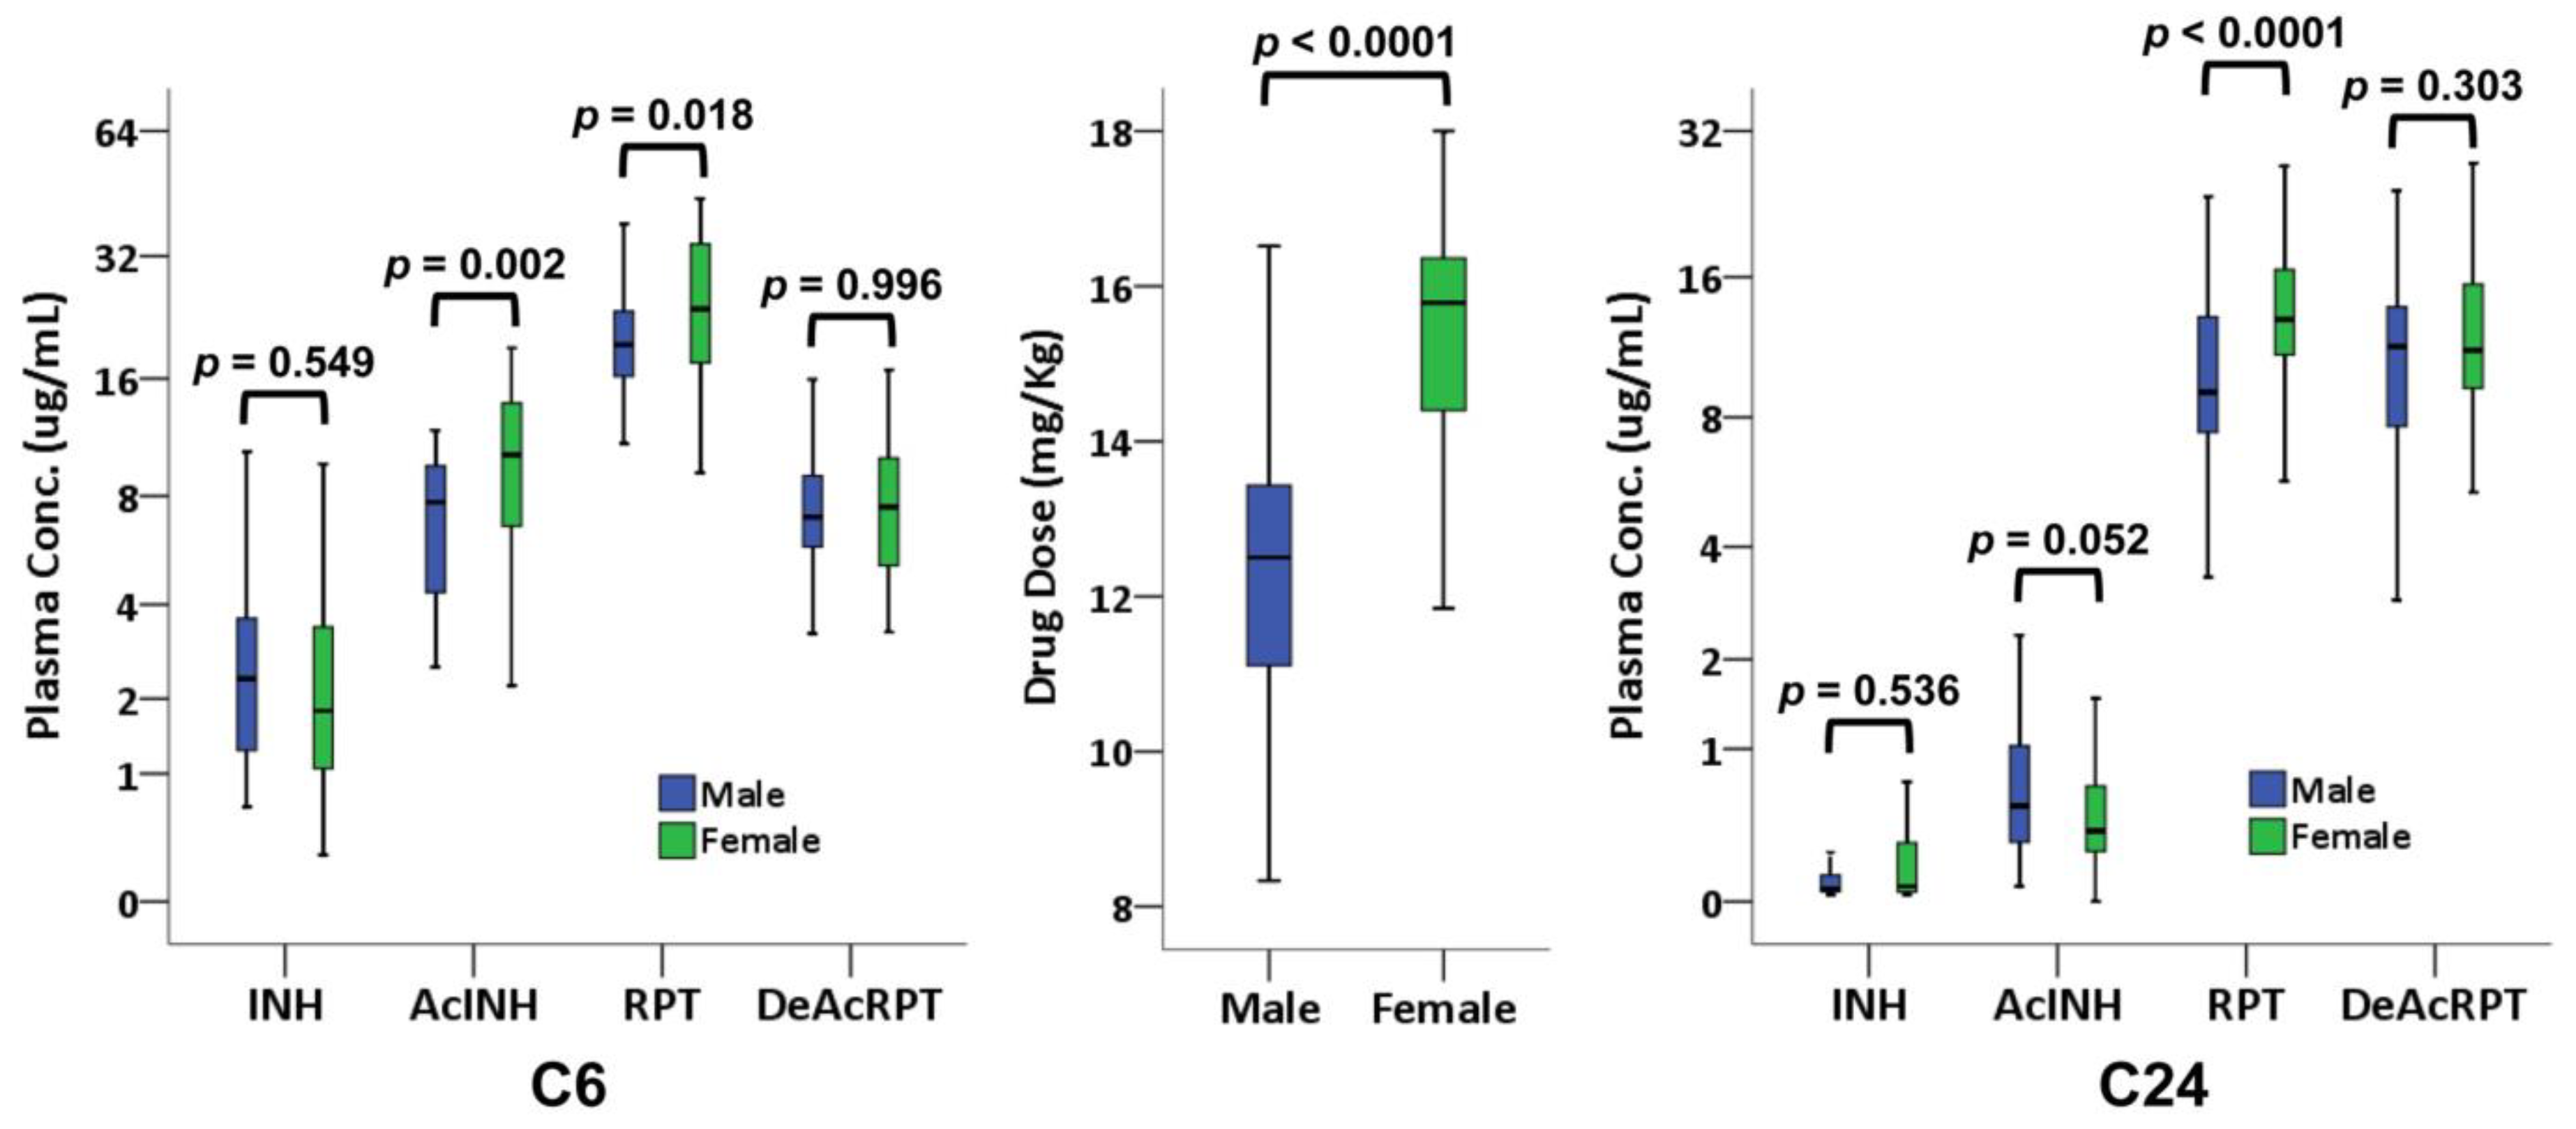
3.6. Sex-Based Discrepancy in PK Results

The drug dosage of INH and RPT was higher in the women than in the men (p < 0.0001; Figure 4).
In the C24 blood samples from 83 participants (44 male and 39 female), RPT level was higher in the women than in the men (p < 0.0001), whereas INH level was not (p = 0.536) (Figure 4). In C6 blood samples from 52 participants (21 male and 31 female), RPT level was again higher in the women than in the men (p = 0.018), whereas INH level was not (p = 0.549).

3.7. GEE Model in the PK Cohort

In the GEE model constructed for analysis of the C24 data, plasma INH level was associated with a higher risk of SDR development (OR [95% CI]: 1.61 [1.15–2.25], p = 0.006). By contrast, plasma RPT level was not associated with a higher risk of SDR development (OR [95% CI]: 1.01 [1.00–1.02], p = 0.218). In analysis assuming drug concentrations BLQ to be zero (OR [95% CI]: 1.52 [1.13–2.05], p = 0.006) and excluding drug concentration BLQ (OR [95% CI]: 1.94 [1.32–2.87], p = 0.001), the association of INH and SDRs remains.
In analysis of the C6 data, no factors were significantly associated with SDR development in the GEE model (INH, OR [95% CI]: 1.00 [0.98–1.02], p = 0.990; RPT, OR [95% CI]: 1.00 [0.99–1.01], p = 0.996).

3.8. Time-Dependent Cox Proportional Hazard Model in the PK Cohort

In the time-dependent Cox regression model for C24 data analysis in the PK cohort, plasma INH level remained associated with a higher risk of SDR development (HR [95% CI]: 39.2 [1.19–1291.4], p = 0.040). Plasma RPT level was not associated with a higher risk of SDR development (OR [95% CI]: 1.08 [0.86–1.36], p = 0.513).
In analysis of the C6 data, no factors were significantly associated with SDR development in the time-dependent Cox regression model.

3.9. Validation for Predicting SDR Using SNPs

The NAT2/CYP2E1 SNPs were validated in the PK cohort (Table 4). In a recessive model, NAT2 rs1041983 was associated with SDR development in both univariate analysis (TT vs. CC+CT, OR [95% CI]: 4.23 [1.30–13.8], p = 0.017) and multivariate analysis (TT vs. CC+CT, OR [95% CI]: 4.43 [1.30–15.1], p = 0.017). CYP2E1 rs2070673 was not associated with SDR development in either univariate analysis (AA vs. TT+TA, OR [95% CI]: 1.84 [0.46–7.41], p = 0.392) or multivariate analysis (AA vs. TT+TA, OR [95% CI]: 1.90 [0.46–7.80], p = 0.375).

4. Discussion

This is the first prospective study investigating the effects of plasma INH and RPT levels and the SNPs of their metabolising enzymes on the risk of SDRs during 3HP therapy. We discovered that NAT2 and probably CYP2E1, but not AADAC, gene SNPs were associated with the development of SDRs among individuals receiving the 3HP regimen. Interestingly, the plasma INH level, but not RPT level, was associated with SDR development in the PK study.
The 3HP regimen is among the four regimens for LTBI that is recommended by the WHO and is also probably the most promising regimen because of its convenience, with only 12 doses required [19]. With its effectiveness well established, the major remaining concern regarding this latest LTBI regimen may be its AEs. Studies have estimated that 4.9% to 9.1% of those in close contact with patients with TB and who received 3HP failed to complete the regimen because of the side effects [10,12]. SDRs while on the 3HP regimen have generally been linked with RPT, which has a well-known side effect: flu-like syndrome (Table S7 in Supplement File) [14,20,21,22]. Additionally, RPT is a newer agent, making it a possible contributor to SDRs given that a higher SDR rate was observed compared with other INH-containing regimens. Some scholars, however, have argued against this point. First, one study using the 3HP regimen demonstrated that rechallenge with RPT did not necessarily lead to SDRs [14]. In the same study, rifapentine was better tolerated than isoniazid upon rechallenge [14]. In another study involving 1200 mg of RPT once weekly as continuation therapy for active TB, no SDRs were linked with RPT [23]. Finally, in a study of 162 pulmonary TB patients receiving RPT with a dosage of more than 15 mg/kg daily, no patients developed SDRs [24]. In our systematic review, we discovered that among reports describing an association between RPT and flu-like symptoms, RPT was commonly coadministered with INH (Table S7 in Supplement File). Furthermore, in cases describing an association between INH and flu-like symptoms, the associations were all proven with rechallenge (Table S8 in Supplement File) [25,26].
Although a less well-known effect than that of RPT, INH can also lead to flu-like syndrome (Table S8 in Supplement File) [25,26]. Of the patients with active TB who were receiving INH, usually with a dose of 300 mg/day, 1–9.8% developed flu-like syndrome. In the 3HP regimen, INH dosage is 900 mg/week, and no data exist regarding the proportion of cases developing SDRs under a single INH dosage higher than this.
The association between the high INH dose and SDR during 3HP therapy may be explained through some hypotheses. First, since INH could bind to key enzymes in cytokine pathways, such as peroxidase [27], a high plasma level of INH may activate pathways which are not activated under normal dose of INH due to low binding affinity. Second, the high plasma INH level may interfere with or interact with rifapentine metabolite, leading to SDR. Interestingly, a study investigating drug–drug interactions between dolutegravir and once weekly INH/RPT also revealed a higher INH area under concentration curve among those who develop toxicities and a higher INH level among two cases experiencing severe flu-like syndrome [28].
NAT2 protein metabolises INH into AcINH, which is later hydrolysed into acetylhydrazine. Acetylhydrazine is then oxidised by CYP2E1 to form a hepatotoxic substance, causing damage to hepatocytes [29]. Additionally, AADAC is the enzyme responsible for the deacetylation of rifamycins, and it affects the metabolism of rifamycins [30]. In our study, several points support the association between INH and SDR development. First, the NAT2 SNP, which is known to affect INH metabolism, rather than the AADAC SNPs, which are involved in RPT metabolism, was associated with SDR development. Second, INH drug level, rather than RPT drug level, was discovered to be associated with SDR development. Third, the short duration and rapid resolution of symptoms in some cases may indicate that a rapidly metabolised drug was the causative agent.
In our study, there was a sex-based discrepancy in the RPT plasma level but not in INH level. Sex differences in pharmacokinetics and pharmacodynamics for many drugs have been documented before and were commonly attributed to the endogenous hormone influence on cytochrome P450 activity [31]. Our study observed a higher RPT level in female and this phenomenon was not observed for INH. This may be explained that INH level was more significantly modulated and determined by acetylation rate [29]. In previous study, the proportion of fast, slow and intermediate acetylators was not different between male and female [32].
For practical clinical application of our study findings, one may consider testing NAT2 genotype before LTBI treatment. If our described SNPs are identified, LTBI cases may be suggested to receive preventive regimens other than 3HP, such as four-month rifampin, to avoid SDR [33]. Also, for developing better drug combination therapy for LTBI, tailoring isoniazid dosage by avoiding single large isoniazid dose may be a reasonable approach. In the recently published Brief TB trial comparing one-month isoniazid and rifapentine with nine-month INH for preventive therapy, the isoniazid dosage was reduced to 300 mg daily and SDRs seemed to be less observed [34].
Our study also had limitations. First, the sample size was relatively small. Therefore, we may not have been able to identify all the SNPs associated with SDRs. Second, this study was conducted in the Taiwanese population. In our previous study, the proportion of NAT2 slow-acetylators was 22.8% (n = 82) among 360 TB patients [35]. Whether our findings can be extrapolated to other ethnicities remains unknown.

5. Conclusions

Results of this study suggest that INH plays a more critical role than is generally perceived in 3HP-related SDRs. By designing a more optimal LTBI regimen, this study highlights the importance of INH in causing SDRs. Also, NAT2 SNP could also be used for risk stratification among TB contacts receiving 3HP regimen.

Supplementary Materials

The following are available online at https://www.mdpi.com/2077-0383/8/6/812/s1, Figure S1: The multiple reaction monitoring chromatogram of isoniazid, rifapentine and their metabolites standard spiked plasma, Figure S2: Boxplot showing the plasma concentration of isoniazid (INH), acetyl-isoniazid (AcINH), rifapentine (RPT), and desacetyl-rifapentine (DeAcRPT) at 6 (C6) and 24 (C24) hours after dosing, stratified by the timing of taking medication, either before (AC) or after meal (PC) (p value calculated using the Mann–Whitney U test), Table S1: Retention time (Rt) and mass parameters of four target compounds and their isotopes internal standards, Table S2: Primer sequences, Table S3: Association of NAT2/CYP2E1/AADAC single nucleotide polymorphism (those with p value > 0.05) and systemic drug reaction, Table S4: Plasma concentration of isoniazid (INH) and rifapentine (RPT) stratified by age **, Table S5: Plasma concentration of isoniazid (INH), acetyl-isoniazid (AcINH), rifapentine (RPT), and desacetyl-rifapentine (DeAcRPT) stratified by estimated glomerular filtration rate (eGFR) *, Table S6: Comparison of plasma concentration of isoniazid (INH), acetyl-isoniazid (AcINH), rifapentine (RPT), and desacetyl-rifapentine (DeAcRPT) for first and second months, Table S7: Literature review of original reports (S7A) and case reports (S7B) for flu-like syndrome suspected due to a rifamycin, Table S8: Literature review of original reports (S8A) and case reports (S8B) for flu-like syndrome due to isoniazid (INH) proven by re-challenge.

Author Contributions

Conceptualization, M.-R.L., H.-L.H., J.-Y.W. and I.-W.C.; Data curation, M.-R.L., H.-L.H., Y-T.L., B.-S.Y., and C.-H.K.; Formal analysis, M.-R.L., M.-H.C., B.-S.Y., P.-L.L., and J.-Y.W.; Funding acquisition, H.-L.H., J.-Y.W., and I.-W.C.; Investigation, M.-R.L., H.-L.H., S.-W.L., Y.-T.L., C.-H.K., and P.-L.L.; Methodology, S.-W.L., Y.-T.L., S.-Y.C., B.-S.Y., C.-H.K., P.-L.L., and J.-Y.W.; Project administration, H.-L.H., Y.-T.L., S.-Y.C., B.-S.Y., and J.-Y.W.; Resources, S.-W.L., and S.-Y.C.; Supervision, S.-W.L., J.-Y.W., and I.-W.C.; Validation, H.-L.H., and M.-H.C.; Visualization, M.-H.C., S.-Y.C., and I.-W.C.; Writing—original draft, M.-R.L., H.-L.H., S.-Y.C., P.-L.L., and J.-Y.W.; Writing—review & editing, S.-W.L., M.-H.C., Y.-T.L., B.-S.Y., C.-H.K., J.-Y.W., and I.-W.C.

Funding

The study was supported by grants from the Ministry of Health and Welfare (MOHW106-CDC-C-11400104 and MOHW107-CDC-C-114-000105) and the Ministry of Science and Technology (MOST106-2314-B-002-055, MOST107-2314-B-002-191 and MOST107-2314-B-037-106-MY3). The funders had no role in the study design, data collection and analysis, decision to publish, or preparation of the manuscript.

Acknowledgments

The authors thank the staff of the Centers of Genomic Medicine and Precision Medicine at National Taiwan University for measuring serum drug concentrations and genotyping drug-metabolising enzymes.

Conflicts of Interest

The authors have no conflicts of interest to declare.

References

  1. World Health Organization. Global Tuberculosis Report 2018; World Health Organization: Geneva, Switzerland, 2018. [Google Scholar]
  2. World Health Organization. Global Strategy and Targets for Tuberculosis Prevention, Care and Control after 2015; World Health Organization: Geneva, Switzerland, 2014. [Google Scholar]
  3. Kasambira, T.S.; Shah, M.; Adrian, P.V.; Holshouser, M.; Madhi, S.A.; Chaisson, R.E.; Martinson, N.A.; Dorman, S.E. QuantiFERON-TB Gold In-Tube for the detection of Mycobacterium tuberculosis infection in children with household tuberculosis contact. Int. J. Tuberc. Lung Dis. 2011, 15, 628–634. [Google Scholar] [CrossRef] [PubMed]
  4. Comstock, G.W.; Livesay, V.T.; Woolpert, S.F. The prognosis of a positive tuberculin reaction in childhood and adolescence. Am. J. Epidemiol. 1974, 99, 131–138. [Google Scholar] [CrossRef] [PubMed]
  5. Getahun, H.; Matteelli, A.; Chaisson, R.E.; Raviglione, M. Latent Mycobacterium tuberculosis infection. N. Engl. J. Med. 2015, 372, 2127–2135. [Google Scholar] [CrossRef] [PubMed]
  6. LoBue, P.A.; Mermin, J.H. Latent tuberculosis infection: The final frontier of tuberculosis elimination in the USA. Lancet Infect. Dis. 2017, 17, e327–e333. [Google Scholar] [CrossRef]
  7. Churchyard, G.J.; Swindells, S. Controlling latent TB tuberculosis infection in high-burden countries: A neglected strategy to end TB. PLoS Med. 2019, 16, e1002787. [Google Scholar] [CrossRef] [PubMed]
  8. Bock, N.N.; Metzger, B.S.; Tapia, J.R.; Blumberg, H.M. A tuberculin screening and isoniazid preventive therapy program in an inner-city population. Am. J. Respir. Crit. Care Med. 1999, 159, 295–300. [Google Scholar] [CrossRef]
  9. Alsdurf, H.; Hill, P.C.; Matteelli, A.; Getahun, H.; Menzies, D. The cascade of care in diagnosis and treatment of latent tuberculosis infection: A systematic review and meta-analysis. Lancet Infect. Dis. 2016, 16, 1269–1278. [Google Scholar] [CrossRef]
  10. Sterling, T.R.; Villarino, M.E.; Borisov, A.S.; Shang, N.; Gordin, F.; Bliven-Sizemore, E.; Hackman, J.; Hamilton, C.D.; Menzies, D.; Kerrigan, A.; et al. Three months of rifapentine and isoniazid for latent tuberculosis infection. N. Engl. J. Med. 2011, 365, 2155–2166. [Google Scholar] [CrossRef]
  11. Villarino, M.E.; Scott, N.A.; Weis, S.E.; Weiner, M.; Conde, M.B.; Jones, B.; Nachman, S.; Oliveira, R.; Moro, R.N.; Shang, N.; et al. Treatment for preventing tuberculosis in children and adolescents: A randomized clinical trial of a 3-month, 12-dose regimen of a combination of rifapentine and isoniazid. JAMA Pediatr. 2015, 169, 247–255. [Google Scholar] [CrossRef]
  12. Sun, H.Y.; Huang, Y.W.; Huang, W.C.; Chang, L.Y.; Chan, P.C.; Chuang, Y.C.; Ruan, S.Y.; Wang, J.Y.; Wang, J.T. Twelve-dose weekly rifapentine plus isoniazid for latent tuberculosis infection: A multicentre randomised controlled trial in Taiwan. Tuberculosis 2018, 111, 121–126. [Google Scholar] [CrossRef]
  13. World Health Organization. Latent TB Infection: Updated and Consolidated Guidelines for Programmatic Management. 2018. Available online: https://www.who.int/tb/publications/2018/latent-tuberculosis-infection/en/ (accessed on 5 June 2019).
  14. Sterling, T.R.; Moro, R.N.; Borisov, A.S.; Phillips, E.; Shepherd, G.; Adkinson, N.F.; Weis, S.; Ho, C.; Villarino, M.E.; Tuberculosis Trials Consortium. Flu-like and other systemic drug reactions among persons receiving weekly rifapentine plus isoniazid or daily isoniazid for treatment of latent tuberculosis infection in the PREVENT tuberculosis study. Clin. Infect. Dis. 2015, 61, 527–535. [Google Scholar] [CrossRef] [PubMed]
  15. Weiner, M.; Bock, N.; Peloquin, C.A.; Burman, W.J.; Khan, A.; Vernon, A.; Zhao, Z.; Weis, S.; Sterling, T.R.; Hayden, K.; et al. Pharmacokinetics of rifapentine at 600, 900, and 1,200 mg during once-weekly tuberculosis therapy. Am. J. Respir. Crit. Care Med. 2004, 169, 1191–1197. [Google Scholar] [CrossRef] [PubMed]
  16. Weiner, M.; Savic, R.M.; Kenzie, W.R.; Wing, D.; Peloquin, C.A.; Engle, M.; Bliven, E.; Prihoda, T.J.; Gelfond, J.A.; Scott, N.A.; et al. Rifapentine pharmacokinetics and tolerability in children and adults treated once weekly with rifapentine and isoniazid for latent tuberculosis infection. J. Pediatric Infect. Dis. Soc. 2014, 3, 132–145. [Google Scholar] [CrossRef] [PubMed]
  17. Naranjo, C.A.; Busto, U.; Sellers, E.M.; Sandor, P.; Ruiz, I.; Roberts, E.A.; Janecek, E.; Domecq, C.; Greenblatt, D.J. A method for estimating the probability of adverse drug reactions. Clin. Pharmacol. Ther. 1981, 30, 239–245. [Google Scholar] [CrossRef] [PubMed]
  18. National Cancer Institute. Common Terminology Criteria for Adverse Events (CTCAE), Version 4.0; NCI, NIH, DHHS: Washington, DC, USA, 2009.
  19. Borisov, A.S.; Bamrah Morris, S.; Njie, G.J.; Winston, C.A.; Burton, D.; Goldberg, S.; Yelk Woodruff, R.; Allen, L.; LoBue, P.; Vernon, A. Update of recommendations for use of once-weekly isoniazid-rifapentine regimen to treat latent mycobacterium tuberculosis Infection. MMWR. Morb. Mortal. Wkly. Rep. 2018, 67, 723–726. [Google Scholar] [CrossRef] [PubMed]
  20. Singapore Tuberculosis Service/British Medical Reseach Council. Controlled trial of intermittent regimens of rifampicin plus isoniazid for pulmonary tuberculosis in Singapore. Lancet 1975, 2, 1105–1109. [Google Scholar]
  21. Hong Kong Tuberculosis Treatment Services/Brompton Hospital/British Medical Research Council; Reseach Council. A controlled trial of daily and intermittent rifampicin plus ethambutol in the retreatment of patients with pulmonary tuberculosis: Results up to 30 months. Tubercle 1975, 56, 179–189. [Google Scholar] [CrossRef]
  22. Dickinson, J.M.; Mitchison, D.A.; Lee, S.K.; Ong, Y.Y.; O’Mahoney, M.G.; Girling, D.J.; Nunn, A.J. Serum rifampicin concentration related to dose size and to the incidence of the ‘flu’ syndrome during intermittent rifampicin administration. J. Antimicrob. Chemother. 1977, 3, 445–452. [Google Scholar] [CrossRef] [PubMed]
  23. Jindani, A.; Harrison, T.S.; Nunn, A.J.; Phillips, P.P.; Churchyard, G.J.; Charalambous, S.; Hatherill, M.; Geldenhuys, H.; McIlleron, H.M.; Zvada, S.P.; et al. High-dose rifapentine with moxifloxacin for pulmonary tuberculosis. N. Engl. J. Med. 2014, 371, 1599–1608. [Google Scholar] [CrossRef]
  24. Dorman, S.E.; Savic, R.M.; Goldberg, S.; Stout, J.E.; Schluger, N.; Muzanyi, G.; Johnson, J.L.; Nahid, P.; Hecker, E.J.; Heilig, C.M.; et al. Daily rifapentine for treatment of pulmonary tuberculosis. A randomized, dose-ranging trial. Am. J. Respir. Crit. Care Med. 2015, 191, 333–343. [Google Scholar] [CrossRef]
  25. Dutt, A.K.; Moers, D.; Stead, W.W. Undesirable side effects of isoniazid and rifampin in largely twice-weekly short-course chemotherapy for tuberculosis. Am. Rev. Respir. Dis. 1983, 128, 419–424. [Google Scholar] [CrossRef] [PubMed]
  26. Eule, H.; Werner, E.; Winsel, K.; Iwainsky, H. Intermittent chemotherapy of pulmonary tuberculosis using rifampicin and isoniazid for primary treatment: The influence of various factors on the frequency of side-effects. Tubercle 1974, 55, 81–89. [Google Scholar] [CrossRef]
  27. Metcalfe, C.; Macdonald, I.K.; Murphy, E.J.; Brown, K.A.; Raven, E.L.; Moody, P.C. The tuberculosis prodrug isoniazid bound to activating peroxidases. J. Biol. Chem. 2008, 283, 6193–6200. [Google Scholar] [CrossRef] [PubMed]
  28. Brooks, K.M.; George, J.M.; Pau, A.K.; Rupert, A.; Mehaffy, C.; De, P.; Dobos, K.M.; Kellogg, A.; McLaughlin, M.; McManus, M.; et al. Cytokine-mediated systemic adverse drug reactions in a drug-drug interaction study of dolutegravir with once-weekly isoniazid and rifapentine. Clin. Infect. Dis. 2018, 67, 193–201. [Google Scholar] [CrossRef] [PubMed]
  29. Singla, N.; Gupta, D.; Birbian, N.; Singh, J. Association of NAT2, GST and CYP2E1 polymorphisms and anti-tuberculosis drug-induced hepatotoxicity. Tuberculosis 2014, 94, 293–298. [Google Scholar] [CrossRef] [PubMed]
  30. Nakajima, A.; Fukami, T.; Kobayashi, Y.; Watanabe, A.; Nakajima, M.; Yokoi, T. Human arylacetamide deacetylase is responsible for deacetylation of rifamycins: Rifampicin, rifabutin, and rifapentine. Biochem. Pharmacol. 2011, 82, 1747–1756. [Google Scholar] [CrossRef] [PubMed]
  31. Soldin, O.P.; Mattison, D.R. Sex differences in pharmacokinetics and pharmacodynamics. Clin. Pharmacokinet. 2009, 48, 143–157. [Google Scholar] [CrossRef] [PubMed]
  32. Azuma, J.; Ohno, M.; Kubota, R.; Yokota, S.; Nagai, T.; Tsuyuguchi, K.; Okuda, Y.; Takashima, T.; Kamimura, S.; Fujio, Y.; et al. NAT2 genotype guided regimen reduces isoniazid-induced liver injury and early treatment failure in the 6-month four-drug standard treatment of tuberculosis: A randomized controlled trial for pharmacogenetics-based therapy. Eur. J. Clin. Pharmacol. 2013, 69, 1091–1101. [Google Scholar] [CrossRef] [PubMed]
  33. Menzies, D.; Adjobimey, M.; Ruslami, R.; Trajman, A.; Sow, O.; Kim, H.; Obeng Baah, J.; Marks, G.B.; Long, R.; Hoeppner, V.; et al. Four Months of Rifampin or Nine Months of Isoniazid for Latent Tuberculosis in Adults. N. Engl. J. Med. 2018, 379, 440–453. [Google Scholar] [CrossRef] [PubMed]
  34. Swindells, S.; Ramchandani, R.; Gupta, A.; Benson, C.A.; Leon-Cruz, J.; Mwelase, N.; Jean Juste, M.A.; Lama, J.R.; Valencia, J.; Omoz-Oarhe, A. One Month of Rifapentine plus Isoniazid to Prevent HIV-Related Tuberculosis. N. Engl. J. Med. 2019, 380, 1001–1011. [Google Scholar] [CrossRef] [PubMed]
  35. Wang, J.Y.; Liu, C.H.; Hu, F.C.; Chang, H.C.; Liu, J.L.; Chen, J.M.; Yu, C.J.; Lee, L.N.; Kao, J.H.; Yang, P.C. Risk factors of hepatitis during anti-tuberculous treatment and implications of hepatitis virus load. J. Infect. 2011, 62, 448–455. [Google Scholar] [CrossRef] [PubMed]
Figure 1. Case enrollment (PK: pharmacokinetic; SNP: single-nucleotide polymorphism).
Jcm 08 00812 g001
Figure 2. XY plot showing the correlations between plasma concentration of isoniazid (INH) and acetyl-isoniazid (AcINH) (upper panels), and plasma concentration of rifapentine (RPT) and desacetyl-rifapentine (DeAcPRT) (lower panels) at 6 (C6, left column) and 24 (C24, right column) hours after drug administration, with cases who experienced a systemic drug reaction (SDR) marked in red.
Jcm 08 00812 g002
Figure 3. Boxplot showing the concentration of isoniazid (INH), acetyl-isoniazid (AcINH), rifapentine (RPT), and desacetyl-rifapentine (DeAcRPT) at 6 (C6) and 24 (C24) hours after dosing, stratified by the development of systemic drug reactions (SDRs) (p value calculated using the Mann–Whitney U test).
Jcm 08 00812 g003
Figure 4. Boxplot showing drug dosage per kg body weight (middle panel) and plasma concentration of INH, acetyl-isoniazid (AcINH), rifapentine (RPT), and desacetyl-rifapentine (DeAcRPT) in male and female participants at 6 (C6, left panel) and 24 (C24, right panel) hours after dosing (p value calculated using the Mann–Whitney U test).
Jcm 08 00812 g004
Table 1. Clinical characteristics and laboratory data.
SNP Group
(n = 177)
SDR
(n = 14)
No SDR
(n = 163)
p ValuePK Group
(n = 129)
SDR
(n = 13)
No SDR
(n = 116)
p Value
Age (year)37.1 ± 17.846.6 ± 14.536.3 ± 17.90.03848.8 ± 17.251.6 ± 12.748.5 ± 17.60.533
≤3594 (53%)2 (14%)92 (56%)0.00230 (23%)2 (15%)28 (24%)0.868
35–5544 (25%)8 (57%)36 (22%) 46 (36%)5 (38%)41 (35%)
>5539 (22%)4 (29%)35 (21%) 53 (41%)6 (46%)47 (41%)
Female sex83 (47%)6 (43%)77 (47%)0.75367 (52%)6 (46%)61 (53%)0.660
Household contact38 (21%)2 (13%)36 (22%)0.73753 (41%)5 (38%)48 (41%)>0.999
Height (cm)165.8 ± 8.3165.1 ± 8.8165.9 ± 8.20.729164.3 ± 9.0163.7 ± 7.5164.4 ± 9.10.788
Weight (kg)64.0 ± 11.965.7 ± 12.063.8 ± 10.90.56865.5 ± 12.163.1 ± 9.465.8 ± 12.40.444
Body-mass index (kg/m2) 23.2 ± 3.5224.1 ± 3.2223.1 ± 3.550.33424.2 ± 3.3623.45 ± 2.2324.26 ± 3.460.413
Current smoker20 (11%)4 (29%)16 (80%)0.05728 (22%)5 (38%)23 (20%)0.154
eGFR (mL/min/1.73 m2) 0.005 0.670
<6014 (8%)014 (9%) 6 (5%)1 (8%)5 (4%)
60–9054 (31%)10 (71%)44 (27%) 47 (36%)4 (31%)43 (37%)
≥90109 (62%)4 (29%)105 (66%) 77 (59%)8 (62%)68 (59%)
Comorbidity
HBV infection3 (2%)03 (2%)>0.9997 (5%)1 (8%)6 (5%)0.534
HCV infection2 (1%)02 (1%)>0.9993 (2%)03 (3%)>0.999
Diabetes mellitus3 (2%)03 (2%)>0.99911 (9%)2 (15%)9 (8%)0.306
Malignancy1 (1%)1 (7%)00.0796 (5%)2 (15%)4 (3%)0.112
Autoimmune1 (1%)01 (1%)>0.9991 (1%)1 (8%)00.100
Asthma000 1 (1%)01 (1%)>0.999
Hypertension5 (3%)2 (14%)3 (2%)0.05125 (19%)5 (38%)20 (17%)0.130
Anti-hypertensive medication5 (3%)2 (14%)3 (2%)0.05119 (15%)4 (31%)15 (13%)0.101
Isoniazid dose (mg/kg)14.2 ± 2.113.8 ± 2.014.3 ± 2.10.48314.0 ± 2.214.3 ± 1.913.9 ± 2.20.512
Rifapentine dose (mg/kg)14.2 ± 2.1 13.8 ± 2.014.3 ± 2.10.45414.0 ± 2.214.3 ± 1.913.9 ± 2.20.512
Hemoglobin (g/dL)14.0 ± 1.614.2 ± 1.514.0 ± 1.60.64314.0 ± 1.513.8 ± 1.614.1 ± 1.50.560
Leukocyte (K/µL)6.44 ± 1.776.78 ± 1.426.41 ± 1.800.4486.81 ± 1.856.98 ± 1.446.78 ± 1.900.732
Platelet (K/µL)258 ± 56253 ± 57259 ± 560.705270 ± 58280 ± 45269 ± 590.511
AST (U/L)23.4 ± 17.028.0 ± 19.623.0 ± 16.80.29123.3 ± 10.025.5 ± 5.623.0 ± 10.40.201
ALT (U/L)23.0 ± 28.027.6 ± 30.822.6 ± 27.90.52623.7 ± 18.927.2 ± 11.123.3 ± 19.60.290
Total bilirubin (mg/dL)0.65 ± 0.280.63 ± 0.380.66 ± 0.270.8230.63 ± 0.220.70 ± 0.250.62 ± 0.220.215
Creatinine (mg/dL)0.82 ± 0.200.83 ± 0.160.82 ± 0.200.7540.84 ± 0.290.83 ± 0.180.84 ± 0.300.876
Treatment completion159 (90%)4 (29%)155 (95%)<0.0001107 (83%)4 (31%)103 (89%)<0.0001
ALT: alanine transaminase; AST: aspartate transaminase; eGFR: estimated glomerular filtration rate; PK: pharmacokinetic; SDR: systemic drug reaction; SNP: single nucleotide polymorphism. Data are number (percentage) or mean ± standard deviation.
Table 2. Association of NAT2/CYP2E1 single-nucleotide polymorphisms (SNPs) with systemic drug reactions.
Unadjusted OR (95% CI)p ValueAdjusted OR (95% CI) *p Value
Additive model
NAT2 rs1041983CCRef Ref
CT0.85 (0.14–5.29)0.1010.87 (0.14–5.46)0.132
TT7.67 (1.51–39.0)0.00065.82 (1.08–35.1)0.003
CYP2E1 rs2070673TTRef Ref
TA0.84 (0.20–3.52)0.8150.89 (0.21–3.80)0.871
AA3.21 (0.79–15.0)0.1033.28 (0.78–13.9)0.106
Dominant model
NAT2 rs1041983CCRef Ref
CT+TT2.41 (0.51–11.3)0.2652.01 (0.41–9.96)0.394
CYP2E1 rs2070673TTRef Ref
TA+AA1.43 (0.42–4.84)0.5681.49 (0.43–5.20)0.532
Recessive model
NAT2 rs1041983CC+CTRef Ref
TT8.47 (2.55–28.1)0.00057.00 (2.03–24.1)0.002
CYP2E1 rs2070673TT+TARef Ref
AA3.51 (1.05–11.7)0.0413.50 (1.02–12.0)0.047
* Adjusted for age, sex and estimated glomerular filtration rate.
Table 3. Detailed information of the participants experiencing systemic drug reaction during 3HP therapy in the pharmacokinetic (PK) cohort.
Age/SexBW (kg)/BH (cm)Adverse ReactionsSeverity (Grade)Comorbidity & MedicationRisk Allele in NAT2/CYP2E1 *INH/RPT Conc. # [Sampling Week]Onset (Week)Time of Onset/Duration (h)Outcome of 3HP
66.3/F50.0/149fever, chills, malaise, myalgia, headache2Lung adenocarcinoma under gefitinib1/2C24: 0.11/18.5 [3]37/29Stop
64.4/M62.5/170fever, myalgia, chills, weakness, sweating2HTN under amlodipine & olmesartan2/1C6: 5.61/21.3 [4]36/18Stop
59.8/F59.5/154fever, chills, dyspnea, angioedema, malaise3Breast cancer, cured2/2C24: 0.51/16.7 [3]34/>100Stop
56.7/M73.0/175shock (BP 90/60 mmHg), fever, flush, myalgia, dyspnea, rash3HTN under lercanidipine2/2C24: 1.04/8.9 [3]35/47Stop
53.4/F63.0/160fever, chills, dizziness, myalgia, dizziness2Nil1/1C6: 2.98/11.4 [4]39/15Stop
51.4/M74.0/167shock (BP 85/67 mmHg), dizziness, vomiting2DM, HTN 2/1C24: 0.80/8.9 [3]33/47Stop
50.5/M72.0/168shock (BP 88/63 mmHg), fever, nausea, vomiting, dizziness, sweating2HTN under bisoprolol & olmesartan2/0C24: 0.25/6.9 [7]71/8Stop
33.9/F47.0/158shock (BP 82/57 mmHg), fever, headache, nausea, vomiting, malaise3Nil2/0C24: 0.43/15.4 [3]31/88Stop
20.6/F53.0/162shock, fever, chills, headache, myalgia, nausea3Nil1/1C6: 3.36/42.3 [4] C24: 0.06/18.4 [4]32/30Stop
60.9/M62.0/161fever, myalgia, nausea, vomiting dizziness2DM, HTN amlodipine & valsartan0/1C24: 0.06/11.0 [3]36/28Complete
55.9/F60.0/163fever, chills, myalgia, malaise, headache3AS under celecoxib0/0C24: 0.04/14.3 [4]35/76Complete
53.7/M76.5/174fever, chills, dizziness, malaise, nausea2HBV carrier not Tx2/1C24: 0.55/14.9 [6]63/16Complete
43.8/M67.5/167fever, myalgia, dizziness, tachypnea, malaise2Nil1/0C6: 0.70/23.0 [4]41/27Complete
AS, ankylosing spondylitis; BP, blood pressure; CYP2E1, cytochrome P450 2E1; DM, diabetes mellitus; HTN, hypertension; INH, isoniazid; NAT2, N-acetyltransferase 2, RPT, rifapentine; Tx, treatment; * Number of T allele at NAT2 rs1041983/number of A allele at CYP2E1 rs2070673; # Drug levels that were higher than the median of all tested data at the same timing (C6 of INH: 2.07 µg/mL; C6 of RPT: 20.9 µg/mL; C24 of INH: 0.06 µg/mL; C24 of RPT: 11.4 µg/mL) were shown in bold.
Table 4. Validation of N-acetyltransferase 2 (NAT2)/Cytochrome P450 2E1 (CYP2E1) single nucleotide polymorphisms (SNPs) with systemic drug reactions in pharmacokinetic (PK) cohort.
Unadjusted OR (95% CI)p ValueAdjusted OR (95% CI) *p Value
Additive model
NAT2 rs1041983CCRef Ref
CT1.09 (0.19–6.28)0.9251.06 (0.18–6.34)0.948
TT4.52 (0.86–23.8)0.0754.61 (0.82–25.8)0.082
CYP2E1 rs2070673TTRef Ref
TA1.84 (0.49–6.94)0.8072.10 (0.54–8.20)0.285
AA2.53 (0.51–12.5)0.3832.80 (0.55–14.3)0.216
Dominant model
NAT2 rs1041983CCRef Ref
CT+TT2.13 (0.45–10.2)0.3432.04 (0.41–10.1)0.384
CYP2E1 rs2070673TTRef Ref
TA+AA2.03 (0.59–6.96)0.2622.30 (0.65–8.15)0.199
Recessive model
NAT2 rs1041983CC+CTRef Ref
TT4.23 (1.30–13.8)0.0174.43 (1.30–15.1)0.017
CYP2E1 rs2070673TT+TARef Ref
AA1.84 (0.46–7.41)0.3921.90 (0.46–7.80)0.375
* Adjusted for age, sex and estimated glomerular filtration rate.

