Proceeding Paper

Design, Environment, Energy, and Comfort in Buildings Equipped with a PMV-Controlled HVAC System †

by
Eusébio Conceição
1,*,
Margarida Conceição
2,
Maria Inês Conceição
2,
Maria Manuela Lúcio
1 and
Hazim Awbi
3
1
Faculdade de Ciências e Tecnologia, Universidade do Algarve, Campus de Gambelas, 8005-139 Faro, Portugal
2
Instituto Superior Técnico, Universidade de Lisboa, 8005-139 Faro, Portugal
3
School of Built Environment, University of Reading, Reading RG6 6AW, UK
*
Author to whom correspondence should be addressed.
Presented at the 1st International Online Conference on Buildings, 24–26 October 2023; Available online: https://iocbd2023.sciforum.net/.
Eng. Proc. 2023, 53(1), 24; https://doi.org/10.3390/IOCBD2023-15209
Published: 24 October 2023
(This article belongs to the Proceedings of The 1st International Online Conference on Buildings)

Abstract

:
This work presents a study about the design, environment, energy, and comfort in buildings equipped with a Predicted Mean Vote (PMV)-controlled HVAC system. The control system, based on the three categories of the international standard ISO 7730 uses the level of thermal comfort instead of the traditional control of the air temperature. In this type of control, using the PMV index, the air temperature (Tair), air relative humidity (RHair), Mean Radiant Temperature (MRT), air velocity (Vair), level of clothing (CL), and level of physical activity (AL) are considered. The initial four parameters are associated with environmental ones, and the last two are associated with personal ones. The simulation is carried out using a simulator of the dynamic thermal response of buildings and the thermophysiology of the occupants. The simulator considers energy and mass balance integral equations, based on the building’s design. This equation system is generated by the simulator. In this study, three cases are performed: Categories A, B, and C. According to the results obtained, it is possible to verify that it takes some time to achieve acceptable comfort conditions when the HVAC system is connected. However, after the conditions are achieved, the system guarantees acceptable conditions during the occupancy time. Category A provides higher levels of energy consumption than Categories B and C.

1. Introduction

In this study, a family house in winter conditions is equipped with an HVAC system. In this HVAC system, which works in a heating methodology, a CS (Control System), using a PMV (Predicting Mean Vote) index, is used. This kind of CS, used instead of a traditional control using the internal Tair (see as an example also Conceição et al. [1]), considers not only the internal Tair but also the MRT, RHair, Vair, AL, and CL, using a PMV index.
This PMV index, which changes between −3 in a cold environment and 3 in a hot environment, developed by Fanger [2], considers an energy balance integral equation in the human body, namely, the energy production is equal to the energy dissipation. This kind of methodology considers the convection, conduction, radiation, evaporation, and other phenomena.
Fanger [2] also developed the Predicted Percentage of Dissatisfied People (PPD) index. This index, which changes between 0 and 100%, is correlated with the PMV index.
The application of the PMV and PPD in ventilated spaces, to evaluate Thermal Comfort Level (TCL), can be seen in Conceição et al.’s study [3], in bus ventilation spaces, and in Conceição et al.’s study [4] in a virtual chamber. Other studies can be seen also, in Nico et al.’s [5], Fanger and Toftum’s [6], and Fabbri’s [7] studies.
This index is used by international standards, such as ISO 7730 [8] and ASHRAE 55 [9], to evaluate the TCL. Thus, in accordance with ISO 7730 [8], three categories are considered: A, B, and C. Category A is used for buildings with special thermal requirements and considers the PPD index lower than 6% and the PMV index change between −0.2 and 0.2. Category B, used for new buildings, considers the PPD index lower than 10% and the PMV index change between −0.5 and 0.5. Category C, used for existing buildings, considers the PPD index lower than 15% and the PMV index change between −0.7 and 0.7.
In order to implement this kind of methodology, using a PMV index as an HVAC CS, numerical software is developed and applied. In this kind of methodology, the software simulates the Dynamic Thermal Response (DTR) of the Building model. This software calculates the opaque temperatures, transparent temperatures, internal temperatures, and environmental thermal conditions. These environmental thermal conditions, namely, the Tair, the MRT, the RHair, the Vair, and other conditions, are human-internal contaminants (carbon dioxide concentration, water vapour, and others).
The DTR of the Building model considers the conduction, convection, radiation, evaporation, and other phenomena, see Conceição et al. [10]. This software considers not only the active methodologies, such as the HVAC system and other factors, but also passive methodologies, such as solar radiation and other factors, see Ignjatovic et al. [11] and Ulpiani et al. [12].
The inputs of the DTR of the Building model are the building’s geometry, the building’s geographic conditions, the building’s materials, the building’s occupancy, the building’s ventilation, and external environments. In the ventilation, in accordance with the ASHRAE 62.1 [13], the airflow rate is defined in accordance with the occupation. However, when no occupation is used, the air exchange rate is considered. In this case, the experimental tests, using the tracer gas concentration, are used.
The objective of this work is to improve human TCL in a family house equipped using an HVAC system based on PMV control. The study considered three categories of TCL, namely, Categories A, B, and C. The environmental variables, the TCL, and the energy consumption are considered.

2. Model and Methodology

2.1. Numerical Model

The DTR of the Building model, which considers energy and mass balance integral equations, uses:
  • Conduction. This phenomenon is considered in opaque buildings, between the several layers, namely, in the external and internal walls, ceiling, door, ground, and other bodies;
  • Convection. This phenomenon is considered between the opaque and transparent surfaces of the bodies and the internal or external environment;
  • Radiation. This phenomenon is divided into two parts: heat exchange by radiation and solar radiation. The first one is verified inside each space, between the different surfaces, and in the external surfaces, between the external opaque and transparent bodies surfaces and the external environment. The second one is associated with solar radiation;
  • Evaporation. This phenomenon is verified between the opaque surfaces of the bodies and the internal and external environment;
  • Others phenomena. In the numerical simulation, adsorption, desorption, occupation, HVAC system, transport by ventilation, and other phenomena are considered.
The DTR of the Building model calculates the Opaque body temperature; Transparent body temperature; Internal body temperatures; Solar radiation distribution; Glass radiative properties; Heat transfer coefficients by convection and radiation; TCL; Carbon dioxide concentration; Water vapour; Indoor air quality; Indoor environmental variables; and Other variables.
The DTR of the Building model considers:
  • Active methodologies, such as the HVAC system, water solar collectors, water radiant surfaces, heat exchanges by geothermal phenomena, wind and photovoltaic energy production, and other factors;
  • Passive methodologies, such as solar radiation (in summer and winter conditions), thermal mass (namely the heat absorption, heat desorption, and heat storage), natural cross ventilation (associated with the pressure differences verified opposite door and windows), the roof albedo (associated with the heat loss in the roof surface), special transparent bodies or opaque bodies, greenhouses, and others factors.
The inputs of the DTR of the Building model are:
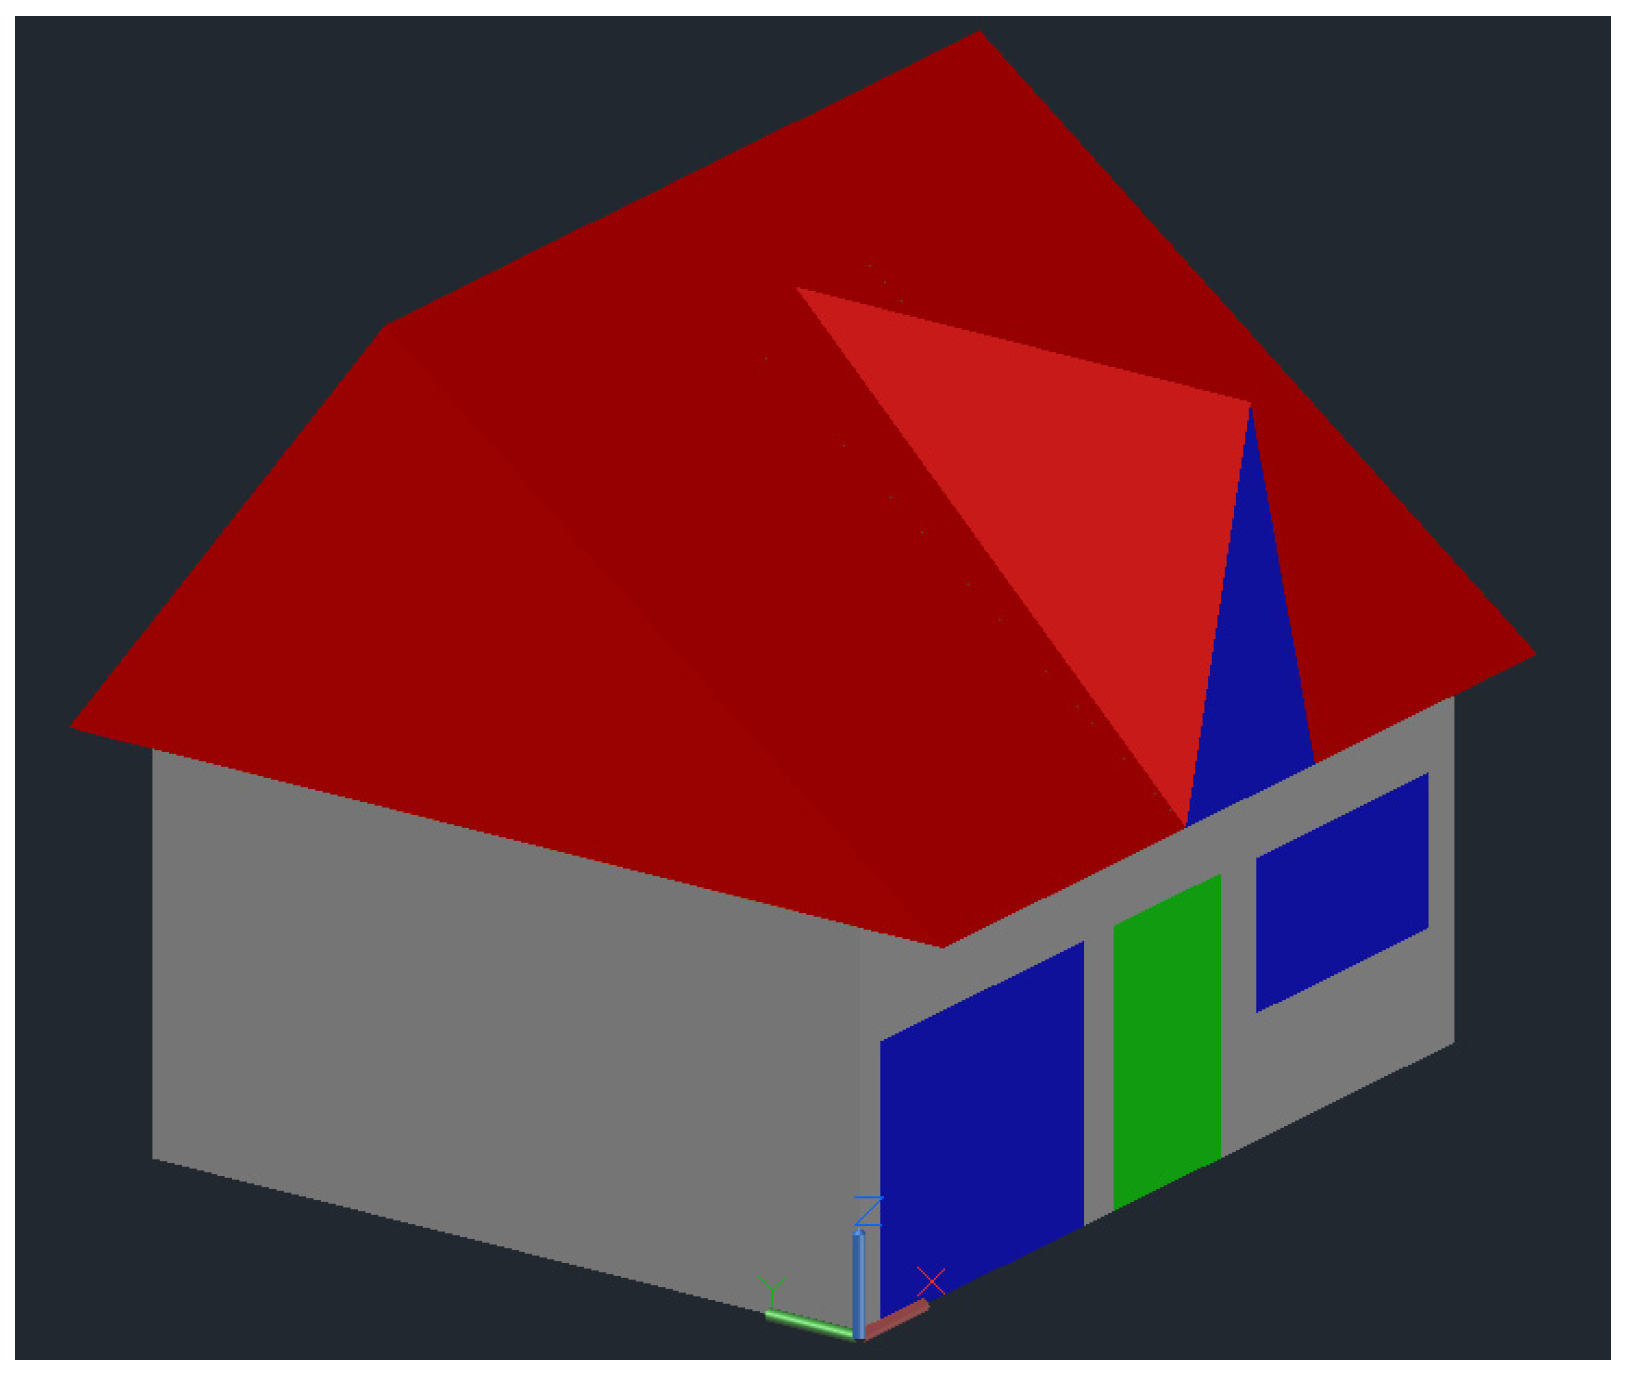
  • The building geometry. This geometry is introduced using the CAD system;
  • The geographic conditions of the building. The latitude and longitude are important factors that influence solar radiation intensity;
  • The building materials. This topic is an important issue associated with opaque and transparent bodies;
  • The building occupancy. The occupation can change throughout the day for all spaces. This information contributes to the internal heat gain;
  • The ventilation of the building. In the ventilation, two parts are considered: with occupation and without occupation. In the first one, the airflow rate is defined in accordance with the occupation level. Without occupation, the air exchange rate, with experimental tests using the tracer gas concentration as an example, is considered;
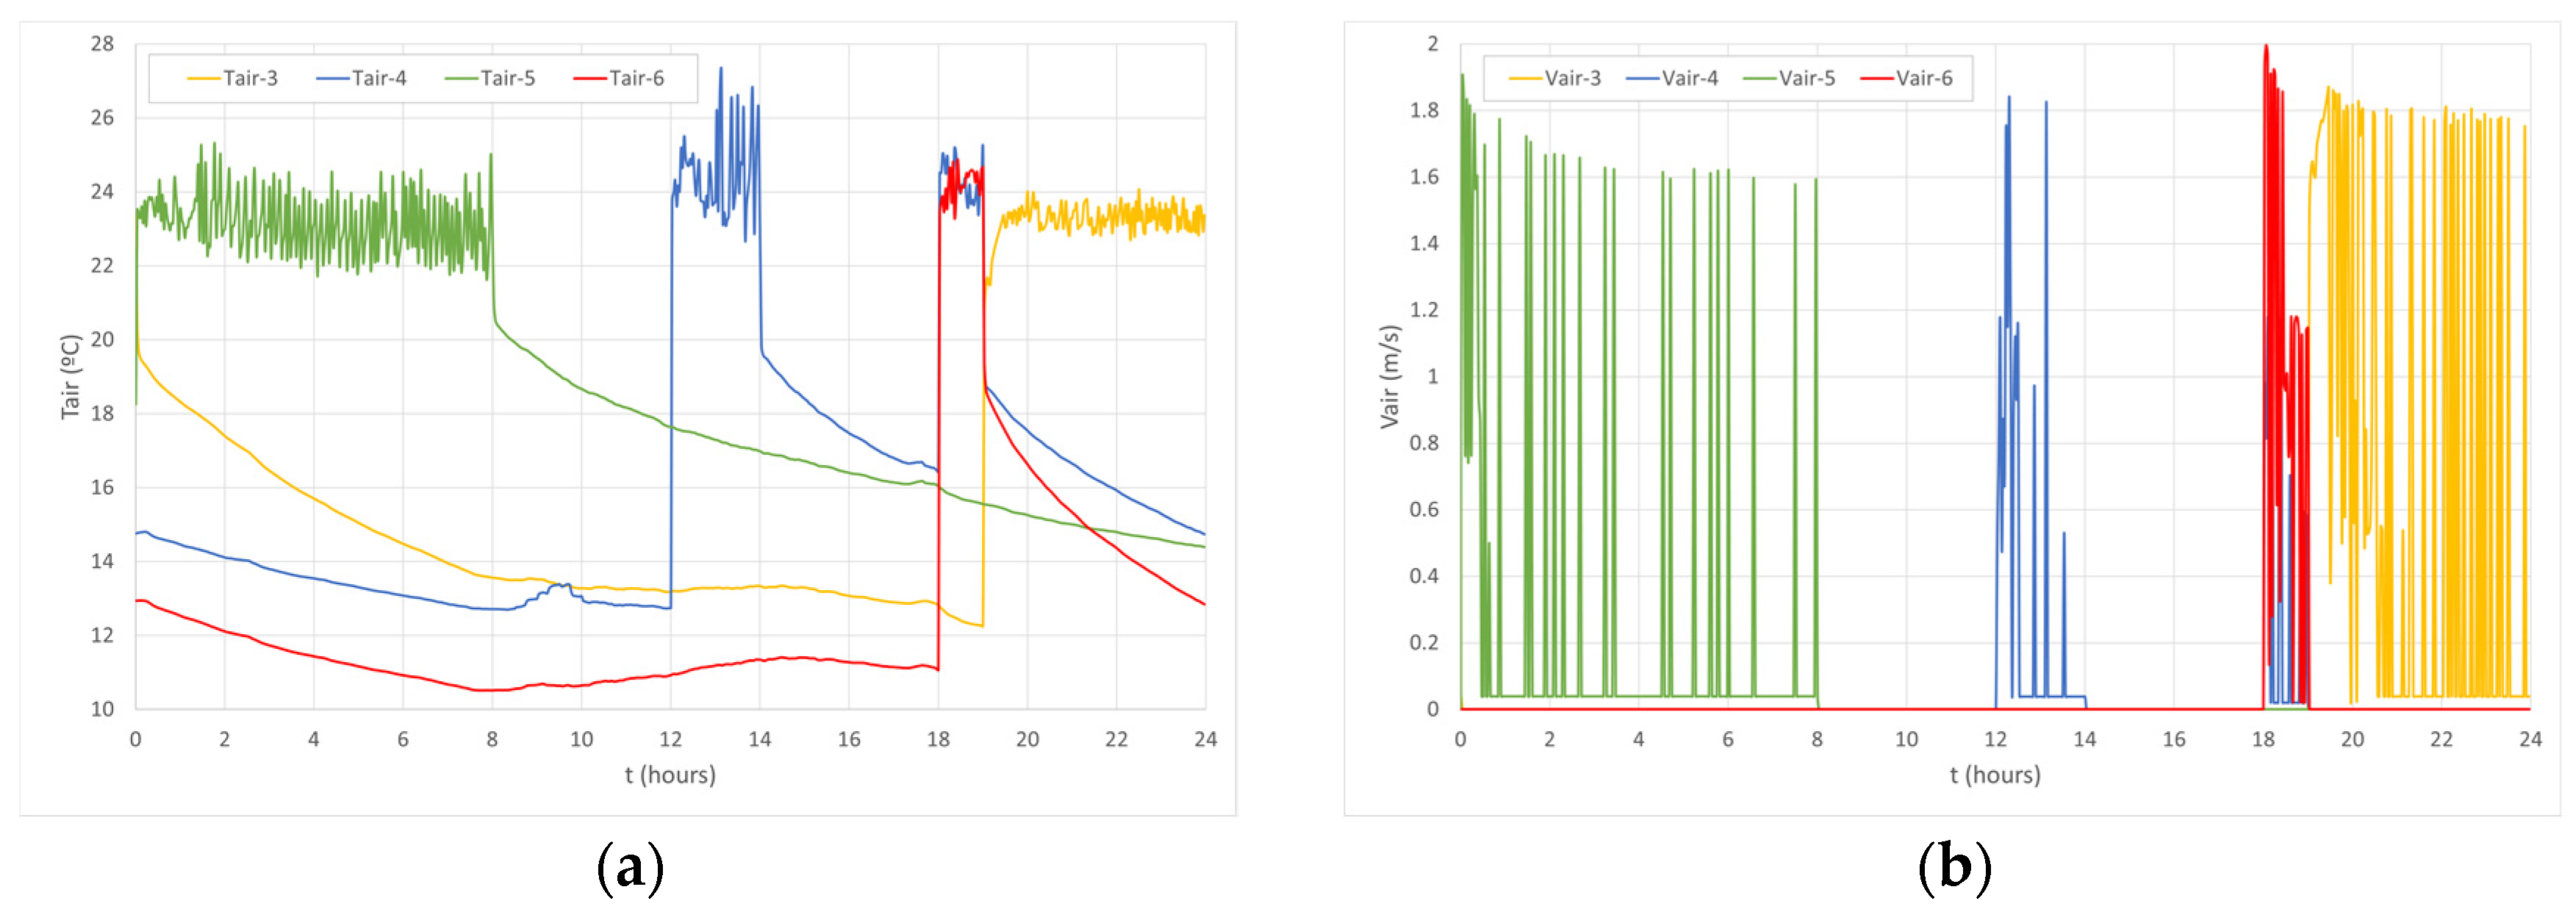
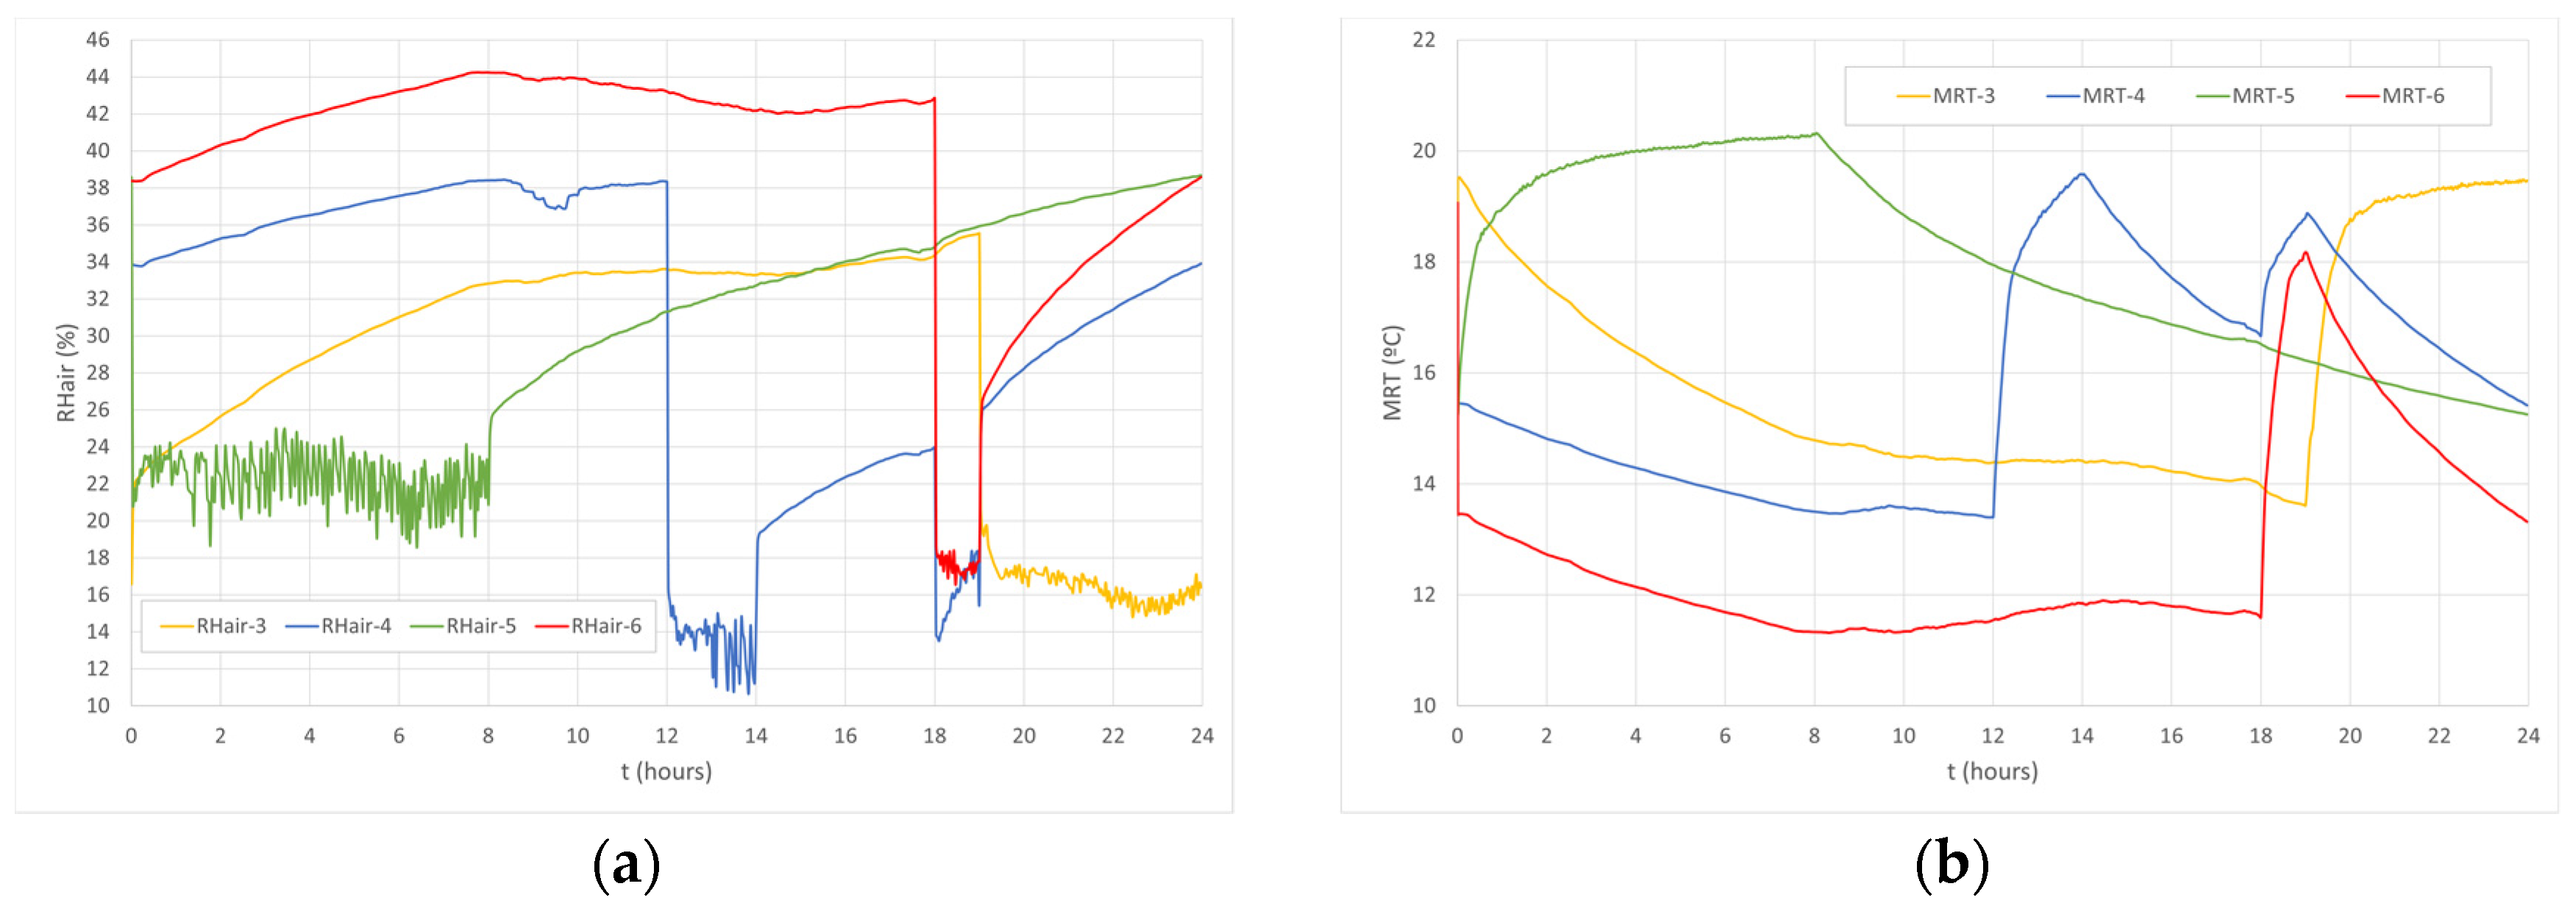
  • External environments. The external Tair, wind Vair, air RHair, and wind direction are considered.

2.2. Numerical Methodology

This study, made in winter conditions, considers a family house prototype, see Figure 1, divided into two levels, namely, the first and the second floor. The first floor considers five spaces, and the second floor considers one space.
The family house considers one external space (space number 1), five internal spaces (spaces number 2 to 6), and a loft (space number 7), namely, Space 1—external space; Space 2—non-permanent occupation with window facing south; Space 3—occupied space with window facing south; Space 4—occupied space with window facing north; Space 5—occupied space with window facing east; Space 6—occupied space with window facing south; and Space 7—non-permanent occupation space located in the loft.
The family house considers the following occupation level: Space 3—with two persons between 19 to 24 h; Space 4—with two persons between 12 to 14 h and one person between 18 to 19 h; Space 5—with two persons between 0 to 8 h; and Space 6 –with two persons between 18 to 19 h.
The ventilation strategies consider: With occupation, the airflow rate is proportional to the occupation level, namely, 35 m3/h per occupant. Without occupation, the air exchange rate is considered.
In the study three Case studies are considered:
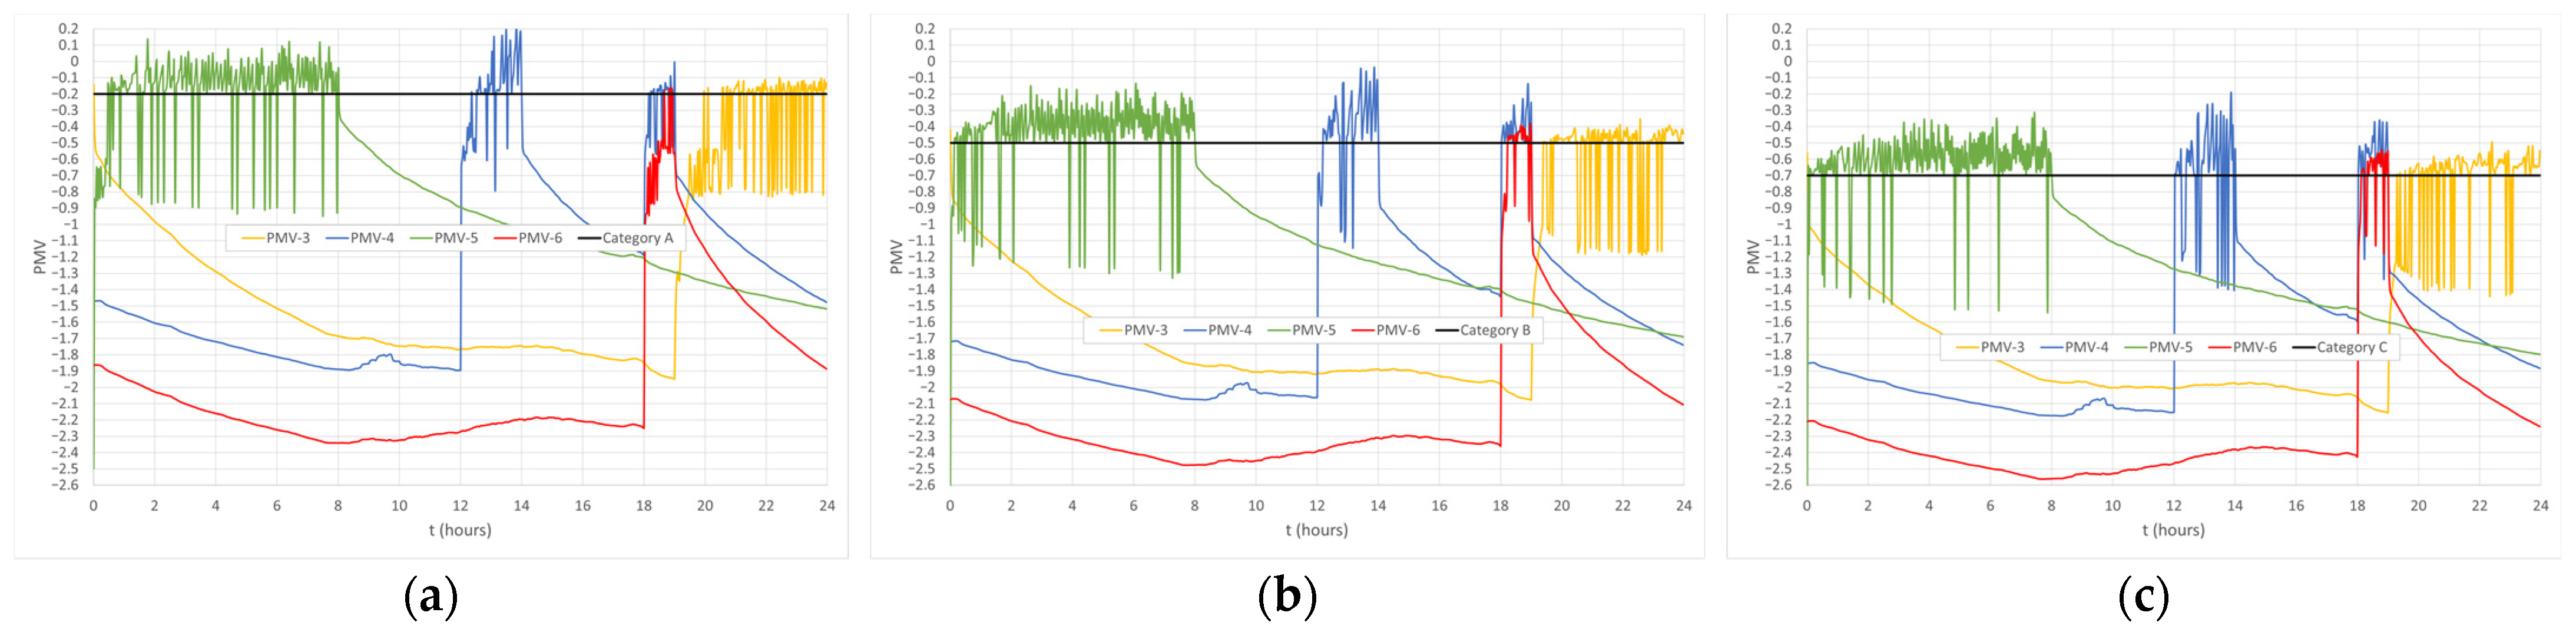
  • Case A: in the first case, category A of the ISO 7730 is considered;
  • Case B: in the first case, category B of the ISO 7730 is considered;
  • Case C: in the first case, category C of the ISO 7730 is considered.

3. Results and Discussion

In this work, the evolution of environmental variables, TCL, and energy consumption for three case studies are presented.
In Figure 2 and Figure 3, the environmental variables are presented for Case A.
In Figure 2a, the evolution of Tair for spaces 3, 4, 5, and 6 is presented; in Figure 2b, the evolution of Vair for spaces 3, 4, 5 and 6 is shown; in Figure 3a, the evolution of RHair for the spaces 3, 4, 5, and 6 is presented; and in Figure 3b, the evolution of MRT for the spaces 3, 4, 5, and 6 is shown.
In Figure 4, the PMV index is presented. The evolution of the PMV index for spaces 3, 4, 5, and 6 for Case A is presented in Figure 4a. The evolution of the PMV index for spaces 3, 4, 5, and 6 for Case B is shown in Figure 4b. The evolution of PMV index for the spaces 3, 4, 5, and 6 for Case C is depicted in Figure 4c.
Finally, Table 1 presents the energy consumption in Cases A, B, and C.
When the HVAC system is connected the Tair, the Vair and the MRT increase, whereas the RHair decreases. The Tair, the Vair, and the RHair are subjected to fluctuation levels, whereas the MRT is not subjected.
When the HVAC system is connected, the Tair value is higher than the MRT.
In Case A, the PMV value is highest, and in Case C, the PMV value is lowest.
The fluctuation of the PMV value is influenced by environmental variables, namely, by the Vair, the RHair, the Tair, and the MRT. When the Vair and the RHair increase, the PMV value decreases, whereas the PMV value increases when the Tair and the MRT increase. However, the Vair strongly influences the PMV value.
The total energy consumption is the highest for Case A and the lowest for Case C. The energy consumption is highest in room 3 and is lowest in room 4. Additionally, room 3 presents higher values than rooms 4, 5, and 6.

4. Conclusions

In this work, the human TCL in a family house equipped with an HVAC system based on PMV control is made. The study is made for PMV control in accordance with Categories A, B, and C of the international standards.
In accordance with the obtained results, when the HVAC system is connected the Tair, the Vair and the MRT increase and the RHair decreases. The Tair value is higher than the MRT.
Case A presents the highest values and Case C presents the lowest values. When the Vair and the RHair increase, the PMV value decreases, whereas the PMV value increases when the Tair and the MRT increase. However, the Vair strongly influences the PMV value.
The energy consumption is the highest for Case A and is the lowest for Case C, as well as is highest in Room 3 and lowest in Room 4.

Author Contributions

E.C., M.C., M.I.C., M.M.L. and H.A. contributed equally to the design of the work, numerical simulation, analysis of results, writing, and review of the manuscript. All authors have read and agreed to the published version of the manuscript.

Funding

The authors would like to acknowledge the project (SAICT-ALG/39586/2018) from the Algarve Regional Operational Program (CRESC Algarve 2020), under the PORTUGAL 2020 Partnership Agreement, through the European Regional Development Fund (ERDF) and the National Science and Technology Foundation (FCT).

Institutional Review Board Statement

Not applicable.

Informed Consent Statement

Not applicable.

Data Availability Statement

Data sharing is not applicable.

Conflicts of Interest

The authors declare no conflict of interest.

References

  1. Conceição, E.Z.E.; Lúcio, M.M.J.R.; Ruano, A.E.B.; Crispim, E.M. Development of a temperature control model used in HVAC systems in school spaces in Mediterranean climate. Build. Environ. 2009, 44, 871–877. [Google Scholar] [CrossRef]
  2. Fanger, P.O. Analysis and Applications in Environmental Engineering; Danish Technical Press: Copenhagen, Denmark, 1970. [Google Scholar]
  3. Conceição, E.Z.E.; Silva, M.C.G.; Viegas, D.X. Airflow around a passenger seated in a bus. HVAC R Res. 1997, 3, 311–323. [Google Scholar] [CrossRef]
  4. Conceição, E.Z.E.; Awbi, H. Evaluation of integral effect of thermal comfort, air quality and draught risk for desks equipped with personalized ventilation systems. Energies 2021, 14, 3235. [Google Scholar] [CrossRef]
  5. Nico, M.A.; Liuzzi, S.; Stefanizzi, P. Evaluation of thermal comfort in university classrooms through objective approach and subjective preference analysis. Appl. Ergon. 2015, 48, 111–120. [Google Scholar] [CrossRef] [PubMed]
  6. Fanger, P.O.; Toftum, J. Extension of the PMV model to non-air-conditioned buildings in warm climates. Energy Build. 2002, 34, 533–536. [Google Scholar] [CrossRef]
  7. Fabbri, K. Thermal comfort evaluation in kindergarten: PMV and PPD measurement through datalogger and questionnaire. Build. Environ. 2013, 68, 202–214. [Google Scholar] [CrossRef]
  8. ISO 7730; Ergonomics of the Thermal Environment Analytical Determination and Interpretation of Thermal Comfort Using Calculation of the PMV and PPD Indices and Local Thermal Comfort Criteria. International Standard Organization: Geneva, Switzerland, 2005.
  9. ANSI/ASHRAE Standard 55-2017; Thermal Environmental Conditions for Human Occupancy. American Society of Heating, Refrigerating, and Air-Conditioning Engineers, Inc.: Atlanta, GA, USA, 2017.
  10. Conceição, E.Z.E.; Gomes, J.; Awbi, H. Influence of the airflow in a solar passive building on the indoor air quality and thermal comfort levels. Atmosphere 2019, 10, 766. [Google Scholar] [CrossRef]
  11. Ignjatović, D.; Popović, M.J.; Kavran, J. Application of sunspaces in fostering energy efficiency and economical viability of residential buildings in Serbia. Energy Build. 2015, 98, 3–9. [Google Scholar] [CrossRef]
  12. Ulpiani, G.; Giuliani, D.; Romagnoli, A.; di Perna, C. Experimental monitoring of a sunspace applied to a NZEB mock-up: Assessing and comparing the energy benefits of different configurations. Energy Build. 2017, 152, 194–215. [Google Scholar] [CrossRef]
  13. ASHRAE Standard 62-1989; Ventilation for Acceptable Indoor Air Quality. American Society of Heating, Refrigerating, and Air-Conditioning Engineers, Inc.: Atlanta, GA, USA, 1990.
Figure 1. Family house divided into two levels. The green surface is associated with the door, the blue surfaces are associated with glass, the grey surfaces are associated with walls, and the red is associated with the roof.
Engproc 53 00024 g001
Figure 2. Evolution of (a) Tair and (b) Vair for the spaces 3, 4, 5, and 6 for Case A.
Engproc 53 00024 g002
Figure 3. Evolution of (a) RHair and (b) MRT for the spaces 3, 4, 5, and 6 for Case A.
Engproc 53 00024 g003
Figure 4. Evolution of Predicted Mean Vote (PMV) for the spaces 3, 4, 5, and 6 for (a) Case A, (b) Case B, and (c) Case C.
Engproc 53 00024 g004
Table 1. Energy consumption for the Cases A, B, and C in W×hours.
Cases/Rooms3456Total
A17,087.93473.79534.84526.834,623.2
B11,627.72555.97235.62424.523,843.7
C10,403.34595.94444.62215.621,659.3
Disclaimer/Publisher’s Note: The statements, opinions and data contained in all publications are solely those of the individual author(s) and contributor(s) and not of MDPI and/or the editor(s). MDPI and/or the editor(s) disclaim responsibility for any injury to people or property resulting from any ideas, methods, instructions or products referred to in the content.

