Assembly of ZnO Nanoparticles on SiO2@α-Fe2O3 Nanocomposites for an Efficient Photo-Fenton Reaction


1
Precision Analysis and Materials Research Center, National Taipei University of Technology, Taipei 106, Taiwan
2
Department of Chemical Engineering and Biotechnology, National Taipei University of Technology, Taipei 106, Taiwan
*
Authors to whom correspondence should be addressed.
Inorganics 2018, 6(3), 90; https://doi.org/10.3390/inorganics6030090
Submission received: 31 July 2018
/
Revised: 20 August 2018
/
Accepted: 2 September 2018
/
Published: 3 September 2018
(This article belongs to the Special Issue Mixed Metal Oxides)
Abstract
:The SiO2@α-Fe2O3/ZnO metal oxide nanocomposites employed in this study were obtained using the sol-gel method. Their photocatalytic activities were enhanced by photo-Fenton reactions. The metal oxide composite of ZnO and α-Fe2O3 nanoparticles were deposited on the SiO2 nanospheres intended for visible light photocatalysis. Further, the as-synthesized SiO2@α-Fe2O3/ZnO nanocomposites exhibited a robust crystallinity and a high adsorption of dye molecules when compared to SiO2@ZnO and SiO2@α-Fe2O3 nanocomposites, respectively. The experimental results demonstrated a rapid Methylene Blue (MB) degradation among these catalysts within short intervals of time with the addition of α-Fe2O3/ZnO mixed metal oxide catalysts on the SiO2 nanospheres. Finally, a photo-Fenton reaction was implemented to confirm the presence of the hydroxyl (OH) radicals, which are powerful agents used for the degradation of organic pollutants.
1. Introduction
In order to avoid damage to the environment from greenhouse gases, it is necessary to develop renewable energy resources as alternatives to fossil fuels. Solar energy has received much attention as a sustainable and clean energy source. The conversion of solar energy into chemical energy is a promising technique in producing renewable energy [1]. It has also been found that photocatalysis can play a very effective role in removing organic pollutants from water [2]. Recently, semiconductor photocatalysis has been studied, especially for photocatalytic reactions, having a wide band gap acting as a UV and visible light photocatalyst [3]. Several researchers have focused on improving the conductivity and optical properties of heterogeneous semiconductor nanocomposite materials, particularly metal oxides. These are dominant because of their properties that enhance the surface plasmon effect and offer improvement in the visible light region [4].
Improved visible light photocatalysts grown from heterogeneous metal oxide semiconductor nanocomposites are expected to be suitable for a variety of applications [5]. In particular, these metal oxides have shown greater stability and sensitivity, especially for the degradation of organic pollutants [6]. Among the various metal oxides, ZnO and α-Fe2O3 are the best combination for the production of the heterogeneous photocatalysts used for wastewater treatment [7], CO2 reduction [8], hydrogen production [9], CO oxidation [10], and water splitting [9,11]. The heterogeneous semiconductors can also be utilized to trap electrons at surface sites and to support the formation of superoxide anion radicals O2− from O2 molecules. There are many methods which can be used for the preparation of heterogeneous metal oxide nanocomposites, including hydrothermal [12], chemical vapor deposition [13], sonochemical [14], and the sol-gel [15,16] method. Among these, the sol-gel method has several advantages, being more economical, requiring only a simple preparation, and having good stability and reproducibility [17].
In this work, SiO2@α-Fe2O3/ZnO metal oxide nanocomposites were utilized for the effective degradation of organic pollutants. Additionally, the introduction of ZnO nanoparticles onto the SiO2@α-Fe2O3 nanocomposites offered the benefits of charge separation followed by the scavenging of electrons and holes by the surface adsorbed species, which consequently enhanced the degradation of the Methylene Blue (MB) dye. Furthermore, the addition of hydrogen peroxide (H2O2) improved the number of OH radicals and encouraged the degradation mechanism based on the photo-Fenton reaction. The two metal oxides α-Fe2O3 and ZnO were grown on SiO2 nanospheres to enhance the stability of the photocatalytic degradation.
2. Results and Discussion
2.1. X-ray Diffraction (XRD)
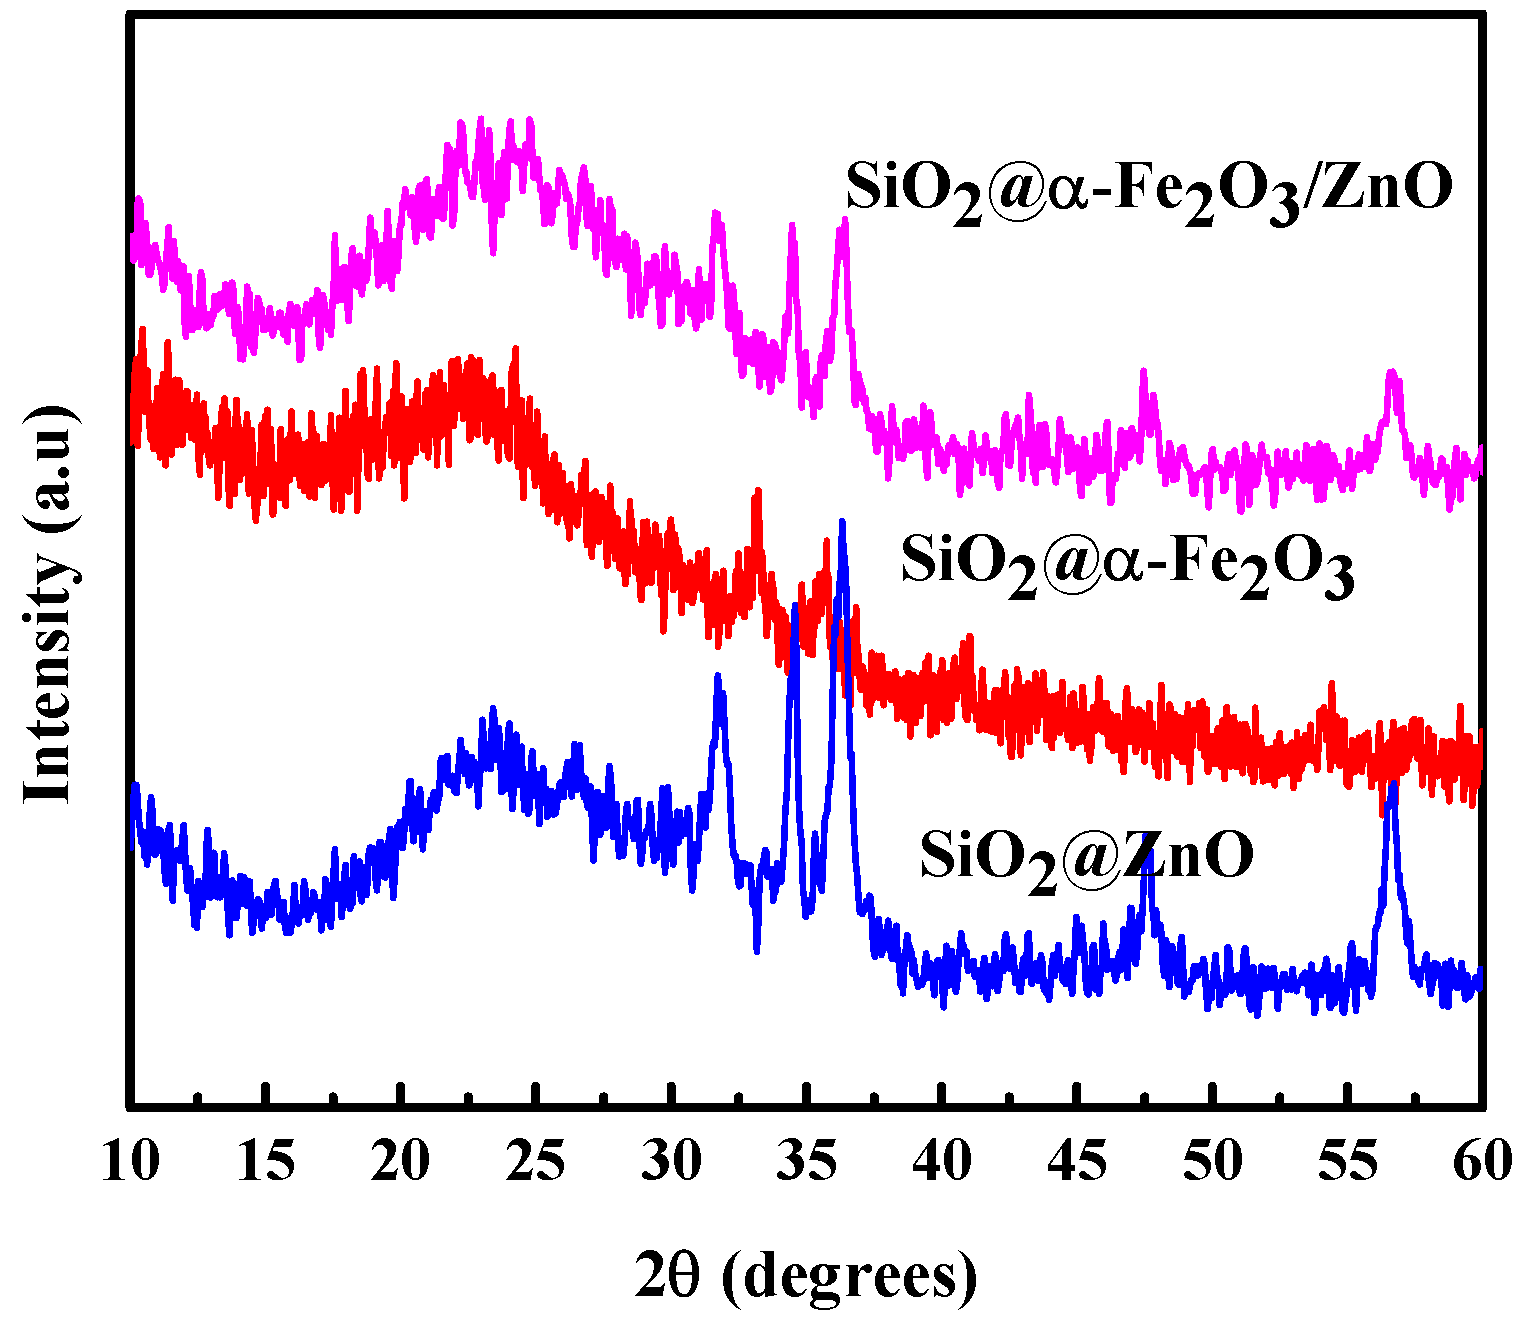
The XRD profiles of the as-prepared samples are shown in Figure 1. The diffraction peaks at 33.2, 35.6, and 40.9° are attributed to the 001, 101, and 002 planes ((JCPDS no. 89-8104) of α-Fe2O3, respectively, with the weak intensity being due to the very thin layer of α-Fe2O3 [18]. In addition, the relatively broad peak observed at 24.5°, which arose from the SiO2, confirms that the deposition of α-Fe2O3 occurred on the top of the SiO2 spheres. Furthermore, the addition of ZnO to the SiO2 spheres is shown by the 2θ peaks at 31.6, 34.3, 36.2, 47.4, and 56.6° that are ascribed to the 100, 002, 101, 102, and 110 planes, respectively (JCPDS 01-089-0510), indexed to the crystalline planes of the ZnO nanoparticles [19]. The existence of these 2θ peaks from the as-prepared samples confirms the presence of ZnO on the α-Fe2O3 nanoparticles.
2.2. Structural Properties
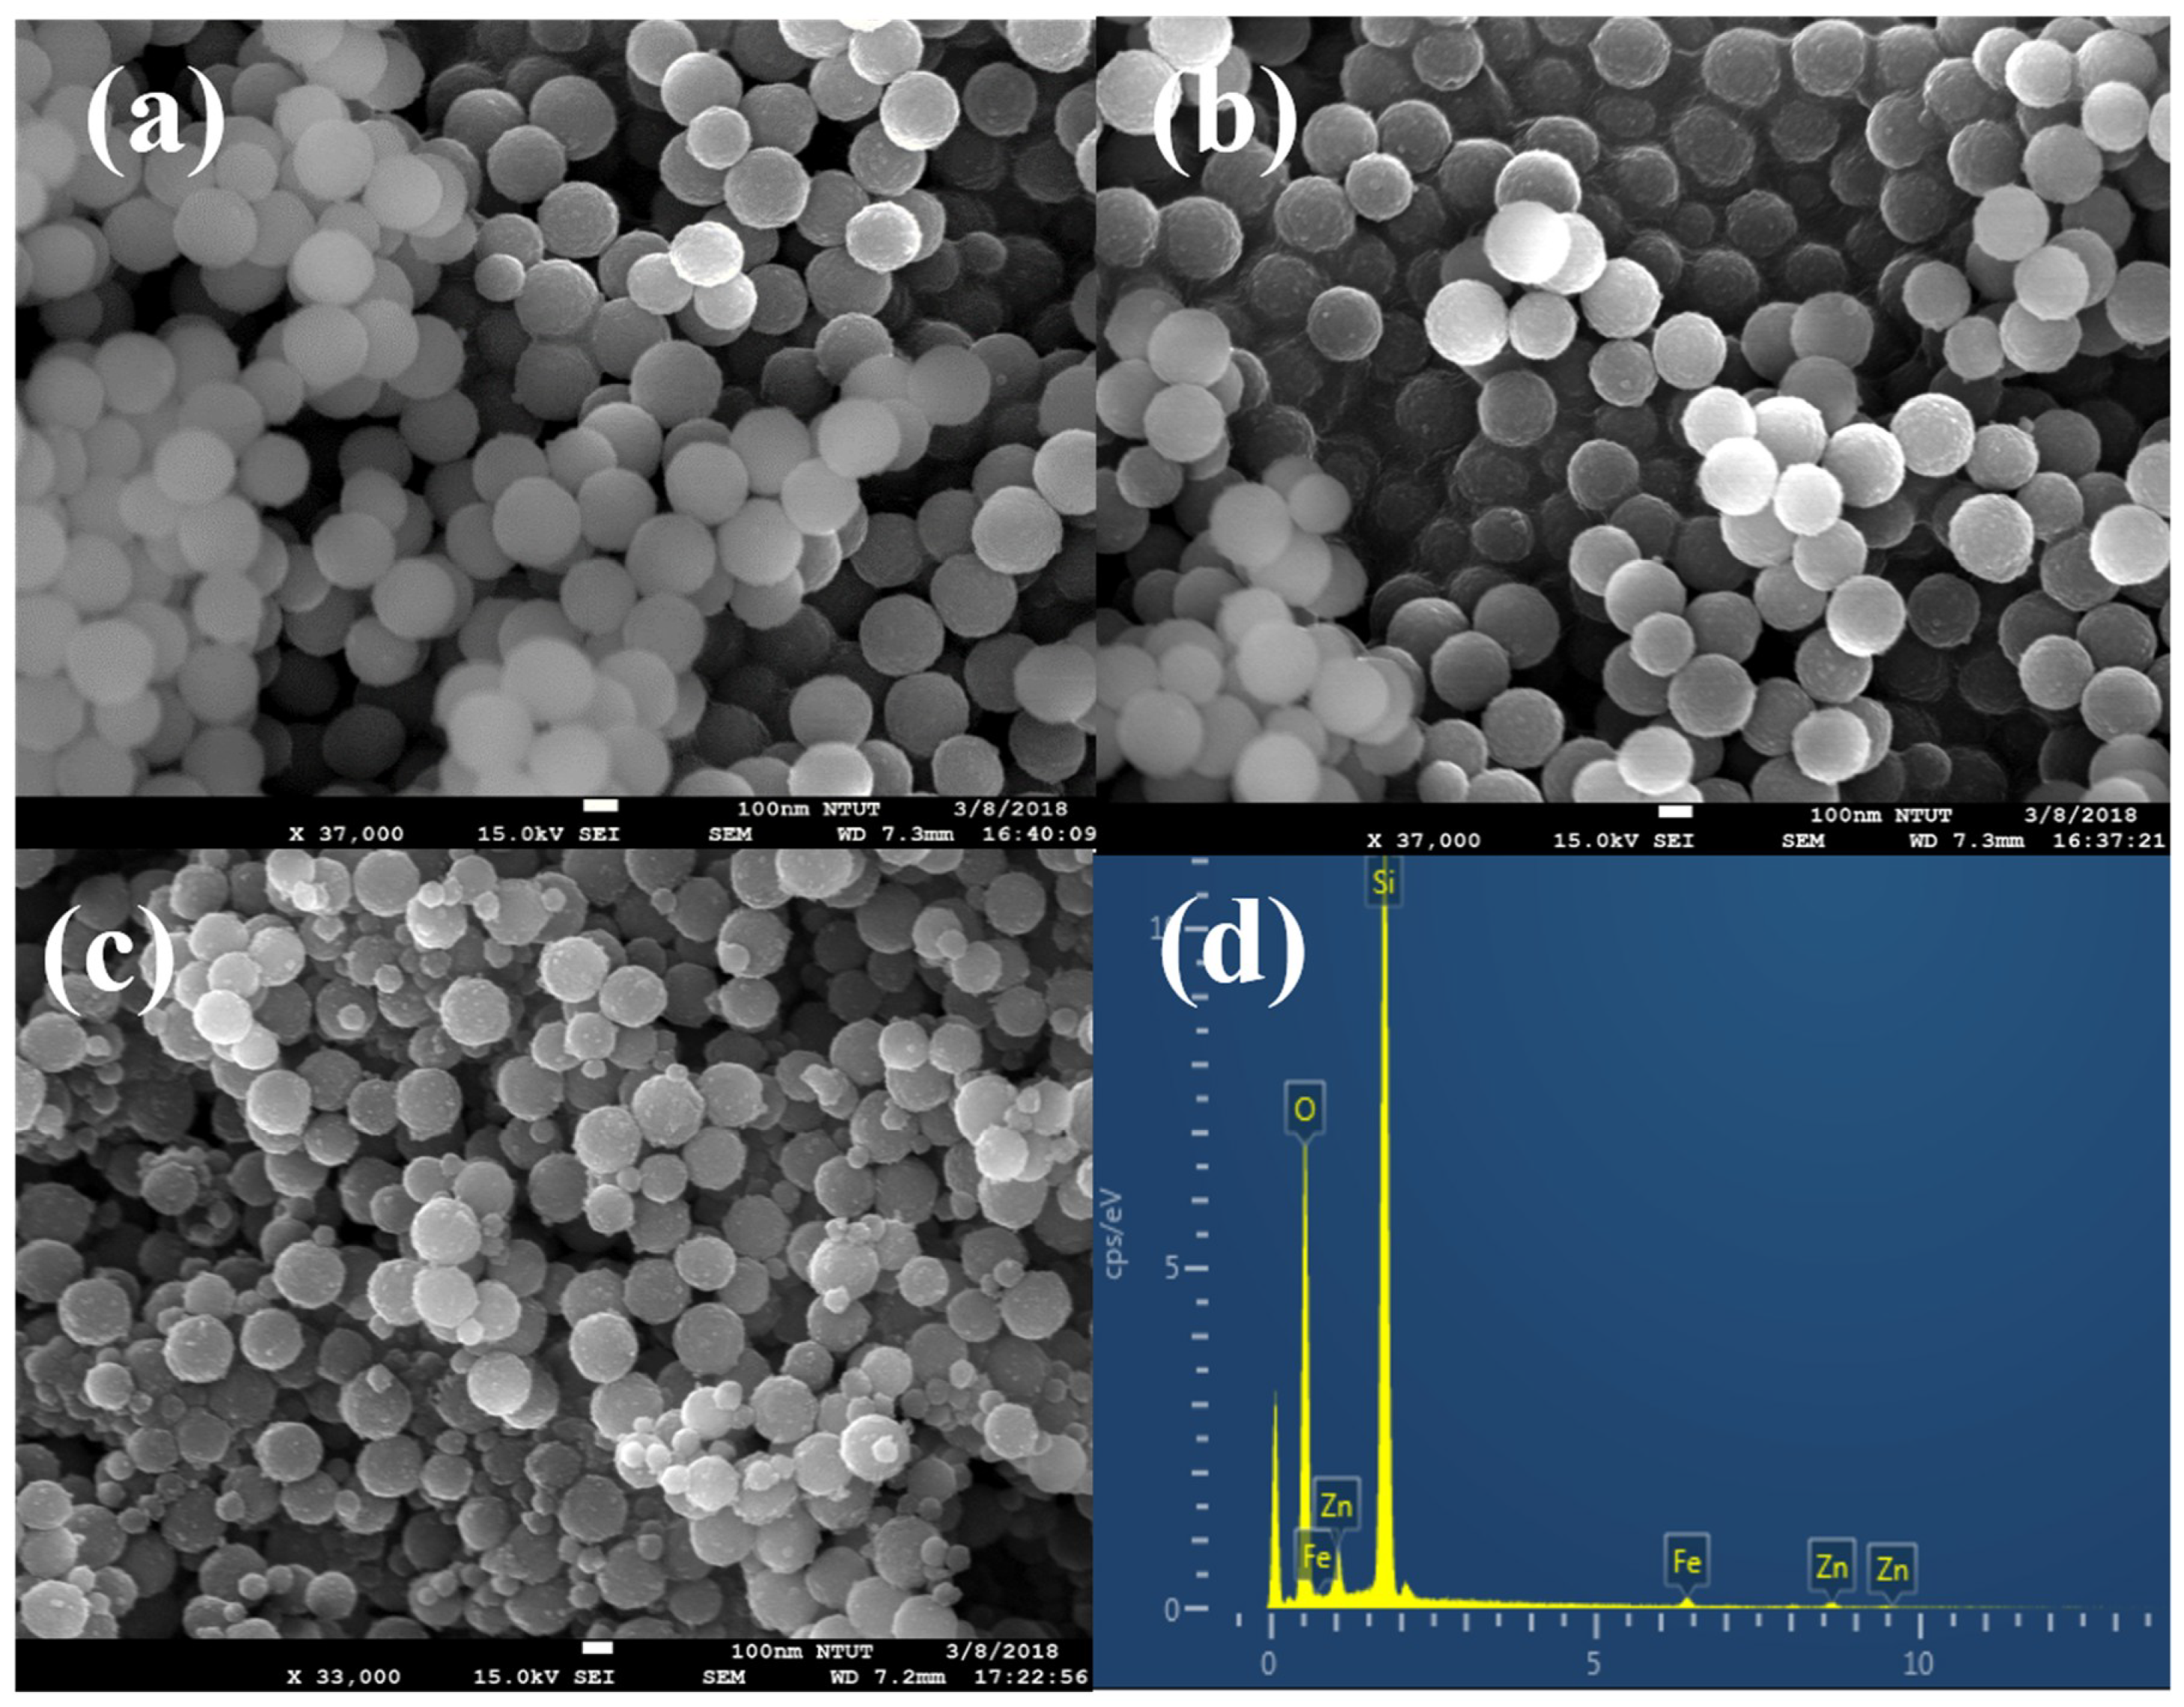
Figure 2a–c show Field emission scanning electron microscopy (FESEM) images of the SiO2@α-Fe2O3, SiO2@ZnO, and SiO2@α-Fe2O3/ZnO nanocomposites. The SiO2 nanospheres are uniform in size with smooth surfaces, as shown in Figure 2a. After the addition of α-Fe2O3 on the SiO2, the surface becomes rough but still maintains the nanosphere structure even after annealing at 450 °C. The uniform size distribution of the 40 nm ZnO nanoparticles observed on α-Fe2O3 after the deposition of ZnO nanoparticles is shown in Figure 2c. It should be noted that the addition of two metal oxides onto SiO2 does not change the shape of the nanospheres. This proves that the SiO2 contains active sites for adsorbing any nanoparticle, leading to the improvement of the surface area of the semiconductor nanoparticles. The atomic percentage of elements present in the nanocomposites, as observed by energy dispersive X-ray spectroscopy (EDX), are shown in Figure 2d.
2.3. Fourier Transform Infrared Spectroscopy (FTIR) Analysis
Figure 3 shows the FTIR analysis of the SiO2@α-Fe2O3, SiO2@ZnO, and SiO2@α-Fe2O3/ZnO nanocomposites. The peak at 1091 cm−1 shows the vibration structure of the Si–O–Si, which is observed in all of the spectra [20]. Moreover, there is a sharp peak observed at 1800 cm−1 shown in figure, revealing the stretching frequency of the Fe–O, and all of the metal oxides exhibit an OH group at 3500 cm−1 [21].
2.4. Optical Measurement
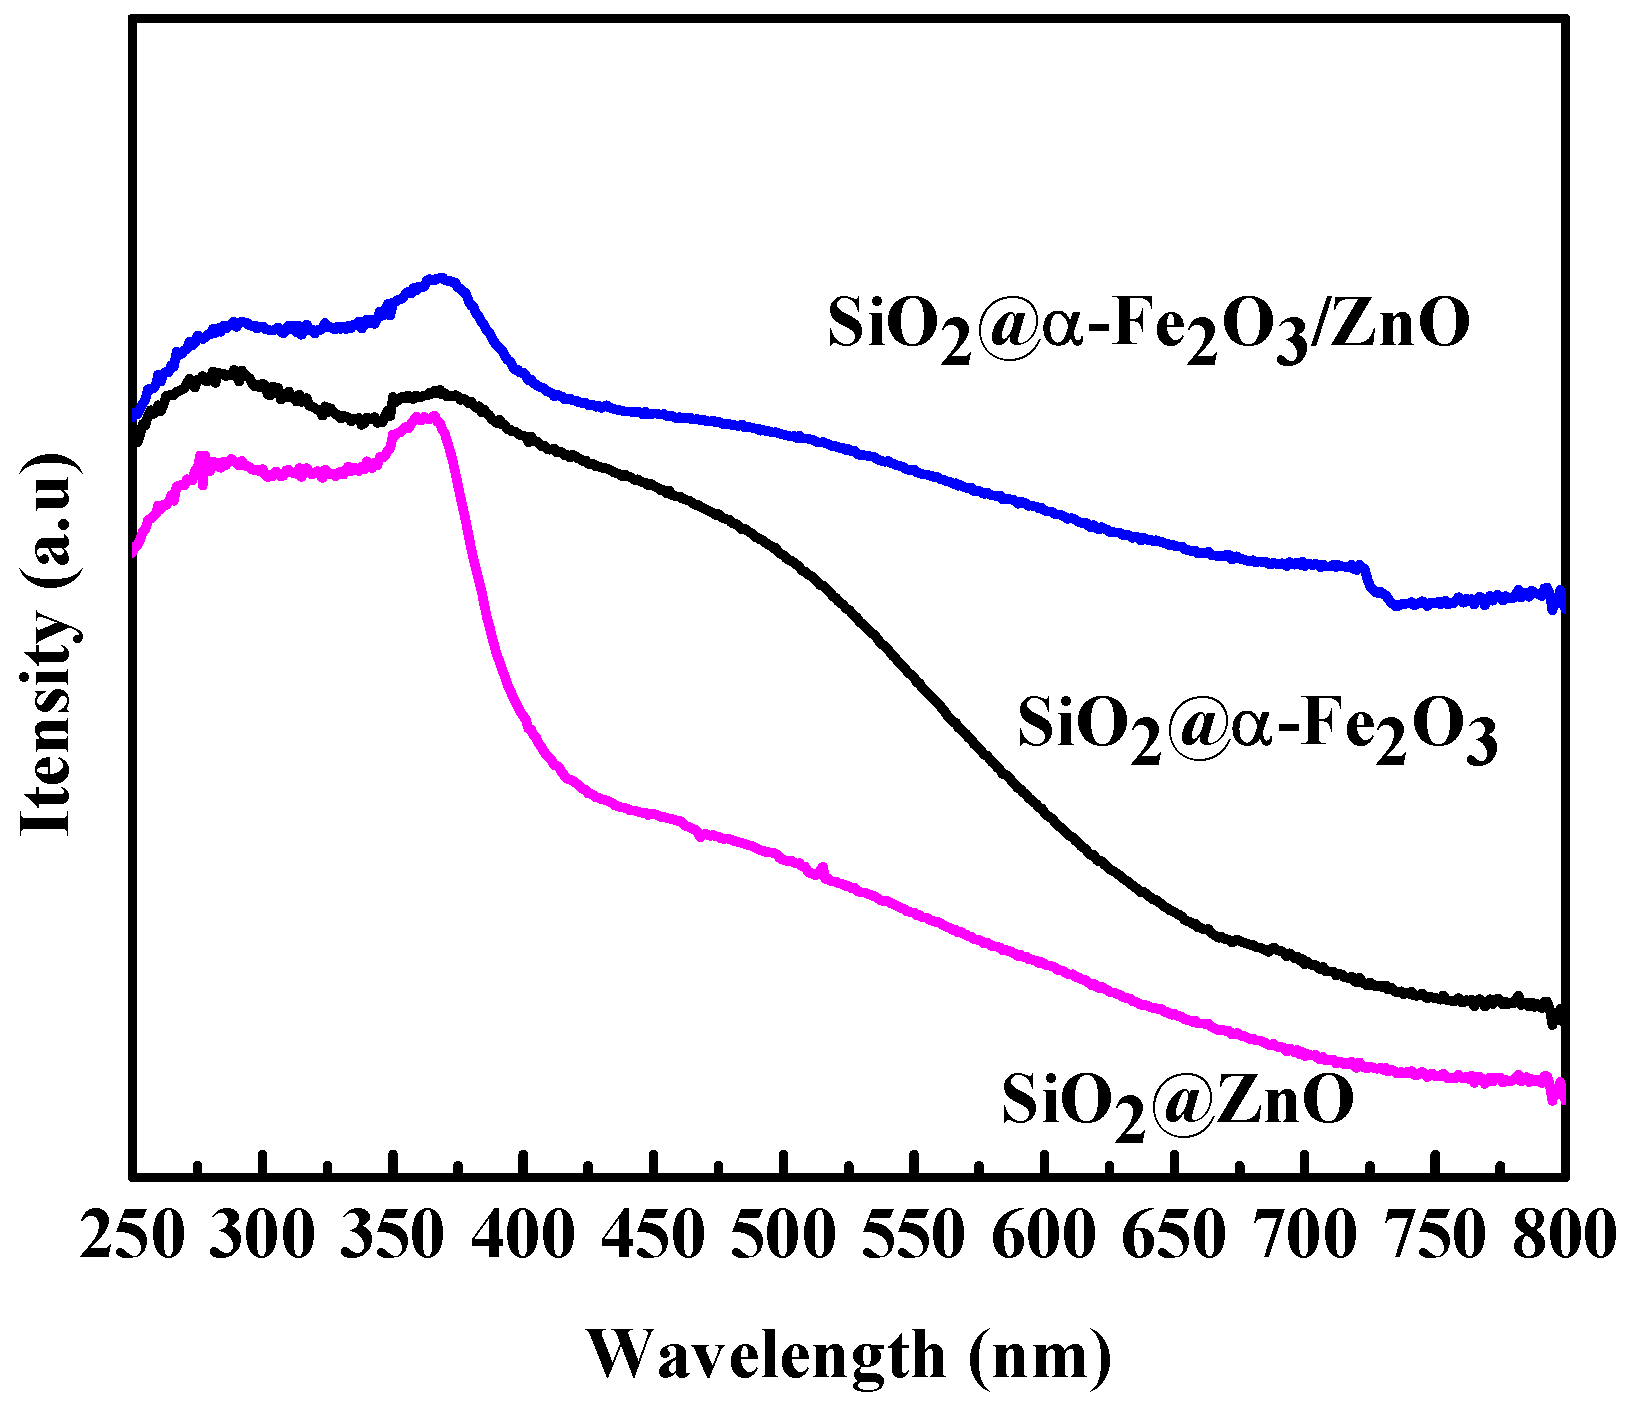
Figure 4 shows the UV–visible spectra of the SiO2@ZnO, SiO2@α-Fe2O3, and SiO2@α-Fe2O3/ZnO nanocomposites. From Figure 4, we can observe that the position of the absorption band of all of the nanocomposites in the visible region is between 400 and 900 nm. For the SiO2@ZnO nanocomposites, the absorption band observed at 340 nm confirms the formation of ZnO nanoparticles on the SiO2 nanospheres [22]. For the SiO2@α-Fe2O3 nanocomposites, the absorption band appears at 320 and 540 nm for the α-Fe2O3 on SiO2 nanospheres. After the deposition of ZnO metal oxide on the SiO2@α-Fe2O3 nanocomposites, there is a broad absorption that extends to the visible region as compared to the SiO2@ZnO and SiO2@α-Fe2O3 nanocomposites.
2.5. Photoluminescence (PL) Measurements
Figure 5 shows the PL spectra of the SiO2@ZnO, SiO2@α-Fe2O3, and SiO2@α-Fe2O3/ZnO nanocomposites. The PL signal is used to demonstrate the charge separation which results from the recombination of photoinduced carriers [23]. The intensities observed for the SiO2@α-Fe2O3/ZnO nanocomposites are weak and thus indicative of better photocatalytic performance. Further higher intensity leads to a high electron-hole recombination which reduces the catalytic activity.
2.6. Brunauer-Emmett-Teller (BET)-N2 Adsorption-Desorption Analysis
A BET N2 adsorption-desorption analysis was carried out to measure the specific surface area and porosity of as-synthesized materials. The BET surface areas of the as-prepared SiO2, SiO2@α-Fe2O3, SiO2@ZnO, and SiO2@α-Fe2O3/ZnO nanocomposites are 8, 21, 33 and 41 m2/g, respectively, as shown in Table 1. The pore volume of SiO2@α-Fe2O3/ZnO nanocomposites is 0.51 cm2/g, which indicates the presence of a mesoporous structure. In this respect it could be helpful to enhance the catalytic activity. The surface areas of SiO2@α-Fe2O3 and SiO2@α-Fe2O3/ZnO nanocomposites spheres are higher than that of SiO2 spheres. Finally, the addition of ZnO nanoparticles onto the SiO2@α-Fe2O3 increased the size, surface area, and pore volume of the SiO2@α-Fe2O3/ZnO nanocomposites, which suggests a possible advantage that could lead to increased photocatalytic activity.
3. Photocatalytic Activity
Figure 6a shows the photodegradation of MB dye which occurred with the SiO2@α-Fe2O3/ZnO nanocomposites under visible light. The UV–vis spectrum of the MB dye showed two absorption peaks at 620 nm and 664 nm. The peak intensities of 620 and 664 nm decreased with an increasing irradiation time, indicating the degradation of MB dye. The percentage of MB dye remaining in the reaction medium using SiO2@ZnO, SiO2@Fe2O3 and SiO2@α-Fe2O3/ZnO nanocomposites without H2O2 is shown in Figure 6b. The degradation percentage of the MB dye obtained using SiO2@ZnO nanocomposites was 62% within 40 min without H2O2. When the H2O2 was added to the dye solution, the degradation percentage increased to 91%. Similar results were observed for the SiO2@α-Fe2O3 nanocomposites with and without H2O2, giving a degradation efficiency towards MB dye of 42% and 82%, respectively, within 40 min. For the SiO2@α-Fe2O3/ZnO mixed metal oxide catalyst, 100% degradation was achieved within 25 min with H2O2, whereas 96% degradation was observed at 40 min without H2O2.
Figure 7b shows the photo-Fenton and photocatalytic degradation reactions of the MB following the pseudo-first-order kinetics, termed as ln(C/Co) = k′t, where k′ is the rate constant. The rate constant increased with the addition of H2O2, mainly due to the photo-Fenton activity. Based on these results, the SiO2@α-Fe2O3/ZnO + H2O2 catalyst exhibits the highest rate constant (k′ = 1.69 × 10⁻¹ min−1), which is 2.2 times higher than that of SiO2@α-Fe2O3/ZnO (k′ = 7.38 × 10⁻² min−1) as well as 7.8 and 2.9 times greater than those of SiO2@ZnO (k′ = 2.16 × 10⁻² min−1) and SiO2@ZnO + H2O2 (k′ = 5.67 × 10⁻² min−1), respectively. When compared to SiO2@α-Fe2O3 (k′ = 1.328 × 10⁻² min−1) and SiO2@α-Fe2O3 + H2O2 (k′ = 4.18 × 10⁻² min−1), the k′ values are 12.7 and 4 times less than that of the SiO2@α-Fe2O3/ZnO + H2O2 catalyst. Figure 7b shows the plot of ln(C/Co) vs. time. Table 2 shows the statistical analysis of pseudo-first-order kinetics with respect to the rate constant (k′) and correlation coefficient (R2). For the photocatalytic degradation reaction, the R2 values of SiO2@ZnO, SiO2@α-Fe2O3, and SiO2@α-Fe2O3/ZnO are almost equal to 1 (i.e., 0.9843, 0.9939 and 0.9948, respectively). Similarly, the photo-Fenton degradation exhibits R2 values of 0.9932, 0.9727 and 0.9797, respectively. Both reactions show an almost linear decrease in the concentration, which confirms the photocatalysis on the pseudo-first-order kinetics mechanism.
The photocatalytic reaction under visible light means that the semiconductor can be utilized to adsorb organic pollutants. Here, we can see that the active SiO2 surface for the deposition of α-Fe2O3 and ZnO metal oxides helped with the transport of photogenerated e− and h+ [24]. The mixed semiconductor nanoparticles have a larger surface area and greater light absorption harvesting which transports the dye molecules, thus enhancing the dye degradation. Furthermore, the conduction band (CB) of α-Fe2O3 is slightly negative while the valance band (VB) is more positive than that of ZnO. The transfer of holes from ZnO to α-Fe2O3 must be higher when compared with the individual metal oxides. This may be due to the efficient production of the charge carriers based on the strong interaction between the α-Fe2O3 and ZnO heterostructures, which reduces the photogenerated charge recombination rate, thus improving the photocatalytic activity [25]. In order to increase the holes in α-Fe2O3 and ZnO, H2O2 is used as an oxidizing agent to produce OH radicals. It reacts with water molecules in the dye solution and OH-groups present on the surface.
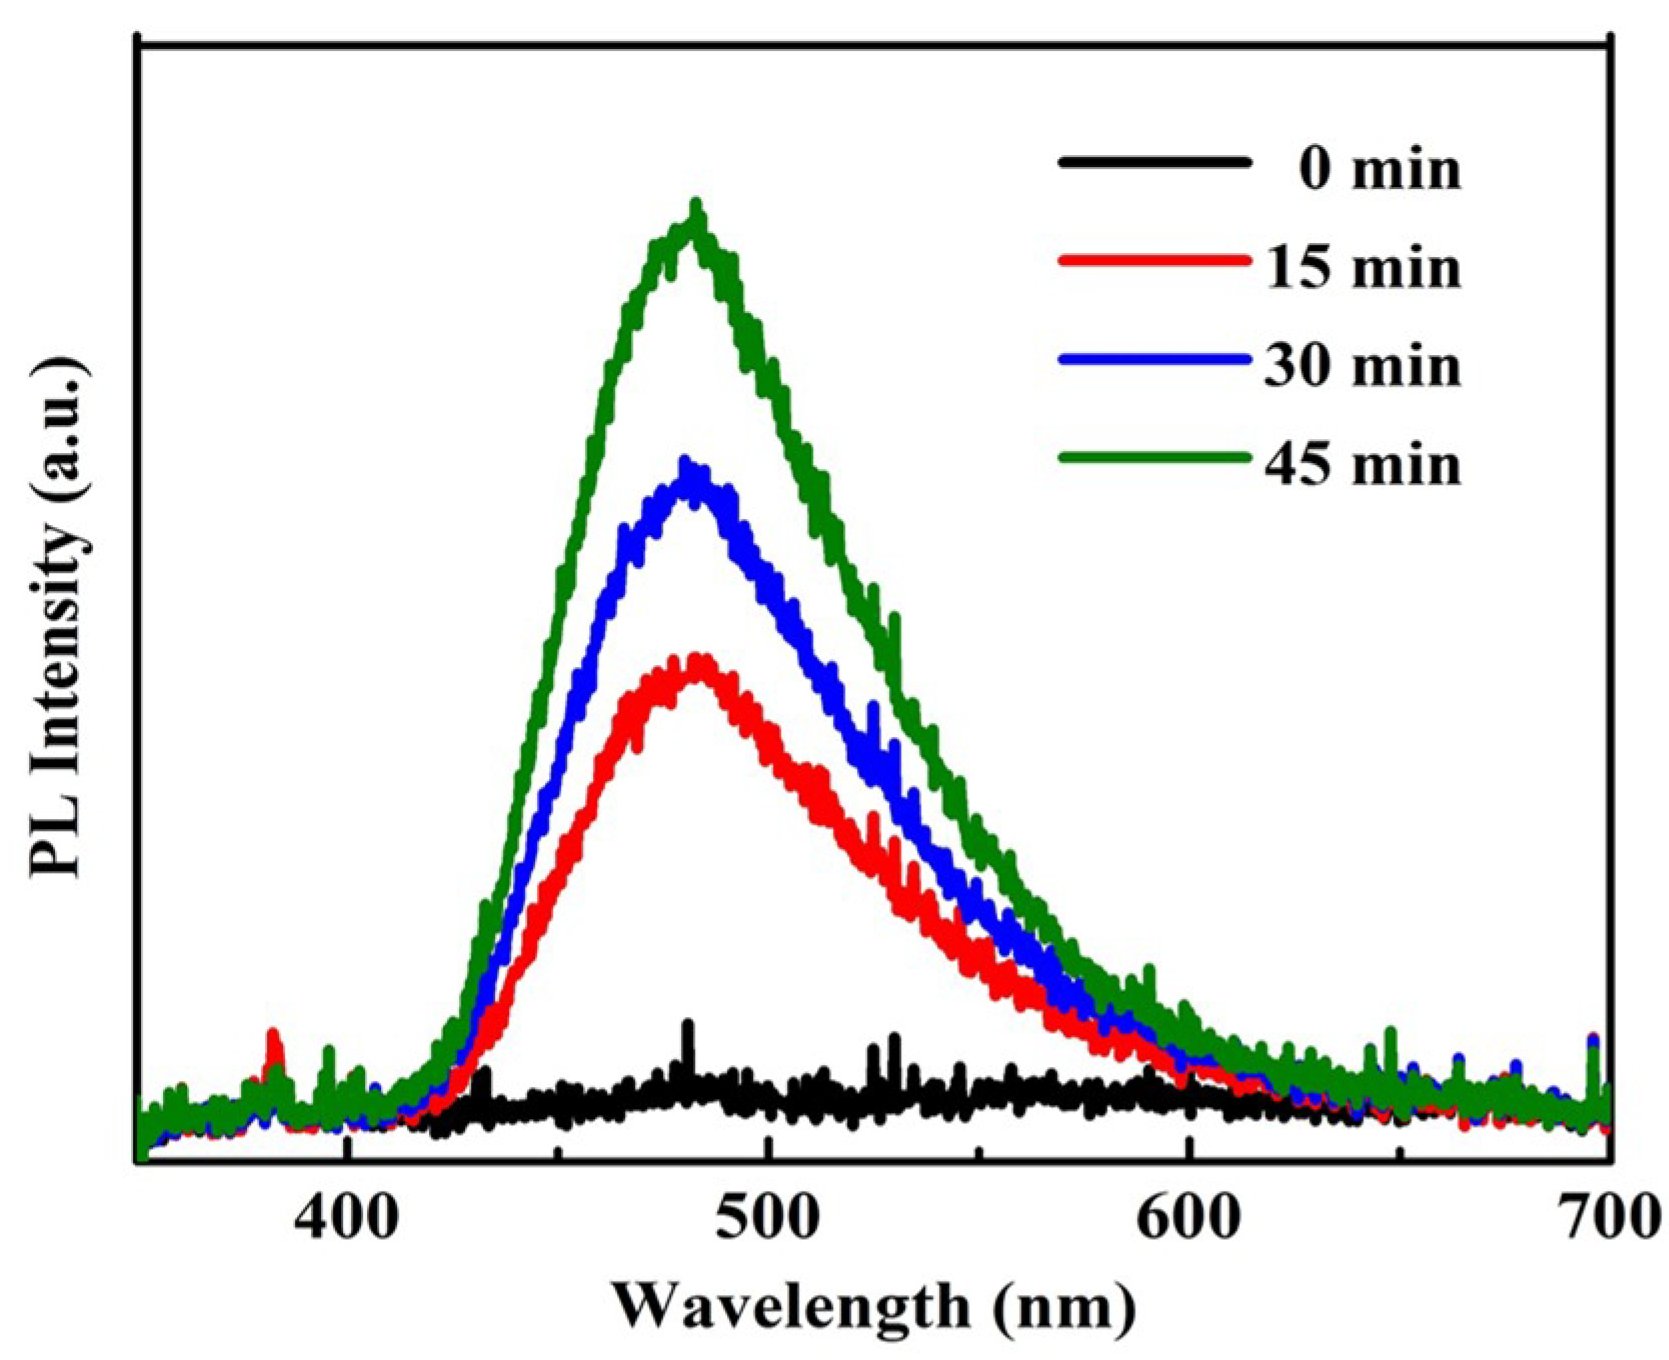
Figure 8 shows the PL spectra for the photodegradation of MB dye using SiO2@α-Fe2O3/ZnO nanocomposites in the presence of terephthalic acid at different time intervals under visible light irradiation. The PL intensity increases when increasing the reaction time due to the OH scavenger of terephthalic acid, which does not react with other radicals. These results confirm that the OH radicals were formed during the photo-Fenton reaction, leading to the MB dye degradation.
The various reports on dye degradation match well with our study, and their results are compared as shown in Table 3. From Table 3, we can observe the low degradation time of 40 min for SiO2@α-Fe2O3/ZnO nanocomposites, as compared with previous reports [26,27,28,29,30,31,32,33,34,35,36]. Adding H2O2 to SiO2@α-Fe2O3/ZnO nanocomposites produces more electron-hole pairs, which leads to the faster degradation of MB dye, within 25 min. This shows a low degradation time when compared with other reports, as shown in the table below.
4. Experimental Procedure
For the preparation of the nanocomposites, SiO2 nanospheres were first prepared as per our previous work [10]. The SiO2 spheres were synthesized from a mixture of tetraethyl orthosilicate (TEOS), anhydrous ethanol, and water, which was stirred at room temperature for 15 min. After this, an ammonia and anhydrous ethanol solution were added to the mixture and it was stirred for 8 h. The resulting product of SiO2 spheres was kept in a vacuum oven at 60 °C for 6 h. Further, for the synthesis of the mixed metal oxides, iron (III) nitrate monohydrate and zinc acetate precursors were used. The SiO2 spheres were uniformly dispersed in 40 mL water by ultrasonication, followed by the addition of iron(III) chloride hexahydrate and urea with effective stirring at 90 °C for 10 h. The prepared FeOOH-coated SiO2 spheres were washed with water and ethanol. Subsequently, FeOOH-coated SiO2 spheres were dispersed in water followed by adding zinc acetate dihydrate and NaOH with effective stirring at 100 °C for 6 h. SiO2@α-Fe2O3/ZnO nanocomposites were separated by centrifugation and washed with ethanol and water. The above cleaning procedure was repeated three times and the resultant product was then annealed at 450 °C for 2 h to produce a crystalline substance. For the purpose of comparison, both SiO2@α-Fe2O3 and SiO2@ZnO samples were prepared using the above procedure.
Photocatalytic Reaction
The photocatalytic degradation reaction of MB dye was carried out using metal oxide nanocomposites in the presence of visible light irradiation using a 350 W Mercury-Xenon lamp, (Prosper Optoelectronics, Taiwan) for which the intensity of light at 380–780 nm was 0.33 mW·cm−2. In order to attain an adsorption-desorption equilibrium between the catalyst surface and dye molecules, the mixed metal oxide nanocomposite catalysts (50 mg) were mixed with 5 ppm of 100 mL MB dye solution. Initially, the dye was stirred for 10 min in the dark. Following this, we introduced the visible light. The same procedure as that mentioned above was followed to carry out photo-Fenton experiments. Additionally, 0.1 mL of H2O2 was added as an initial step. Every 10 min, 5 mL of the solution was taken and measured with a UV–vis spectrum to confirm the degradation.
5. Characterization
The XRD spectra were recorded using an X-ray diffractometer (XRD, PAN analytical X’ Pert PRO, Almelo, The Netherlands). FESEM images were obtained using a JEOL (JSM-7610F, Tokyo, Japan) microscope at an operating voltage of 15 kV. The sample was coated with platinum for effective imaging before being charged. UV–vis DRS were recorded using a UV–vis spectrophotometer (Carry 5000, Santa Clara, CA, USA). The prepared nanocomposites of the chemical structure were studied using a PerkinElmer FTIR spectrometer. The surface area of the samples was measured via N2 adsorption-desorption isotherms at 77 K (BET, Micromeritics ASAP 2020, Norcross, GA, USA). PL studies were observed using a PL spectrometer (Dongwoo-Ramboss 500i, Gyeonggi-Do, Korea).
6. Conclusions
In summary, we successfully prepared SiO2@α-Fe2O3/ZnO nanocomposites using a cost-effective sol-gel method. The improved performance of dye degradation through the addition of metal oxides is attributed to the fast carrier charge that reduced the electron-hole pair recombination. From the results, it is proven that SiO2@α-Fe2O3/ZnO nanocomposites were able to degrade the MB dye within 25 min after adding a reducing agent. Furthermore, ZnO exhibits strong interactions between the bridging oxygen on the surface of α-Fe2O3 and allows the photo-oxidation decomposition of pollutants. In order to enhance the photo-Fenton activity, H2O2 was added to the dye solution, which helped to increase the number of ∙OH groups. When H2O2 is added to the dye solution, the SiO2@α-Fe2O3/ZnO catalyst can increase the visible light stability and yield a faster separation of photogenerated electrons and holes. These behaviors are favorable for the faster degradation of MB dye using SiO2@α-Fe2O3/ZnO catalyst.
Author Contributions
K.U. and T.C.-K.Y. conceived and designed the experiments; S.B. performed XRD, PL, and FTIR experiments; results were discussed with the assistance of G.-T.P.; and K.U. wrote the paper with the assistance of S.B.
Funding
This research received no external funding.
Acknowledgments
The authors are grateful to the Precision Analysis and Materials Research Center, National Taipei University of Technology, Taipei, for their financial support.
Conflicts of Interest
The authors declare no conflict of interest.
References
- Crespo, C.T. CunbO3 as a solar energy converter to fuel and electricity. Sol. Energy Mater. Sol. Cells 2018, 179, 305–311. [Google Scholar] [CrossRef]
- Qing, W.; Chen, K.; Wang, Y.; Liu, X.; Lu, M. Green synthesis of silver nanoparticles by waste tea extract and degradation of organic dye in the absence and presence of H2O2. Appl. Surf. Sci. 2017, 423, 1019–1024. [Google Scholar] [CrossRef]
- Xie, J.; Zhou, Z.; Lian, Y.; Hao, Y.; Li, P.; Wei, Y. Synthesis of α-Fe2O3/ZnO composites for photocatalytic degradation of pentachlorophenol under UV–vis light irradiation. Ceram. Int. 2015, 41, 2622–2625. [Google Scholar] [CrossRef]
- Zhou, Y.; Li, J.; Liu, C.; Huo, P.; Wang, H. Construction of 3D porous g-C3N4/AgBr/rGO composite for excellent visible light photocatalytic activity. Appl. Surf. Sci. 2018, 458, 586–596. [Google Scholar] [CrossRef]
- Zhou, K.; Hu, X.Y.; Chen, B.Y.; Hsueh, C.C.; Zhang, Q.; Wang, J.; Lin, Y.J.; Chang, C.T. Synthesized TiO2/ZSM-5 composites used for the photocatalytic degradation of azo dye: Intermediates, reaction pathway, mechanism and bio-toxicity. Appl. Surf. Sci. 2016, 383, 300–309. [Google Scholar] [CrossRef]
- Mahadik, M.A.; An, G.W.; David, S.; Choi, S.H.; Cho, M.; Jang, J.S. Fabrication of A/R-TiO2 composite for enhanced photoelectrochemical performance: Solar hydrogen generation and dye degradation. Appl. Surf. Sci. 2017, 426, 833–843. [Google Scholar] [CrossRef]
- Wachs, I.E.; Routray, K. Catalysis science of bulk mixed oxides. ACS Catal. 2012, 2, 1235–1246. [Google Scholar] [CrossRef]
- Geng, Z.G.; Kong, X.D.; Chen, W.W.; Su, H.Y.; Liu, Y.; Cai, F.; Wang, G.X.; Zeng, J. Oxygen Vacancies in ZnO Nanosheets Enhance CO2 Electrochemical Reduction to CO. Angew. Chem. Int. Ed. 2018, 57, 6054–6059. [Google Scholar] [CrossRef] [PubMed]
- Boudjemaa, A.; Trari, M. Photo-catalytic hydrogen production over Fe2O3 based catalysts. Int. J. Hydrogen Energy 2010, 35, 7684–7689. [Google Scholar] [CrossRef]
- Uma, K.; Chen, S.W.; Arjun, N.; Pan, G.T.; Yang, T.C.K. The production of an efficient visible light photocatalyst for CO oxidation through the surface plasmonic effect of Ag nanoparticles on SiO2@α-Fe2O3 nanocomposites. RSC Adv. 2018, 8, 12547–12555. [Google Scholar] [CrossRef]
- Lv, R.; Wang, T.; Su, F.; Zhang, P.; Li, C.; Gong, J. Facile synthesis of zno nanopencil arrays for photoelectrochemical water splitting. Nano Energy 2014, 7, 143–150. [Google Scholar] [CrossRef]
- Tao, Q.; Chen, M.; He, H.; Komarneni, S. Hydrothermal transformation of mixed metal oxides and silicate anions to phyllosilicate under highly alkaline conditions. Appl. Clay Sci. 2018, 156, 224–230. [Google Scholar] [CrossRef]
- Voznyi, A.; Kosyak, V.; Opanasyuk, A.; Tirkusova, N.; Grase, L.; Medvids, A.; Mezinskis, G. Structural and electrical properties of SnS2 thin films. Mater. Chem. Phys. 2016, 173, 52–61. [Google Scholar] [CrossRef]
- Yan, K.L.; Shang, X.; Li, Z.; Dong, B.; Li, X.; Gao, W.K.; Chi, J.Q.; Chai, Y.M.; Liu, C.G. Ternary mixed metal Fe-doped NiCo2O4 nanowires as efficient electrocatalysts for oxygen evolution reaction. Appl. Surf. Sci. 2017, 416, 371–378. [Google Scholar] [CrossRef]
- Al-Owais, A.A. Synthesis and magnetic properties of hexagonally packed zno nanorods. Arab. J. Chem. 2013, 6, 229–234. [Google Scholar] [CrossRef]
- Millar, A.; Rahman, M.M.; Jiang, Z.T. Review of sol–gel derived mixed metal oxide thin film coatings with the addition of carbon materials for selective surface applications. J. Adv. Phys. 2014, 3, 179–193. [Google Scholar] [CrossRef]
- Perdomo, C.; Pérez, A.; Molina, R.; Moreno, S. Storage capacity and oxygen mobility in mixed oxides from transition metals promoted by cerium. Appl. Surf. Sci. 2016, 383, 42–48. [Google Scholar] [CrossRef]
- Balu, S.; Uma, K.; Pan, G.T.; Yang, T.; Ramaraj, S. Degradation of methylene blue dye in the presence of visible light using SiO2@α-Fe2O3 nanocomposites deposited on SnS2 flowers. Materials 2018, 11, 1030. [Google Scholar] [CrossRef] [PubMed]
- Bindu, P.; Thomas, S. Estimation of lattice strain in ZnO nanoparticles: X-ray peak profile analysis. J. Theor. Appl. Phys. 2014, 8, 123–134. [Google Scholar] [CrossRef] [Green Version]
- Uma, K.; Arjun, N.; Pan, G.T.; Yang, T.C.K. The photodeposition of surface plasmon Ag metal on SiO2@α-Fe2O3 nanocomposites sphere for enhancement of the photo-fenton behavior. Appl. Surf. Sci. 2017, 425, 377–383. [Google Scholar] [CrossRef]
- Xu, W.; Wang, H.; Liu, R.; Zhao, X.; Qu, J. The mechanism of antimony(III) removal and its reactions on the surfaces of Fe–Mn binary oxide. J. Colloid Interface Sci. 2011, 363, 320–326. [Google Scholar] [CrossRef] [PubMed]
- Segets, D.; Gradl, J.; Taylor, R.K.; Vassilev, V.; Peukert, W. Analysis of optical absorbance spectra for the determination of ZnO nanoparticle size distribution, solubility, and surface energy. ACS Nano 2009, 3, 1703–1710. [Google Scholar] [CrossRef] [PubMed]
- Feng, Y.; Zhou, Y.; Liu, Y.; Zhang, G.; Zhang, X. Photoluminescence spectra of nano-structured ZnO thin films. J. Lumin. 2006, 119–120, 233–236. [Google Scholar] [CrossRef]
- Quintana, M.; Edvinsson, T.; Hagfeldt, A.; Boschloo, G. Comparison of dye-sensitized ZnO and TiO2 solar cells: Studies of charge transport and carrier lifetime. J. Phys. Chem. C 2007, 111, 1035–1041. [Google Scholar] [CrossRef]
- Xie, J.; Zhang, L.; Li, M.; Hao, Y.; Lian, Y.; Li, Z.; Wei, Y. A-Fe2O3 modified ZnO flower-like microstructures with enhanced photocatalytic performance for pentachlorophenol degradation. Ceram. Int. 2015, 41, 9420–9425. [Google Scholar] [CrossRef]
- Saravanan, R.; Shankar, H.; Prakash, T.; Narayanan, V.; Stephen, A. ZnO/CdO composite nanorods for photocatalytic degradation of methylene blue under visible light. Mater. Chem. Phys. 2011, 125, 277–280. [Google Scholar] [CrossRef]
- Liu, Y.; Yu, H.; Lv, Z.; Zhan, S.; Yang, J.; Peng, X.; Ren, Y.; Wu, X. Simulated-sunlight-activated photocatalysis of methylene blue using cerium-doped SiO2/TiO2 nanostructured fibers. J. Environ. Sci. 2012, 24, 1867–1875. [Google Scholar] [CrossRef]
- Senapati, K.K.; Borgohain, C.; Sarma, K.C.; Phukan, P. Photocatalytic degradation of methylene blue in water using CoFe2O4–Cr2O3–SiO2 fluorescent magnetic nanocomposite. J. Mol. Catal. A Chem. 2011, 346, 111–116. [Google Scholar] [CrossRef]
- Jang, Y.J.; Simer, C.; Ohm, T. Comparison of zinc oxide nanoparticles and its nano-crystalline particles on the photocatalytic degradation of methylene blue. Mater. Res. Bull. 2006, 41, 67–77. [Google Scholar] [CrossRef]
- Qin, Y.; Zhang, H.; Tong, Z.; Song, Z.; Chen, N. A facile synthesis of Fe3O4@SiO2@ZnO with superior photocatalytic performance of 4-nitrophenol. J. Environ. Chem. Eng. 2017, 5, 2207–2213. [Google Scholar] [CrossRef]
- Wu, W.; Zhang, S.; Xiao, X.; Zhou, J.; Ren, F.; Sun, L.; Jiang, C. Controllable synthesis, magnetic properties, and enhanced photocatalytic activity of spindlelike mesoporous α-Fe2O3/ZnO core–shell heterostructures. ACS Appl. Mater. Interfaces 2012, 4, 3602–3609. [Google Scholar] [CrossRef] [PubMed]
- Kumar, S.V.; Huang, N.; Yusoff, N.; Lim, H. High performance magnetically separable graphene/zinc oxide nanocomposite. Mater. Lett. 2013, 93, 411–414. [Google Scholar] [CrossRef]
- Muthukrishnaraj, A.; Vadivel, S.; Kamalakannan, V.; Balasubramanian, N. α-Fe2O3/reduced graphene oxide nanorod as efficient photocatalyst for methylene blue degradation. Mater. Res. Innov. 2015, 19, 258–264. [Google Scholar] [CrossRef]
- Yan, Y.; Guan, H.; Liu, S.; Jiang, R. Ag3PO4/Fe2O3 composite photocatalysts with an n–n heterojunction semiconductor structure under visible-light irradiation. Ceram. Int. 2014, 40, 9095–9100. [Google Scholar] [CrossRef]
- Liu, Y.; Yu, L.; Hu, Y.; Guo, C.; Zhang, F.; Lou, X.W.D. A magnetically separable photocatalyst based on nest-like γ-Fe2O3/ZnO double-shelled hollow structures with enhanced photocatalytic activity. Nanoscale 2012, 4, 183–187. [Google Scholar] [CrossRef] [PubMed]
- Mohamed, R.; Mkhalid, I.; Baeissa, E.; Al-Rayyani, M. Photocatalytic degradation of methylene blue by Fe/ZnO/SiO2 nanoparticles under visiblelight. J. Nanotechnol. 2012, 2012. [Google Scholar] [CrossRef]
Figure 1.
X-ray diffraction (XRD) pattern of SiO2@ZnO, SiO2@α-Fe2O3 and SiO2@α-Fe2O3/ZnO nanocomposites.
Figure 1.
X-ray diffraction (XRD) pattern of SiO2@ZnO, SiO2@α-Fe2O3 and SiO2@α-Fe2O3/ZnO nanocomposites.

Figure 2.
FESEM images of (a) SiO2@ZnO, (b) SiO2@α-Fe2O3 and (c) SiO2@α-Fe2O3/ZnO nanocomposites. (d) Energy dispersive X-ray spectroscopy (EDX) analysis of SiO2@α-Fe2O3/ZnO nanocomposites.
Figure 2.
FESEM images of (a) SiO2@ZnO, (b) SiO2@α-Fe2O3 and (c) SiO2@α-Fe2O3/ZnO nanocomposites. (d) Energy dispersive X-ray spectroscopy (EDX) analysis of SiO2@α-Fe2O3/ZnO nanocomposites.

Figure 3.
FTIR spectra of SiO2@ZnO, SiO2@α-Fe2O3 and SiO2@α-Fe2O3/ZnO nanocomposites.

Figure 4.
UV–vis spectra of SiO2@ZnO, SiO2@α-Fe2O3 and SiO2@α-Fe2O3/ZnO nanocomposites.

Figure 5.
Photoluminescence (PL) spectra of SiO2@ZnO, SiO2@α-Fe2O3 and SiO2@α-Fe2O3/ZnO.

Figure 6.
(a) Degradation of Methylene Blue MB dye (5 ppm) in the presence of SiO2@α-Fe2O3/ZnO nanocomposites under visible light irradiation. (b) The plot shows the percentage of MB remaining vs. time.
Figure 6.
(a) Degradation of Methylene Blue MB dye (5 ppm) in the presence of SiO2@α-Fe2O3/ZnO nanocomposites under visible light irradiation. (b) The plot shows the percentage of MB remaining vs. time.

Figure 7.
(a) Photo-Fenton degradation of MB using different nanocomposites with and without H2O2: letter a—SiO2@ZnO, letter b—SiO2@ZnO + H2O2, letter c—SiO2@α-Fe2O3, letter d—SiO2@α-Fe2O3 + H2O2, letter e—SiO2@α-Fe2O3/ZnO, letter f—SiO2@α-Fe2O3/ZnO + H2O2. (b) The plot of ln(C/Co) vs. time.
Figure 7.
(a) Photo-Fenton degradation of MB using different nanocomposites with and without H2O2: letter a—SiO2@ZnO, letter b—SiO2@ZnO + H2O2, letter c—SiO2@α-Fe2O3, letter d—SiO2@α-Fe2O3 + H2O2, letter e—SiO2@α-Fe2O3/ZnO, letter f—SiO2@α-Fe2O3/ZnO + H2O2. (b) The plot of ln(C/Co) vs. time.

Figure 8.
PL spectra for photodegradation of MB dye using SiO2@α-Fe2O3/ZnO nanocomposites in the presence of terephthalic acid at different time intervals under visible light irradiation.
Figure 8.
PL spectra for photodegradation of MB dye using SiO2@α-Fe2O3/ZnO nanocomposites in the presence of terephthalic acid at different time intervals under visible light irradiation.


Table 1.
BET surface area of as-prepared SiO2, SiO2@α-Fe2O3, SiO2@ZnO and SiO2@α-Fe2O3/ZnO nanocomposites.
Table 1.
BET surface area of as-prepared SiO2, SiO2@α-Fe2O3, SiO2@ZnO and SiO2@α-Fe2O3/ZnO nanocomposites.
| Samples | BET Surface Area | Pore Volume |
|---|---|---|
| SiO2 | 8 m2/g | 0.032 cm2/g |
| SiO2@α-Fe2O3 | 21 m2/g | 0.041 cm2/g |
| SiO2@ZnO | 33 m2/g | 0.045 cm2/g |
| SiO2@α-Fe2O3/ZnO | 41 m2/g | 0.051 cm2/g |
Table 2.
Statistical analysis of pseudo-first-order kinetics for photocatalytic and photo-Fenton degradation reactions towards MB.
Table 2.
Statistical analysis of pseudo-first-order kinetics for photocatalytic and photo-Fenton degradation reactions towards MB.
| Samples | r0 | k′ (min−1) | R2 | T (min) | % Deg |
|---|---|---|---|---|---|
| SiO2@ZnO | 0.0067 | 0.0216 | 0.9843 | 40 | 62 |
| SiO2@ZnO + H2O2 | 0.0177 | 0.0567 | 0.9932 | 40 | 91 |
| SiO2@α-Fe2O3 | 0.0041 | 0.0132 | 0.9939 | 40 | 42 |
| SiO2@α-Fe2O3 + H2O2 | 0.0130 | 0.0418 | 0.9727 | 40 | 82 |
| SiO2@α-Fe2O3/ZnO | 0.0230 | 0.0738 | 0.9948 | 40 | 96 |
| SiO2@α-Fe2O3/ZnO + H2O2 | 0.0527 | 0.1691 | 0.9797 | 25 | 100 |
r0—initial MB dye degradation rate (r0 = k′ × Co), k′—rate constant, R2—correlation coefficient for pseudo-first order, T—degradation time, % Deg—percentage of degradation efficiency.
Table 3.
Comparison of our work with the reported work.
| Catalyst | Dye | Catalyst Loading | Time (min) | Reference |
|---|---|---|---|---|
| ZnO/CdO | MB | *R.a.—500 mL | 360 | [26] |
| Ce-doped SiO2/TiO2 | MB | 100 mg—1000 mL | 120 | [27] |
| CoFe2O4–Cr2O3–SiO2 | MB | 20 mg—50 mL | 120 | [28] |
| ZnO | MB | 1500 mg—650 mL | 120 | [29] |
| Fe3O4@SiO2@ZnO | 4NP | 400 mg—30 mL | 120 | [30] |
| α-Fe2O3/ZnO | RhB | 20 mg—40 mL | 105 | [31] |
| G-Fe2O3/ZnO | MB | 10 mg—50 mL | 90 | [32] |
| (RGO)/α-Fe2O3 | MB | 100 mg—100 mL | 90 | [33] |
| Ag3PO4/Fe2O3 | MO | 200 mg—25 mL | 60 | [34] |
| γ-Fe2O3/ZnO | MB | 50 mg—100 mL | 50 | [35] |
| Fe/ZnO/SiO2 | MB | 75 mg—300 mL | 30 | [36] |
| SiO2@α-Fe2O3/ZnO | MB | 50 mg—100 mL | 40 | This work |
| SiO2@α-Fe2O3/ZnO+H2O2 | MB | 50 mg—100 mL | 25 | This work |
MB—Methylene Blue, 4NP—4 Nitro Phenol, RhB—Rhodamine B, MO—Methylene Orange, *R.a.—required amount.
© 2018 by the authors. Licensee MDPI, Basel, Switzerland. This article is an open access article distributed under the terms and conditions of the Creative Commons Attribution (CC BY) license (http://creativecommons.org/licenses/by/4.0/).
Share and Cite
MDPI and ACS Style
Uma, K.; Balu, S.; Pan, G.-T.; Yang, T.C.-K. Assembly of ZnO Nanoparticles on SiO2@α-Fe2O3 Nanocomposites for an Efficient Photo-Fenton Reaction. Inorganics 2018, 6, 90. https://doi.org/10.3390/inorganics6030090
AMA Style
Uma K, Balu S, Pan G-T, Yang TC-K. Assembly of ZnO Nanoparticles on SiO2@α-Fe2O3 Nanocomposites for an Efficient Photo-Fenton Reaction. Inorganics. 2018; 6(3):90. https://doi.org/10.3390/inorganics6030090
Chicago/Turabian StyleUma, Kasimayan, Sridharan Balu, Guan-Ting Pan, and Thomas C.-K. Yang. 2018. "Assembly of ZnO Nanoparticles on SiO2@α-Fe2O3 Nanocomposites for an Efficient Photo-Fenton Reaction" Inorganics 6, no. 3: 90. https://doi.org/10.3390/inorganics6030090
Note that from the first issue of 2016, this journal uses article numbers instead of page numbers. See further details here.