
Recognition of Biological Tissue Denaturation Based on Improved Multiscale Permutation Entropy and GK Fuzzy Clustering


1
College of Mathematics and Physics, Hunan University of Arts and Science, Changde 415000, China
2
School of Geosciences and Info-Physics, Central South University, Changsha 410083, China
*
Author to whom correspondence should be addressed.
Information 2022, 13(3), 140; https://doi.org/10.3390/info13030140
Submission received: 17 January 2022
/
Revised: 28 February 2022
/
Accepted: 4 March 2022
/
Published: 7 March 2022
(This article belongs to the Special Issue Biomedical Signal Processing and Data Analytics in Healthcare Systems)
Abstract
:Recognition of biological tissue denaturation is a vital work in high-intensity focused ultrasound (HIFU) therapy. Multiscale permutation entropy (MPE) is a nonlinear signal processing method for feature extraction, widely applied to the recognition of biological tissue denaturation. However, the typical MPE cannot derive a stable entropy due to intensity information loss during the coarse-graining process. For this problem, an improved multiscale permutation entropy (IMPE) is proposed in this work. IMPE is obtained through refining and reconstructing MPE. Compared with MPE, the IMPE overcomes the deficiency of amplitude information loss due to the coarse-graining process when computing signal complexity. Through the simulation of calculating MPE and IMPE from white Gaussian noise, it is found that the entropy derived by IMPE is more stable than that derived by MPE. The processing method based on IMPE feature extraction is applied to the experimental ultrasonic scattered echo signals in HIFU treatment. Support vector machine and Gustafson–Kessel fuzzy clustering based on MPE and IMPE feature extraction are also used for biological tissue denaturation classification and recognition. The results calculated from the different combination algorithms show that the recognition of biological tissue denaturation based on IMPE-GK clustering is more reliable with the accuracy of 95.5%.
1. Introduction
High-intensity focused ultrasound (HIFU) is a new technique for tumor therapy with safety, high efficiency, and non-invasive [1,2,3,4,5]. Therefore, HIFU hyperthermia is called an innovative “green therapy” for cancer treatment, which has attracted the attention of clinicians, researchers, and medical companies from all over the world.
HIFU hyperthermia concentrates sound energy on the therapeutic target to instantly generate high temperatures (more than 60 °C in the tissue). To ensure the efficacy and safety in HIFU therapy, it is crucial to monitor the temperature and denaturation of treated biological tissues. Noninvasive sensing technique such as magnetic resonance imaging (MRI), computed tomography (CT), and ultrasound are often employed to monitor temperature and denaturation in medical applications [6,7,8,9,10,11,12,13]. However, these methods still have limitations in some specific cases. MRI equipment is expensive, and treatment cost is high. The poor compatibility of MRI equipment requires all the treatment parts to be installed in the narrow space of the MRI chamber, which limits the application and promotion of MRI in HIFU therapy monitoring. The artifact is easily associated with CT imaging on moving tissues, blood vessels, and metals, which affects the accuracy of CT real-time monitoring. Ionizing radiation produced during CT examination is harmful to the human body, especially for critically ill patients (liver, kidney, and heart failure), the elderly, and children. Compared with MRI and CT, ultrasound monitoring of denaturation in HIFU therapy has the advantages of simple operation, high compatibility, and low cost. However, it also has the disadvantages of low sensitivity and low accuracy.
To obtain the characteristic parameters reflecting the temperature and denaturation of tissue in HIFU therapy with ultrasound monitoring, researchers studied the ultrasonic signals from many aspects, such as echo energy, sound attenuation coefficient, frequency offset, and sound velocity [14,15,16,17,18,19]. The attenuation coefficient of the ultrasonic echo is a common parameter used to estimate the temperature of the damaged tissue in treatment. With the rise of temperature in the HIFU treatment area, the attenuation coefficient of the ultrasonic echo will increase significantly. The velocity of ultrasound is also used estimate the denaturation of treatment area. The velocity of ultrasound in denatured tissue is higher than that of non-denatured tissue. However, the measurement of sound velocity by reflection echo is easily affected by the external experimental environment noise, which decreases the measurement accuracy of tissue temperature [20]. In addition, HIFU thermal damage in biological tissues causes the changes of signal complexity. Time-domain and frequency-domain features are easily affected by environmental noise and frequency offset due to heating up in HIFU therapy. These adverse external factors result in that the extracted features cannot correctly represent the tissue denaturation state. Therefore, accurate feature extraction based on a nonlinear model and recognition of biological tissue denaturation is the essential works in applying ultrasound monitoring in HIFU therapy.
Many nonlinear feature algorithms, including Shannon entropy, sample entropy, wavelet entropy, and permutation entropy, are widely applied to extract the features of ultrasonic signal and identify the different states of biological tissue denaturation [21,22,23,24,25,26,27,28,29]. Especially, permutation entropy is a nonlinear analysis algorithm for the time series complexity calculation based on phase space reconstruction. It has the advantages of good robustness and simple algorithm. Multiscale permutation entropy (MPE) is a permutation entropy algorithm calculated at different multiscale. Due to the multiscale feature extraction, it can analyze sequence information more effectively. MPE is widely used in bearing damage diagnosis and other industrial fields [30,31]. In our previous work, MPE and its variants have been applied to recognition of tissue denaturation in HIFU therapy [32,33]. However, MPE also has a defect due to the coarse-graining process, which results in the amplitude information loss in the same permutation pattern. For this defect, Fadlalla et al. proposed an improved method of multiscale weighted permutation entropy (MWPE) [34]. However, Both MPE and MWPE have the defects of stability decay with the increase of scale factor because of the shortening of time series.
Support vector machine (SVM), deep learning, and other clustering approaches are widely used for feature recognition [35,36,37]. Especially, SVM has the advantage of simple structure, fast learning speed, and wide applicability. It has been also applied in ultrasonic based biological tissue denaturation recognition [38]. However, it is a gradual process from the non-denatured state to the denatured state of biological tissue. Thus, the feature extracted from denatured or non-denatured tissue is fuzzy. Fuzzy clustering algorithm is a good way to solve this problem. Gustafson–Kessel (GK) algorithm is a fuzzy extension of distance adaptive dynamic clustering. It obtains the objective function based on the covariance matrix. GK fuzzy clustering is applied to the clustering of irregular distribution data sets with the correlation between parameters [39], which is familiar with ultrasonic scattered echo signals.
Based on the methods mentioned above, an improved multiscale permutation entropy (IMPE) is proposed in this paper. In this method, MPE is refined and reconstructed. IMPE can analyze the coarse-grained time series without the loss of amplitude information, and suppress the fluctuation of entropy. Compared with MPE, IMPE has better stability and reliability. SVM and GK fuzzy clustering are used to identify denatured and non-denatured tissues according to the two features of ultrasonic scattered echo extracted by the MPE and IMPE algorithm, respectively. At the end of the work, the denaturation recognition clustering results based on different feature extraction and clustering algorithms are analyzed.
The main content of this paper is as follows: Section 1 introduces the background of signal process in HIFU therapy monitoring; Section 2 presents the theories of IMPE and GK fuzzy clustering; Section 3 presents the results of simulation and experimental signal analysis by the methods mentioned in Section 2; Section 4 is the conclusion.
2. Theory
2.1. MPE
MPE is a permutation entropy calculated at different multiscale. The MPE calculation process is as follows:
Processing time series to obtain coarse-grained sequence .
Phase space reconstruction of coarse-grained sequence.
where is the reconstruction component, , m is the dimension, and τ is the time delay.
Arranging the reconstruction components in ascending order to obtain a symbolic sequence , where , and ; calculating the probability of each symbolic sequence.
Calculating and normalizing the permutation entropy of each coarse-grained sequence; obtaining the MPE.
2.2. IMPE
The value of MPE becomes unstable with the increase of scale factor because of the amplitude information loss. For this defect, an IMPE algorithm is proposed in this work. The IMPE calculation process is as follows:
can be defined as
where can be expressed as
where . Then the improved permutation entropy can be defined as
where .
For a time series , the coarse-grained time series can be expressed as
where .
Finally, the IMPE is expressed as
2.3. GK Fuzzy Clustering
GK fuzzy clustering is an adaptive dynamic fuzzy clustering algorithm by using a covariance matrix. For a given sample of data , the membership matrix of GK fuzzy clustering and cluster center can be obtained by minimizing the objective function, where c is the cluster number, and vi (I = 1,2,⋯,c) is the cluster center, n is the sample number, indicating the membership degree of the element belonging to the class, which satisfy the following:
The objective function is expressed as
where, θ is the fuzzy index, indicating the fuzzy degree of clustering, the larger the value is, the greater the degree of overlap between clusters is; is the Mahalanobis distance between the sample and the clustering center of the class. is the square inner product norm.
is the positive definite symmetric matrix, which is determined by the clustering covariance matrix . The Lagrange multiplication was introduced for optimizing the objective function, and the necessary conditions for obtaining the minimum value of the Equations (10) and (11) are obtained as follow:
The GK fuzzy clustering algorithm is as follows:
- (1)
- Initializing the number of clustering c, fuzzy index θ, and the membership matrix U to satisfy Formula (12).
- (2)
- Updating the cluster center vi by Formula (13).
- (3)
- Calculating the covariance matrix of the cluster center Fi.
Deriving positive definite symmetric matrix Zi from covariance matrix Fi, then calculating the square inner product norm ; updating the membership matrix according to Formula (11); stopping the calculation if it satisfies , otherwise, increasing iterations until the condition is met. Where, is the membership matrix of L iterations, termination error η > 0.
In this work, the clustering effect of GK fuzzy clustering is evaluated by Xie–Beni index, which is expressed as
where, is the mean variance of classes, and is the shortest fuzzy distance between classes. As for the evaluation of clustering, the XB is smaller with the better clustering effect.
Pattern recognition is carried out based on the degree of closeness according to the principle of near selection. The degree of closeness represents the similarity of the two fuzzy subsets. For the fuzzy subset A of the sample to be identified and the fuzzy subset B of the standard cluster center, the closeness degree is defined according to Euclidean closeness in this work. The calculation of Euclidean closeness degree is as follows:
where, n is the number of samples, and and are the membership function of the sample to fuzzy subset A and B, respectively. According to the principle of proximity, biological tissue denaturation is distinguished by the Euclidean proximity between the samples to be identified and the standard clustering center. The sample is identified as denatured tissue if it has the highest Euclidean proximity to the standard clustering center of denatured tissue, and the sample is identified as non-denatured tissue if the Euclidean similarity between the sample and the standard clustering center of non-denatured tissue is the highest.
3. Results
3.1. Simulation with White Gaussian Noise (WGN)
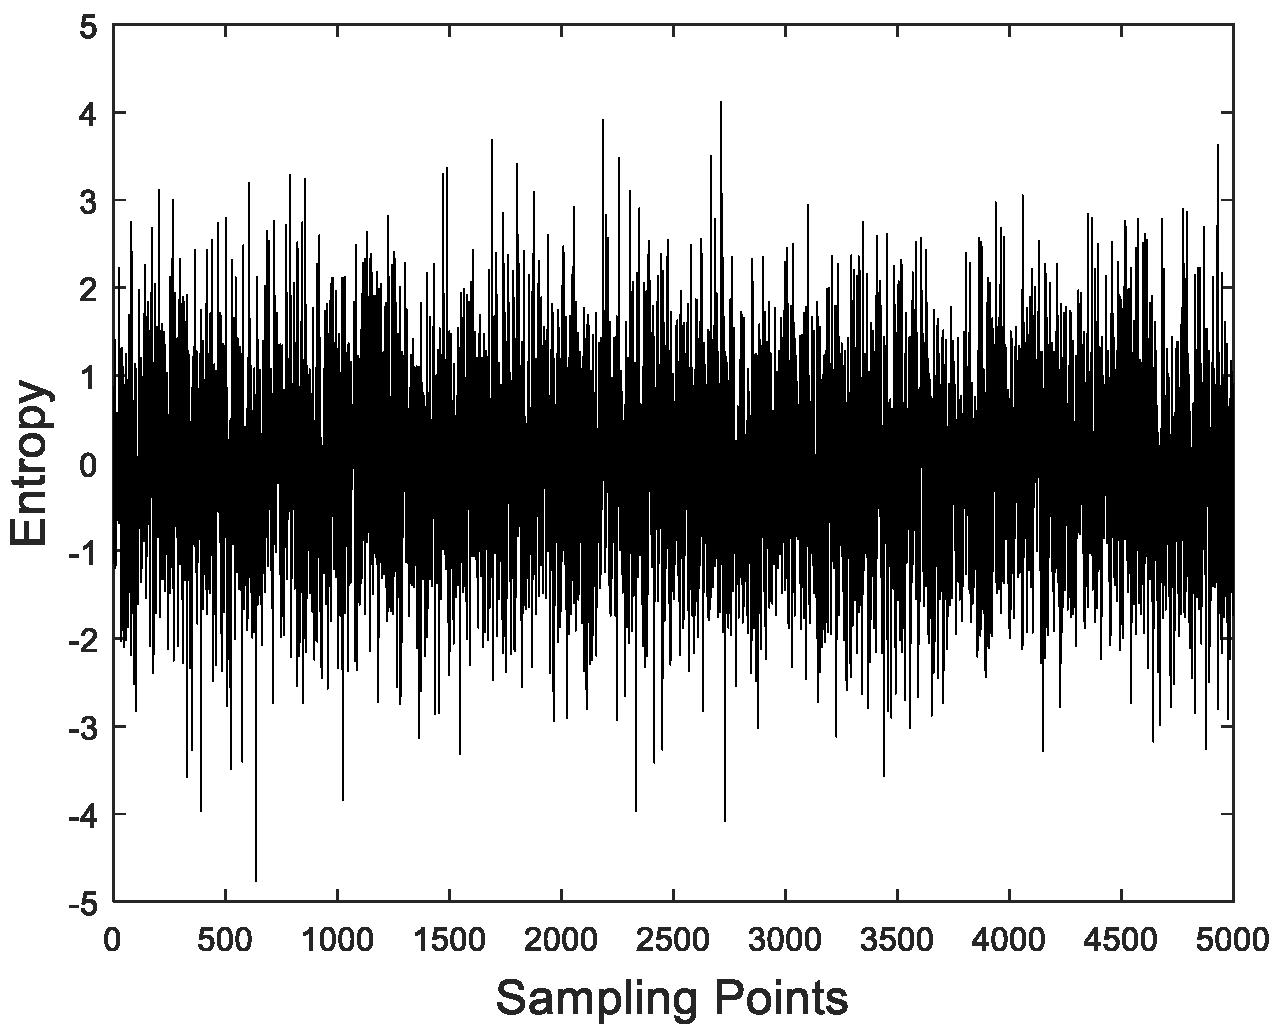
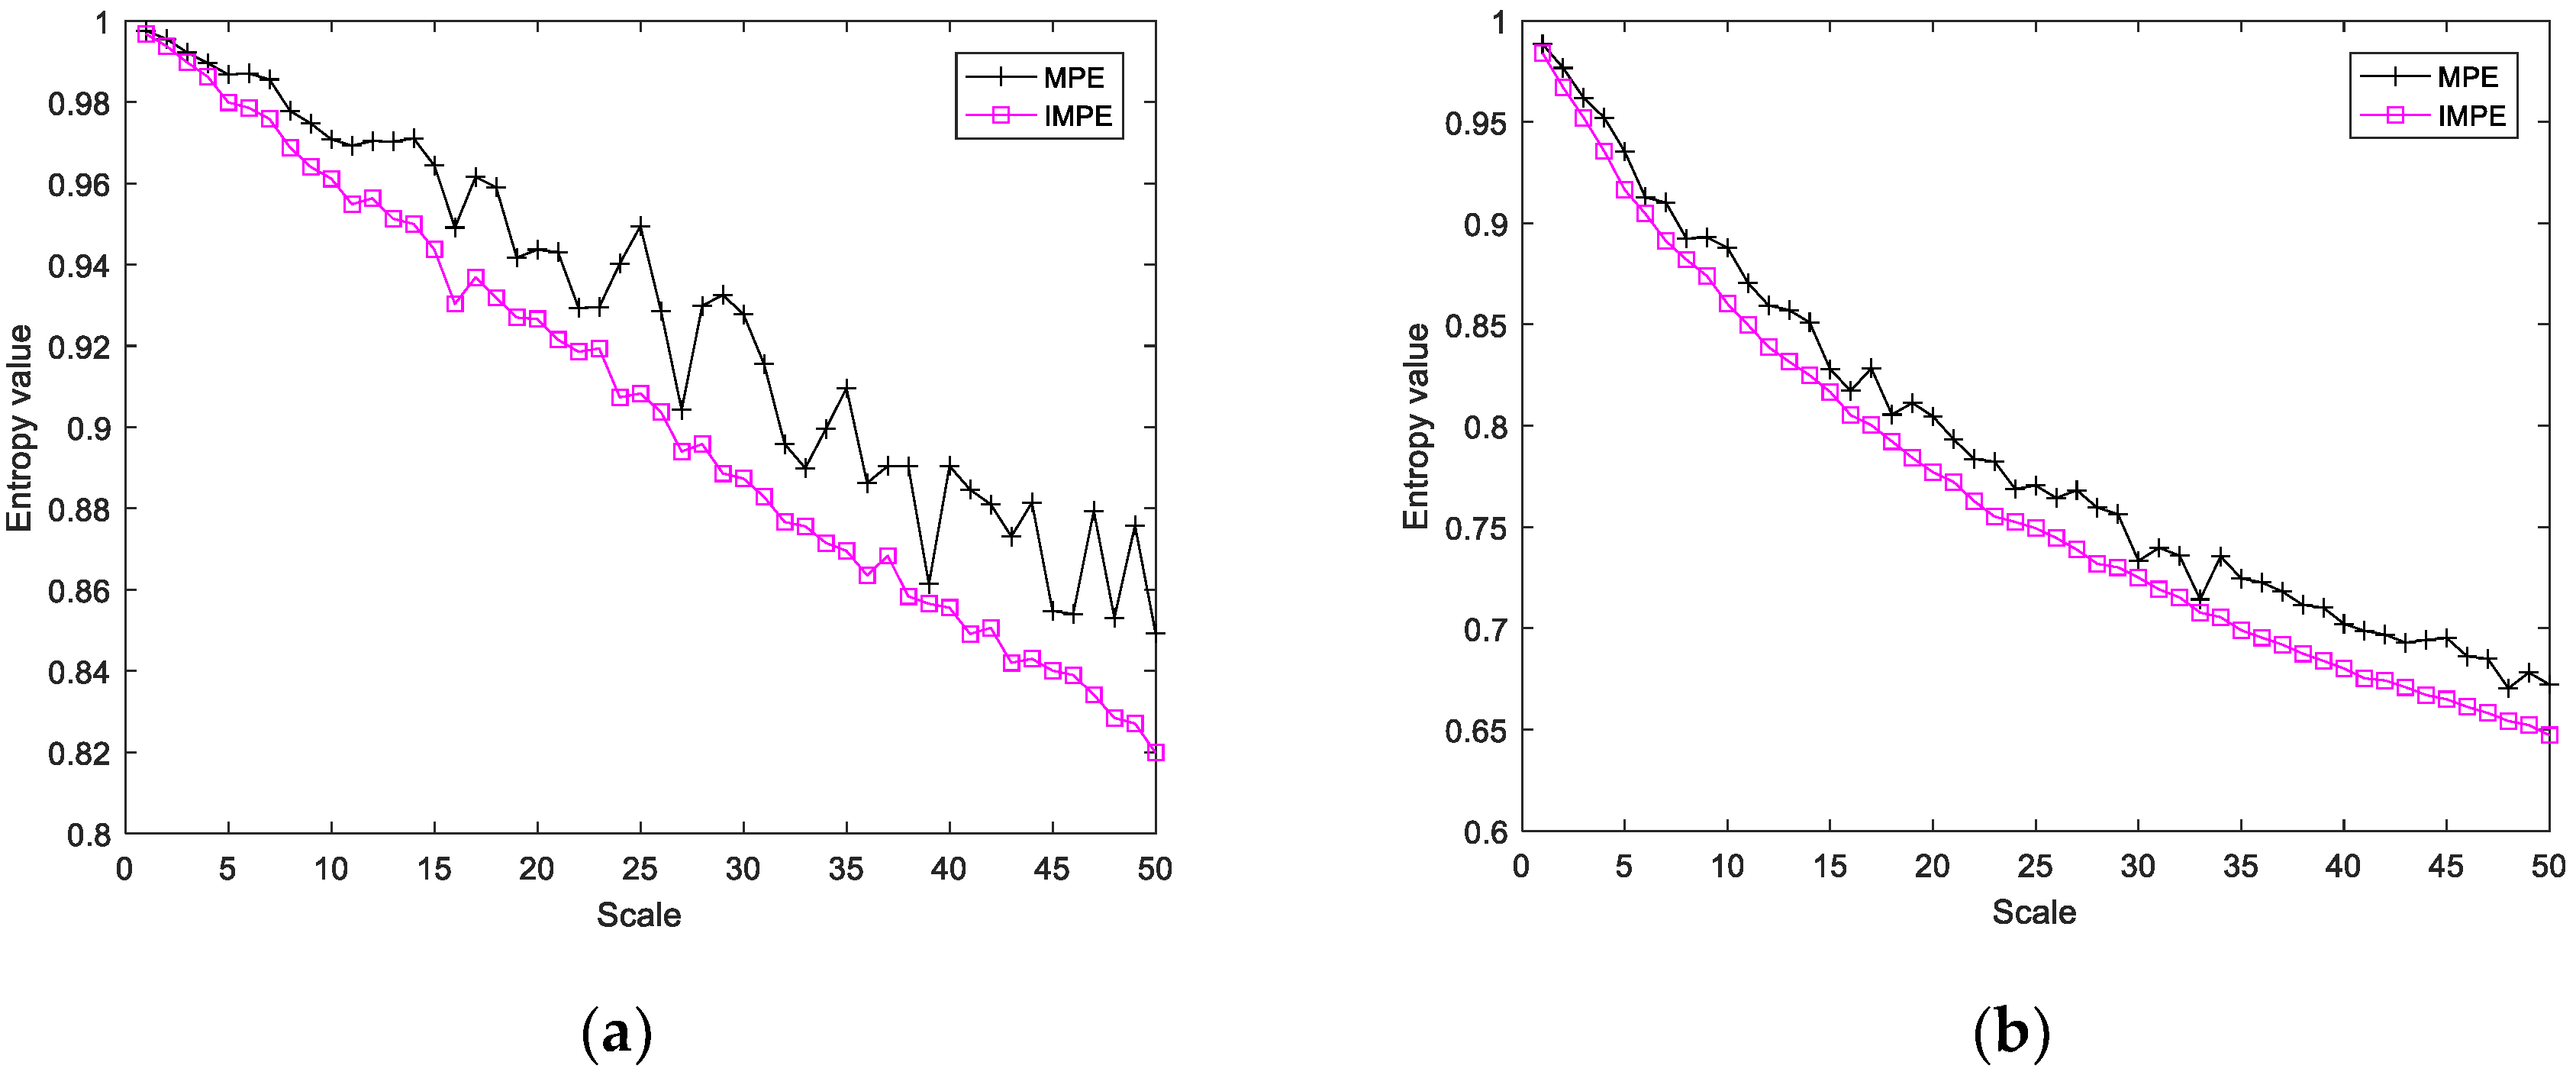
To study the variation of MPE and IMPE under different conditions, the entropy distribution of WGN (5000 sampling points) diverted by MPE and IMPE with different dimensions is analyzed. WGN used in the simulation is shown in Figure 1. According to the previous work [32], the dimension is set as m = 6, 7, and the time delay is set as τ = 2. Figure 2 shows the distribution of MPE and IMPE from WGN with scale factors 1–50. For MPE and IMPE, both entropies have a significant decreasing trend as the scale factor increase. More importantly, the value of IMPE decreases faster and becomes smoother than that of MPE. The results show that IMPE, containing the amplitude information lost in MPE, is more sensitive to the complexity of time series. IMPE can effectively solve the problem of amplitude information loss between the same permutation pattern in MPE. Thanks to the processing of averaging probability and entropy value, IMPE has good stability and reliability, which can suppress the multiscale entropy fluctuation better than MPE.
To further demonstrate the advantages of the IMPE, different WGN with 500, 1000, 3000, and 5000 sampling points were analyzed 100 times. The standard deviation index was used to evaluate the stability of MPE and IMPE. The embedding dimension and time delay were set as 7 and 2. Table 1 shows the standard deviations of MPE and IMPE calculated from WGN signals with the scale factor of 1–50. The standard deviations of IMPE under different data lengths are all lower than that of MPE, which means that IMPE can improve the stability of MPE.
3.2. Analysis of Ultrasonic Scattered Echo Signals
Figure 3 shows the ultrasonic scattered echo monitoring system in this work. Fresh porcine muscle tissue is irradiated by HIFU source with a central frequency of 1.39 Mhz to simulate the HIFU treatment. In the process of HIFU treatment, B-mode ultrasound generator is used to generate B-mode ultrasound signal with a central frequency of 3.5 Mhz for temperature monitoring of irradiated tissues. Fiber optic probe hydrophone is used to collect the ultrasonic scattered echo signal and convert it into digital signal, which is saved to PC through oscilloscope. Thermometer is inserted into the irradiated tissue to monitor temperature synchronously.
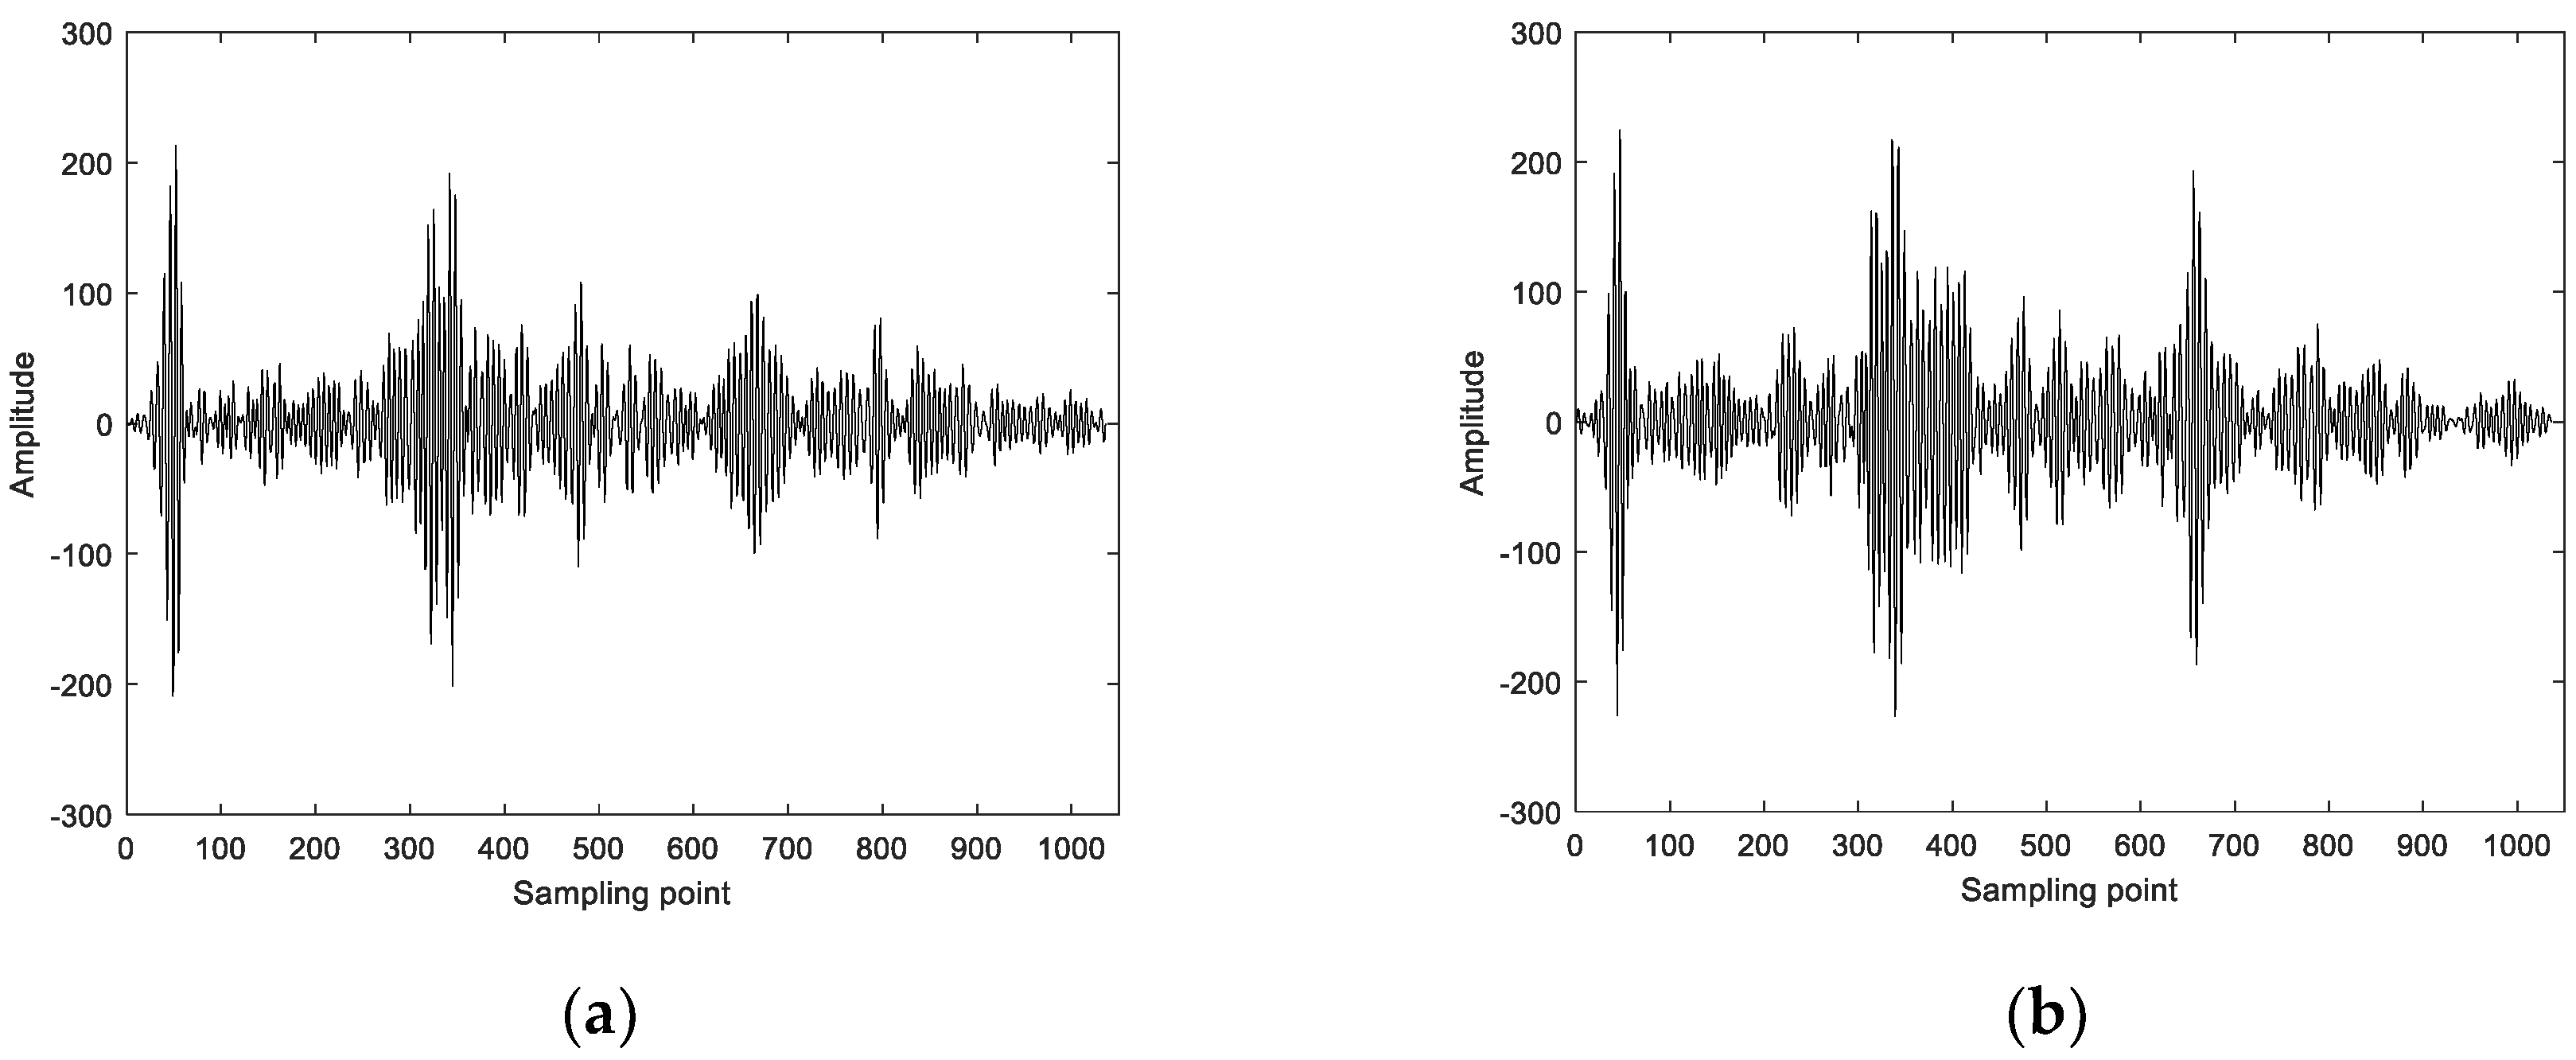
Figure 4 shows the time-domain samples of experimental ultrasonic scattered echo signals, including (a) non-denatured and (b) denatured tissue. Both kinds of signals have the feature of echo attenuation obviously and it is difficult to distinguish the feature in time-domain effectively.
Using SVM and GK fuzzy clustering, the 400 × 2 characteristic parameters were extracted from MPE and IMPE of ultrasonic scattered echo signal for denaturation recognition.
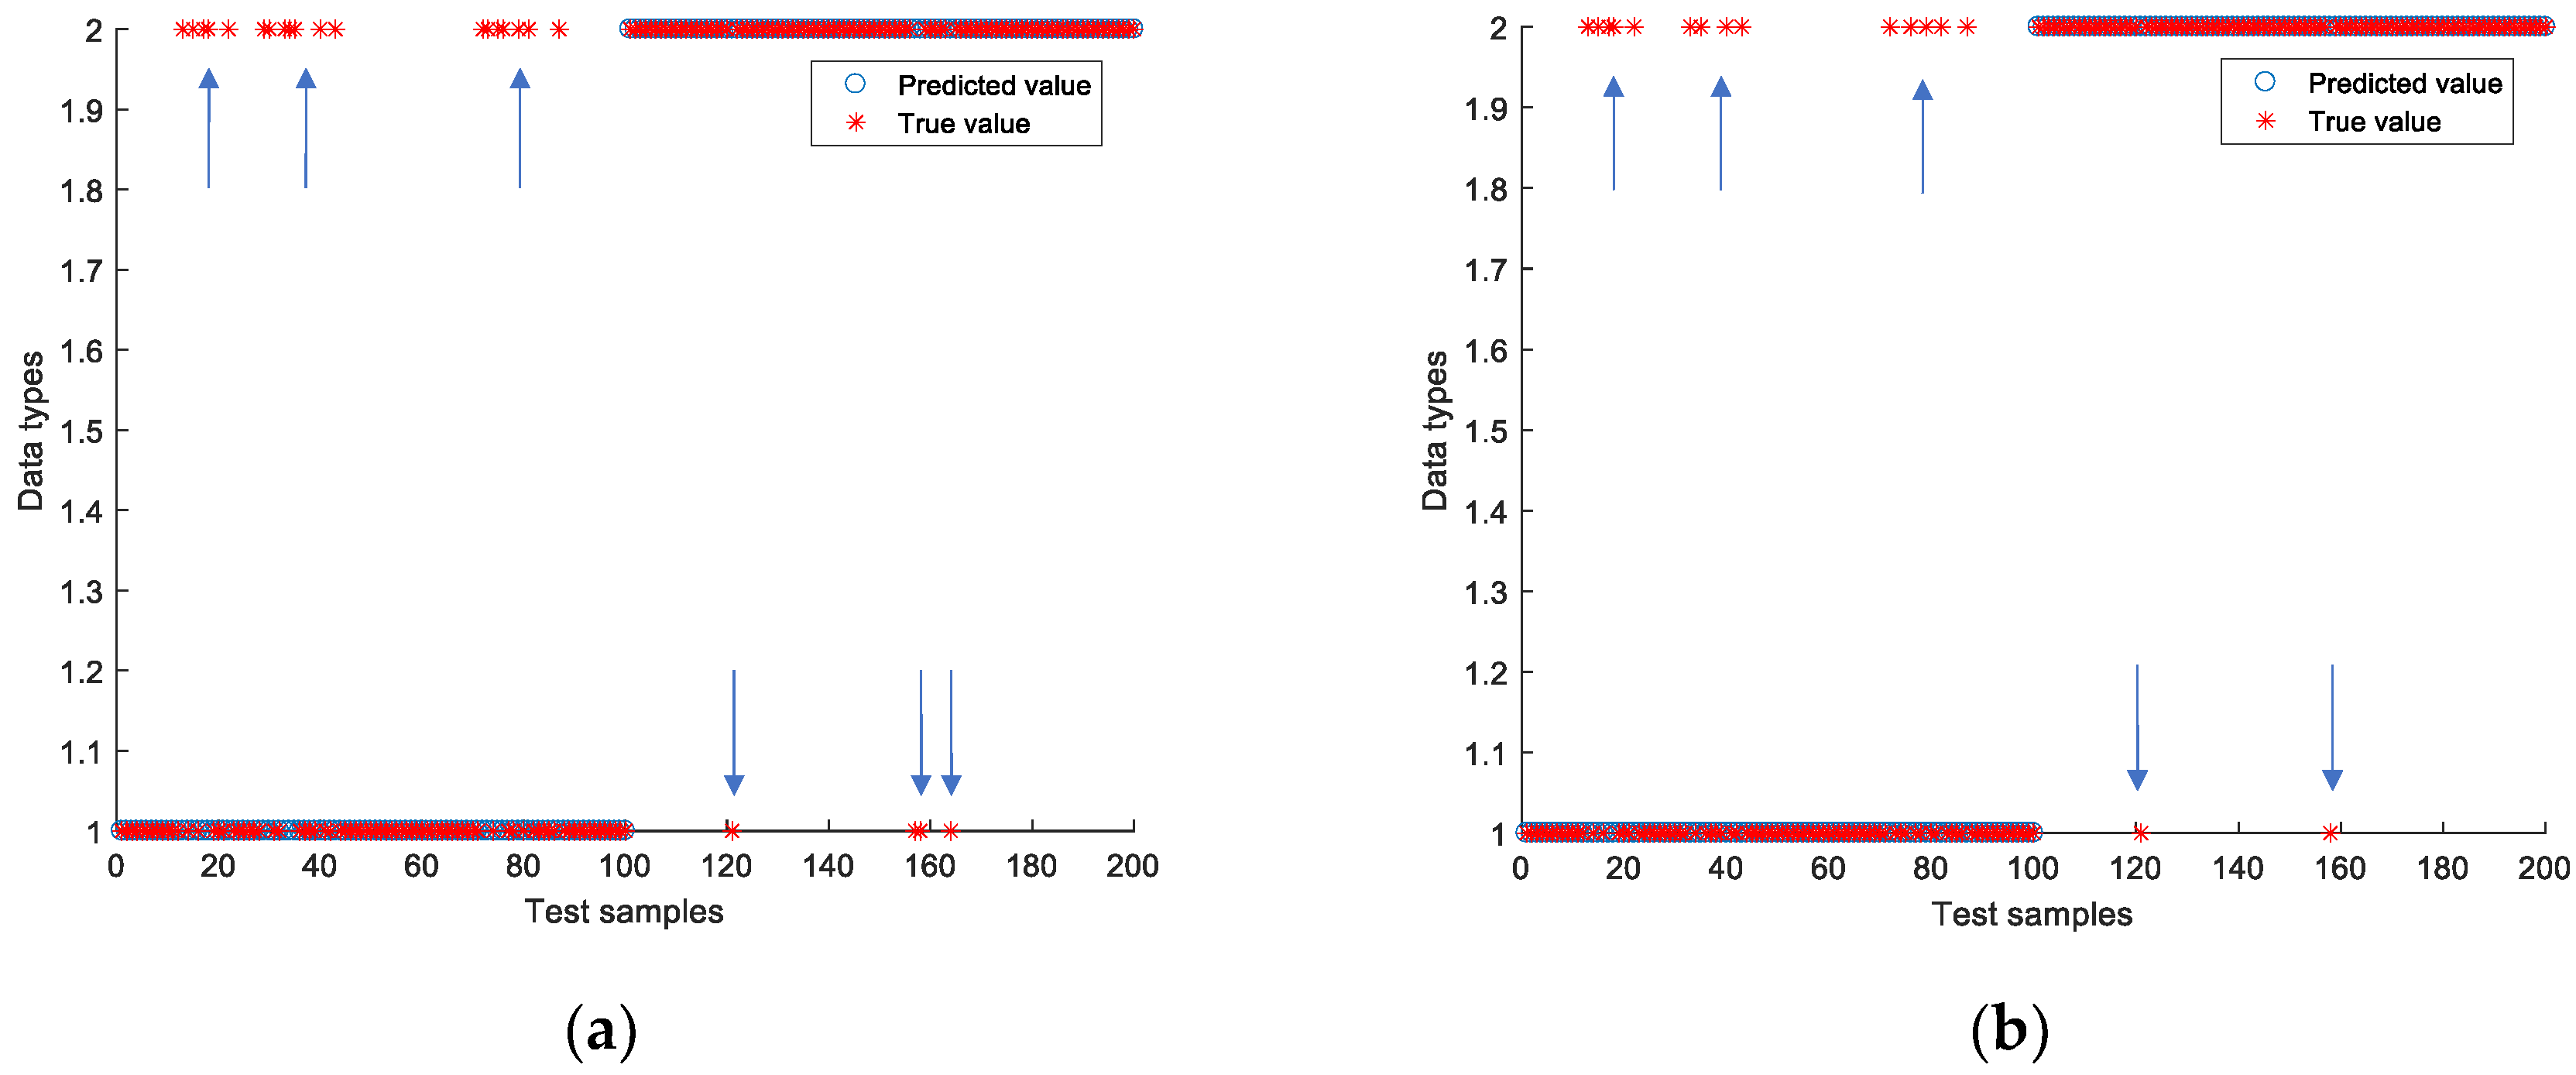
In the denaturing recognition by SVM based on radial basis function, 100 non-denatured tissue samples and 100 denatured tissue samples were randomly selected for training. After cross-validation, the kernel function parameter G was set as 16.776, and the penalty factor C was set as 17.442. The rest 200 ultrasonic scattered echo samples (including 100 non-denatured tissues and 100 denatured tissues) were used for testing. Figure 5 shows the SVM classification of denatured recognition based on MPE and IMPE characteristic parameters. The data points marked by the blue arrow in the upper left of the figure are misidentified non-denatured tissue samples, while the data points marked by the blue arrow in the lower right are misidentified denatured tissue samples. In the MPE-SVM recognition mode, the error recognition number of denatured tissue samples is 4, and that of non-denatured tissue samples is 19, with a total recognition rate of 88.5%. On the other hand, in the IMPE-SVM recognition mode, the error recognition number of denatured tissue samples is 2, and that of non-denatured tissue samples is 14, with a total recognition rate of 92.0%. The recognition error rate based on IMPE feature extraction is less than that of MPE, proving the superiority of IMPE feature extraction.
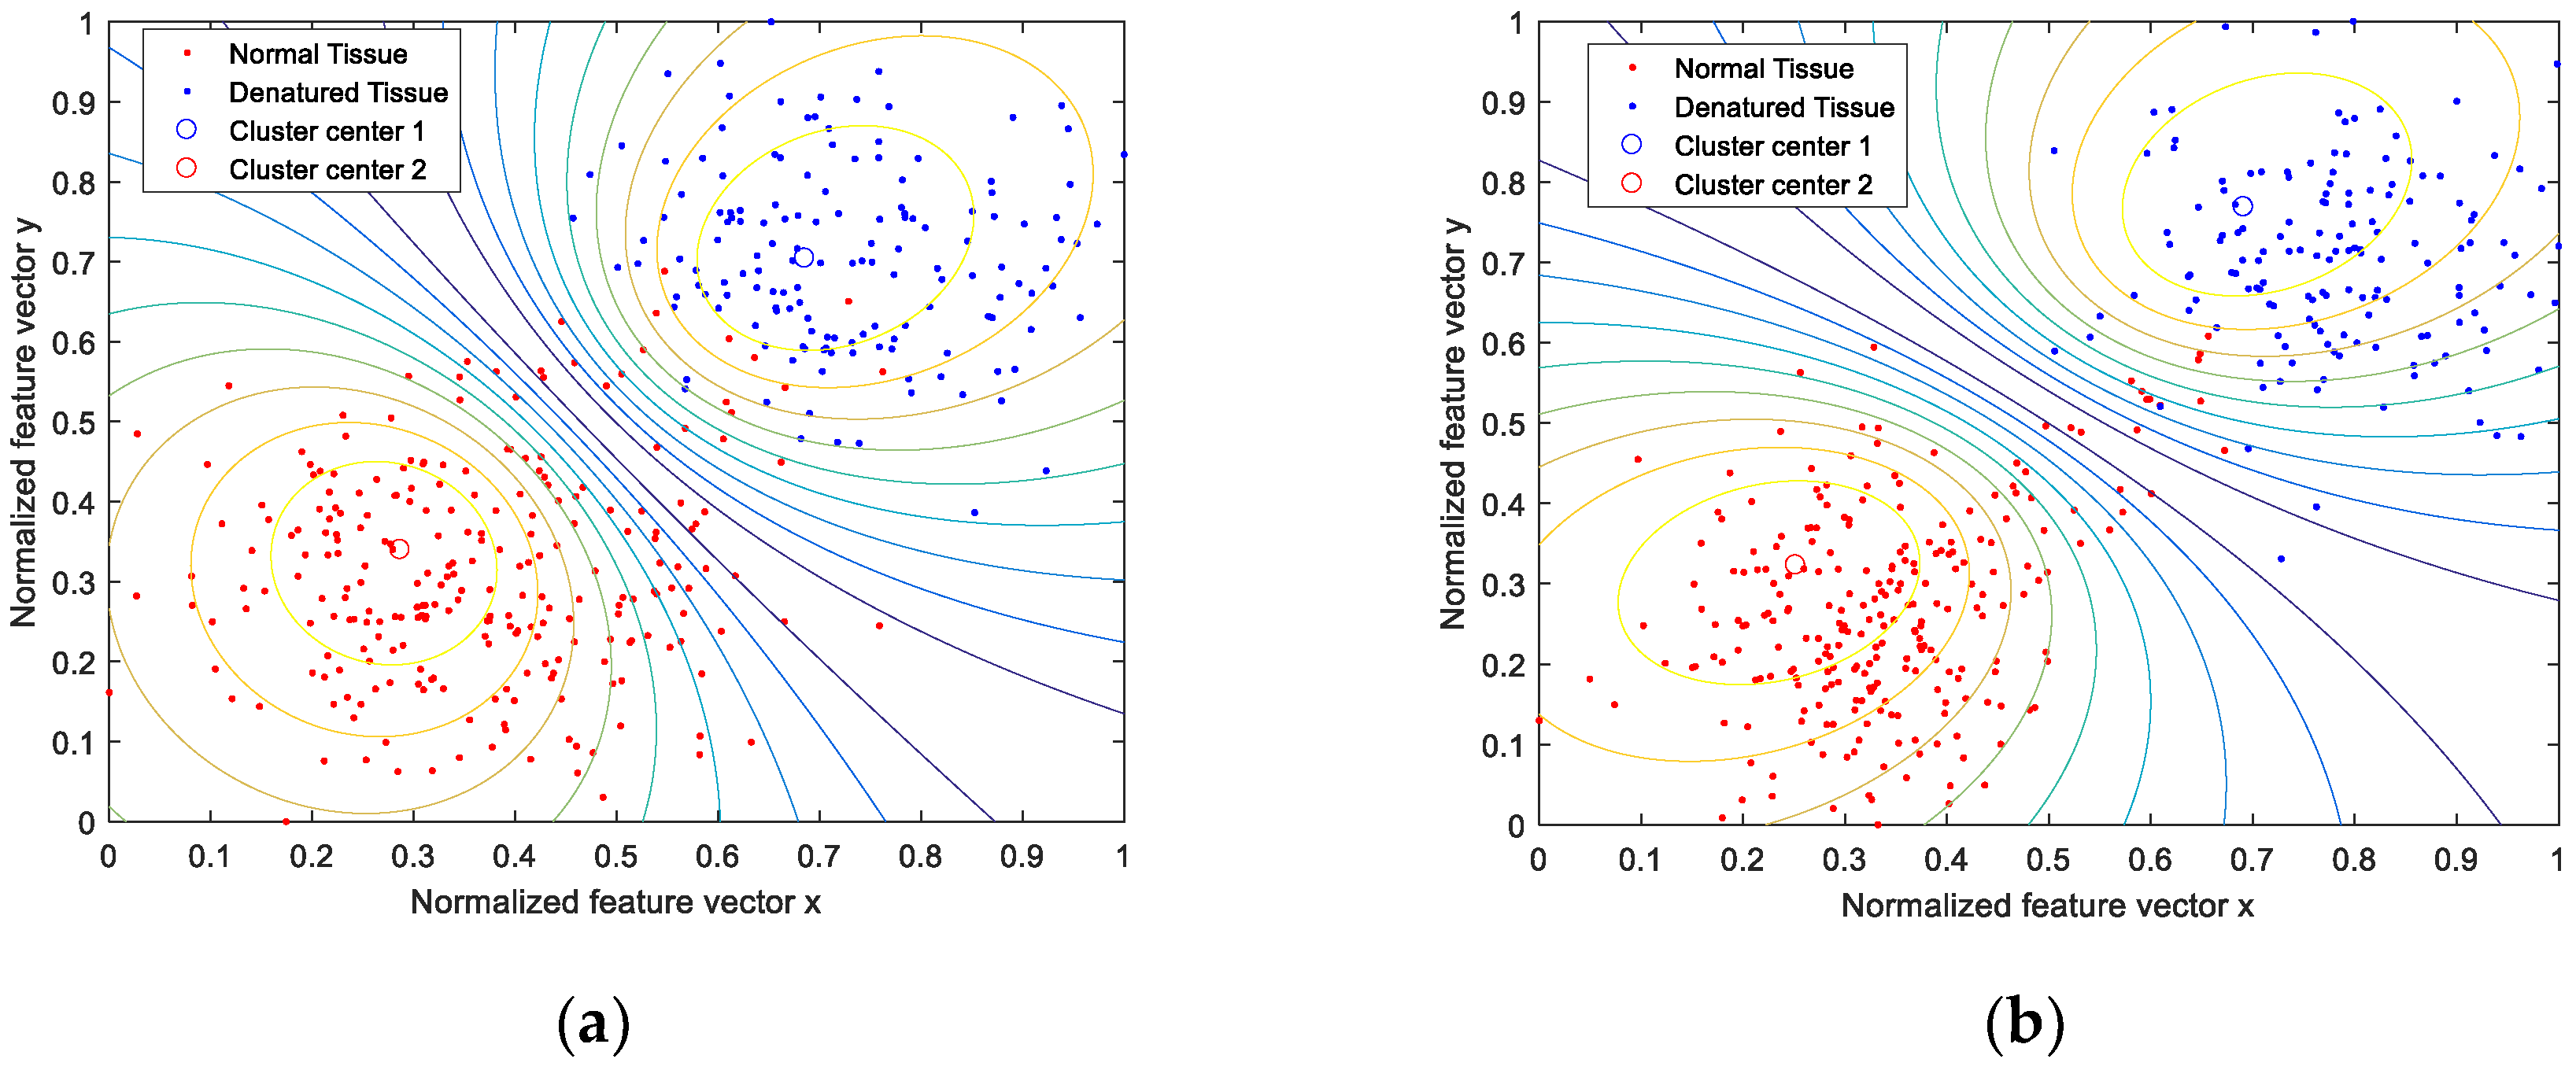
Since it is a gradual process from the non-denatured state to the denatured state of biological tissue, the characteristic parameters will inevitably overlap between these two states. GK fuzzy clustering is a kind of classification method which can solve this problem well. GK fuzzy clustering method was also applied to identify the states of biological tissue denaturation according to the features extracted by MPE and IMPE. Figure 6 shows the two-dimensional spatial distribution of biological tissue denaturation recognition based on GK fuzzy clustering. The ellipses and arcs in the graph represent two-dimensional spatial distribution contour lines. Both the samples based on MPE and IMPE feature extraction are distributed around the two clustering centers according to the denatured and normal tissue samples after clustered by GK fuzzy clustering, and the distinction between two types of samples is obvious. Compared with MPE-GK fuzzy clustering, IMPE-GK fuzzy clustering has fewer sample points in the overlapping region of denatured and normal tissue features, and fewer misidentified sample points in the membership contour line, with closer features and better classification effect. Xie–Beni index is also used to evaluate the clustering effect of the two fuzzy clustering methods. The Xie–Beni index obtained based on MPE-GK and IMPE-GK fuzzy clustering is 7.1361 and 5.4358, respectively, which indicates that the IMPE-GK fuzzy clustering algorithm has a good classification and identification ability in biological tissue denaturation recognition.
Different denaturation recognition methods were used to classify 100 non-denatured and 100 denatured tissue samples. Recognition results are shown in Table 2. It is found that in the recognition of biological tissue denaturation, the clustering effect and recognition ability based on IMPE feature extraction are better than that of MPE. GK fuzzy clustering has a higher recognition rate than SVM in the denaturation recognition of gradient characteristic parameters. Comparing the four methods, IMPE-GK fuzzy clustering has the highest accuracy with 95.5% in biological tissue denaturation recognition.
3.3. Discussions
MPE has been widely used for feature extraction in biological tissue denaturation recognition. However, the traditional MPE method has the defect of amplitude information loss when analyzing the complexity of the signal. The stability of MPE is poor due to the coarse-grained process. In this work, the IMPE method is proposed to overcome the defect of amplitude information loss in the MPE method and suppress entropy fluctuation by averaging probability and entropy. In the simulation of WGN with different sampling points, the results (Figure 2 and Table 1) show that the fluctuation of entropy calculated by IMPE is much weaker than that calculated by MPE. In addition, IMPE has better feature extraction ability than MPE in the analysis of biological tissue ultrasonic scattered echo signals. In the classification and recognition based on SVM and GK fuzzy clustering, the recognition results obtained from IMPE calculation are better than that from MPE calculation (Table 2). From the results of the combination methods (Figure 4 and Figure 5, and Table 2), it is found that IMPE-GK fuzzy clustering can better evaluate and identify the biological tissue denaturation with gradual change. The recognition rate of denatured biological tissue based on IMPE-GK fuzzy clustering reaches 95.5%. Nevertheless, the denaturation recognition method still needs to be improved. It is considered that the noise contained in the ultrasonic scattered echo signal reduced the effectiveness of IMPE. As the further work, the combination of the IMPE method and advanced signal denoising may be a good way to improve the identification accuracy and anti-noise ability.
4. Conclusions
For the defect of information loss during the coarse-graining process on MPE, an IMPE algorithm is proposed. By analyzing the features of MPE and IMPE from WGN, it is found IMPE can not only evaluate the complexity of time series without the loss of amplitude information but also improve the stability of entropy. Compared with MPE, IMPE has better tightness and separability, which means feature extraction based on IMPE can better identify biological tissue denaturation.
SVM and GK fuzzy clustering algorithms are applied to the recognition of biological tissue denaturation according to the MPE and IMPE characteristic parameters derived from the experimental ultrasonic scattered echo signal. The results show that IMPE characteristic parameters have a better clustering effect and recognition ability than MPE characteristic parameters. Compared with the linear classifier SVM, the denaturation recognition based on GK fuzzy clustering algorithm has a higher recognition rate, and GK fuzzy clustering can better solve the problem of fuzzy denaturation characteristics of biological tissues. The method based on IMPE-GK fuzzy clustering has the highest recognition rate of 95.5%.
However, besides the problem that the noise in ultrasonic scattered echo signal reduces the recognition accuracy mentioned in Section 3.3, another limitation is the parameter setting, which depends on the subjective experience of researchers. These parameters need to be optimized according to the different conditions of biological tissue samples. The accuracy of denatured tissue recognition may be affected due to poor parameter optimization. In future work, it is hoped to further introduce the machine learning to optimize the parameter setting automatically.
Author Contributions
Conceptualization, Z.P.; methodology, Z.P. and X.Z.; software, B.L. and X.Z.; validation, Z.P., X.Z. and J.C.; formal analysis, Z.P.; investigation, Z.P.; resources, X.Z.; data curation, Z.P. and B.L. writing—original draft preparation, Z.P.; writing—review and editing, Z.P.; visualization, Z.P. and J.C.; supervision, B.L.; project administration, Z.P.; funding acquisition, Z.P. All authors have read and agreed to the published version of the manuscript.
Funding
This study was supported by Natural Science Youth Foundation of Hunan Province (2020JJ5396), Excellent Young Scientist Foundation of Hunan Provincial Education Department (20B405), and the Research Foundation for Advanced Talents (18BSQD32, E07020006 and E07021011).
Institutional Review Board Statement
Not applicable.
Informed Consent Statement
Not applicable.
Data Availability Statement
Not Applicable, the study does not report any data.
Conflicts of Interest
The authors declare no conflict of interest.
References
- Hill, C.R.; Haar, G.T. Review article: High intensity focused ultrasound—Potential for cancer treatment. Br. J. Radiol. 1995, 68, 1296–1303. [Google Scholar] [CrossRef]
- Kennedy, J.E. High intensity focused ultrasound: Surgery of the future? Br. J. Radiol. 2003, 76, 590–599. [Google Scholar] [CrossRef] [PubMed]
- Bailey, M.R.; Khokhlova, V.A.; Sapozhnikov, O.; Kargl, S.G.; Crum, L.A. Physical mechanisms of the therapeutic effect of ultrasound. Acoust. Phys. 2003, 49, 369–388. [Google Scholar] [CrossRef]
- Rove, K.O.; Sullivan, K.F.; Crawford, E.D. High-intensity Focused Ultrasound: Ready for Primetime. Urol. Clin. N. Am. 2010, 37, 27–35. [Google Scholar] [CrossRef] [PubMed]
- Cranston, D. A review of high intensity focused ultrasound in relation to the treatment of renal tumours and other malignancies. Ultrason. Sonochem. 2015, 27, 654–658. [Google Scholar] [CrossRef]
- Kim, Y.-S.; Bae, D.-S.; Park, M.J.; Viitala, A.; Keserci, B.; Rhim, H.; Lim, H.K. Techniques to expand patient selection for MRI-guided high-intensity focused ultrasound ablation of uterine fibroids. AJR. Am. J. Roentgenol. 2014, 202, 443–451. [Google Scholar] [CrossRef]
- Filipowska, J.; Łoziński, T. Magnetic Resonance-Guided High-Intensity Focused Ultrasound (MR-HIFU) in Treatment of Symptomatic Uterine Myomas. Pol. J. Radiol. 2014, 79, 439–443. [Google Scholar] [PubMed] [Green Version]
- Wood, B.J.; Yanof, J.; Frenkel, V.; Viswanathan, A.; Dromi, S.; Oh, K.; Kruecker, J.; Bauer, C.; Seip, R.; Kam, A.; et al. CT and ultrasound guided stereotactic high intensity focused ultrasound (HIFU). AIP Conf. Proc. 2006, 829, 122–126. [Google Scholar]
- Weiss, N.; Sosna, J.; Goldberg, S.N.; Azhari, H. Non-invasive temperature monitoring and hyperthermic injury onset detection using X-ray CT during HIFU thermal treatment in ex vivo fatty tissue. Int. J. Hyperther. 2014, 30, 119–125. [Google Scholar] [CrossRef]
- Ballard, J.R.; Casper, A.J.; Ebbini, E.S. Monitoring and guidance of HIFU beams with dual-mode ultrasound arrays. In Proceedings of the 2009 Annual International Conference of the IEEE Engineering in Medicine and Biology Society, Minneapolis, MN, USA, 3–6 September 2009; pp. 137–140. [Google Scholar]
- Wen, Q.; Wan, S.; Liu, Z.; Xu, S.; Wang, H.; Yang, B. B-ultrasound Image Registration of HIFU Monitoring Based on Ultrasonic Speckle. Sci. Technol. Rev. 2010, 28, 59–63. [Google Scholar]
- Zhang, S.; Yang, W.; Yang, R.; Ye, B.; Chen, L.; Ma, W.; Chen, Y. Noninvasive temperature monitoring in a wide range based on textures of ultrasound images. In International Workshop on Medical Imaging and Virtual Reality; Springer: Berlin/Heidelberg, Germany, 2006; pp. 100–107. [Google Scholar]
- Poušek, L.; Jelínek, M.; Storkova, B.; Novak, P. Noninvasive temperature monitoring using ultrasound tissue characterization method. In Proceedings of the 28th International Conference on Information Technology Interfaces, Cavtat, Croatia, 19–22 June 2006; pp. 219–224. [Google Scholar]
- Parker, K.J. Ultrasonic attenuation and absorption in liver tissue. Ultrasound Med. Biol. 1983, 9, 363–369. [Google Scholar] [CrossRef]
- Damianou, C.A.; Sanghvi, N.T.; Fry, F.J.; Maass-Moreno, R. Dependence of ultrasonic attenuation and absorption in dog soft tissues on temperature and thermal dose. J. Acoust. Soc. Am. 1997, 102, 628–634. [Google Scholar] [CrossRef]
- Worthington, A.E.; Trachtenberg, J.; Sherar, M.D. Ultrasound properties of human prostate tissue during heating. Ultrasound Med. Biol. 2002, 28, 1311–1318. [Google Scholar] [CrossRef]
- Garra, B.S. Imaging and estimation of tissue elasticity by ultrasound. Ultrasound Q. 2007, 23, 255–268. [Google Scholar] [CrossRef] [PubMed]
- Pichardo, S.; Sin, V.W.; Hynynen, K. Multi-frequency characterization of the speed of sound and attenuation coefficient for longitudinal transmission of freshly excised human skulls. Phys. Med. Biol. 2010, 56, 219. [Google Scholar] [CrossRef] [PubMed] [Green Version]
- Furness, G.; Reilly, M.P.; Kuchi, S. An evaluation of ultrasound imaging for identification of lumbar intervertebral level. Anaesthesia 2015, 57, 277–280. [Google Scholar] [CrossRef] [PubMed]
- Shishitani, T.; Yoshizawa, S.; Umemura, S. Change in acoustic impedance and sound speed of HIFU-exposed chicken breast muscle. In Proceedings of the 2010 IEEE International Ultrasonics Symposium, San Diego, CA, USA, 11–14 October 2010; pp. 1384–1387. [Google Scholar]
- Mobasheri, S.; Behnam, H.; Rangraz, P.; Tavakkoli, J. Radio frequency ultrasound time series signal analysis to evaluate high-intensity focused ultrasound lesion formation status in tissue. J. Med. Signals Sens. 2016, 6, 91. [Google Scholar] [CrossRef] [PubMed]
- Tsui, P.H.; Wan, Y.L. Effects of fatty infiltration of the liver on the Shannon entropy of ultrasound backscattered signals. Entropy 2016, 18, 341. [Google Scholar] [CrossRef] [Green Version]
- Tsui, P.H. Ultrasound Detection of Scatterer Concentration by Weighted Entropy. Entropy 2015, 17, 6598–6616. [Google Scholar] [CrossRef] [Green Version]
- Behnam, H.; Monfared, M.M.; Rangraz, P.; Tavakkoli, J. High-intensity focused ultrasound thermal lesion detection using entropy imaging of ultrasound radio frequency signal time series. J. Med. Ultrasound 2018, 26, 24. [Google Scholar] [CrossRef] [PubMed]
- Montirosso, R.; Riccardi, B.; Molteni, E.; Borgatti, R.; Reni, G. Infant’s emotional variability associated to interactive stressful situation: A novel analysis approach with Sample Entropy and Lempel-Ziv Complexity. Infant Behav. Dev. 2010, 33, 346–356. [Google Scholar] [CrossRef] [PubMed]
- Acharya, U.R.; Raghavendra, U.; Fujita, H.; Hagiwara, Y.; Koh, J.E.; Hong, T.J.; Sudarshan, V.K.; Vijayananthan, A.; Yeong, C.H.; Gudigar, A.; et al. Automated characterization of fatty liver disease and cirrhosis using curvelet transform and entropy features extracted from ultrasound images. Comput. Biol. Med. 2016, 79, 250–258. [Google Scholar] [CrossRef] [PubMed]
- Bandt, C.; Pompe, B. Permutation entropy: A natural complexity measure for time series. Phys. Rev. Lett. 2002, 88, 174102. [Google Scholar] [CrossRef]
- Yan, S.-Q.; Zhang, H.; Liu, B.; Tang, H.; Qian, S.-Y. Identification of denatured and normal biological tissues based on compressed sensing and refined composite multi-scale fuzzy entropy during high intensity focused ultrasound treatment. Chin. Phys. B 2021, 30, 028704. [Google Scholar] [CrossRef]
- Liu, B.; Wang, R.; Peng, Z.; Qin, L. Identification of denatured biological tissues based on compressed sensing and improved multiscale dispersion entropy during HIFU treatment. Entropy 2020, 22, 944. [Google Scholar] [CrossRef]
- Gao, Y.; Villecco, F.; Li, M.; Song, W. Multi-scale permutation entropy based on improved LMD and HMM for rolling bearing diagnosis. Entropy 2017, 19, 176. [Google Scholar] [CrossRef] [Green Version]
- Li, Y.; Li, Y.; Chen, X.; Yu, J. A novel feature extraction method for ship-radiated noise based on variational mode decomposition and multi-scale permutation entropy. Entropy 2017, 19, 342. [Google Scholar] [CrossRef] [Green Version]
- Liu, B.; Hu, W.P.; Zou, X.; Ding, Y.J.; Qian, S.Y. Recognition of denatured biological tissue based on variational mode decomposition and multi-scale permutation entropy. Acta Phys. Sin. 2019, 68, 028702. [Google Scholar] [CrossRef]
- Liu, B.; Tan, W.; Zhang, X.; Peng, Z.; Cao, J. Recognition study of denatured biological tissues based on multi-scale rescaled range permutation entropy. Math. Biosci. Eng. 2022, 19, 102–114. [Google Scholar] [CrossRef] [PubMed]
- Fadlallah, B.; Chen, B.; Keil, A.; Príncipe, J. Weighted-permutation entropy: A complexity measure for time series incorporating amplitude information. Phys. Rev. E 2013, 87, 022911. [Google Scholar] [CrossRef] [PubMed] [Green Version]
- Zang, W.; Wang, Z.; Jiang, D.; Liu, X.; Jiang, Z. Classification of MRI brain images using DNA genetic algorithms optimized Tsallis entropy and support vector machine. Entropy 2018, 20, 964. [Google Scholar] [CrossRef] [PubMed] [Green Version]
- Ilakiyaselvan, N.; Khan, A.N.; Shahina, A. Deep learning approach to detect seizure using reconstructed phase space images. J. Biomed. Res. 2020, 34, 240–250. [Google Scholar] [CrossRef] [PubMed]
- Grassi, K.; Poisson-Caillault, É.; Bigand, A.; Lefebvre, A. Comparative Study of Clustering Approaches Applied to Spatial or Temporal Pattern Discovery. J. Mar. Sci. Eng. 2020, 8, 713. [Google Scholar] [CrossRef]
- Seip, R.; Tavakkoli, J.; Carlson, R.; Wunderlich, A.; Sanghvi, N.; Dines, K.; Gardner, T. High-intensity focused ultrasound (HIFU) multiple lesion imaging: Comparison of detection algorithms for real-time treatment control. In Proceedings of the IEEE Ultrasonics Symposium, Munich, German, 8–11 October 2002; Volume 2, pp. 1427–1430. [Google Scholar]
- Ge, H.; Liu, X. Fault Diagnosis of Rolling Bearings Based on ALIFD Fuzzy Entropy and GK Clustering. Fail. Anal. Prev. 2019, 14, 71–78. [Google Scholar]
Figure 1.
White Gaussian noise used in multiscale permutation entropy (MPE) and improved multiscale permutation entropy (IMPE) simulation.
Figure 1.
White Gaussian noise used in multiscale permutation entropy (MPE) and improved multiscale permutation entropy (IMPE) simulation.

Figure 2.
Distribution of MPE and IMPE of WGN: (a) m = 6; (b) m = 7.

Figure 3.
Ultrasonic scattered echo monitoring system during HIFU treatment.

Figure 4.
Time-domain samples of experimental ultrasonic scattered echo: (a) non-denatured tissue; (b) denatured tissue.
Figure 4.
Time-domain samples of experimental ultrasonic scattered echo: (a) non-denatured tissue; (b) denatured tissue.

Figure 5.
Recognition of denatured and non-denatured tissue based on support vector machine (SVM): (a) MPE-SVM; (b) IMPE-SVM.
Figure 5.
Recognition of denatured and non-denatured tissue based on support vector machine (SVM): (a) MPE-SVM; (b) IMPE-SVM.

Figure 6.
Recognition of denatured and normal issue based on Gustafson–Kessel (GK) fuzzy clustering: (a) MPE-GK; (b) IMPE-GK.
Figure 6.
Recognition of denatured and normal issue based on Gustafson–Kessel (GK) fuzzy clustering: (a) MPE-GK; (b) IMPE-GK.


Table 1.
The standard deviations of MPE and IMPE calculated from WGN.
| Entropy | Samplings | |||
|---|---|---|---|---|
| 500 | 1000 | 3000 | 5000 | |
| MPE | 0.0917 | 0.0587 | 0.0143 | 0.0119 |
| IMPE | 0.0215 | 0.0103 | 0.0049 | 0.0020 |
Table 2.
Recognition results with different methods.
| Recognition Methods | Non-Denatured Tissue | Denatured Tissue | Recognition Rate (%) |
|---|---|---|---|
| MPE-SVM | 81/100 | 96/100 | 88.5 |
| IMPE-SVM | 86/100 | 98/100 | 92.0 |
| MPE-GK | 85/100 | 97/100 | 91.0 |
| IMPE-GK | 92/100 | 99/100 | 95.5 |
Publisher’s Note: MDPI stays neutral with regard to jurisdictional claims in published maps and institutional affiliations. |
© 2022 by the authors. Licensee MDPI, Basel, Switzerland. This article is an open access article distributed under the terms and conditions of the Creative Commons Attribution (CC BY) license (https://creativecommons.org/licenses/by/4.0/).
Share and Cite
MDPI and ACS Style
Peng, Z.; Zhang, X.; Cao, J.; Liu, B. Recognition of Biological Tissue Denaturation Based on Improved Multiscale Permutation Entropy and GK Fuzzy Clustering. Information 2022, 13, 140. https://doi.org/10.3390/info13030140
AMA Style
Peng Z, Zhang X, Cao J, Liu B. Recognition of Biological Tissue Denaturation Based on Improved Multiscale Permutation Entropy and GK Fuzzy Clustering. Information. 2022; 13(3):140. https://doi.org/10.3390/info13030140
Chicago/Turabian StylePeng, Ziqi, Xian Zhang, Jing Cao, and Bei Liu. 2022. "Recognition of Biological Tissue Denaturation Based on Improved Multiscale Permutation Entropy and GK Fuzzy Clustering" Information 13, no. 3: 140. https://doi.org/10.3390/info13030140
Note that from the first issue of 2016, this journal uses article numbers instead of page numbers. See further details here.