
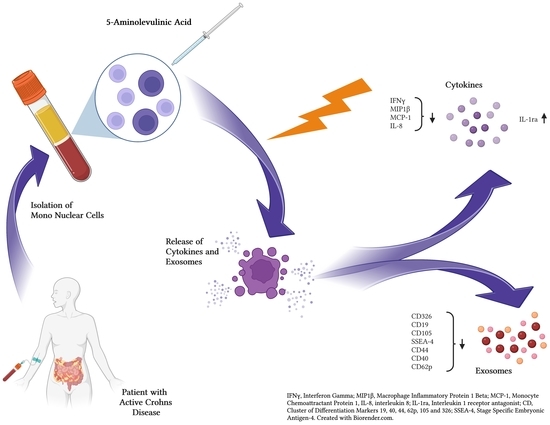
Photodynamic Effects with 5-Aminolevulinic Acid on Cytokines and Exosomes in Human Peripheral Blood Mononuclear Cells from Patients with Crohn’s Disease
 , , , ,
Abstract
:
1. Introduction
2. Results and Discussion
2.1. Sample Collection and Clinical Patient Information
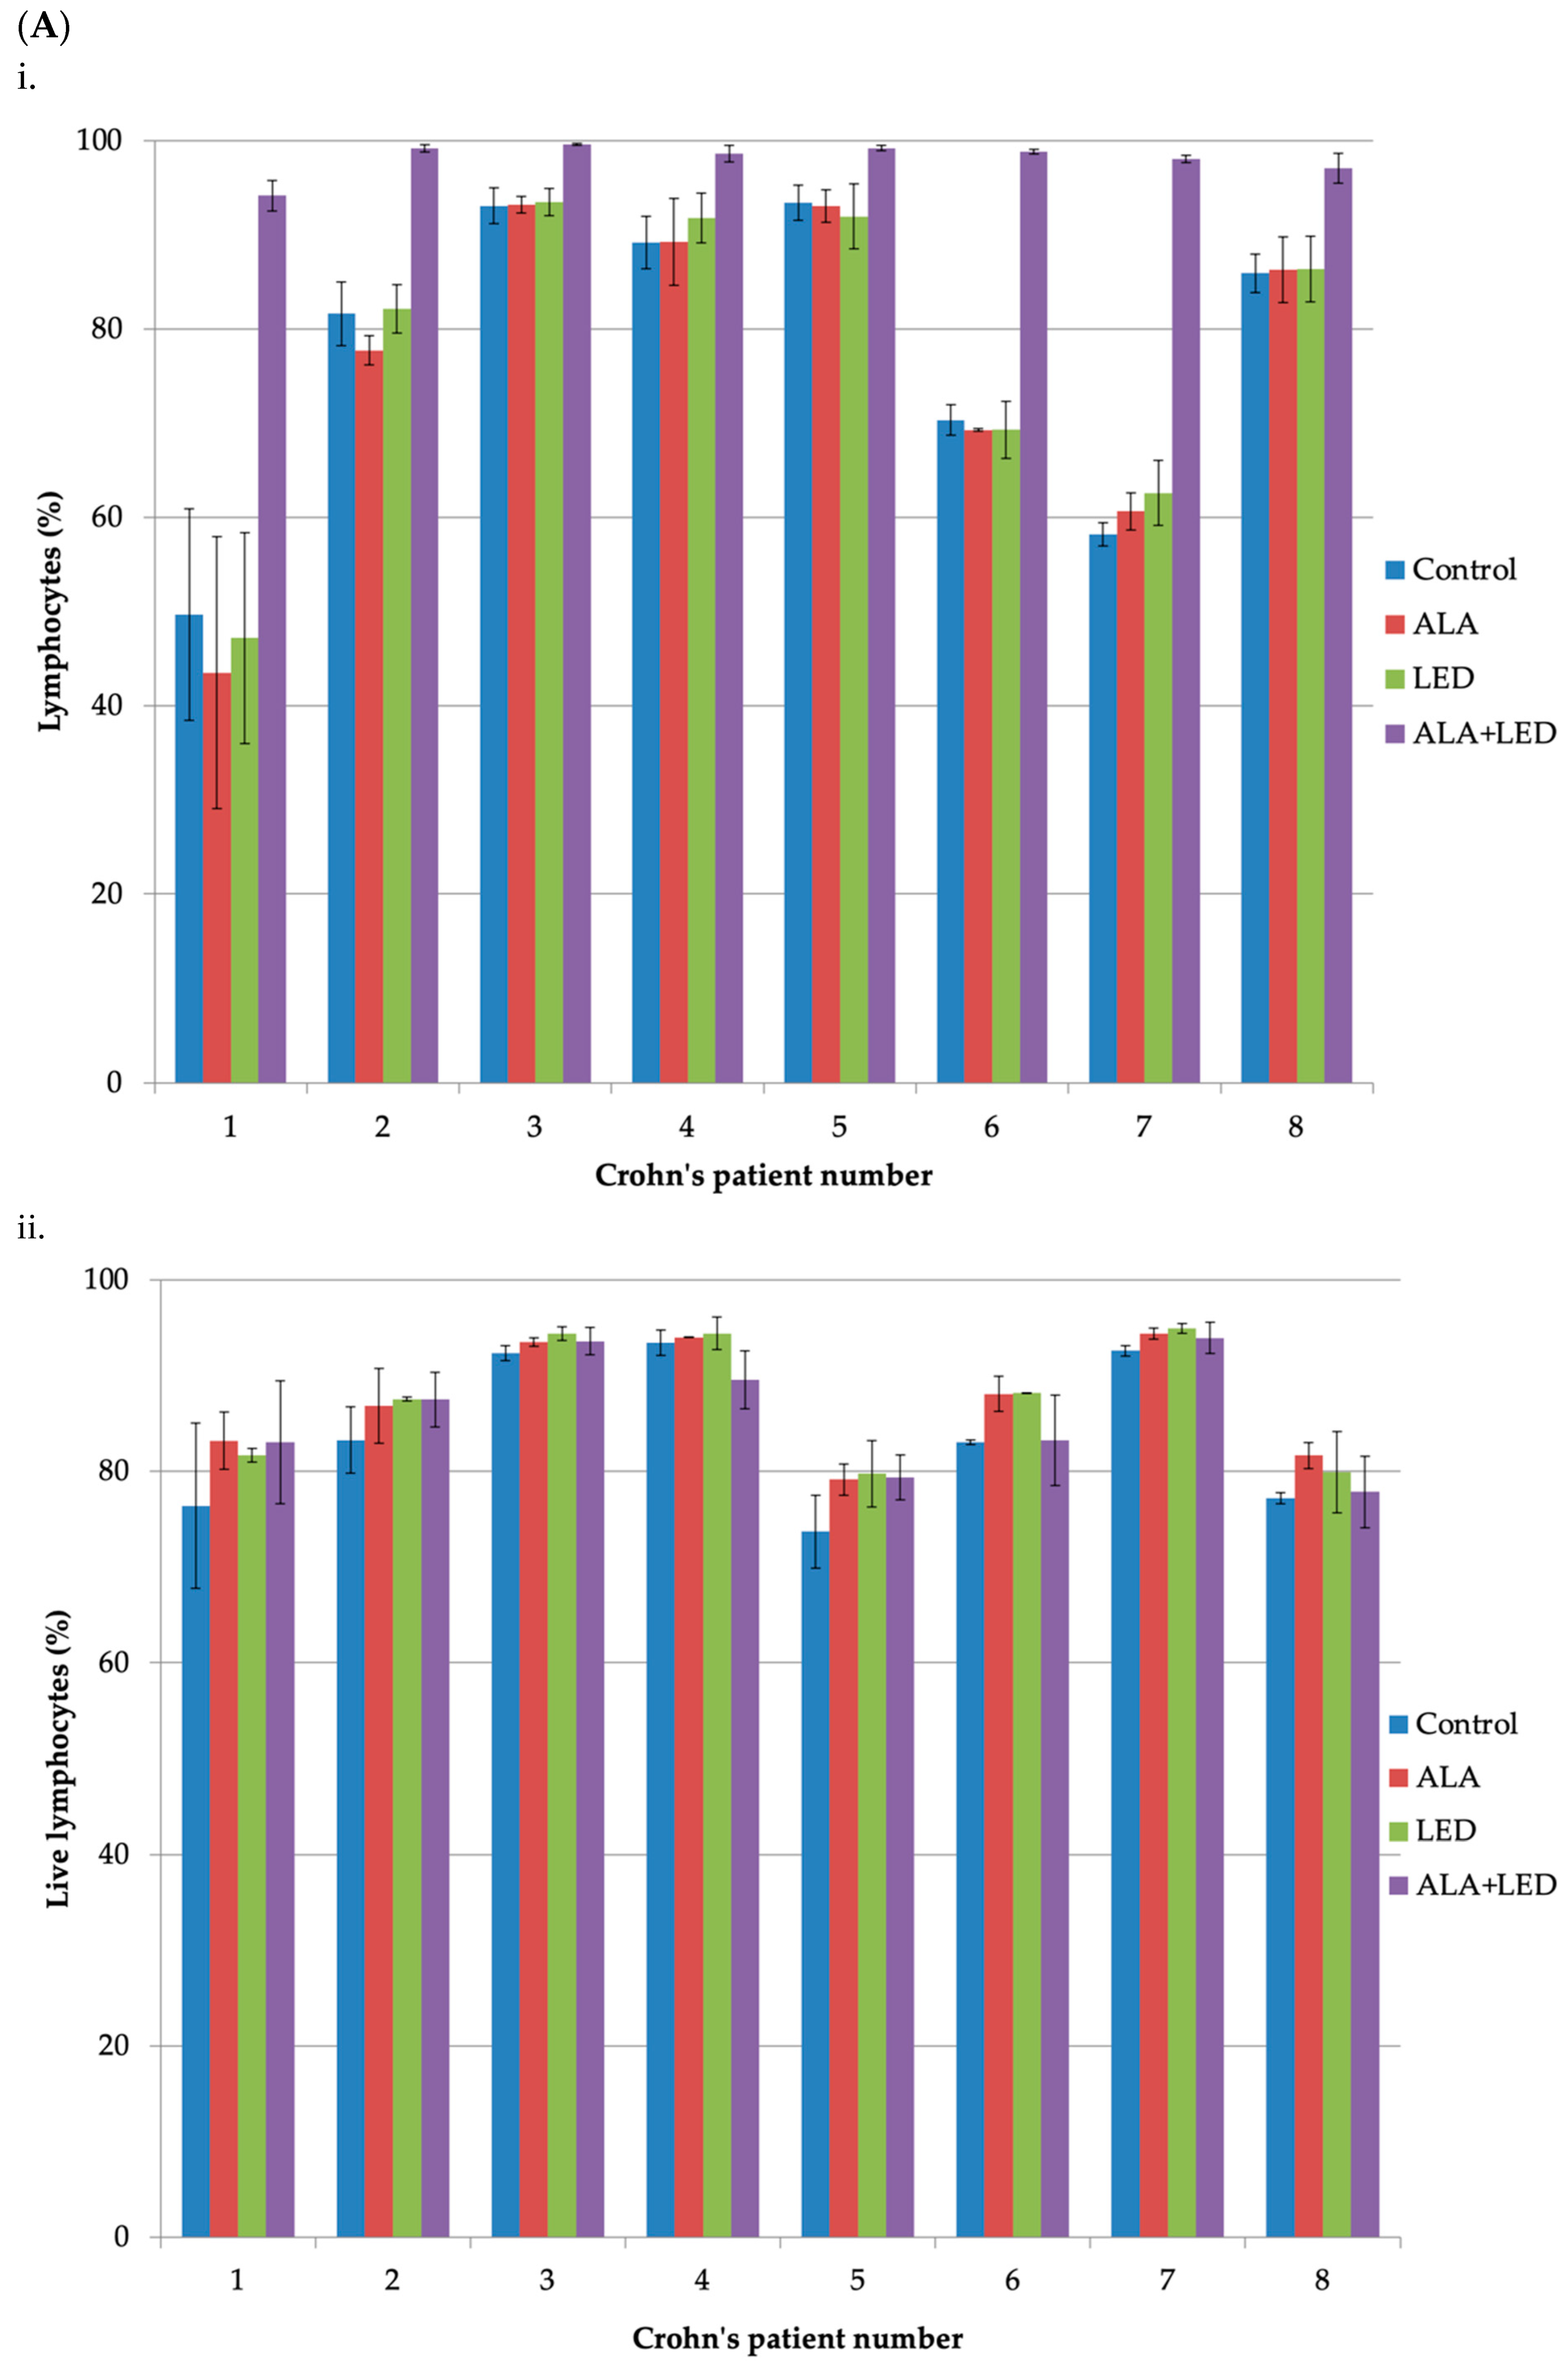
2.2. Cell Survival after ALA-PDT
2.3. Effect of ALA (Alone) on Cytokines
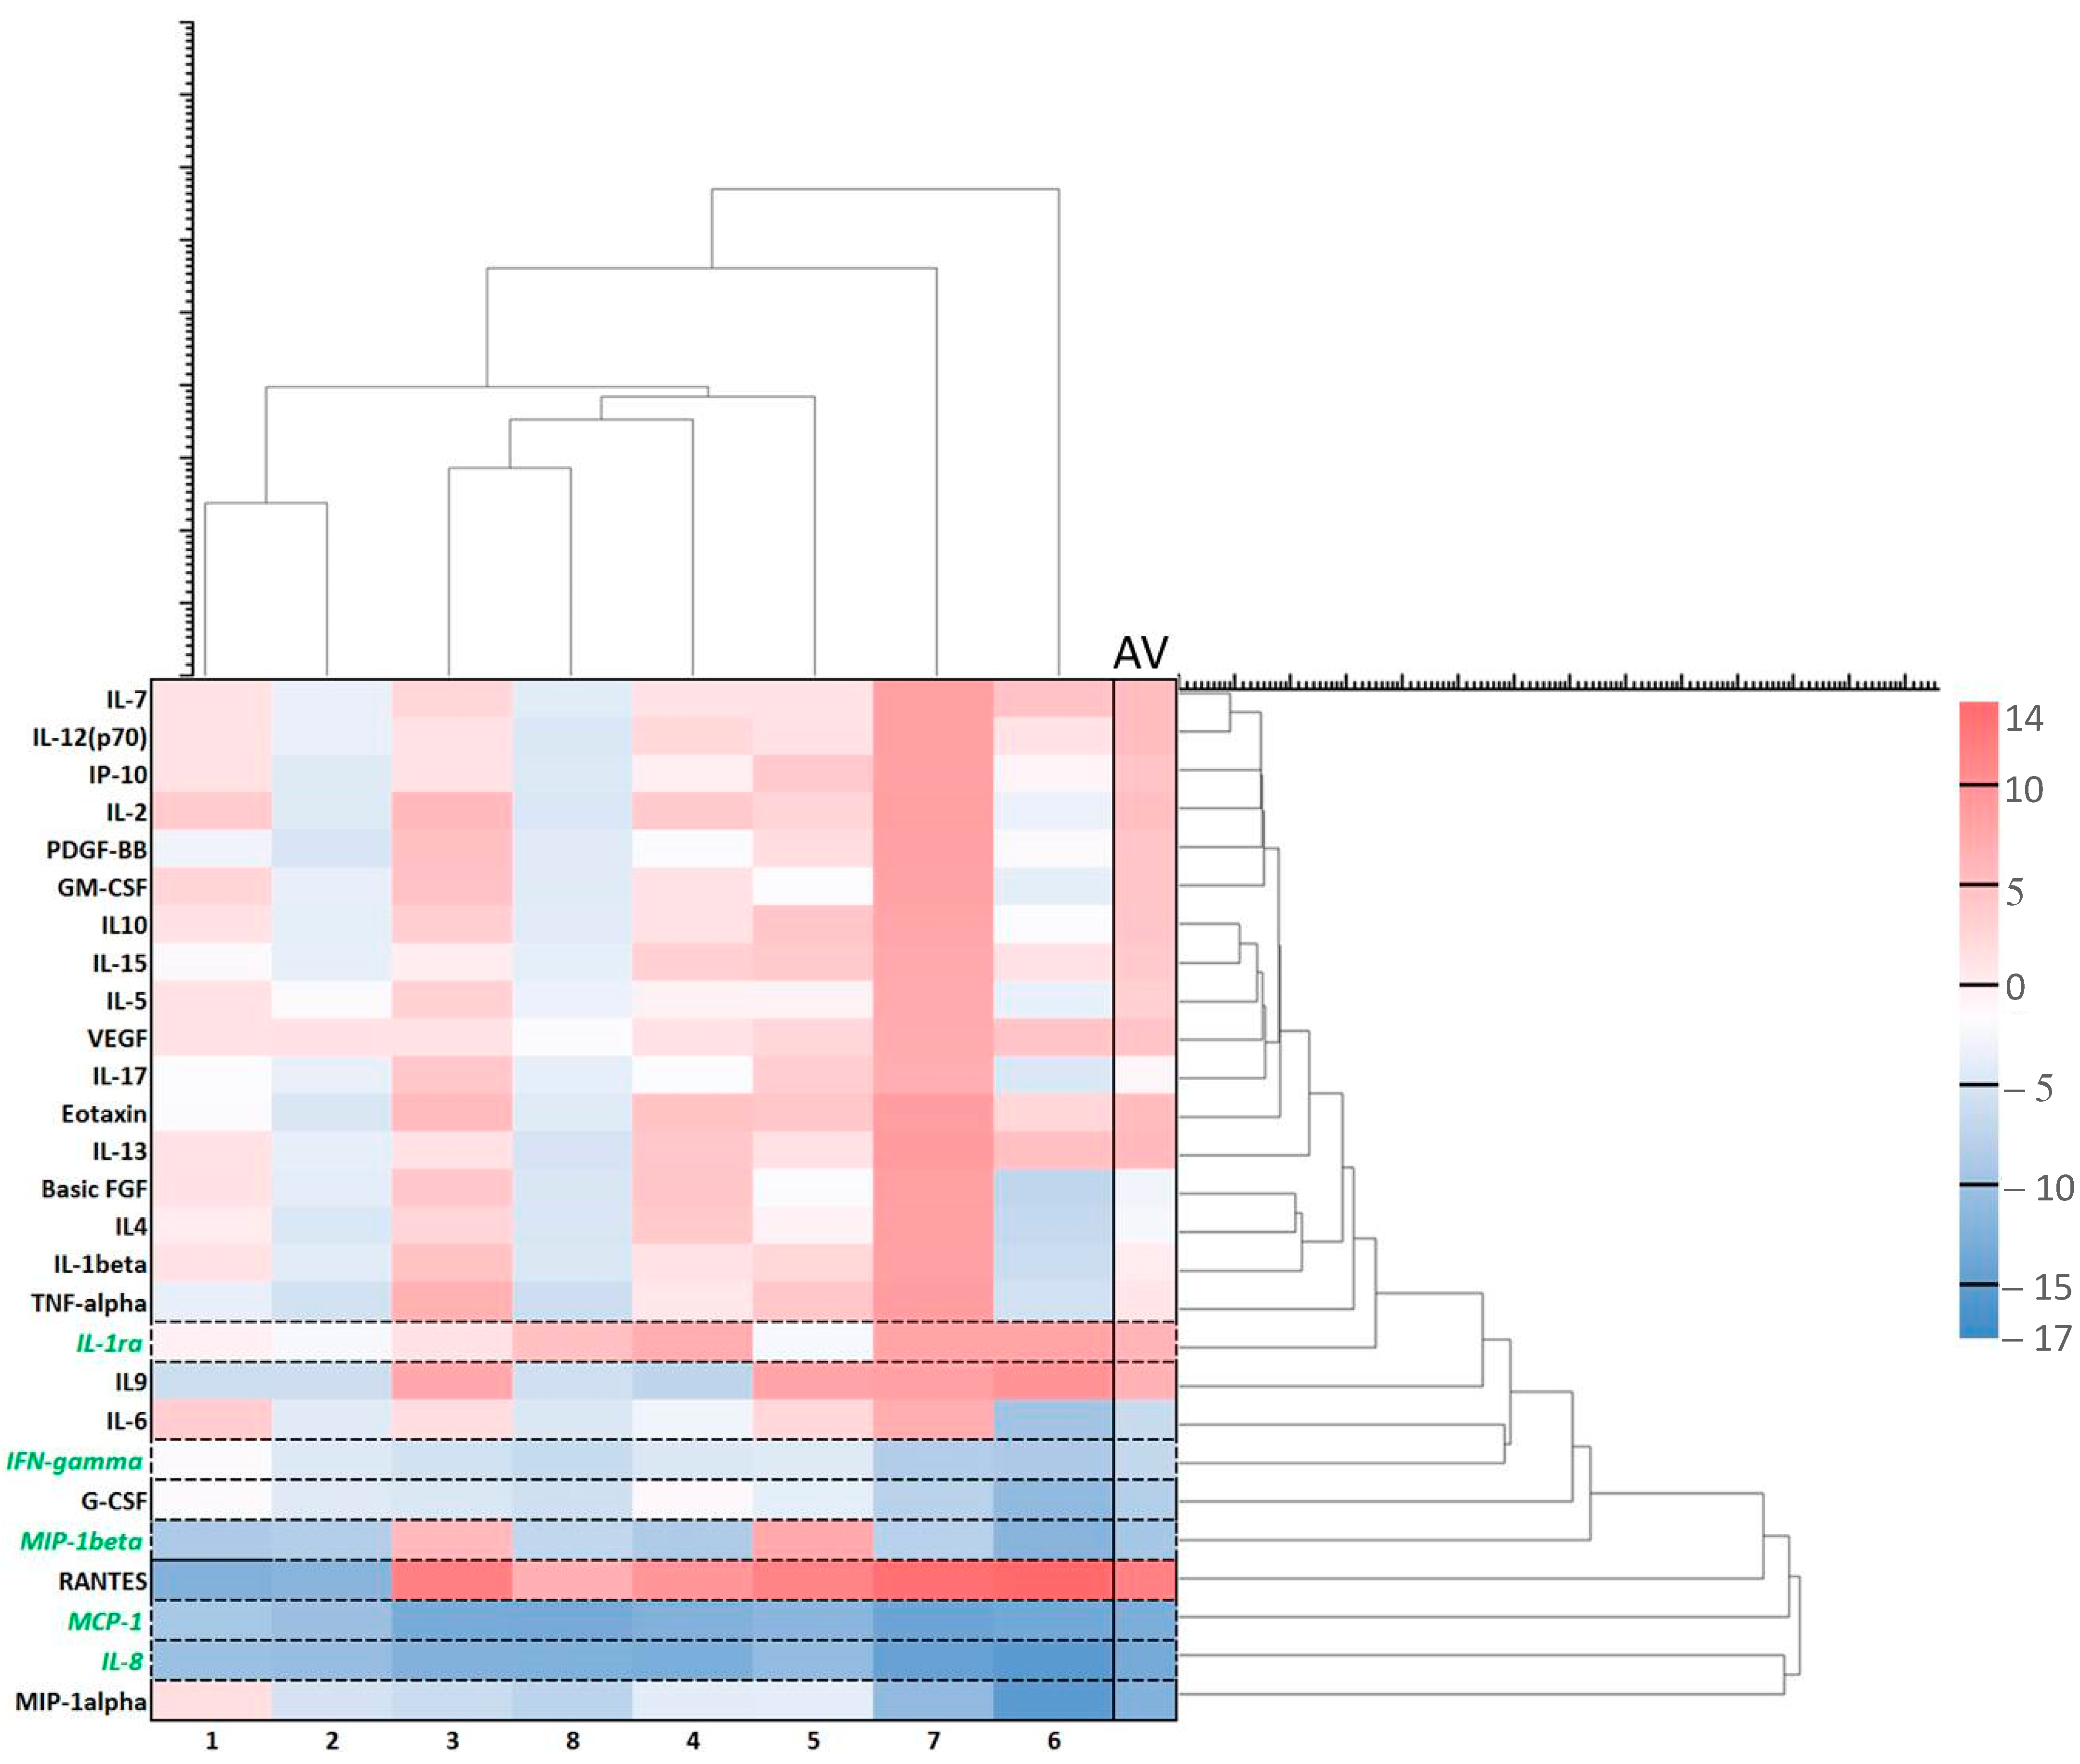
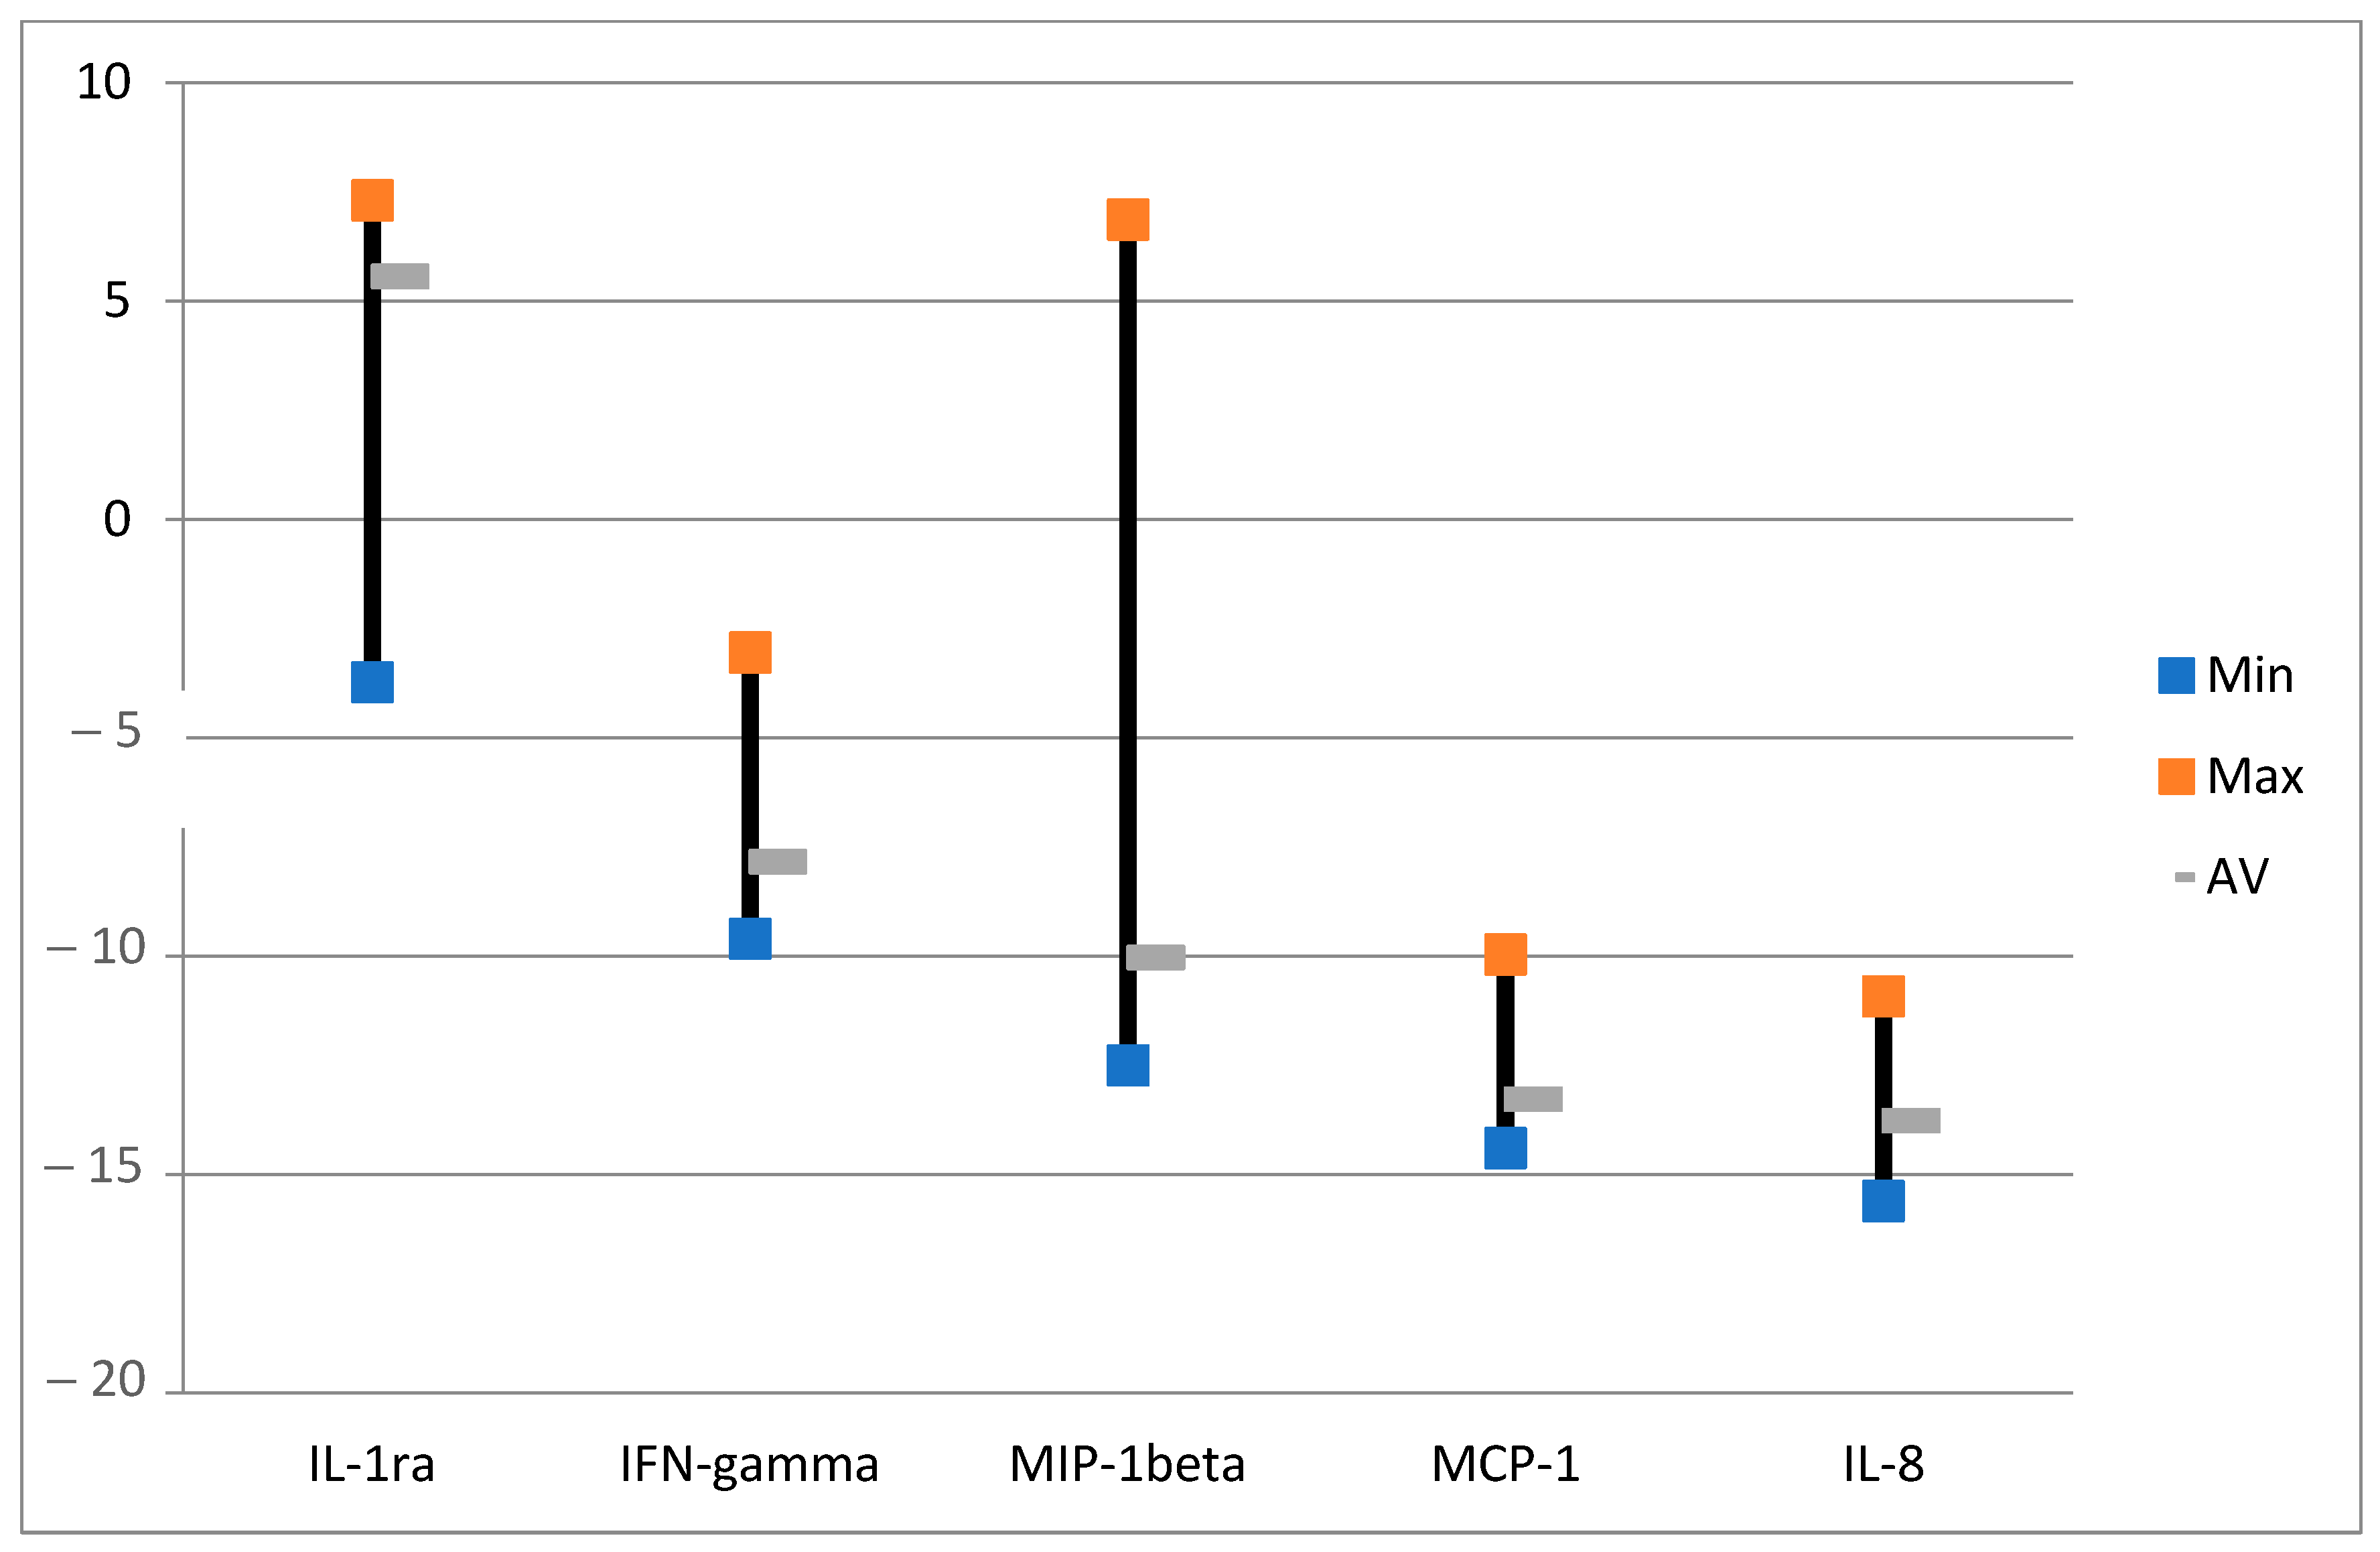
2.4. Effect of ALA and Red Light on Cytokines
2.5. Effect of ALA (Alone) on Exosomes
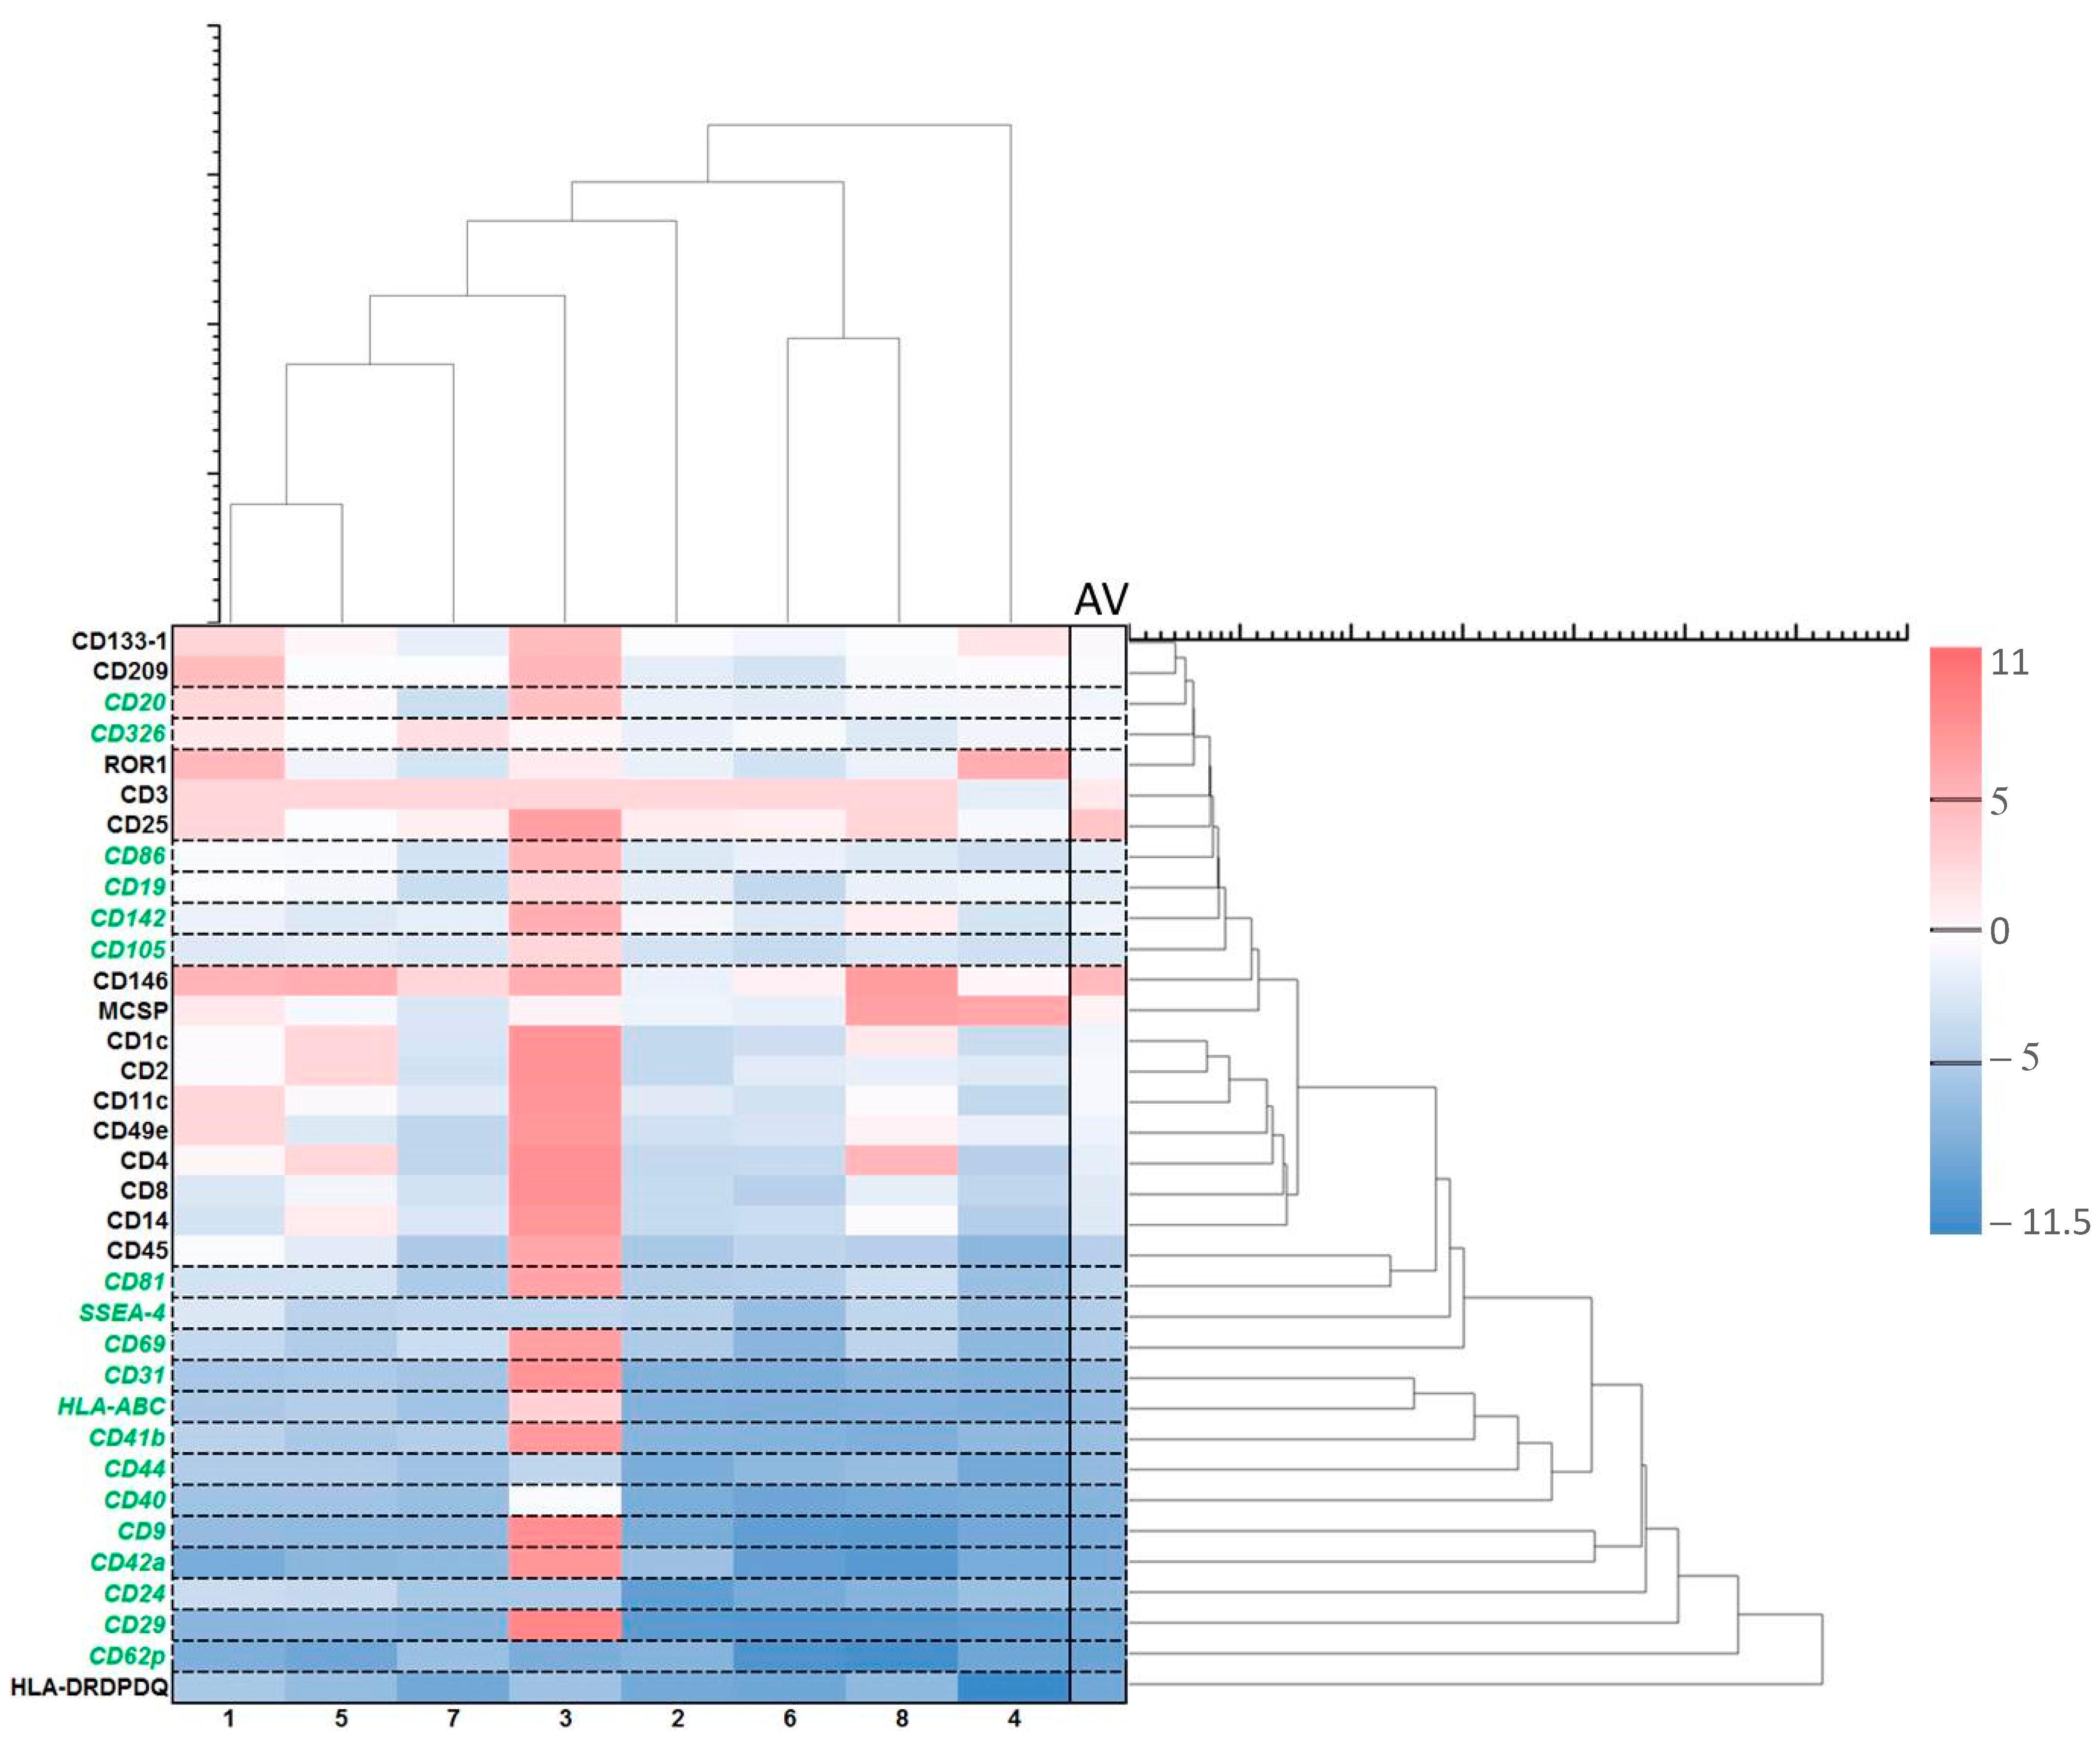
2.6. Effect of ALA and Red Light on Exosomes
3. Materials and Methods
3.1. Patient Population and Inclusion of Samples
3.2. Chemicals
3.3. Isolation and Culture of PBMCs
3.4. Light Source
3.5. PDT Treatment of PBMCs
3.6. Flow Cytometry Analysis
3.7. Isolation, Labelling, and Measurement of Cytokines and Exosomes
3.8. Statistical Analyses and Criteria of Data Selection
4. Conclusions
Supplementary Materials
Author Contributions
Funding
Institutional Review Board Statement
Informed Consent Statement
Data Availability Statement
Acknowledgments
Conflicts of Interest
References
- Dougherty, T.J.; Gomer, C.; Henderson, B.; Jori, G.; Kessel, D.; Korbelik, M.; Moan, J.; Peng, Q. Photodynamic therapy. J. Natl. Cancer Inst. 1998, 90, 889–905. [Google Scholar] [CrossRef] [Green Version]
- van Straten, D.; Mashayekhi, V.; de Bruijn, H.; Oliveira, S.; Robinson, D. Oncologic Photodynamic Therapy: Basic Principles, Current Clinical Status and Future Directions. Cancers 2017, 9, 19. [Google Scholar] [CrossRef] [Green Version]
- Vickerman, B.M.; Zywot, E.; Tarrant, T.; Lawrence, D. Taking phototherapeutics from concept to clinical launch. Nat. Rev. Chem. 2021, 5, 816–834. [Google Scholar] [CrossRef]
- Peng, Q.; Berg, K.; Moan, J.; Kongshaug, M.; Nesland, J.M. 5-Aminolevulinic acid-based photodynamic therapy: Principles and experimental research. Photochem. Photobiol. 1997, 65, 235–251. [Google Scholar] [CrossRef]
- Gold, M.H.; Goldman, M.P. 5-aminolevulinic acid photodynamic therapy: Where we have been and where we are going. Dermatol. Surg. 2004, 30, 1077–1083; discussion 1074–1083. [Google Scholar] [CrossRef]
- Correia, J.H.; Rodrigues, J.A.; Pimenta, S.; Dong, T.; Yang, Z. Photodynamic Therapy Review: Principles, Photosensitizers, Applications, and Future Directions. Pharmaceutics 2021, 13, 1332. [Google Scholar] [CrossRef] [PubMed]
- Casas, A. Clinical uses of 5-aminolaevulinic acid in photodynamic treatment and photodetection of cancer: A review. Cancer Lett. 2020, 490, 165–173. [Google Scholar] [CrossRef] [PubMed]
- Peng, Q.; Juzeniene, A.; Chen, J.; Svaasand, L.O.; Warloe, T.; Giercksky, K.-E.; Moan, J. Lasers in medicine. Rep. Prog. Phys. 2008, 71, 056701. [Google Scholar] [CrossRef]
- Kennedy, J.C.; Pottier, R.H. New trends in photobiology: Endogenous protoporphyrin IX, a clinically useful photosensitizer for photodynamic therapy. J. Photochem. Photobiol. B Biol. 1992, 14, 275–292. [Google Scholar] [CrossRef] [PubMed]
- Gunaydin, G.; Gedik, M.E.; Ayan, S. Photodynamic Therapy for the Treatment and Diagnosis of Cancer-A Review of the Current Clinical Status. Front. Chem. 2021, 9, 686303. [Google Scholar] [CrossRef] [PubMed]
- Stummer, W.; Pichlmeier, U.; Meinel, T.; Wiestler, O.D.; Zanella, F.; Reulen, H.J. Fluorescence-guided surgery with 5-aminolevulinic acid for resection of malignant glioma: A randomised controlled multicentre phase III trial. Lancet Oncol. 2006, 7, 392–401. [Google Scholar] [CrossRef]
- Mahmoudi, K.; Garvey, K.L.; Bouras, A.; Cramer, G.; Stepp, H.; Jesu Raj, J.G.; Bozec, D.; Busch, T.M.; Hadjipanayis, C.G. 5-aminolevulinic acid photodynamic therapy for the treatment of high-grade gliomas. J. Neurooncol. 2019, 141, 595–607. [Google Scholar] [CrossRef]
- Shah, H.A.; Leskinen, S.; Khilji, H.; Narayan, V.; Ben-Shalom, N.; D’Amico, R.S. Utility of 5-ALA for fluorescence-guided resection of brain metastases: A systematic review. J. Neurooncol. 2022, 160, 669–675. [Google Scholar] [CrossRef] [PubMed]
- Inoue, K.; Anai, S.; Fujimoto, K.; Hirao, Y.; Furuse, H.; Kai, F.; Ozono, S.; Hara, T.; Matsuyama, H.; Oyama, M. Oral 5-aminolevulinic acid mediated photodynamic diagnosis using fluorescence cystoscopy for non-muscle-invasive bladder cancer: A randomized, double-blind, multicentre phase II/III study. Photodiagnosis Photodyn. Ther. 2015, 12, 193–200. [Google Scholar] [CrossRef] [PubMed]
- Nakai, Y.; Inoue, K.; Tsuzuki, T.; Shimamoto, T.; Shuin, T.; Nagao, K.; Matsuyama, H.; Oyama, M.; Furuse, H.; Ozono, S. Oral 5-aminolevulinic acid-mediated photodynamic diagnosis using fluorescence cystoscopy for non-muscle-invasive bladder cancer: A multicenter phase III study. Int. J. Urol. 2018, 25, 723–729. [Google Scholar] [CrossRef] [PubMed] [Green Version]
- Morton, C.A.; Szeimies, R.M.; Basset-Seguin, N.; Calzavara-Pinton, P.; Gilaberte, Y.; Haedersdal, M.; Hofbauer, G.F.L.; Hunger, R.E.; Karrer, S.; Piaserico, S.; et al. European Dermatology Forum guidelines on topical photodynamic therapy 2019 Part 1: Treatment delivery and established indications—Actinic keratoses, Bowen’s disease and basal cell carcinomas. J. Eur. Acad. Dermatol. Venereol. 2019, 33, 2225–2238. [Google Scholar] [CrossRef] [PubMed]
- Christensen, E.; Warloe, T.; Kroon, S.; Funk, J.; Helsing, P.; Soler, A.M.; Stang, H.J.; Vatne, O.; Mørk, C. Guidelines for practical use of MAL-PDT in non-melanoma skin cancer. J. Eur. Acad. Dermatol. Venereol. 2010, 24, 505–512. [Google Scholar] [CrossRef]
- Mosquera-Heredia, M.I.; Morales, L.C.; Vidal, O.M.; Barceló, E.; Silvera-Redondo, C.; Vélez, J.I.; Garavito-Galofre, P. Exosomes: Potential Disease Biomarkers and New Therapeutic Targets. Biomedicines 2021, 9, 1061. [Google Scholar] [CrossRef]
- Kalluri, R.; LeBleu, V.S. The biology, function, and biomedical applications of exosomes. Science 2020, 367, eaau6977. [Google Scholar] [CrossRef]
- Gangadaran, P.; Madhyastha, H.; Madhyastha, R.; Rajendran, R.L.; Nakajima, Y.; Watanabe, N.; Velikkakath, A.K.G.; Hong, C.M.; Gopi, R.V.; Muthukalianan, G.K.; et al. The emerging role of exosomes in innate immunity, diagnosis and therapy. Front. Immunol. 2022, 13, 1085057. [Google Scholar] [CrossRef]
- Zhang, Y.; Yang, X.; Zhuang, Z.; Wei, M.; Meng, W.; Deng, X.; Wang, Z. The diagnostic value of exosomal circular RNAs in cancer patients: A systematic review and meta-analysis. Cancer Med. 2023, 12, 1709–1720. [Google Scholar] [CrossRef] [PubMed]
- Gheytanchi, E.; Tajik, F.; Razmi, M.; Babashah, S.; Cho, W.C.S.; Tanha, K.; Sahlolbei, M.; Ghods, R.; Madjd, Z. Circulating exosomal microRNAs as potential prognostic biomarkers in gastrointestinal cancers: A systematic review and meta-analysis. Cancer Cell Int. 2023, 23, 10. [Google Scholar] [CrossRef] [PubMed]
- Baumgart, D.C.; Sandborn, W.J. Crohn’s disease. Lancet 2012, 380, 1590–1605. [Google Scholar] [CrossRef] [PubMed] [Green Version]
- Baumgart, D.C.; Carding, S.R. Inflammatory bowel disease: Cause and immunobiology. Lancet 2007, 369, 1627–1640. [Google Scholar] [CrossRef] [PubMed]
- Torres, J.; Mehandru, S.; Colombel, J.F.; Peyrin-Biroulet, L. Crohn’s disease. Lancet 2017, 389, 1741–1755. [Google Scholar] [CrossRef] [PubMed]
- Rajbhandari, R.; Blakemore, S.; Gupta, N.; Adler, A.J.; Noble, C.A.; Mannan, S.; Nikolli, K.; Yih, A.; Joshi, S.; Bukhman, G. Crohn’s disease in low and lower-middle income countries: A scoping review. World J. Gastroenterol. 2020, 26, 6891–6908. [Google Scholar] [CrossRef] [PubMed]
- Ocansey, D.K.W.; Wang, L.; Wang, J.; Yan, Y.; Qian, H.; Zhang, X.; Xu, W.; Mao, F. Mesenchymal stem cell-gut microbiota interaction in the repair of inflammatory bowel disease: An enhanced therapeutic effect. Clin. Transl. Med. 2019, 8, 31. [Google Scholar] [CrossRef] [Green Version]
- Ayyar, K.K.; Moss, A.C. Exosomes in Intestinal Inflammation. Front. Pharmacol. 2021, 12, 658505. [Google Scholar] [CrossRef]
- Feuerstein, J.D.; Cheifetz, A.S. Crohn Disease: Epidemiology, Diagnosis, and Management. Mayo Clin. Proc. 2017, 92, 1088–1103. [Google Scholar] [CrossRef] [Green Version]
- Cai, Z.; Wang, S.; Li, J. Treatment of Inflammatory Bowel Disease: A Comprehensive Review. Front. Med. 2021, 8, 765474. [Google Scholar] [CrossRef]
- Soler, D.; Chapman, T.; Yang, L.L.; Wyant, T.; Egan, R.; Fedyk, E.R. The binding specificity and selective antagonism of vedolizumab, an anti-alpha4beta7 integrin therapeutic antibody in development for inflammatory bowel diseases. J. Pharmacol. Exp. Ther. 2009, 330, 864–875. [Google Scholar] [CrossRef] [Green Version]
- Sandborn, W.J.; Feagan, B.G.; Rutgeerts, P.; Hanauer, S.; Colombel, J.F.; Sands, B.E.; Lukas, M.; Fedorak, R.N.; Lee, S.; Bressler, B.; et al. Vedolizumab as induction and maintenance therapy for Crohn’s disease. N. Engl. J. Med. 2013, 369, 711–721. [Google Scholar] [CrossRef] [Green Version]
- Goll, R.; Moe, Ø.K.; Johnsen, K.M.; Meyer, R.; Friestad, J.; Gundersen, M.D.; Kileng, H.; Johnsen, K.; Florholmen, J.R. Pharmacodynamic mechanisms behind a refractory state in inflammatory bowel disease. BMC Gastroenterol. 2022, 22, 464. [Google Scholar] [CrossRef] [PubMed]
- Knobler, R.; Berlin, G.; Calzavara-Pinton, P.; Greinix, H.; Jaksch, P.; Laroche, L.; Ludvigsson, J.; Quaglino, P.; Reinisch, W.; Scarisbrick, J.; et al. Guidelines on the use of extracorporeal photopheresis. J. Eur. Acad. Dermatol. Venereol. 2014, 28 (Suppl. S1), 1–37. [Google Scholar] [CrossRef] [Green Version]
- Reinisch, W.; Knobler, R.; Rutgeerts, P.J.; Ochsenkuhn, T.; Anderson, F.; von Tirpitz, C.; Kaatz, M.; Janneke van der Woude, C.; Parenti, D.; Mannon, P.J. Extracorporeal photopheresis (ECP) in patients with steroid-dependent Crohn’s disease: An open-label, multicenter, prospective trial. Inflamm. Bowel Dis. 2013, 19, 293–300. [Google Scholar] [CrossRef] [PubMed]
- Abreu, M.T.; von Tirpitz, C.; Hardi, R.; Kaatz, M.; Van Assche, G.; Rutgeerts, P.; Bisaccia, E.; Goerdt, S.; Hanauer, S.; Knobler, R.; et al. Extracorporeal photopheresis for the treatment of refractory Crohn’s disease: Results of an open-label pilot study. Inflamm. Bowel Dis. 2009, 15, 829–836. [Google Scholar] [CrossRef]
- Reinisch, W.; Nahavandi, H.; Santella, R.; Zhang, Y.; Gasche, C.; Moser, G.; Waldhor, T.; Gangl, A.; Vogelsang, H.; Knobler, R. Extracorporeal photochemotherapy in patients with steroid-dependent Crohn’s disease: A prospective pilot study. Aliment. Pharmacol. Ther. 2001, 15, 1313–1322. [Google Scholar] [CrossRef]
- Christensen, E.; Foss, O.A.; Quist-Paulsen, P.; Staur, I.; Pettersen, F.; Holien, T.; Juzenas, P.; Peng, Q. Application of Photodynamic Therapy with 5-Aminolevulinic Acid to Extracorporeal Photopheresis in the Treatment of Patients with Chronic Graft-versus-Host Disease: A First-in-Human Study. Pharmaceutics 2021, 13, 1558. [Google Scholar] [CrossRef] [PubMed]
- Christensen, E. Modification of Extracorporeal Photopheresis Technology with 5-Aminolevulinic Acid in Patients with Cutaneous T-Cell Lymphoma or Chronic Graft-Versus-Host Disease—A Proof-of-Concept Study. Available online: https://ichgcp.net/clinical-trials-registry/NCT03109353 (accessed on 10 December 2022).
- Grievink, H.W.; Luisman, T.; Kluft, C.; Moerland, M.; Malone, K.E. Comparison of Three Isolation Techniques for Human Peripheral Blood Mononuclear Cells: Cell Recovery and Viability, Population Composition, and Cell Functionality. Biopreserv. Biobank. 2016, 14, 410–415. [Google Scholar] [CrossRef] [PubMed]
- Ramani, T.; Auletta, C.S.; Weinstock, D.; Mounho-Zamora, B.; Ryan, P.C.; Salcedo, T.W.; Bannish, G. Cytokines: The Good, the Bad, and the Deadly. Int. J. Toxicol. 2015, 34, 355–365. [Google Scholar] [CrossRef]
- Boucher, G.; Paradis, A.; Chabot-Roy, G.; Coderre, L.; Hillhouse, E.E.; Bitton, A.; Des Rosiers, C.; Levings, M.K.; Schumm, L.P.; Lazarev, M.; et al. Serum Analyte Profiles Associated With Crohn’s Disease and Disease Location. Inflamm. Bowel Dis. 2022, 28, 9–20. [Google Scholar] [CrossRef]
- Korkmaz, A.; Oyar, E.O.; Yildirim, Z.; Pampal, A.; Unlu, N.L.; Akbulut, H. Application of vascular endothelial growth factor at different phases of intestinal ischemia/reperfusion: What are its effects on oxidative stress, inflammation and telomerase activity? Adv. Clin. Exp. Med. 2020, 29, 1417–1424. [Google Scholar] [CrossRef]
- Yang, Y.; Shen, S.; Cao, Y.; Wang, D.; Kang, Z.; Wang, P.; Wang, X. Remodeling Lymphatic Vessels in Intrinsically Aged Skin on SKH-1 Mouse Using Low Dose 5-aminolevulinic Acid Photodynamic Therapy via VEGF-C/VEGFR3 Pathway. Photodiagnosis Photodyn. Ther. 2022, 38, 102851. [Google Scholar] [CrossRef]
- Guo, F.; Zhou, Q.; Wu, Y.; Chen, M.; Zhao, L.; Xiang, H. Emodin Alleviates Sodium Taurocholate-Induced Pancreatic Ductal Cell Damage by Inhibiting the S100A9/VNN1 Signaling Pathway. Pancreas 2022, 51, 739–746. [Google Scholar] [CrossRef]
- Li, J.; Chen, S.; Xiao, X.; Zhao, Y.; Ding, W.; Li, X.C. IL-9 and Th9 cells in health and diseases-from tolerance to immunopathology. Cytokine Growth Factor Rev. 2017, 37, 47–55. [Google Scholar] [CrossRef]
- Chen, J.; Wang, H.; Wu, Z.; Gu, H.; Li, C.; Wang, S.; Liu, G. Effects of 5-aminolevulinic acid on the inflammatory responses and antioxidative capacity in broiler chickens challenged with lipopolysaccharide. Animal 2022, 16, 100575. [Google Scholar] [CrossRef] [PubMed]
- Adar, T.; Shteingart, S.; Ben Ya’acov, A.; Bar-Gil Shitrit, A.; Goldin, E. From airway inflammation to inflammatory bowel disease: Eotaxin-1, a key regulator of intestinal inflammation. Clin. Immunol. 2014, 153, 199–208. [Google Scholar] [CrossRef]
- Mukanova, S.; Borissenko, A.; Kim, A.; Bolatbek, A.; Abdrakhmanova, A.; Vangelista, L.; Sonnenberg-Riethmacher, E.; Riethmacher, D. Role of periostin in inflammatory bowel disease development and synergistic effects mediated by the CCL5-CCR5 axis. Front. Immunol. 2022, 13, 956691. [Google Scholar] [CrossRef] [PubMed]
- Snyder-Cappione, J.E.; Tincati, C.; Eccles-James, I.G.; Cappione, A.J.; Ndhlovu, L.C.; Koth, L.L.; Nixon, D.F. A comprehensive ex vivo functional analysis of human NKT cells reveals production of MIP1-α and MIP1-β, a lack of IL-17, and a Th1-bias in males. PLoS ONE 2010, 5, e15412. [Google Scholar] [CrossRef] [Green Version]
- Marafini, I.; Sedda, S.; Dinallo, V.; Monteleone, G. Inflammatory cytokines: From discoveries to therapies in IBD. Expert Opin. Biol. Ther. 2019, 19, 1207–1217. [Google Scholar] [CrossRef] [PubMed]
- Gaiani, F.; Rotoli, B.M.; Ferrari, F.; Barilli, A.; Visigalli, R.; Carra, M.C.; de’Angelis, G.L.; de’Angelis, N.; Dall’Asta, V. Monocytes from infliximab-resistant patients with Crohn’s disease exhibit a disordered cytokine profile. Sci. Rep. 2020, 10, 12238. [Google Scholar] [CrossRef]
- Linares, R.; Gutiérrez, A.; Márquez-Galera, Á.; Caparrós, E.; Aparicio, J.R.; Madero, L.; Payá, A.; López-Atalaya, J.P.; Francés, R. Transcriptional regulation of chemokine network by biologic monotherapy in ileum of patients with Crohn’s disease. Biomed. Pharmacother. 2022, 147, 112653. [Google Scholar] [CrossRef]
- Valter, M.; Verstockt, S.; Finalet Ferreiro, J.A.; Cleynen, I. Extracellular Vesicles in Inflammatory Bowel Disease: Small Particles, Big Players. J. Crohns Colitis 2021, 15, 499–510. [Google Scholar] [CrossRef]
- Nazari, H.; Alborzi, F.; Heirani-Tabasi, A.; Hadizadeh, A.; Asbagh, R.A.; Behboudi, B.; Fazeli, M.S.; Rahimi, M.; Keramati, M.R.; Keshvari, A.; et al. Evaluating the safety and efficacy of mesenchymal stem cell-derived exosomes for treatment of refractory perianal fistula in IBD patients: Clinical trial phase I. Gastroenterol. Rep. 2022, 10, goac075. [Google Scholar] [CrossRef]
- Zhang, Y.; Bi, J.; Huang, J.; Tang, Y.; Du, S.; Li, P. Exosome: A Review of Its Classification, Isolation Techniques, Storage, Diagnostic and Targeted Therapy Applications. Int. J. Nanomed. 2020, 15, 6917–6934. [Google Scholar] [CrossRef]
- Espeland, K.; Kleinauskas, A.; Juzenas, P.; Brech, A.; Darvekar, S.; Vasovic, V.; Warloe, T.; Christensen, E.; Jahnsen, J.; Peng, Q. Photodynamic Effects with 5-Aminolevulinic Acid on Cytokines and Exosomes in Human Peripheral Blood Mononuclear Cells. Biomedicines 2022, 10, 232. [Google Scholar] [CrossRef]
- Lee, G.H.; Askari, A.; Malietzis, G.; Bernardo, D.; Clark, S.K.; Knight, S.C.; Al-Hassi, H.O. The role of CD40 expression in dendritic cells in cancer biology; a systematic review. Curr. Cancer Drug Targets 2014, 14, 610–620. [Google Scholar] [CrossRef] [PubMed]
- Nicolet, B.P.; Guislain, A.; van Alphen, F.P.J.; Gomez-Eerland, R.; Schumacher, T.N.M.; van den Biggelaar, M.; Wolkers, M.C. CD29 identifies IFN-γ-producing human CD8(+) T cells with an increased cytotoxic potential. Proc. Natl. Acad. Sci. USA 2020, 117, 6686–6696. [Google Scholar] [CrossRef]
- Zhu, Y.; Feng, Y.; Liu, H.; Ye, H.; Guo, C.; Feng, J.; Dai, S.; Zheng, X. CD4+CD29+T cells are blamed for the persistent inflammatory response in ulcerative colitis. Int. J. Clin. Exp. Pathol. 2015, 8, 2627–2637. [Google Scholar] [PubMed]
- Lertkiatmongkol, P.; Liao, D.; Mei, H.; Hu, Y.; Newman, P.J. Endothelial functions of platelet/endothelial cell adhesion molecule-1 (CD31). Curr. Opin. Hematol. 2016, 23, 253–259. [Google Scholar] [CrossRef] [PubMed] [Green Version]
- Hume, G.E.; Doecke, J.D.; Huang, N.; Fowler, E.V.; Brown, I.S.; Simms, L.A.; Radford-Smith, G.L. Altered Expression of Angiotensinogen and Mediators of Angiogenesis in Ileal Crohn’s Disease. J. Gastrointestin. Liver Dis. 2016, 25, 39–48. [Google Scholar] [CrossRef]
- Xu, Z.; Chen, J.J.; Mei, Q.; Li, Y.; Xu, J. Expression of 5-hydroxytryptamine 7 receptor in intestinal mucosa correlates with the degree of intestinal inflammation in Crohn’s disease. BMC Gastroenterol. 2022, 22, 457. [Google Scholar] [CrossRef]
- Keller, L.; Werner, S.; Pantel, K. Biology and clinical relevance of EpCAM. Cell Stress 2019, 3, 165–180. [Google Scholar] [CrossRef] [Green Version]
- Castellani, C.; Burrello, J.; Fedrigo, M.; Burrello, A.; Bolis, S.; Di Silvestre, D.; Tona, F.; Bottio, T.; Biemmi, V.; Toscano, G.; et al. Circulating extracellular vesicles as non-invasive biomarker of rejection in heart transplant. J. Heart Lung Transplant. 2020, 39, 1136–1148. [Google Scholar] [CrossRef] [PubMed]
- Nolan-Stevaux, O.; Zhong, W.; Culp, S.; Shaffer, K.; Hoover, J.; Wickramasinghe, D.; Ruefli-Brasse, A. Endoglin requirement for BMP9 signaling in endothelial cells reveals new mechanism of action for selective anti-endoglin antibodies. PLoS ONE 2012, 7, e50920. [Google Scholar] [CrossRef] [Green Version]
- Atlas, T.H.P. The Human Protein Atlas. Available online: https://www.proteinatlas.org/ (accessed on 17 December 2022).
- Uhlen, M.; Karlsson, M.J.; Zhong, W.; Tebani, A.; Pou, C.; Mikes, J.; Lakshmikanth, T.; Forsström, B.; Edfors, F.; Odeberg, J.; et al. A genome-wide transcriptomic analysis of protein-coding genes in human blood cells. Science 2019, 366, eaax9198. [Google Scholar] [CrossRef] [PubMed]
- Lai, R.C.; Arslan, F.; Lee, M.M.; Sze, N.S.; Choo, A.; Chen, T.S.; Salto-Tellez, M.; Timmers, L.; Lee, C.N.; El Oakley, R.M.; et al. Exosome secreted by MSC reduces myocardial ischemia/reperfusion injury. Stem Cell Res. 2010, 4, 214–222. [Google Scholar] [CrossRef] [PubMed] [Green Version]
- Sumiyoshi, N.; Ishitobi, H.; Miyaki, S.; Miyado, K.; Adachi, N.; Ochi, M. The role of tetraspanin CD9 in osteoarthritis using three different mouse models. Biomed. Res. 2016, 37, 283–291. [Google Scholar] [CrossRef] [Green Version]


| Item | Mean (Range) | Reference Values |
|---|---|---|
| Sex | 5 M, 3 F | - |
| Age (yrs.) | 51 (30–77) | - |
| Fecal calprotectin (µg/mg) | 1460 (542–2760) | <250 |
| CRP (mg/L) | 50 (2–130) | <5 |
| Simple Endoscopic Score for CD (SES-CD) | 10 (6–15) | <3 |
Disclaimer/Publisher’s Note: The statements, opinions and data contained in all publications are solely those of the individual author(s) and contributor(s) and not of MDPI and/or the editor(s). MDPI and/or the editor(s) disclaim responsibility for any injury to people or property resulting from any ideas, methods, instructions or products referred to in the content. |
© 2023 by the authors. Licensee MDPI, Basel, Switzerland. This article is an open access article distributed under the terms and conditions of the Creative Commons Attribution (CC BY) license (https://creativecommons.org/licenses/by/4.0/).
Share and Cite
Espeland, K.; Kleinauskas, A.; Juzenas, P.; Darvekar, S.; Vasovic, V.; Warloe, T.; Christensen, E.; Jahnsen, J.; Peng, Q. Photodynamic Effects with 5-Aminolevulinic Acid on Cytokines and Exosomes in Human Peripheral Blood Mononuclear Cells from Patients with Crohn’s Disease. Int. J. Mol. Sci. 2023, 24, 4554. https://doi.org/10.3390/ijms24054554
Espeland K, Kleinauskas A, Juzenas P, Darvekar S, Vasovic V, Warloe T, Christensen E, Jahnsen J, Peng Q. Photodynamic Effects with 5-Aminolevulinic Acid on Cytokines and Exosomes in Human Peripheral Blood Mononuclear Cells from Patients with Crohn’s Disease. International Journal of Molecular Sciences. 2023; 24(5):4554. https://doi.org/10.3390/ijms24054554
Chicago/Turabian StyleEspeland, Kristian, Andrius Kleinauskas, Petras Juzenas, Sagar Darvekar, Vlada Vasovic, Trond Warloe, Eidi Christensen, Jørgen Jahnsen, and Qian Peng. 2023. "Photodynamic Effects with 5-Aminolevulinic Acid on Cytokines and Exosomes in Human Peripheral Blood Mononuclear Cells from Patients with Crohn’s Disease" International Journal of Molecular Sciences 24, no. 5: 4554. https://doi.org/10.3390/ijms24054554