Article

Karyotype Analysis, Genomic and Fluorescence In Situ Hybridization (GISH and FISH) Reveal the Ploidy and Parental Origin of Chromosomes in Paeonia Itoh Hybrids

Institute of Vegetables and Flowers, Chinese Academy of Agricultural Sciences, Key Laboratory of Biology and Genetic Improvement of Horticultural Crops, Ministry of Agriculture and Rural Affairs, Beijing 100081, China
*
Authors to whom correspondence should be addressed.
These authors contributed equally to this work.
Int. J. Mol. Sci. 2022, 23(19), 11406; https://doi.org/10.3390/ijms231911406
Submission received: 8 September 2022 / Revised: 22 September 2022 / Accepted: 26 September 2022 / Published: 27 September 2022
(This article belongs to the Collection Feature Papers in Molecular Genetics and Genomics)

Abstract

:
Itoh hybrids are intersectional hybrids in Paeonia L. with sect. Moutan and sect. Paeonia as paternal and maternal parents, respectively. Therefore, these hybrids have herbaceous stems with improved ornamental value introduced by the paternal parent. Although both of their parents are diploids, Itoh hybrids are triploids. Moreover, the parental origin of their chromosomes has not been extensively studied. This study systematically analyzed the genome size, ploidy, and karyotype of Itoh hybrids and compared them with their parental taxa. Although the monoploid genome size of Itoh hybrids was different, it was not significantly different from that of the parents. However, the size of varieties in the two parental taxa was significantly different from the wild species, probably due to genome rearrangements caused by artificial selection. Further karyotype analysis, correlation analysis, and hierarchical clustering could not identify the parental origin of chromosomes in Itoh hybrids. Verification through genomic and fluorescence in situ hybridization (GISH and FISH) suggested that for the three sets of chromosomes in Itoh hybrids, two were from the paternal parent, and one was from the maternal parent. One of the first two sets was from wild species, and the other from a cultivated variety. GISH could not label the chromosomes of cultivated peonies from the sect. Moutan, probably due to the huge and complex genomes compared with the wild species. Meanwhile, 5S rDNA-based FISH was first applied in Paeonia, which may be used for ploidy assessment. This work may give insights into the utilization of Itoh hybrid resources.

1. Introduction

Peony (Paeonia L.), both tree and herbaceous, is one of the most important ornamental plants worldwide, with high economic and humanistic values. Tree peony has over 1000 cultivars and is widely used as garden or pot flowers [1]. Herbaceous peony is common in the cut-flower market, especially as a love flower [2]. Paeonia L. is the only genus of Paeoniaceae and has around 40 species, which can be further divided into three sections (Moutan, Paeonia, and Onaepia). Sect. Moutan has nine species (tree peonies) native to China. Sect. Paeonia is the largest section and has about 27 species (herbaceous peonies), mainly native to Asia and Europe. Sect. Onaepia has only two species (herbaceous peonies) native to North America [3,4]. In addition to tree and herbaceous peonies, the Itoh hybrid is another hybrid peony group. The Itoh hybrid is the intersectional hybrid of sect. Moutan and sect. Paeonia, as paternal and maternal parents, respectively, and was first cultivated by Toichi Itoh in 1948. All Itoh hybrids are herbaceous as the stem grows quickly in spring and dies in autumn. They look more similar to tree peony with increased color range and flares at the petal base and are thus preferred for cut flowers [5].
Chromosomes (present as a pair) are the main carriers of genetic information in flowering plants. Polyploidy (whole genome duplication), which refers to the repetition of all sequences in the genome, provides the original genetic material for biological evolution and makes the plant genome recombine rapidly. Chromosomes undergo diploidization in most plants during evolution, thus forming polyploids (autopolyploid and allopolyploid). Autopolyploids are via intraspecific genome duplication, which contain chromosomes from the same species, while allopolyploids are via the merging of distinct species through hybridization and subsequent genome duplication, which contain chromosomes from different species [6]. In addition to diploidy, tetraploidy and hexaploidy are also common in natural or artificially selected varieties. They usually have enlarged organs for improving the agronomic traits in many crops and ornamental value in ornamental plants, such as tetraploid potato (Solanum tuberosum L.) and cotton (Gossypium spp.) [7,8], hexaploid wheat (Triticum aestivum L.) and chrysanthemum (Chrysanthemum morifolium Ramat.) [9,10], and octoploid strawberry (Fragaria × ananassa) and triticale (×Triticosecale Wittmack) [11,12]. The odd polyploid varieties are also domesticated for special breeding purposes, such as triploid seedless watermelon [13].
Karyotype analysis is a traditional cytogenetic method that compares chromosome morphology and number among different species or varieties to provide insight into the origin and evolution of plant species, molecular phylogeny, and floristic geography. It also classifies plant species rapidly, as well as confirming alien disomic addition lines in breeding by identifying several basic cytological parameters [14,15,16]. The number of chromosomes and karyotype of a species or variety is usually stable. Differences in these parameters between populations usually lead to reproductive isolation in most cases, maintaining the purity and stability of a species. Arm ratio, the longest chromosome to the shortest chromosome ratio, represents the basic karyotype of a cultivar. The combination of arm ratio and the proportion of chromosomes with chromosome arm ratio less than 2:1 refers to a karyotype classification known as Stebbins’s classification [17]. Chromosome arm ratio, the long arm to the short arm of each chromosome, is also one of the key chromosome traits. Based on this parameter, the chromosome can be divided into four types: (1) metacentrics, the centromere is in the median point (M, 1.0) or median region (m, 1.0–1.7); (2) submetacentrics, the centromere is in the submedian region (sm, 1.7–3.0); (3) subtelocentrics, the centromere is in the subterminal region (st, 3.0–7.0); (4) telocentrics, the centromere is in the terminal region (t, 7.0–∞) or terminal point (T, ∞) [18].
So far, karyotype analysis has been wildly used for species identification, cytotaxonomy study, and molecular phylogenetic analysis in plant and other organisms [15,19,20,21,22,23]. Although the morphology-based karyotype analysis is simple and easy to operate, it has some limitations. For example, it cannot distinguish between individual chromosomes with similar morphology, size, and parental origin from a pair of chromosomes [24]. As a result, genomic in situ hybridization (GISH) on plant chromosomes has been introduced into molecular cytogenetics, in which a specific genomic DNA, i.e., one of the parents of hybrid offspring, is labeled as the probe, and the unlabeled DNA from other species as a blocking agent [25]. In this system, the labeled probe, especially the specific dispersed repetitive sequences, can hybridize to only one of the two sets of chromosomes to identify its origin [26]. The introduction helps to build a bridge between the cytological and molecular approaches and provide a useful tool for analyzing the genome structure of polyploid species and hybrid plants, especially distinguishing between parental genomes in interspecific plant hybrids without genomic background requirement [27,28]. Similar to GISH, fluorescence in situ hybridization (FISH) is also an effective method developed for chromosome analysis, which further helps to locate the same chromosomes or specific loci in a different set of polyploids, thus determining the copy numbers of a specific locus in polyploid plants [29]. FISH analysis may provide more details on nucleolar organizing region and ploidy when 45S and 5S ribosomal DNAs (rDNAs) are used as probes, respectively, although disputes still occurred on the relationship of 5S rDNA and ploidy [30,31,32]. rDNA is a highly conserved tandem repeat sequence that ubiquitously exists in plants as well as in bacteria and animals, while 45S and 5S belong to the major and minor gene classes, respectively, encoding different molecular sizes of rRNAs [33,34]. Therefore, the combination of GISH and FISH may accurately identify the parental origin of specific loci or chromosomes in the hybrid offspring, which has been successfully applied in ornamental plants as an efficient molecular cytogenetic tool for improving interspecific hybridization-based breeding, especially for the identification and transfer of specific genes from alien to native species [24].
All the nine wild tree peony species in Paeonia L. and their cultivars are diploid (2n = 2x = 10), while herbaceous peony has a complex genetic background with both diploids (P. lactiflora and P. obovata) and tetraploids (P. officinalis and P. mairei) (2n = 4x = 20) occurring in different species and some triploids (2n = 3x = 15) in the hybrid cultivars from the parents with different ploidies [35]. All the reported Itoh hybrid varieties are triploid, and for most, the maternal parent is the diploid P. lactiflora, while for all, the paternal parent is tree peony, with most as diploid P. delavayi var. lutea or its hybrid. In this study, 30 peony species or cultivars, including six in sect. Moutan, six in sect. Paeonia, and 18 Itoh hybrids were selected for karyotype analysis. Four representative Itoh hybrids were selected for GISH and FISH determination to further assess the genetic relationship between Itoh hybrids and their long-distant parents.

2. Results

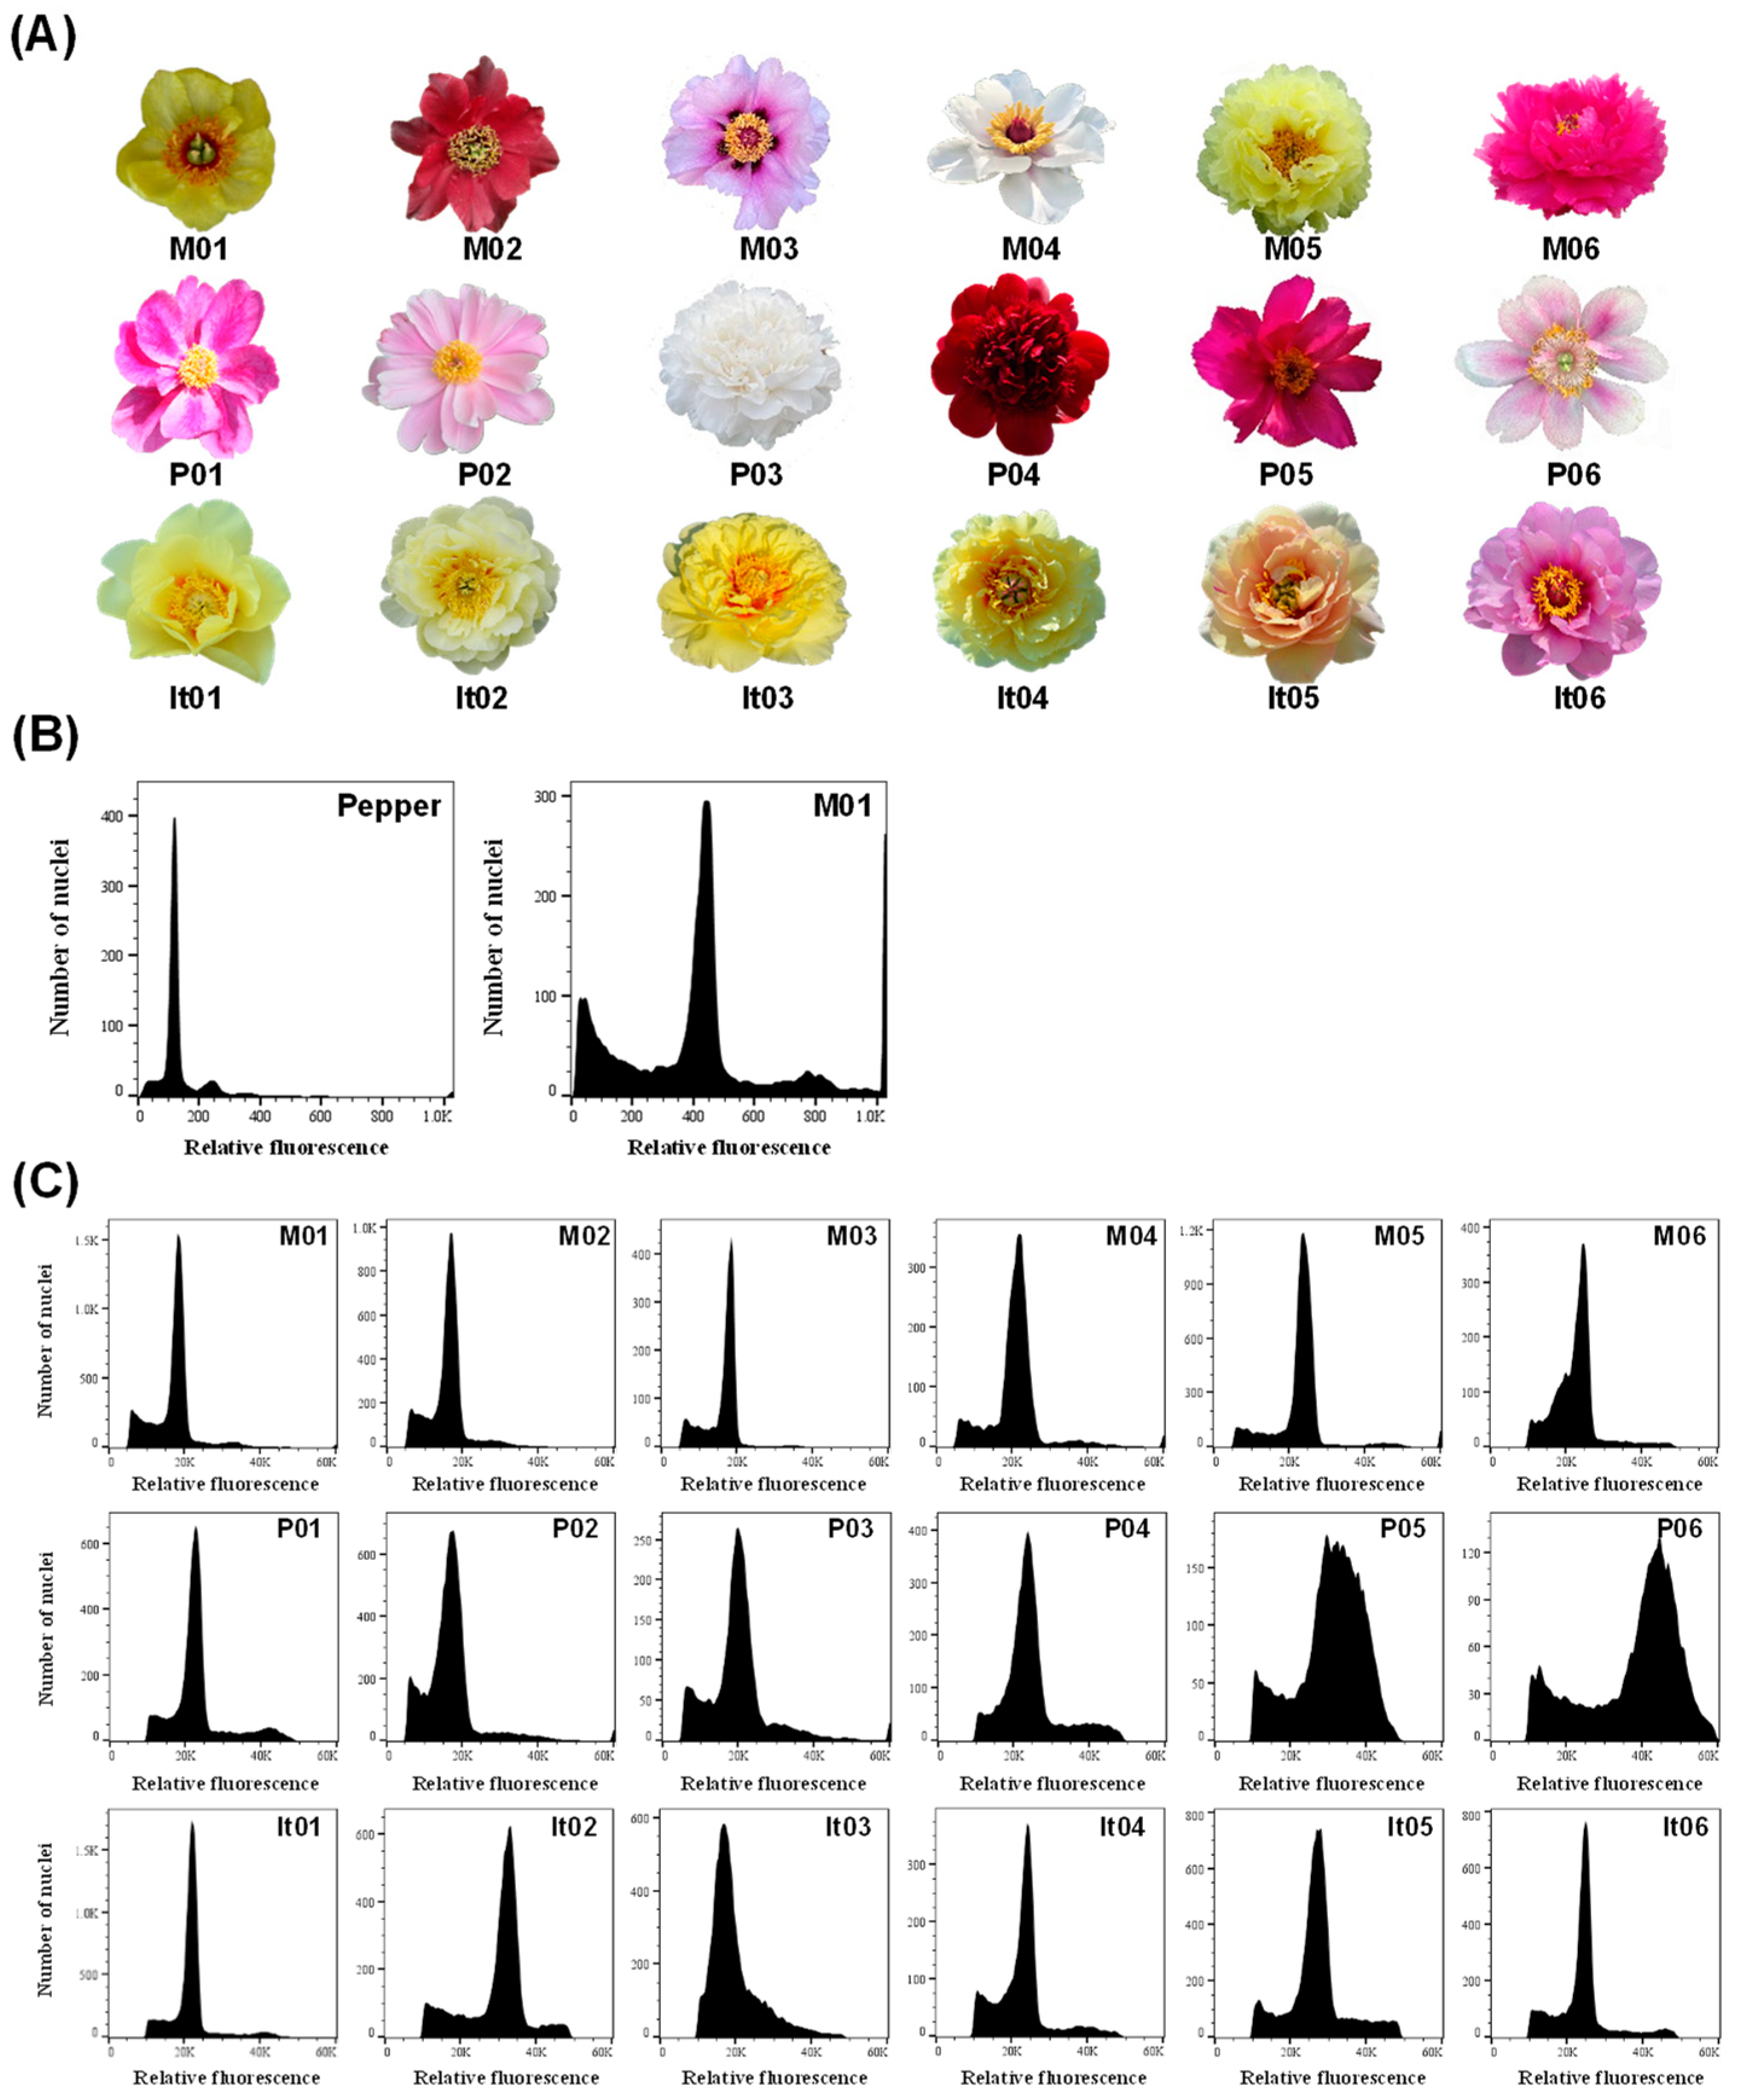
2.1. Genome Size and Ploidy Analysis of Different Materials in Paeonia L.

In this study, the relative ploidy and genome size of 18 representative peony materials of three taxa, including sect. Moutan (M01–M06), sect. Paeonia (P01–P06), and Itoh hybrids (It01–It06) was first estimated (Table S1). The flow cytometric measurements showed that all the materials had clear and sharp peaks, except for P05 and P06 with much wider peaks (Figure 1). To compare the ploidy, the reading number of M01 in flow cytometry was set as 2.00, and the relative values in sect. Moutan ranged from 1.78 to 2.54, with both cultivated varieties (M05 and M06) having the equal and highest value. The relative values in sect. Paeonia were between 1.73 and 3.47, where P05 and P06 had the highest values. The relative values in Itoh hybrids ranged from 2.51 to 3.65. Concerning the genome size, it ranged from 10.77 Gb (P03) to 22.72 Gb (It01) with the pepper cv. Zunla-1 as a standard (Table 1).
The metaphase chromosomes of all the 30 peony materials were then determined. The basic chromosome number of the tested peonies was x = 5. All the materials in sect. Moutan were diploid (2n = 2x = 10, M01–06), while the plants in sect. Paeonia showed various ploidies, including diploid (2n = 2x = 10, P01–03), triploid (2n = 3x = 15, P04), and tetraploid (2n = 4x = 20, P05–06) (Figure 2A,B). The 18 Itoh hybrids, including the six varieties shown in Table 1, were triploids with 15 chromosomes (2n = 3x = 15, It01–18) (Figure 2C,D).

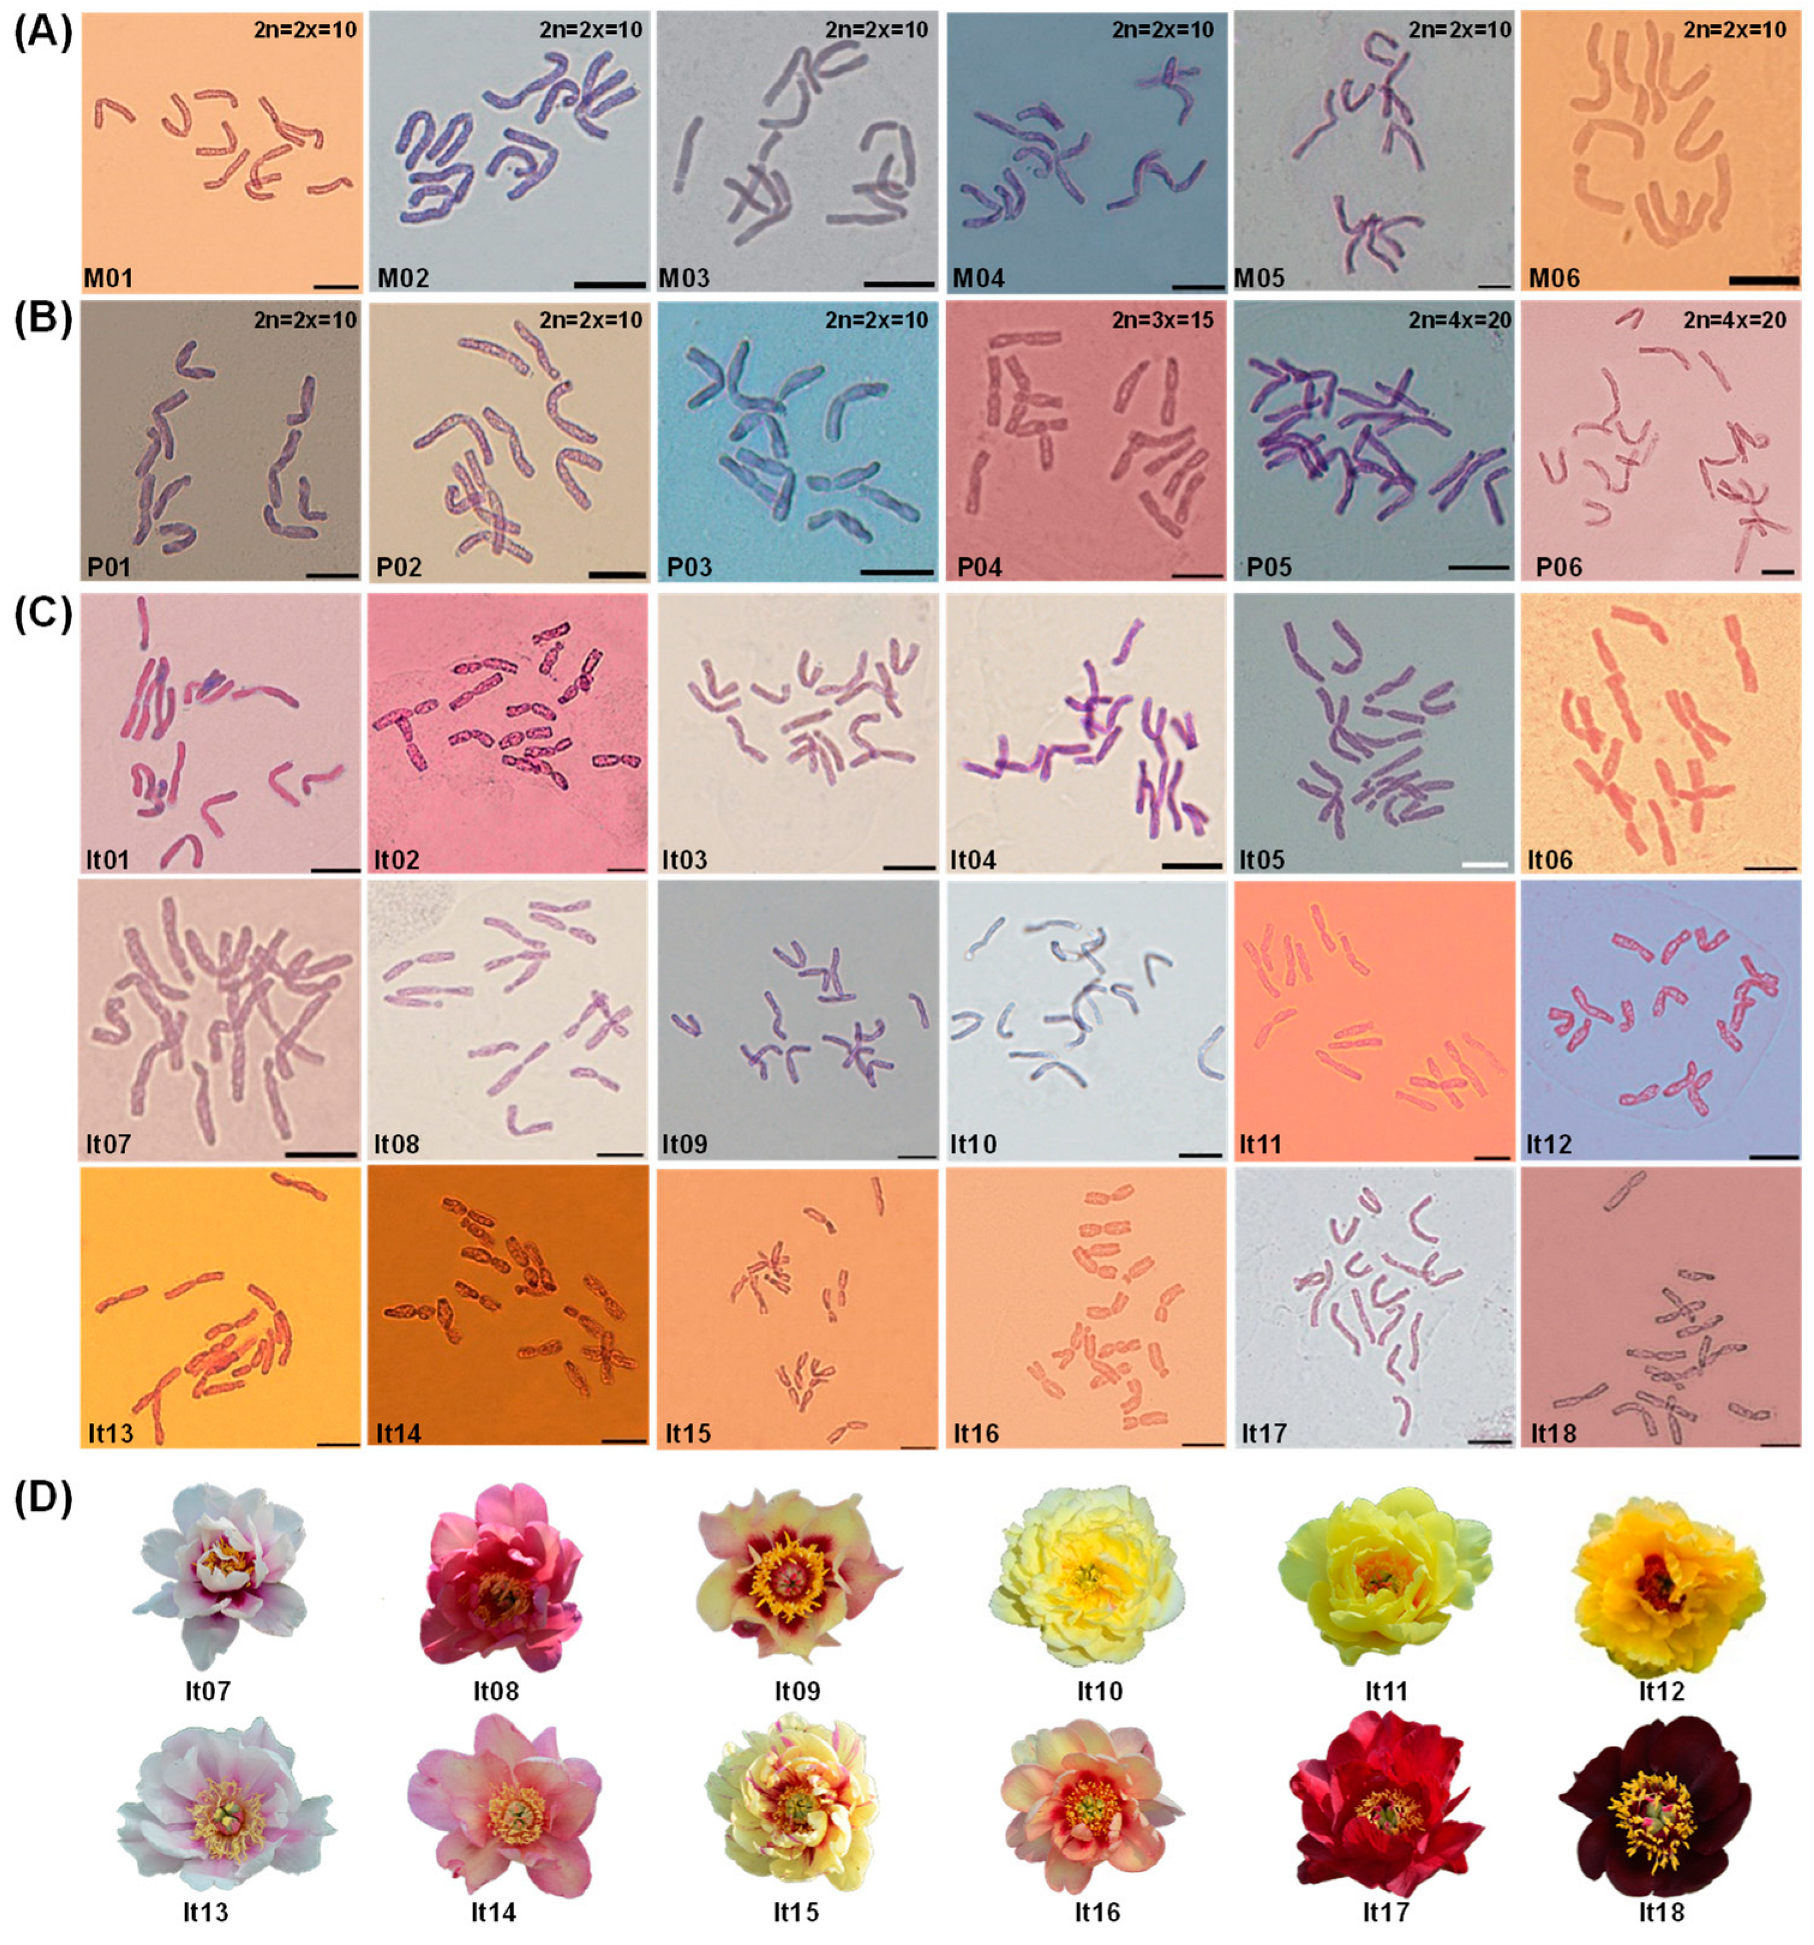
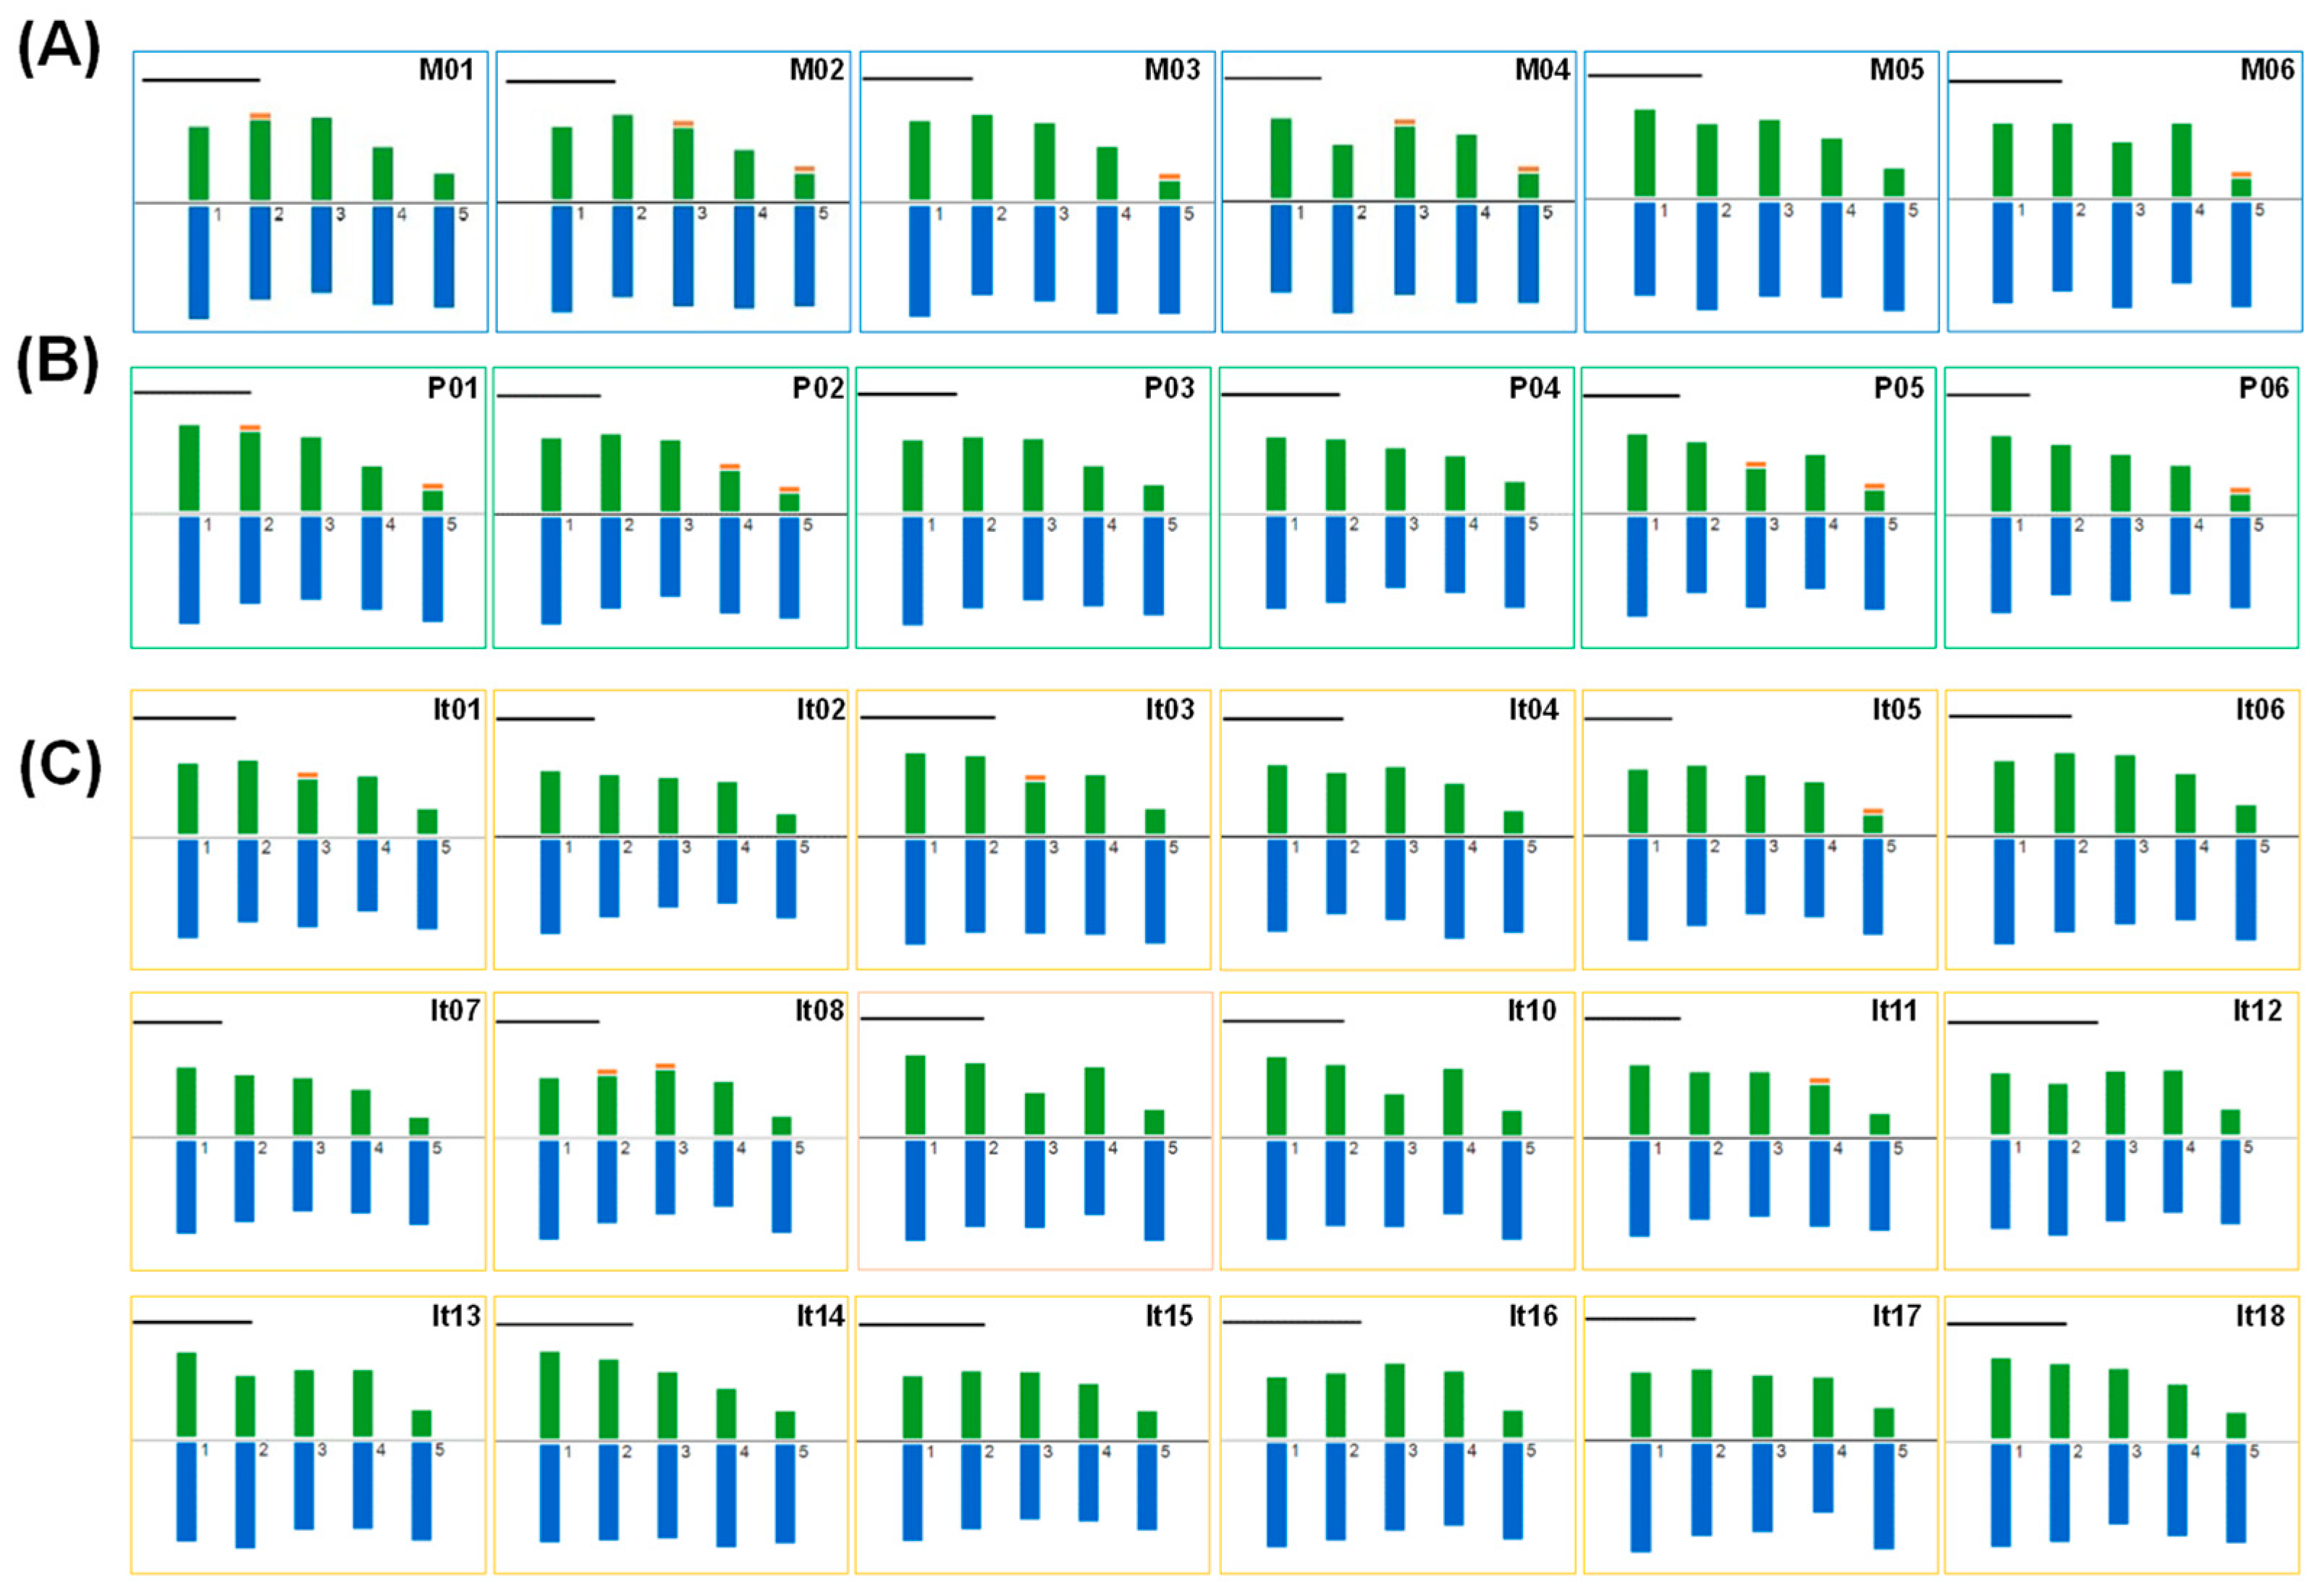
2.2. Karyotype Analysis of Peonies among Different Taxa

The results showed that all the tested peonies had karyotype 2A. The karyotype formula in sect. Moutan was 6m + 2sm + 2st with 1–4 satellites, except for M05, the ‘High Noon’, whose formula was 8m + 2st and had no satellite. There were three karyotype formulas in sect. Paeonia, including 6m + 2sm + 2st (P01–03), 10m + 3sm + 2st (P04), and 12m + 4sm + 4st (P05–06), where only P03 and P04 had no satellite. For Itoh hybrids, 16 varieties had the same karyotype formula of 9m + 3sm + 3st, with only four varieties (It01, It03, It08, and It11) having 1–2 satellites, while It06 and It15 had the formulas of 12m + 3st and 10m + 3sm + 2st, respectively, both of which had no satellite (Figure 3; Table 2).
The basic morphometric parameters of the chromosomes in these materials were also measured. The total haploid length of chromosomes (THL) varied from 45.84 μm (It12) to 82.25 μm (P06). The mean arm ratio (MAR) ranged from 1.69 (P04) to 2.28 (M03), while the mean centromeric index (XCI) was between 35.71% (P02) and 40.25% (P04) based on the centromere position. The minimum and maximum values of the coefficient of variation of chromosome length (CVCL) were 11.18 (It03) and 17.65 (It02), respectively. The minimum and maximum values of centromeric index (CVCI) were 22.56 (It15) and 37.91 (P02), respectively. The asymmetry index (AI) ranged from 2.92 (It15) to 6.25 (P02), and the ratio of the longest to short chromosomes (L/S) ranged from 1.43 (M05) to 1.95 (P06) (Table 2). The CVCL and AI of Itoh hybrids and sect. Paeonia were close; the L/S of Itoh hybrids and sect. Moutan were also close; the other four parameters had no preference to any taxon (Figure 4A). The correlation among the seven parameters was further analyzed. Ten pairs were positively correlated with the highest value of MAR vs. CVCI, followed by AI vs. both CVCL and CVCI. However, four pairs were negatively correlated with the order of MAR vs. XCI, XCI vs. CVCI, etc. (Figure 4B). A karyotype evolution map was then constructed based on the results in Table 2. The map showed that most materials in sect. Moutan and sect. Paeonia were clustered together, except for P. sp. ‘Red Charm’ (P04), the only triploid, which was closer to Itoh hybrids with the same ploidy. In addition, Itoh hybrids were not significantly correlated with sect. Moutan or sect. Paeonia (Figure 4C).

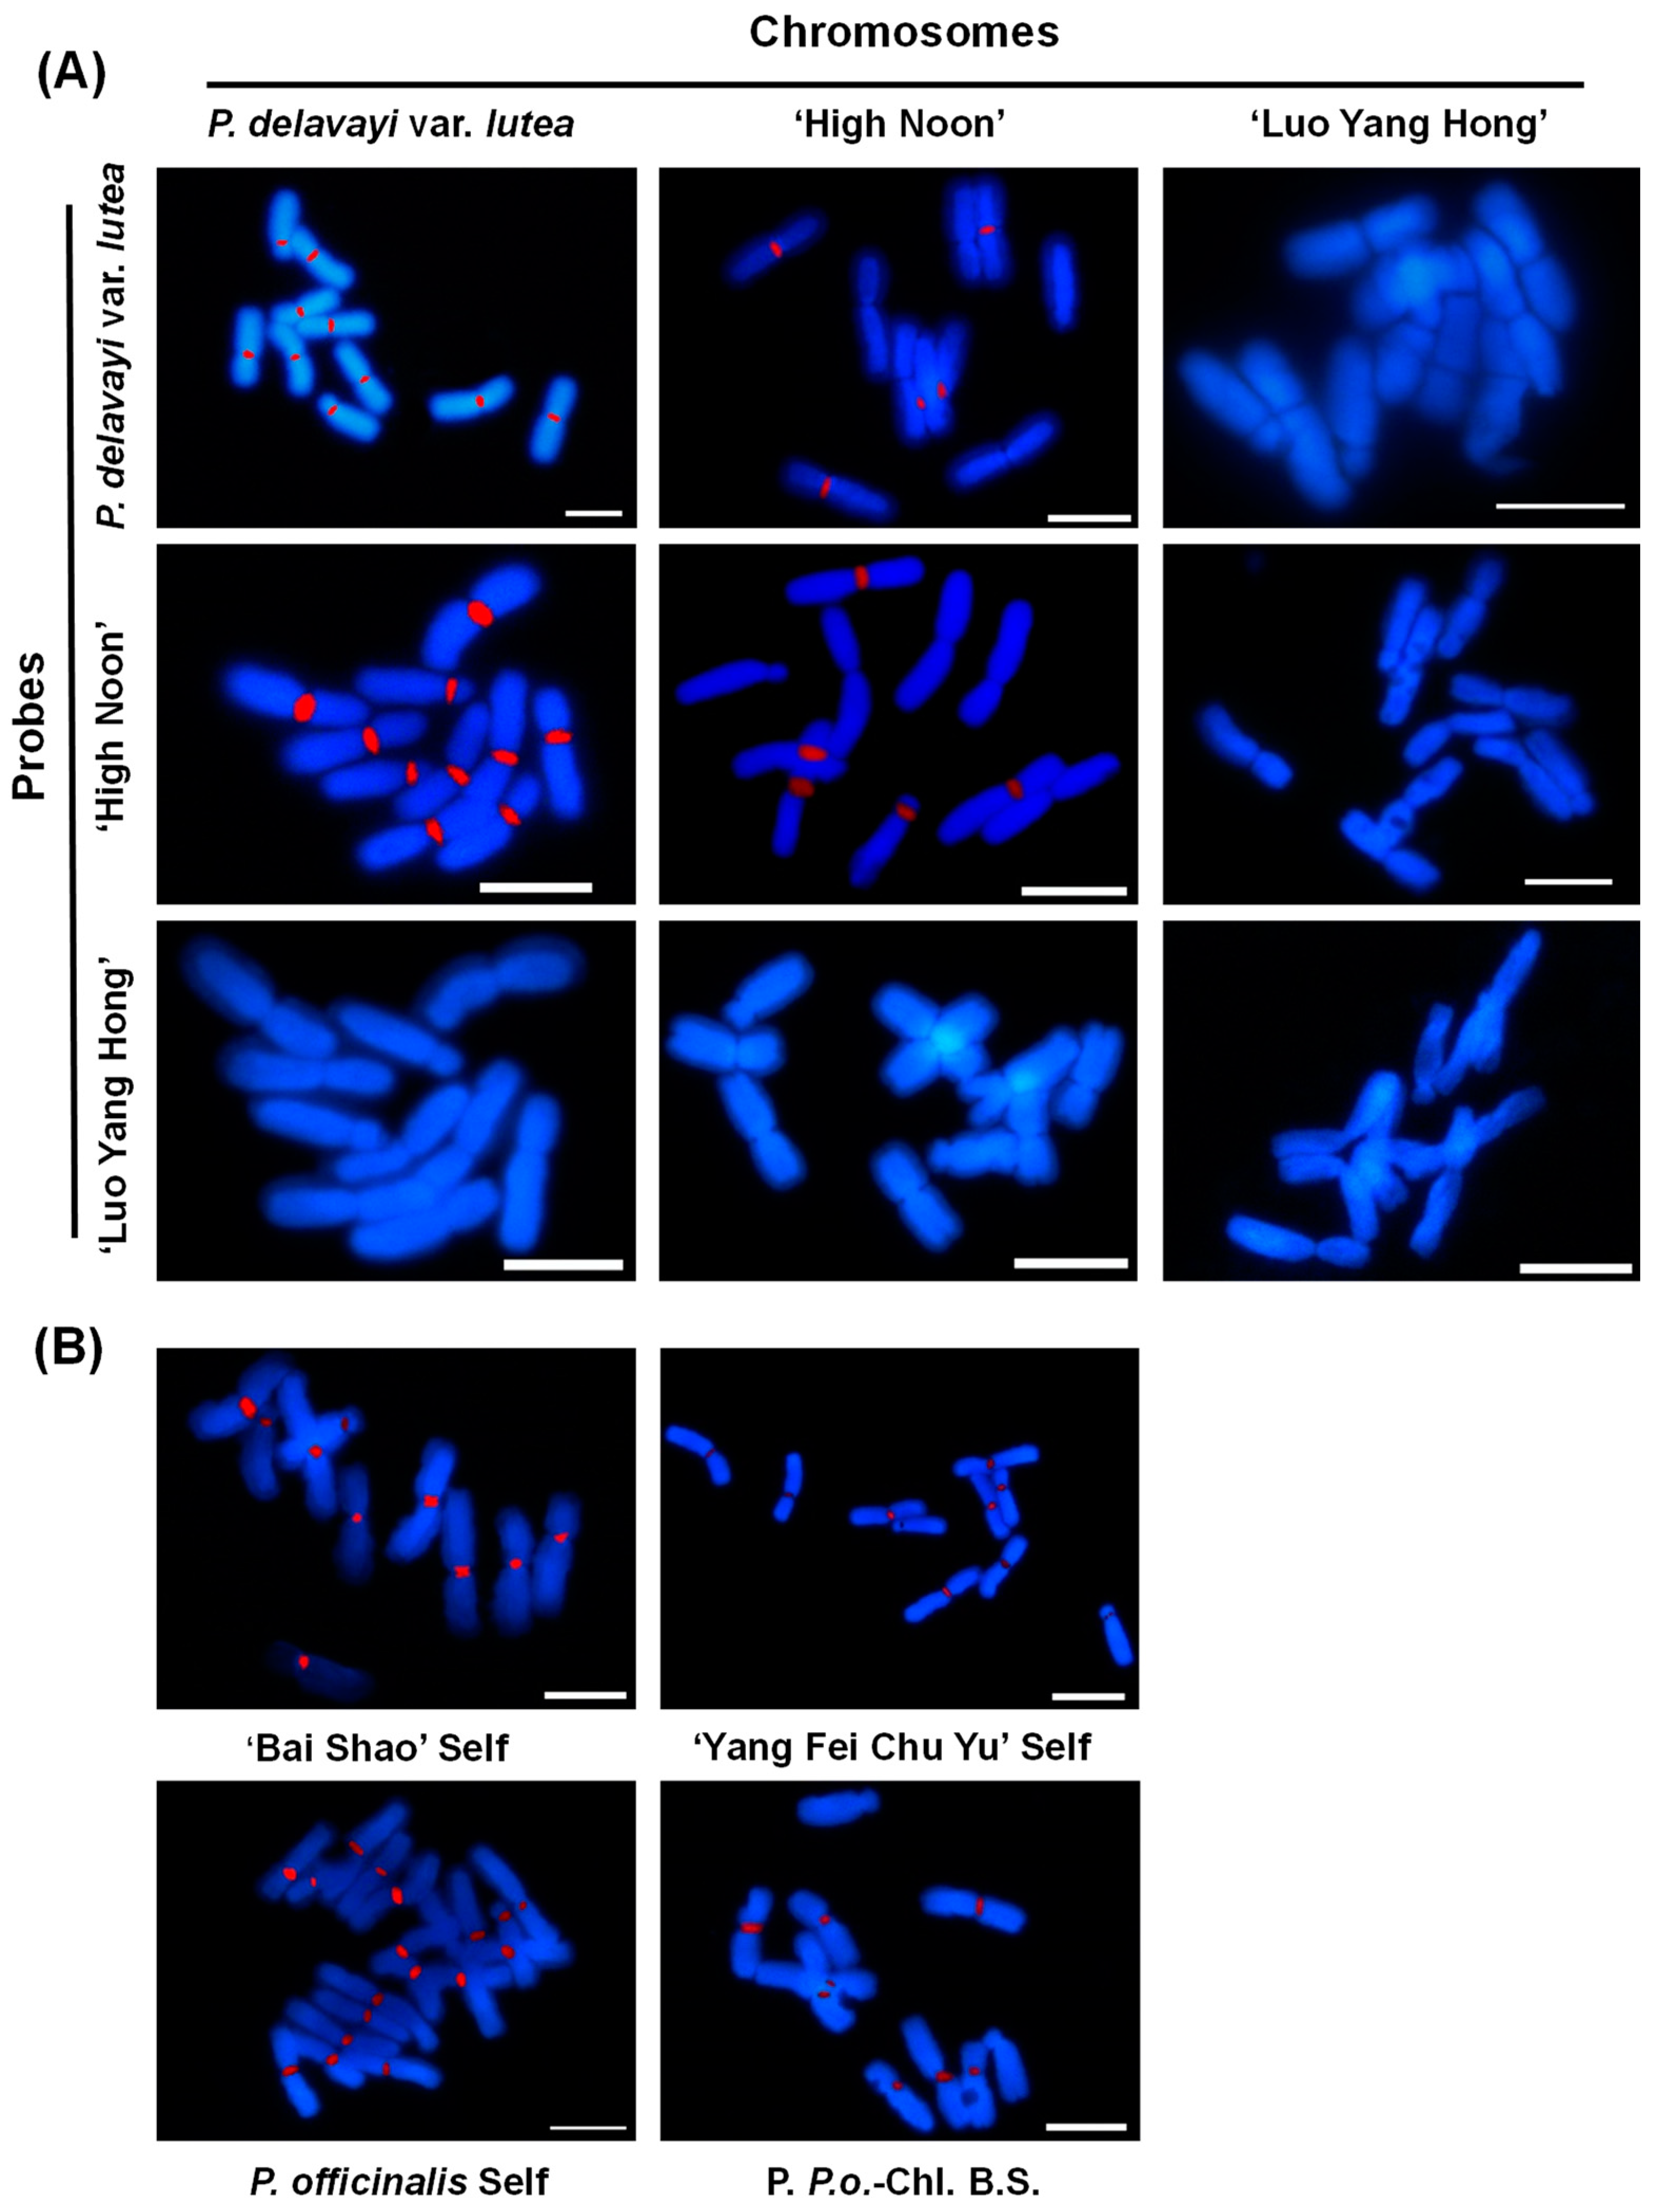
2.3. GISH Analysis of Peonies among Different Taxa

Four representative Itoh hybrid varieties [‘Court Jester’ (It09); ‘Viking Full Moon’ (It03); ‘Julia Rose’ (It08); and ‘Garden Treasure’ (It04)] were selected for GISH determination with the probes from P. delavayi var. lutea (M01; paternal parent of most Itoh hybrids); P. × lemoinei ‘High Noon’ (M05; hybrid progeny of M01; cultivated variety); P. lactiflora ‘Yang Fei Chu Yu’ (P03; variety of P. lactiflora as the maternal parent of most Itoh hybrids; and closer to Itoh hybrids in karyotype evolution map); and P. officinalis (P06; a tetraploid in sect. Paeonia) to further assess the parental origin of the chromosomes (Table S1). The M01; M05; and P03 probes labeled five chromosomes for every Itoh hybrid; whereas P06 labeled non-chromosomes on each Itoh hybrid. The mixed probes of M01 and P03 were used with different colors; and the results showed no overlapping of chromosomes between them in all the four Itoh hybrids (Figure 5). P. suffruticosa ‘Luo Yang Hong’ (M06) and P. lactiflora ‘Bai Shao’ (P02) were also used as probes for GISH determination, and no signal was detected on any of the four Itoh hybrids (data not shown).
Different peony taxa had different GISH signals. As a result, a pairwise hybridization was set among M01, M05, and M06 to test the current GISH system and plant materials (Table S1). Ten and five chromosomes were labeled on M01 and M05, respectively, while the M06 probe had no signal on any material (Figure 6A). The effect of self and mutual hybridizations in sect. Paeonia was also determined. All the chromosomes were labeled using their probes. Additionally, the P06 probe labeled at least eight chromosomes of P02 (Figure 6B).
It was difficult to obtain the parents’ information of the tested materials in Figure 6 (Table S1). Therefore, P. suffruticosa ‘Nong Yuan Jin Ke’ (NY), one of the newly cultivated varieties from the hybridization of M01 and P. suffruticosa ‘Chojuraku’, was used for GISH determination with the addition of M05, an offspring of M01. The M01 and M05 probes labeled five chromosomes on NY, while ‘Chojuraku’ had no signal on NY (Figure 7).

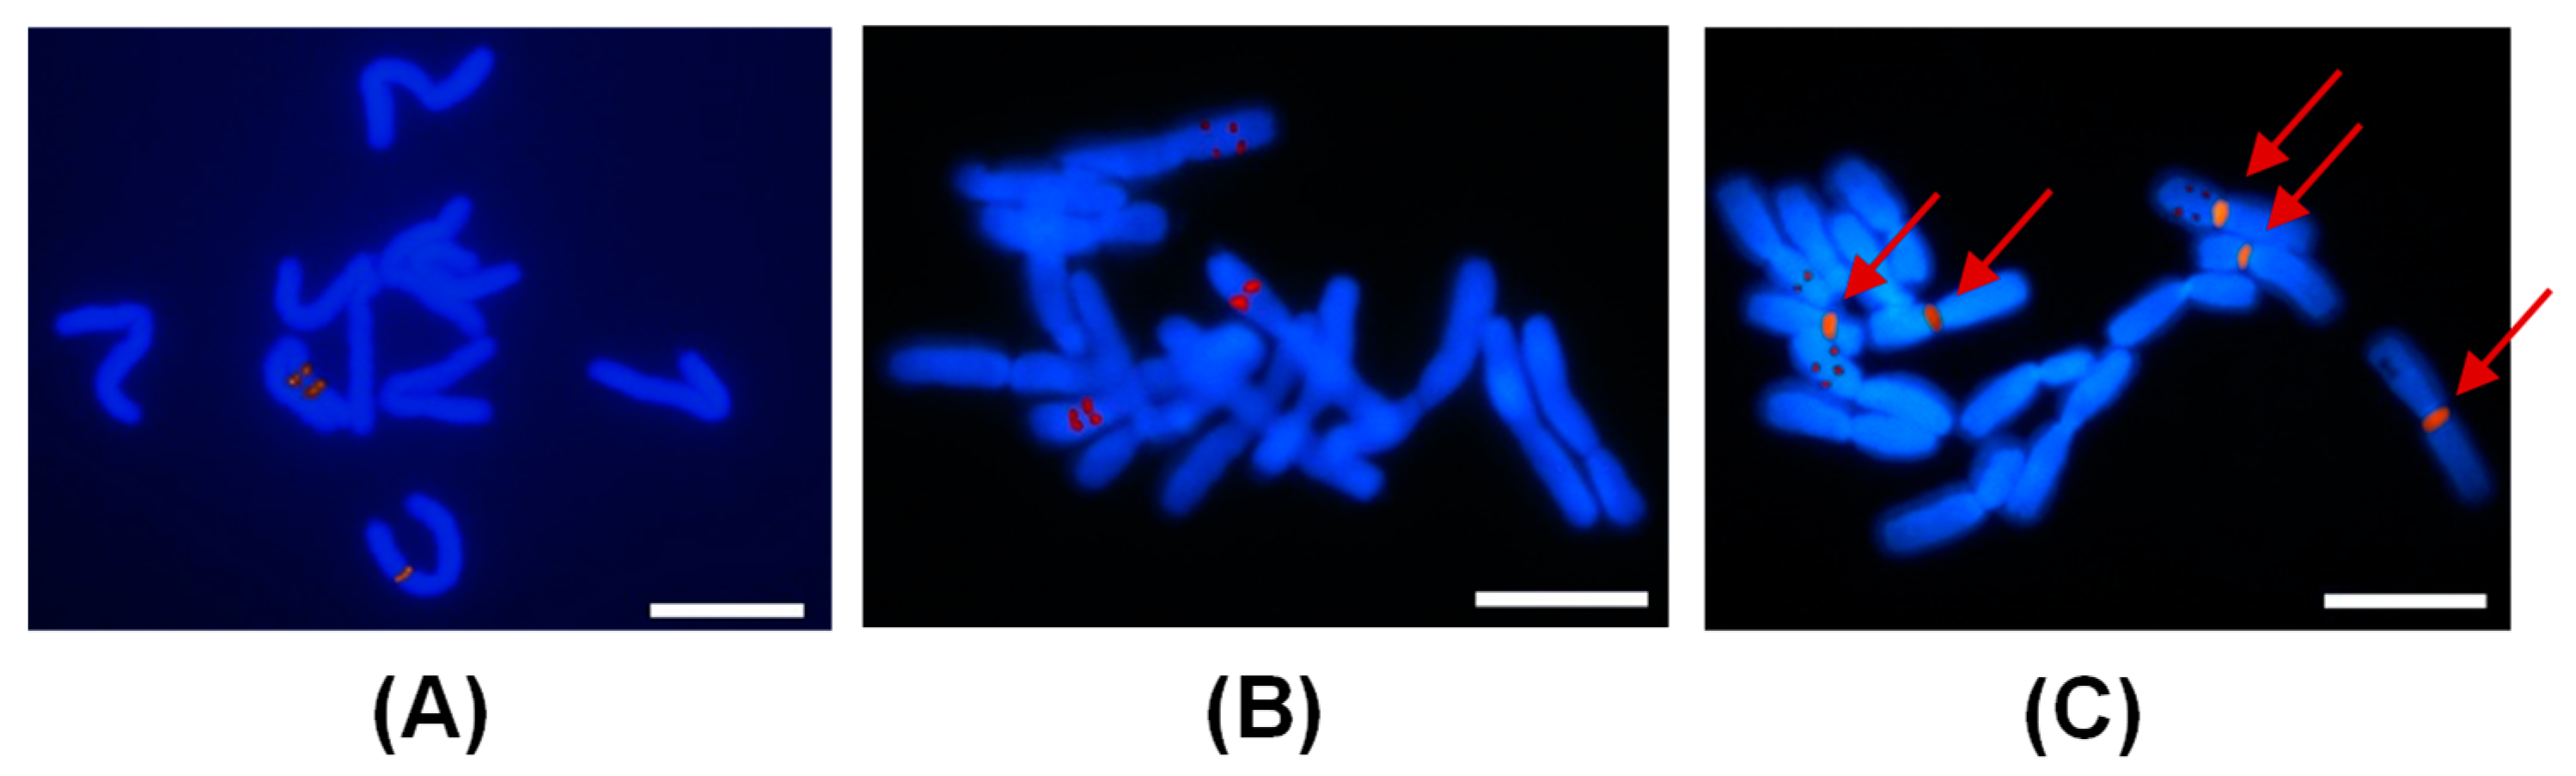
2.4. FISH Analysis of Peonies among Different Taxa

The genus Paeonia has no high-quality genomic data for reference. Therefore, the 5S probe from maize (Zea mays) was used for FISH analysis [37]. Two and three chromosomes were labeled in diploid ‘Luo Yang Hong’, and triploid ‘Garden Treasure’ and ‘Julia Rose’, respectively, which were identical to their ploidies. GISH was also applied in the same cell of ‘Julia Rose’ using gDNA of P. delavayi var. lutea as the probe. Only one chromosome was co-labeled by both FISH and GISH (Figure 8).

3. Discussion

Flow cytometry is an effective cytogenetic method for estimating the genome size and ploidy in plants [38]. Flow cytometry has been used to assess nuclear DNA contents in tribe Leucocoryneae, and it showed a monoploid genome size variation among 23 species. The changes in genome size were associated with the diversification of lineages, supporting the hypothesis that the high rate of diversification is related to the ability to benefit from changes in genome size, such as polyploidy and genome rearrangements [39,40]. Flow cytometry of Sorbus also showed that the genome size of eight Chinese native species could infer their ploidy levels [41]. In this study, the relative genome sizes of M05 and M06, two cultivated varieties in sect. Moutan, were bigger than that of wild species, probably due to genome rearrangements. The changes in genome size may improve their ornamental characteristics. In contrast, the genome sizes of P02 and P03, two cultivated varieties in sect. Paeonia, were smaller than that of the wild species, probably due to the effect of chromosomal reorganizations [42]. The monoploid genome size of the six varieties in Itoh hybrids was similar to the other two taxa, indicating that they may improve their survival rate by increasing polyploidy since it is difficult to obtain offspring through distant hybridization between tree peony and herbaceous peony.
In addition to flow cytometry, karyomorphology is also widely used to compare the diversity and ploidy among different plants, especially the relationship and origin of different materials within the same genus [41]. In a study of three endemic plants on the Qinghai–Tibet Plateau, the analysis of chromosome number and karyotype verified the placement of the genera Anzhengxia and Shangrilaia in tribe Euclidieae DC. (Brassicaceae) [43], consistent with the previous presumption via nrITS sequencing [44]. Karyotype analysis among different species in the prayer-plant family (Marantaceae) showed a strong variation in chromosome number and size, possibly due to dysploid variation, polyploidy, and hybridization [45]. The karyomorphological features of seven species in all five genera of Nyssaceae showed that the chromosome number was similar within the same genus. Further detailed data analysis suggested that Nyssaceae are of hexaploid origin with the basic number x = 7 [46]. In wheat, the presence of addition chromosomes was also confirmed in alien disomic addition lines based on karyotype analysis [14]. In the current study, chromosome counting and comparison showed that all the Itoh hybrids were triploids. However, further karyotype analysis, correlation analysis, and hierarchical clustering could not identify the parental origin of each set of chromosomes. Both known parents of all the Itoh hybrids were diploids (Table S1). The genomic background of Itoh hybrids is complex due to the individual differences in genome size. Therefore, determining the origin of each set of chromosomes may help in constructing their genetic relationship maps. In addition, karyotype has been wildly applied in humans and animals for chromosome analysis [20,21], which can be good references in our future studies.
GISH, as a molecular cytogenetic technique, has been widely used for hybrid identification in plants. It uses the total genomic DNA as a probe, and it is suitable for materials without genomic backgrounds [47]. GISH also allows the observation of recombination or alterations between different genomes [48]. The relationships of different species in the Pooideae subfamily of Poaceae can be determined via GISH analysis of the whole chromosomes or partial regions. The unlabeled chromosome regions can also be identified, indicating that disparate pathways for chromosome differentiation are associated with species-specific sequences [49]. The hybrid paternity information of Passiflora is essential for determining germplasm origin via GISH. GISH can also allow the visualization of recombination between the homeologous chromosome and the introgression of sequences of interest [47].
In this study, the probes for GISH in sect. Moutan and sect. Paeonia labeled five chromosomes in Itoh hybrids without overlapping, while the other five chromosomes were not labeled (Figure 5; data not shown). The accuracy and efficiency of GISH on peony were determined using the probes and chromosomes from the same taxon and same material to eliminate potential technical effects. Interestingly, the cultivated variety of ‘Luo Yang Hong’ did not detect any signal either as the probe or the chromosome slide. However, ‘High Noon’ and P. delavayi var. lutea as probes labeled half of the chromosomes in ‘High Noon’. Both parents of ‘Luo Yang Hong’ were cultivated varieties, while ‘High Noon’ was from half wild and half cultivated tree peonies. Therefore, these results suggest that it may be difficult to label the chromosomes of tree peony from the cultivated varieties through the current GISH method, probably due to their huge and complex genomes compared with the wild species. The GISH results from the same material and taxon for the materials in sect. Paeonia met our expectations, indicating that only one set of the chromosomes in Itoh hybrids was from sect. Paeonia. The chromosomes of our cultivated tree peony were also used for GISH determination since it had clear parental information. The cultivated parent had no signal, further confirming that GISH cannot label chromosomes of the cultivated tree peony. These results indicate that of the three sets of chromosomes in Itoh hybrids, two may be from tree peony and one from herbaceous peony. One of two sets from the tree peony may be from the wild species, and the other from the cultivated variety. In addition, the chromosomes of Paeonia plants are large, and possibly contain many repetitive sequences; however, in our results, the GISH signals were mainly concentrated in the centromere region, which was similar to the reports of Brassica and Setaria species, probably due to the high concentration of repeats in the centromere region [50,51,52].
FISH is also extensively used as one of the molecular cytogenetic techniques for paternity confirmation in hybrids, especially for determining specific chromosomes using specific probes, such as 45S and 5S rDNA [33,34]. FISH provided unique chromosome markers from each parent in Passiflora using rDNA probes, thus facilitating the recognition of each genome genitor in the hybrids [47]. FISH revealed one 5S locus and eight 45S loci in Lablab purpureus using rDNA probes, thus helping to identify the prometaphase chromosome pair combined with the CPD and DAPI+ bands, as well as chromosome measurements [53]. Most 5S rDNA signals are located in subterminal chromosome regions in Chrysanthemum based on the determination of Oligo-FISH, and the number of 5S rDNA sites is significantly associated with ploidy [54].
There are few FISH-related cytogenetic studies on Paeonia. Most studies focused on chromosomal structural rearrangement and rDNA loci evolution using 45S rDNA as probes, which mostly labeled more than one rDNA site [55,56]. However, no study has reported on 5S rDNA-based FISH in Paeonia. In this study, we found that the number of 5S rDNA loci was consistent with the ploidy in all the three tested materials, thus we presumed it may be used for ploidy assessment in Paeonia, although more directed evidence is still needed. In addition, only one chromosome in the Itoh hybrid was co-labeled by GISH and FISH, indicating that the five chromosomes labeled by GISH were in the same set.

4. Materials and Methods

4.1. Plant Material

In this study, all the Paeonia materials, including those in sect. Moutan, sect. Paeonia, and Itoh hybrids, were obtained from the Yanqing Cultivation Base of Beijing, China (116°15′51″ N, 40°33′32″ E; at 673 m a.s.l.). The detailed information is listed in Table S1.

4.2. Flow Cytometric Measurement

The flow cytometric measurement was conducted as described by [57], and the genome sizes of various peonies were estimated with pepper (Capsicum annuum L. cv. Zunla-1) as a standard [36], according to [58,59]. Briefly, the young leaves from different individual plants were separately collected and washed twice using distilled water. About 0.5 cm2 of healthy leaf tissue was excised and placed into a plastic Petri dish on ice, then cut into small pieces using a sharp razor blade and put in 250 μL of ice-cold extraction buffer (CYStain UV Precise P Nuclei Extraction Buffer) for 30 s. Staining buffer (1000 μL) (CYStain UV Precise P Staining Buffer) was then added to the sample and mixed. The homogenate was filtered using a 50 μm nylon net and transferred into a sample tube. The samples were incubated on ice in the dark for 5–10 min. CyFlow Counter flow cytometry (Sysmex Partec, Goerlitz, Germany) was then used for ploidy detection. FlowJo (BD Biosciences, San Jose, CA, USA) was used to analyze the data.

4.3. Karyotype Analysis

Actively growing root tips (1–3 cm) from mature plants were cut from 9:00 am to 11:00 am in early March and pretreated with 0.1% cycloheximide in the dark for 8–10 h. The samples were fixed in Carnoy’s solution (ethanol:acetic acid = 3:1) for 12 h, then stored in 75% ethanol at 4 °C until for further use. Slices were prepared as follows: the root tips were hydrolyzed in 1 M HCl at 60 °C for 10 min, washed thrice with distilled water, placed on glass slides, and cut into pieces using a sharp knife. The samples were then stained with carbol fuchsin (Solarbio, Beijing, China) for 15–20 min. Olympus BX53F (Olympus, Tokyo, Japan) was used for obtaining images (at least five metaphase cells per sample).
Karyotype-related parameters were calculated as described by [60,61], and presented as follows: total haploid (monoploid) length of chromosome set (THL) = sum of total chromosome length; relative length (RL) = related chromosome length/total chromosome length; mean arm ratio (MAR) = mean (long arms/short arms); mean centromeric index [XCI (%)] = mean [short arms/(long arms + short arms) × 100%]; coefficient of variation of chromosome length (CVCL) = standard deviation of chromosome length/mean chromosome length; coefficient of variation of centromeric index (CVCI) = standard deviation of CI/mean CI, where CI means the ration of short arm to the whole chromosome, which determines the relative position of centromeres; asymmetry index (AI) = CVCL × CVCI; ratio of the longest/short chromosomes (L/S) = the longest chromosome length/the shortest chromosome length. For data analysis, about 3–5 individuals and 3–5 metaphase spreads per individual were considered.

4.4. GISH and FISH

GISH and FISH were performed as described by [62] with minor modifications. Briefly, the roots underwent a pre-hypotonic treatment with 0.075 mol L−1 KCl for 30 min, followed by digestion using a mixture of 2% Cellulase Onozuka RS (Yakult, Tokyo, Japan) and 0.5% Pectolyase Y-23 (Yakult, Tokyo, Japan) at 37 °C for 100 min. The meristems were washed with distilled water, followed by hypotonic treatment for 30 min. The meristems were then squashed in Carnoy’s solution on a glass slide using fine-pointed forceps and flame-dried. The slides were stored at –20 °C before further treatment.
The probe preparation of GISH was conducted as follows: the genomic DNA from young leaves of the selected plants was isolated via the CTAB method [63]. The samples were labeled with digoxigenin-11-dUTP or biotin-16-dUTP (Roche Diagnostics, Risch-Rotkreuz, Switzerland) via nick translation at 15 °C for 120 min (final DNA concentration, 200 ng μL−1; fragment size, 200–500 bp), as described by [64]. The probe used for FISH was obtained from Prof. Weiwei Jin at the China Agriculture University with the final concentration of 200 ng μL−1.
For hybridization, the slides with cytological preparations were dried at 65 °C for at least 1 h. The slides were then denatured with 100 μL (70% formamide, 10% 20× SSC, 20% ddH2O) at 82 °C for 10 min, dehydrated in precooled ethanol (70, 95, and 100%), and air-dried. Hybridization mixture containing 50% (v/v) formamide, 10% (w/v) dextran sulfate, 2× SSC, 2~4 μL labeled probe, and 2~4 μL salmon sperm DNA (Solarbio, Beijing, China) was applied to a selected area of each slide. The solution was treated at 95 °C for 10 min and instantly quenched in ice before hybridization. The hybridization solution was then applied to the slide, covered with a cover glass, and incubated at 37 °C for 12 h. The samples were washed twice after hybridization by 2× SSC solution at room temperature for 5 min each, and then incubated in a Coplin jar at 42 °C containing 2× SSC and washed for 10 min. Then, the slides were washed by 2× SSC solution at room temperature for 5 min and finally washed by 1× PBS solution at room temperature for 5 min.
Anti-digoxingenin-rhodamine (100 μL) (red color) (Roche, Basel, Switzerland) or anti-boitin-FITC (blue color) (Avidin-FITC from egg white, Sigma, St. Louis, MO, USA) was added to the slides [1:100 in TNB buffer (0.1M Tris-HCl, pH 7.5, 0.15 M NaCl, and 0.5% blocking reagent)] at 37 °C for 1 h for detection. The samples were washed thrice using 1× PBS (for 5 min each) at 37 °C to remove excess antibody. The slides were subsequently mounted and counterstained with DAPI/Vectashield (Vector Laboratories. Burlingame, CA, USA). Olympus BX53F (Olympus Tokyo Japan) was used to obtain images. The Adobe Photoshop CS6 was used for brightness and contrast adjustments.

4.5. Data Analysis

MATO was used to draw a mean haploid ideogram based on the chromosome length [65]. Hierarchical clustering was performed to determine the karyological relationships among different materials. OriginPro 2019b (OriginLab Software, USA) was used to draw the correlation plot and boxplot.

5. Conclusions

In this study, the monoploid genome sizes of selected Itoh hybrids showed individual differences. However, genome sizes were not significantly different between sect. Moutan as the paternal parent and sect. Paeonia as the maternal parent. Further karyotype analysis could not identify the parental origin of chromosomes of Itoh hybrids. GISH and FISH verifications suggested that of three sets of chromosomes in Itoh hybrids, two were from the paternal parent, and one was from the maternal parent. One of the two sets from the paternal parent could be from wild species and the other from the cultivated variety. Meanwhile, the 5S rDNA-based FISH was first applied in Paeonia for ploidy assessment. This work may give more insights into improving Itoh hybrid resources.

Supplementary Materials

The following supporting information can be downloaded at: https://www.mdpi.com/article/10.3390/ijms231911406/s1.

Author Contributions

J.X. and X.Z. (Xiuxin Zhang) designed the research; L.C., T.C. and X.Z. (Xin Zhao) performed the experiments; S.W. and X.R. analyzed the data; L.C. and J.X. wrote the paper. All authors have read and agreed to the published version of the manuscript.

Funding

This research was funded by the National Key R&D Program of China (2021YFE0110700), the National Natural Science Foundation of China (31972455, 31972440), China Agriculture Research System (CARS-21), and Fundamental Research Funds for Chinese Academy of Agricultural Sciences (Y2022XK17).

Institutional Review Board Statement

Not applicable.

Informed Consent Statement

Not applicable.

Data Availability Statement

The data used to support the findings of this study are available from the corresponding authors upon request.

Conflicts of Interest

The authors declare that they have no conflict of interest.

References

  1. Li, J.; Zhang, X.; Zhao, X. Tree Peony of China; Encyclopedia of China Publishing House: Beijing, China, 2011. [Google Scholar]
  2. Kamenetsky-Goldstein, R.; Yu, X. Cut peony industry: The first 30 years of research and new horizons. Hortic. Res. 2022, 9, uhac079. [Google Scholar] [CrossRef] [PubMed]
  3. Marković, T.; Prijić, Ž.; Xue, J.; Zhang, X.; Radanović, D.; Ren, X.; Filipović, V.; Lukić, M.; Gordanić, S. The seed traits associated with dormancy and germination of herbaceous peonies, focusing on species Native in Serbia and China. Horticulturae 2022, 8, 585. [Google Scholar] [CrossRef]
  4. Yang, Y.; Sun, M.; Li, S.; Chen, Q.; da Silva, J.A.T.; Wang, A.; Yu, X.; Wang, L. Germplasm resources and genetic breeding of Paeonia: A systematic review. Hortic. Res. 2020, 7, 107. [Google Scholar] [CrossRef] [PubMed]
  5. Page, M. Paeonia Itoh hybrids. Plantsman 2005, 4, 36–39. [Google Scholar]
  6. te Beest, M.; Le Roux, J.J.; Richardson, D.M.; Brysting, A.K.; Suda, J.; Kubesova, M.; Pysek, P. The more the better? The role of polyploidy in facilitating plant invasions. Ann. Bot. 2012, 109, 19–45. [Google Scholar] [CrossRef] [PubMed]
  7. Chen, Z.J.; Sreedasyam, A.; Ando, A.; Song, Q.; De Santiago, L.M.; Hulse-Kemp, A.M.; Ding, M.; Ye, W.; Kirkbride, R.C.; Jenkins, J.; et al. Genomic diversifications of five Gossypium allopolyploid species and their impact on cotton improvement. Nat. Genet. 2020, 52, 525–533. [Google Scholar] [CrossRef]
  8. Hoopes, G.; Meng, X.; Hamilton, J.P.; Achakkagari, S.R.; Guesdes, F.d.A.F.; Bolger, M.E.; Coombs, J.J.; Esselink, D.; Kaiser, N.R.; Kodde, L.; et al. Phased, chromosome-scale genome assemblies of tetraploid potato reveal a complex genome, transcriptome, and predicted proteome landscape underpinning genetic diversity. Mol. Plant 2022, 15, 520–536. [Google Scholar] [CrossRef]
  9. Awan, M.J.A.; Rasheed, A.; Saeed, N.A.; Mansoor, S. Aegilops tauschi presents a genetic roadmap for hexaploid wheat improvement. Trends Genet. 2022, 38, 307–309. [Google Scholar] [CrossRef]
  10. Fan, M.; Gao, Y.; Wu, Z.; Zhang, Q. Linkage map development by EST-SSR Markers and QTL analysis for inflorescence and leaf traits in Chrysanthemum (Chrysanthemum morifolium Ramat.). Plants 2020, 9, 1342. [Google Scholar] [CrossRef]
  11. Edger, P.P.; Poorten, T.J.; VanBuren, R.; Hardigan, M.A.; Colle, M.; McKain, M.R.; Smith, R.D.; Teresi, S.J.; Nelson, A.D.L.; Wai, C.M.; et al. Origin and evolution of the octoploid strawberry genome. Nat. Genet. 2019, 51, 765. [Google Scholar] [CrossRef]
  12. Evtushenko, E.V.; Lipikhina, Y.A.; Stepochkin, P.I.; Vershinin, A.V. Cytogenetic and molecular characteristics of rye genome in octoploid triticale (× Triticosecale Wittmack). Comp. Cytogenet. 2019, 13, 423–434. [Google Scholar] [CrossRef] [PubMed]
  13. Wijesinghe, S.A.E.C.; Evans, L.J.; Kirkland, L.; Rader, R. A global review of watermelon pollination biology and ecology: The increasing importance of seedless cultivars. Sci. Hortic. 2020, 271, 109493. [Google Scholar] [CrossRef]
  14. Farshadfar, M. Chromosome location of ISSR markers and genes controlling seed germination under drought stress in wheat-barley disomic addition lines. Cell. Mol. Biol. 2020, 66, 101–108. [Google Scholar] [CrossRef]
  15. Guerra, M. Chromosome numbers in plant cytotaxonomy: Concepts and implications. Cytogenet. Genome Res. 2008, 120, 339–350. [Google Scholar] [CrossRef] [PubMed]
  16. Sun, W.; Sun, H.; Li, Z. Chromosome data mining and its application in plant diversity research. Plant Sci. J. 2019, 37, 260–269. [Google Scholar]
  17. Stebbins, G.L. Chromosomal Evolution in Higher Plants; Edward Arnold Ltd.: London, UK, 1971; pp. 87–93. [Google Scholar]
  18. Levan, A.; Fredga, K.; Sandberg, A.A. Nomenclature for centromeric position on chromosomes. Hereditas 1964, 52, 201–220. [Google Scholar] [CrossRef]
  19. Baltisberger, M.; Horandl, E. Karyotype evolution supports the molecular phylogeny in the genus Ranunculus (Ranunculaceae). Perspect. Plant Ecol. Evol. Syst. 2016, 18, 1–14. [Google Scholar] [CrossRef]
  20. Ebrahimzadeh-Vesal, R.; Shokrgozar, M.A.; Nayernia, K.; Teimoori-Toolabi, L.; Estiar, M.A.; Miryounesi, M.; Nourashrafeddin, S.; Modarressi, M.H. MicroRNA profiling during germline differentiation of mouse embryonic stem cells. Cell. Mol. Biol. 2015, 61, 84–91. [Google Scholar]
  21. Huang, X.Q.; Ju, H.R.; Song, G.H. Evaluation of basal hormone levels and androgen receptor gene mutations in individuals with recurrent abortion. Cell. Mol. Biol. 2021, 67, 274–281. [Google Scholar] [CrossRef]
  22. Nkongolo, K.K.; Mehes-Smith, M. Karyotype evolution in the Pinaceae: Implication with molecular phylogeny. Genome 2012, 55, 735–753. [Google Scholar] [CrossRef]
  23. Saensouk, S.; Saensouk, P. Karyotype analysis of three species of Allium (Amaryllidaceae) from thailand. Biodiversitas J. Biol. Divers. 2021, 22, 3458–3466. [Google Scholar] [CrossRef]
  24. Younis, A.; Ramzan, F.; Hwang, Y.-J.; Lim, K.-B. FISH and GISH: Molecular cytogenetic tools and their applications in ornamental plants. Plant Cell Rep. 2015, 34, 1477–1488. [Google Scholar] [CrossRef] [PubMed]
  25. Schwarzacher, T.; Leitch, A.R.; Bennett, M.D.; Heslop-Harrison, J.S. In situ localization of parental genomes in a wide hybrid. Ann. Bot. 1989, 64, 315–324. [Google Scholar] [CrossRef]
  26. Kato, A.; Vega, J.M.; Han, F.P.; Lamb, J.C.; Birchler, J.A. Advances in plant chromosome identification and cytogenetic techniques. Curr. Opin. Plant Biol. 2005, 8, 148–154. [Google Scholar] [CrossRef] [PubMed]
  27. Arantes Chaves, A.L.; Mendes Carvalho, P.H.; Mendes Ferreira, M.T.; Gandolfi Benites, F.R.; Techio, V.H. Genomic constitution, allopolyploidy, and evolutionary proposal for Cynodon Rich. based on GISH. Protoplasma 2022, 259, 999–1011. [Google Scholar] [CrossRef]
  28. Khrustaleva, L.; Mardini, M.; Kudryavtseva, N.; Alizhanova, R.; Romanov, D.; Sokolov, P.; Monakhos, G. The power of genomic in situ hybridization (GISH) in interspecific breeding of bulb onion (Allium cepa L.) resistant to downy mildew (Peronospora destructor Berk. Casp.). Plants 2019, 8, 36. [Google Scholar] [CrossRef]
  29. Harrison, G.E.; Heslopharrison, J.S. Centromeric repetitive DNA-sequences in the genus Brassica. Theor. Appl. Genet. 1995, 90, 157–165. [Google Scholar] [CrossRef]
  30. Heslop-Harrison, J.S.; Schwarzacher, T.; Anamthawat-Jonsson, K.; Leitch, A.R.; Shi, M.; Leitch, I.J. In situ hybridization with automated chromosome denaturation. Tech. J. Methods Cell Mol. Biol. 1991, 3, 109–115. [Google Scholar]
  31. Lee, H.-I.; Younis, A.; Hwang, Y.-J.; Kang, Y.-I.; Lim, K.-B. Molecular cytogenetic analysis and phylogenetic relationship of 5S and 45S ribosomal DNA in Sinomartagon lilium Species by fluorescence in Situ Hybridization (FISH). Hortic. Environ. Biotechnol. 2014, 55, 514–523. [Google Scholar] [CrossRef]
  32. Said, M.; Hribova, E.; Danilova, T.V.; Karafiatova, M.; Cizkova, J.; Friebe, B.; Dolezel, J.; Gill, B.S.; Vrana, J. The Agropyron cristatum karyotype, chromosome structure and cross-genome homoeology as revealed by fluorescence in situ hybridization with tandem repeats and wheat single-gene probes. Theor. Appl. Genet. 2018, 131, 2213–2227. [Google Scholar] [CrossRef]
  33. Garcia, S.; Kovarik, A.; Leitch, A.R.; Garnatje, T. Cytogenetic features of rRNA genes across land plants: Analysis of the Plant rDNA database. Plant J. 2017, 89, 1020–1030. [Google Scholar] [CrossRef] [PubMed]
  34. Roa, F.; Guerra, M. Distribution of 45S rDNA sites in chromosomes of plants: Structural and evolutionary implications. BMC Evol. Biol. 2012, 12, 225. [Google Scholar] [CrossRef] [PubMed]
  35. Yang, L.; Zhang, J.; da Silva, J.A.T.; Yu, X. 2017 Variation in ploidy and karyological diversity in different herbaceous peony cultivar groups. J. Am. Soc. Hortic. Sci. 2017, 142, 272–278. [Google Scholar] [CrossRef]
  36. Qin, C.; Yu, C.; Shen, Y.; Fang, X.; Chen, L.; Min, J.; Cheng, J.; Zhao, S.; Xu, M.; Luo, Y.; et al. Whole-genome sequencing of cultivated and wild peppers provides insights into Capsicum domestication and specialization. Proc. Natl. Acad. Sci. USA 2014, 111, 5135–5140. [Google Scholar] [CrossRef] [Green Version]
  37. Zhao, X.; Lu, J.; Zhang, Z.; Hu, J.; Huang, S.; Jin, W. Comparison of the distribution of the repetitive DNA sequences in three variants of Cucumis sativus reveals their phylogenetic relationships. J. Genet. Genom. 2011, 38, 39–45. [Google Scholar] [CrossRef]
  38. Greilhuber, J.; Dolezel, J.; Lysak, M.A.; Bennett, M.D. The origin, evolution and proposed stabilization of the terms ‘genome size’ and ‘C-value’ to describe nuclear DNA contents. Ann. Bot. 2005, 95, 255–260. [Google Scholar] [CrossRef]
  39. Puttick, M.N.; Clark, J.; Donoghue, P.C.J. Size is not everything: Rates of genome size evolution, not C-value, correlate with speciation in angiosperms. Proc. R. Soc. B 2015, 282, 20152289. [Google Scholar] [CrossRef]
  40. Sassone, A.B.; Lopez, A.; Hojsgaard, D.H.; Giussani, L.M. A novel indicator of karyotype evolution in the tribe Leucocoryneae (Allioideae, Amaryllidaceae). J. Plant Res. 2018, 131, 211–223. [Google Scholar] [CrossRef]
  41. Li, J.; Zhu, K.; Wang, Q.; Chen, X. Genome size variation and karyotype diversity in eight taxa of Sorbus sensu stricto (Rosaceae) from China. Comp. Cytogenet. 2021, 15, 137–148. [Google Scholar]
  42. Wendel, J.F. The wondrous cycles of polyploidy in plants. Am. J. Bot. 2015, 102, 1753–1756. [Google Scholar] [CrossRef]
  43. Sun, W.; Wang, H.; Wu, R.; Sun, H.; Li, Z. Karyomorphology of three endemic plants (Brassicaceae: Euclidieae and Arabideae) from the Qinghai-Tibet Plateau and its significance. Plant Divers. 2020, 42, 135–141. [Google Scholar] [CrossRef] [PubMed]
  44. Chen, H.; Al-Shehbaz, I.; Yue, J.; Sun, H. New insights into the taxonomy of tribe Euclidieae (Brassicaceae), evidence from nrITS sequence data. PhytoKeys 2018, 100, 125–139. [Google Scholar] [CrossRef] [PubMed]
  45. Winterfeld, G.; Ley, A.; Hoffmann, M.H.; Paule, J.; Rosser, M. Dysploidy and polyploidy trigger strong variation of chromosome numbers in the prayer-plant family (Marantaceae). Plant Syst. Evol. 2020, 306, 36. [Google Scholar] [CrossRef]
  46. Oginuma, K.; Tobe, H. Karyomorphology and chromosome evolution in Nyssaceae (Cornales). Cytologia 2021, 86, 29–34. [Google Scholar] [CrossRef]
  47. Silva, G.S.; Souza, M.M. Genomic in situ hybridization in plants. Genet. Mol. Res. 2013, 12, 2953–2965. [Google Scholar] [CrossRef]
  48. Lim, K.Y.; Matyasek, R.; Kovarik, A.; Leitch, A.R. Genome evolution in allotetraploid Nicotiana. Biol. J. Linn. Soc. 2004, 82, 599–606. [Google Scholar] [CrossRef]
  49. Majka, J.; Majka, M.; Kwiatek, M.; Wisniewska, H. Similarities and differences in the nuclear genome organization within Pooideae species revealed by comparative genomic in situ hybridization (GISH). J. Appl. Genet. 2017, 58, 151–161. [Google Scholar] [CrossRef]
  50. Benabdelmouna, A.; Shi, Y.; Abirached-Darmency, M.; Darmency, H. Genomic in situ hybridization (GISH) discriminates between the A and the B genomes in diploid and tetraploid Setaria species. Genome 2001, 44, 685–690. [Google Scholar] [CrossRef]
  51. Li, Z.; Li, M.; Huang, R.; Wu, X.; Song, Y. Genomic in situ hybridization (GISH) discriminates the A, B and C genomes in Brassica allotetraploid species. Chin. J. Oil Crop Sci. 2002, 24, 10–14. [Google Scholar]
  52. Snowdon, R.J.; Kohler, W.; Friedt, W.; Kohler, A. Genomic in situ hybridization in Brassica amphidiploids and interspecific hybrids. Theor. Appl. Genet. 1997, 95, 1320–1324. [Google Scholar] [CrossRef]
  53. She, C.-W.; Jiang, X.-H. Karyotype analysis of Lablab purpureus (L.) sweet using fluorochrome banding and fluorescence in situ hybridisation with rDNA probes. Czech J. Genet. Plant Breed. 2015, 51, 110–116. [Google Scholar] [CrossRef]
  54. He, J.; Lin, S.; Yu, Z.; Song, A.; Guan, Z.; Fang, W.; Chen, S.; Zhang, F.; Jiang, J.; Chen, F.; et al. Identification of 5S and 45S rDNA sites in Chrysanthemum species by using oligonucleotide fluorescence in situ hybridization (Oligo-FISH). Mol. Biol. Rep. 2021, 48, 21–31. [Google Scholar] [CrossRef] [PubMed]
  55. Zhang, D.M.; Sang, T. Chromosomal structural rearrangement of Paeonia brownii and P. californica revealed by fluorescence in situ hybridization. Genome 1998, 41, 848–853. [Google Scholar] [CrossRef]
  56. Zhang, D.M.; Sang, T. Physical mapping of ribosomal RNA genes in peonies (Paeonia, Paeoniaceae) by fluorescent in situ hybridization: Implications for phylogeny and concerted evolution. Am. J. Bot. 1999, 86, 735–740. [Google Scholar] [CrossRef] [PubMed]
  57. Sliwinska, E.; Loureiro, J.; Leitch, I.J.; Smarda, P.; Bainard, J.; Bures, P.; Chumova, Z.; Horova, L.; Koutecky, P.; Lucanova, M.; et al. Application-based guidelines for best practices in plant flow cytometry. Cytom. Part A 2022, 101, 749–781. [Google Scholar] [CrossRef]
  58. Roux, N.; Toloza, A.; Radecki, Z.; Zapata-Arias, F.J.; Dolezel, J. Rapid detection of aneuploidy in Musa using flow cytometry. Plant Cell Rep. 2003, 21, 483–490. [Google Scholar] [CrossRef]
  59. Dolezel, J.; Greilhuber, J.; Suda, J. Estimation of nuclear DNA content in plants using flow cytometry. Nat. Protoc. 2007, 2, 2233–2244. [Google Scholar] [CrossRef]
  60. Paszko, B. A critical review and a new proposal of karyotype asymmetry indices. Plant Syst. Evol. 2006, 258, 39–48. [Google Scholar] [CrossRef]
  61. Peruzzi, L.; Leitch, I.J.; Caparelli, K.F. Chromosome diversity and evolution in Liliaceae. Ann. Bot. 2009, 103, 459–475. [Google Scholar] [CrossRef]
  62. Czernicka, M.; Mscichowska, A.; Klein, M.; Muras, P.; Grzebelus, E. Paternity determination of interspecific rhododendron hybrids by genomic in situ hybridization (GISH). Genome 2010, 53, 277–284. [Google Scholar] [CrossRef]
  63. Doyle, J.J. A rapid total DNA preparation procedure for fresh plant tissue. Focus 1990, 12, 13–15. [Google Scholar]
  64. Brammer, S.P.; Vasconcelos, S.; Poersch, L.B.; Oliveira, A.R.; Brasileiro-Vidal, A.C. Genomic in situ Hybridization in Triticeae: A Methodological Approach. In Plant Breeding from Laboratories to Fields; Andersen, S.B., Ed.; IntechOpen: London, UK, 2013. [Google Scholar]
  65. Altinordu, F.; Peruzzi, L.; Yu, Y.; He, X. A tool for the analysis of chromosomes: KaryoType. Taxon 2016, 65, 586–592. [Google Scholar] [CrossRef]
Figure 1. Flow cytometry analysis of the three taxa in Paeonia L., including sect. Moutan (M01–06), sect. Paeonia (P01–06), and Itoh hybrid (It01–06). (A) Morphology of the peonies; (B,C) flow cytometric histograms of pepper cv. Zunla-1 and various of peonies. The names of the peony species and varieties are shown in Table 1.
Ijms 23 11406 g001
Figure 2. Metaphase chromosomes of 30 peony materials in (A) sect. Moutan, (B) sect. Paeonia, (C) Itoh hybrids, and (D) morphology of Itoh hybrids It07–It18. The ploidy of materials in (A,B) are shown on the upper right of each image. The codes in (AD) represent the material names as shown in Table 1 and Table 2; bar = 10 μm.
Ijms 23 11406 g002
Figure 3. Chromosome idiograms of 30 species or varieties in Paeonia L. of (A) sect. Moutan, (B) sect. Paeonia, and (C) Itoh hybrids. The orange fragment on the top of partial chromosomes indicates satellites. The names of each code on the upper right of each image are shown in Table 1 and Table 2; bar = 10 μm.
Ijms 23 11406 g003
Figure 4. Comparison of karyological diversity among different peony species or varieties in sect. Moutan, sect. Paeonia, and Itoh hybrids. (A) The range and distribution of seven chromosomal parameters. Horizontal lines and hollow circles in the box represent median and mean values, respectively [50% of data are within the box, and 99% are within the bar (± SD)]. The asterisks represent data outside the box. (B) Pearson correlation analysis of seven chromosomal parameters shown in (A); the asterisks *, **, and *** indicate a significant correlation at the 0.05, 0.01, and 0.001 levels, respectively. (C) Hierarchical clustering analysis of the 30 peonies based on the seven chromosomal parameters shown in (A). The names of 30 peonies and categories of seven parameters are shown in Table 1 and Table 2.
Ijms 23 11406 g004
Figure 5. Comparative GISH mapping of four representative Itoh hybrids using gDNA of selected species or varieties as probes. Pd + YF indicates the mixed probes with P. delavayi var. lutea (green) and ‘Yang Fei Chu Yu’ (red). The red arrows indicate the labeled chromosomes with weak signals. Bar = 10 μm.
Ijms 23 11406 g005
Figure 6. GISH analysis of mitotic chromosome pairings by pairwise hybridization in (A) sect. Moutan and (B) sect. Paeonia. Self refers to a situation where the material is used both as probe and chromosomal slide; P. P.o-Chl. B.S. means P. officinalis and ‘Bai Shao’ are used as probe and chromosomal slide, respectively. Bar = 10 μm.
Ijms 23 11406 g006
Figure 7. GISH analysis of mitotic pairings in ‘Nong Yuan Jin Ke’ using P. delavayi var. lurea, ‘High Noon’ and ‘Chojuraku’ as gDNA probes. (A) GISH results, bar = 10 μm; (B) morphylogy of ‘Nong Yuan Jin Ke’ and its parents.
Ijms 23 11406 g007
Figure 8. 5S rDNA-FISH analysis of mitotic chromosome pairings in (A) ‘Luo Yang Hong’ and (B) ‘Garden Treasure’, and (C) the combination of 5S rDNA-FISH and GISH in the same cell of ‘Julia Rose’ with P. delavayi var. lutea as the GISH probe with five red arrows indicating the GISH signals.
Ijms 23 11406 g008
Table 1. Information and relative genome size of 18 species or varieties in Paeonia L.
TaxaCodeNameIndication aRelative Ploidy bGenome Size (Gb) c
Sect.
Moutan
M01P. delavayi var. lutea18,8232.0012.45
M02P. delavayi16,7781.7811.08
M03P. rockii17,9661.9111.89
M04P. ostii21,4752.2814.19
M05P. × lemoinei ‘High Noon’23,9022.5415.81
M06P. suffruticosa ‘Luo Yang Hong’23,9282.5415.81
Sect.
Paeonia
P01P. veitchii22,3412.3714.75
P02P. lactiflora ‘Bai Shao’16,9451.8011.21
P03P. lactiflora “Yang Fei Chu Yu’16,2711.7310.77
P04P. sp. ‘Red Charm’19,9972.1213.20
P05P. mairei31,4163.3420.79
P06P. officinalis32,6953.4721.60
Itoh
hybrid
It01‘Going Bananas’34,3523.6522.72
It02‘Bartzella’32,1673.4221.29
It03‘Viking Full Moon’24,5822.6116.25
It04‘Garden Treasure’23,6342.5115.62
It05‘Prairie Charm’26,8882.8617.80
It06‘Morning Lilac’24,6452.6216.31
a Reading number on flow cytometry; b the size of P. delavayi var. lutea was set as 2.00; c based on the genome size of pepper (3.35 Gb) as a standard [36].
Table 2. Collecting information of materials and cytogenetics data.
TaxonCodeNameSs’CPloidyHKFTHL (μm)RL (%)MARXCI (%)CVCLCVCIAIL/S
Sect.
Moutan
M01P. delavayi var. lutea2A2n = 2x = 106m * + 2sm + 2st68.3815.87~23.111.8738.2513.8628.954.011.50
M02P. delavayi2A2n = 2x = 106m ** + 2sm + 2st **73.9015.66~22.262.0236.5713.8529.094.031.46
M03P. rockii2A2n = 2x = 106m + 2sm + 2st *75.1315.45~22.902.2836.5614.0236.265.081.54
M04P. ostii2A2n = 2x = 106m * + 2sm + 2st *80.9415.79~21.772.0236.7011.9530.103.601.44
M05P. × lemoinei ‘High Noon’2A2n = 2x = 108m + 2st72.3116.66~22.021.8638.3411.6228.023.261.43
M06P. suffruticosa ‘Luo Yang Hong’2A2n = 2x = 106m + 2sm + 2st *58.5116.00~22.562.2736.7612.2135.894.381.48
Sect.
Paeonia
P01P. veitchii2A2n = 2x = 106m * + 2sm + 2st *66.2816.06~24.812.2037.5316.9736.556.201.60
P02P. lactiflora ‘Bai Shao’2A2n = 2x = 106m + 2sm ** + 2st *72.7415.64~23.952.3635.7116.4837.916.251.63
P03P. lactiflora “Yang Fei Chu Yu’2A2n = 2x = 106m + 2sm + 2st76.7516.30~23.761.9736.9715.1428.414.301.59
P04P. sp. ‘Red Charm’2A2n = 3x = 1510m + 3sm + 2st60.1116.94~23.421.6940.2513.6523.543.211.67
P05P. mairei2A2n = 4x = 2012m + 4sm * + 4st *71.8116.31~25.372.1036.8917.0232.485.531.76
P06P. officinalis2A2n = 4x = 2012m + 4sm + 4st ***82.2515.61~24.962.2436.6617.6033.585.911.95
Itoh
hybrid
It01‘Going Bananas’2A2n = 3x = 159m + 3sm ** + 3st69.7016.17~23.731.8538.4814.9825.573.831.77
It02‘Bartzella’2A2n = 3x = 159m + 3sm + 3st64.5615.50~24.941.9138.3317.6527.744.901.89
It03‘Viking Full Moon’2A2n = 3x = 159m * + 3sm + 3st58.3116.41~22.362.0436.4511.1826.943.011.57
It04‘Garden Treasure’2A2n = 3x = 159m + 3sm + 3st58.9916.34~22.791.9937.1512.1329.543.581.57
It05‘Prairie Charm’2A2n = 3x = 159m + 3sm + 3st *79.0516.32~23.682.2535.9514.8432.194.781.62
It06‘Morning Lilac’2A2n = 3x = 1512m + 3st64.0716.44~22.601.7939.6013.5026.343.561.65
It07‘Cora Louise’2A2n = 3x = 159m + 3sm + 3st73.3515.72~24.742.0936.8317.1429.975.141.74
It08‘Julia Rose’2A2n = 3x = 159m * + 3sm * + 3st64.6816.56~23.382.1637.1613.6833.194.541.62
It09‘Court Jester’2A2n = 3x = 159m + 3sm + 3st59.6317.10~24.451.9837.8215.1331.004.691.73
It10‘Lemon Dream’2A2n = 3x = 159m + 3sm + 3st66.7015.50~23.272.0636.1714.2629.084.151.87
It11‘Sequestered Sunshine’2A2n = 3x = 159m + 3sm * + 3st72.0015.97~24.011.9837.4814.2928.814.121.63
It12‘Yellow Crown’2A2n = 3x = 159m + 3sm + 3st45.8415.80~21.961.9137.3912.3025.443.131.66
It13‘Ballarena de Saval’2A2n = 3x = 159m + 3sm + 3st65.5815.85~23.471.8937.9014.0426.753.761.63
It14‘Sugar Plum Fairy’2A2n = 3x = 159m + 3sm + 3st58.3515.75~23.211.9037.6114.2827.903.981.69
It15‘Lollipop’2A2n = 3x = 1510m + 3sm + 2st55.7316.19~22.761.7639.0412.9522.562.921.59
It16‘Magical Mystery Tour’2A2n = 3x = 159m + 3sm + 3st54.5416.15~21.691.9237.2711.4926.123.001.67
It17‘Scarlet Heaven’2A2n = 3x = 159m + 3sm + 3st67.1717.19~23.261.8937.6612.2925.053.081.65
It18‘Dark Eyes’2A2n = 3x = 159m + 3sm + 3st64.6916.03~23.601.8738.1214.8626.904.001.77
Note: Ss’C: Stebbins’s classification; HKF: haploid karyotype formula, *, ** and *** mean one, two and three satellites, respectively; THL: total haploid (monoploid) length of chromosome set; RL: relative length; MAR: mean arm ratio; XCI: mean centromeric index; CVCL: coefficient of variation of chromosome length; CVCI: coefficient of variation of centromeric index; AI: asymmetry index; L/S: ratio of the longest/short chromosomes. The bold fond of data presents the maximum or minimum value in each catalog.
Publisher’s Note: MDPI stays neutral with regard to jurisdictional claims in published maps and institutional affiliations.

