
Expression of Cell Cycle Markers and Proliferation Factors during Human Eye Embryogenesis and Tumorigenesis

 , ,
, , 
Abstract
:1. Introduction
2. Results
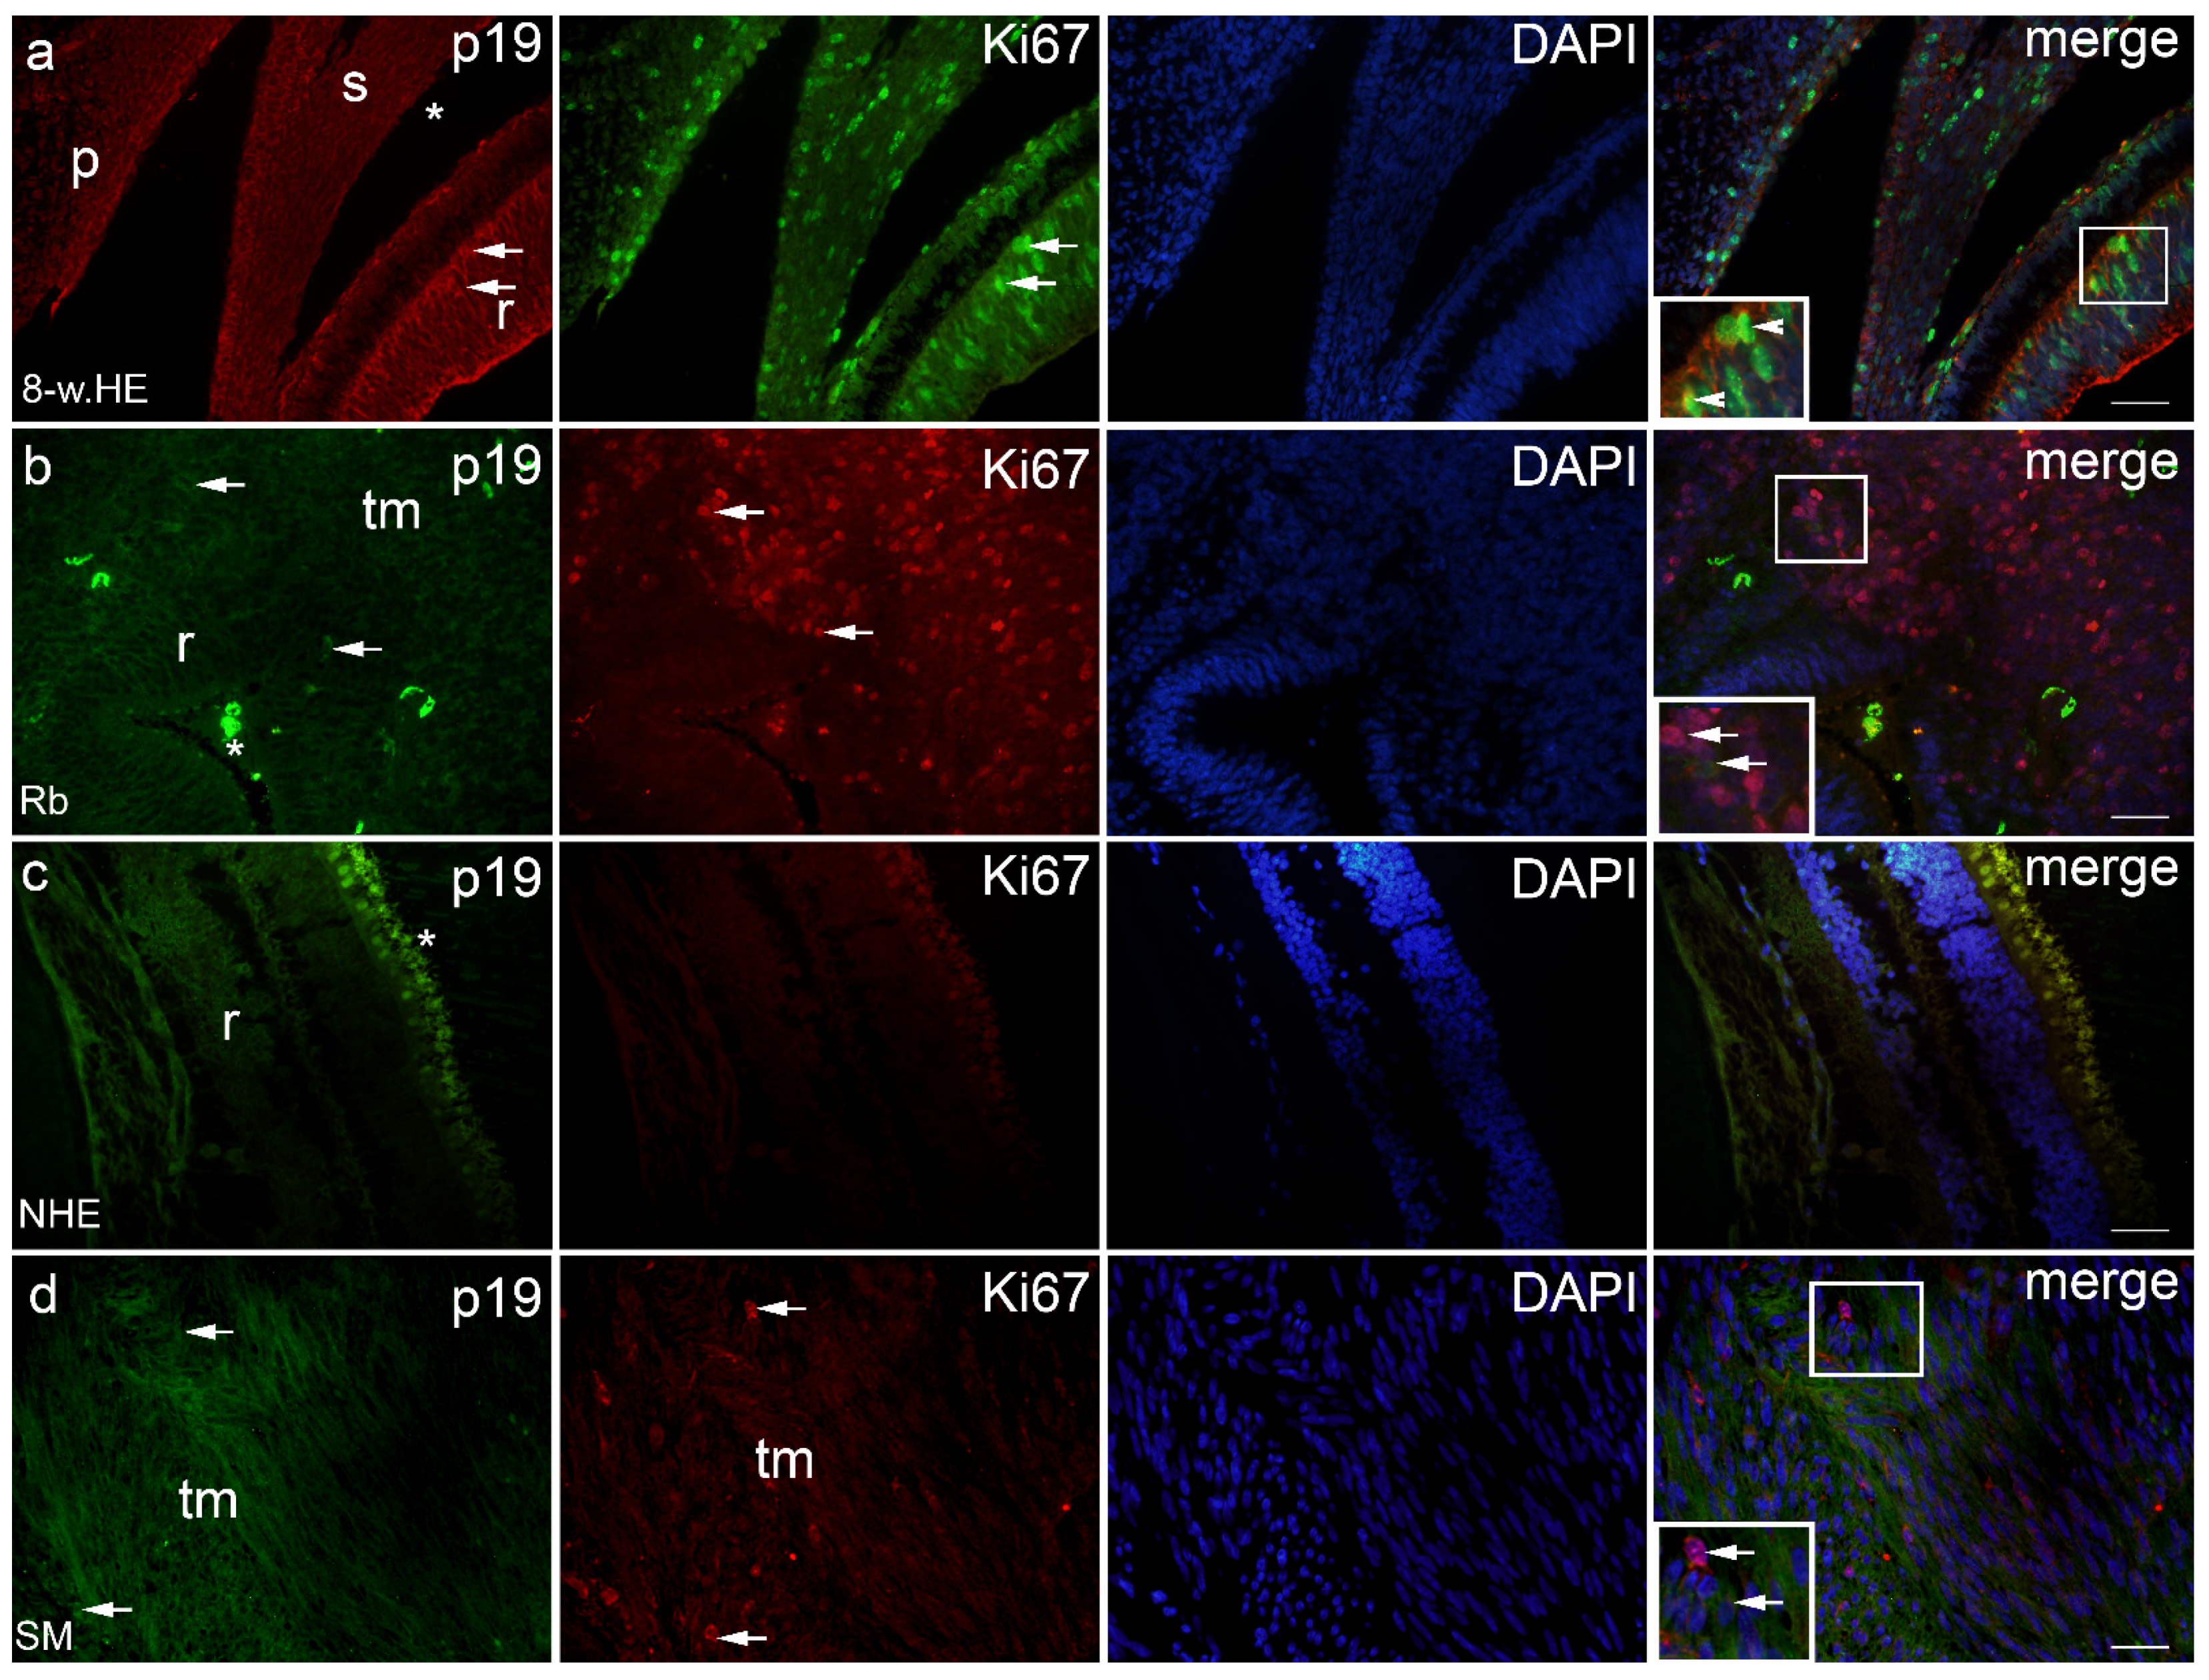
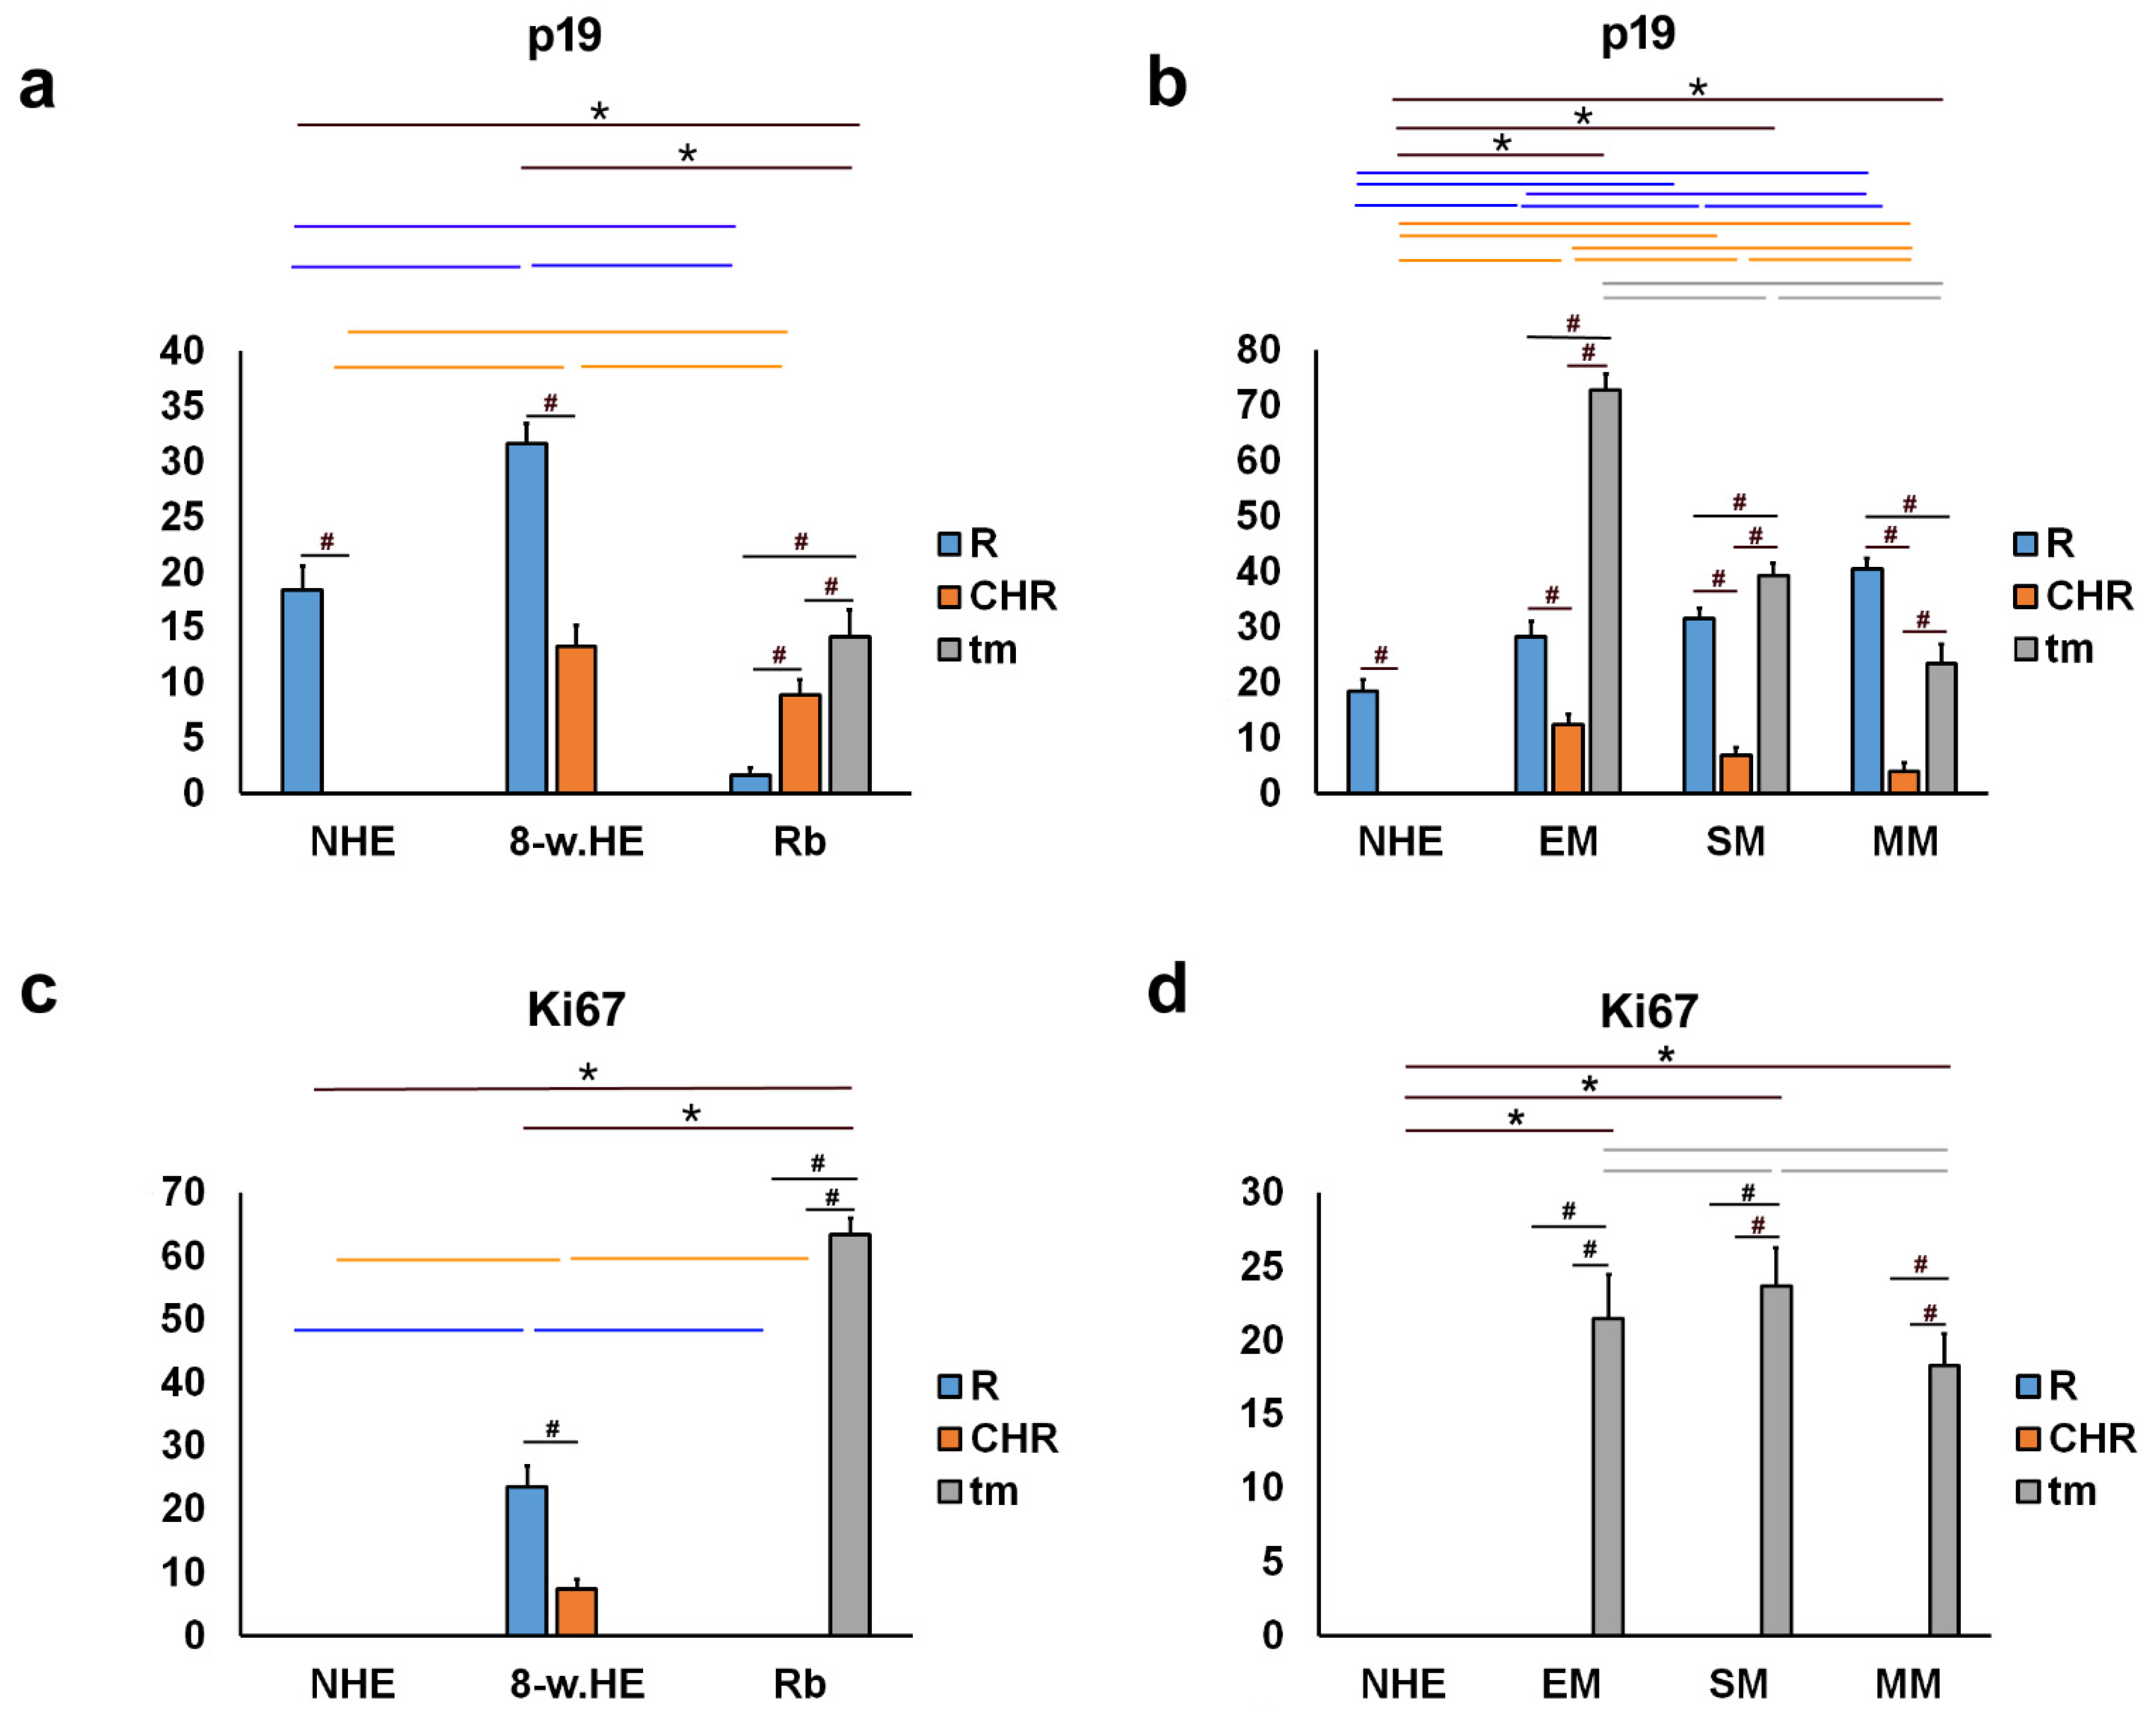
2.1. p19 and Ki67
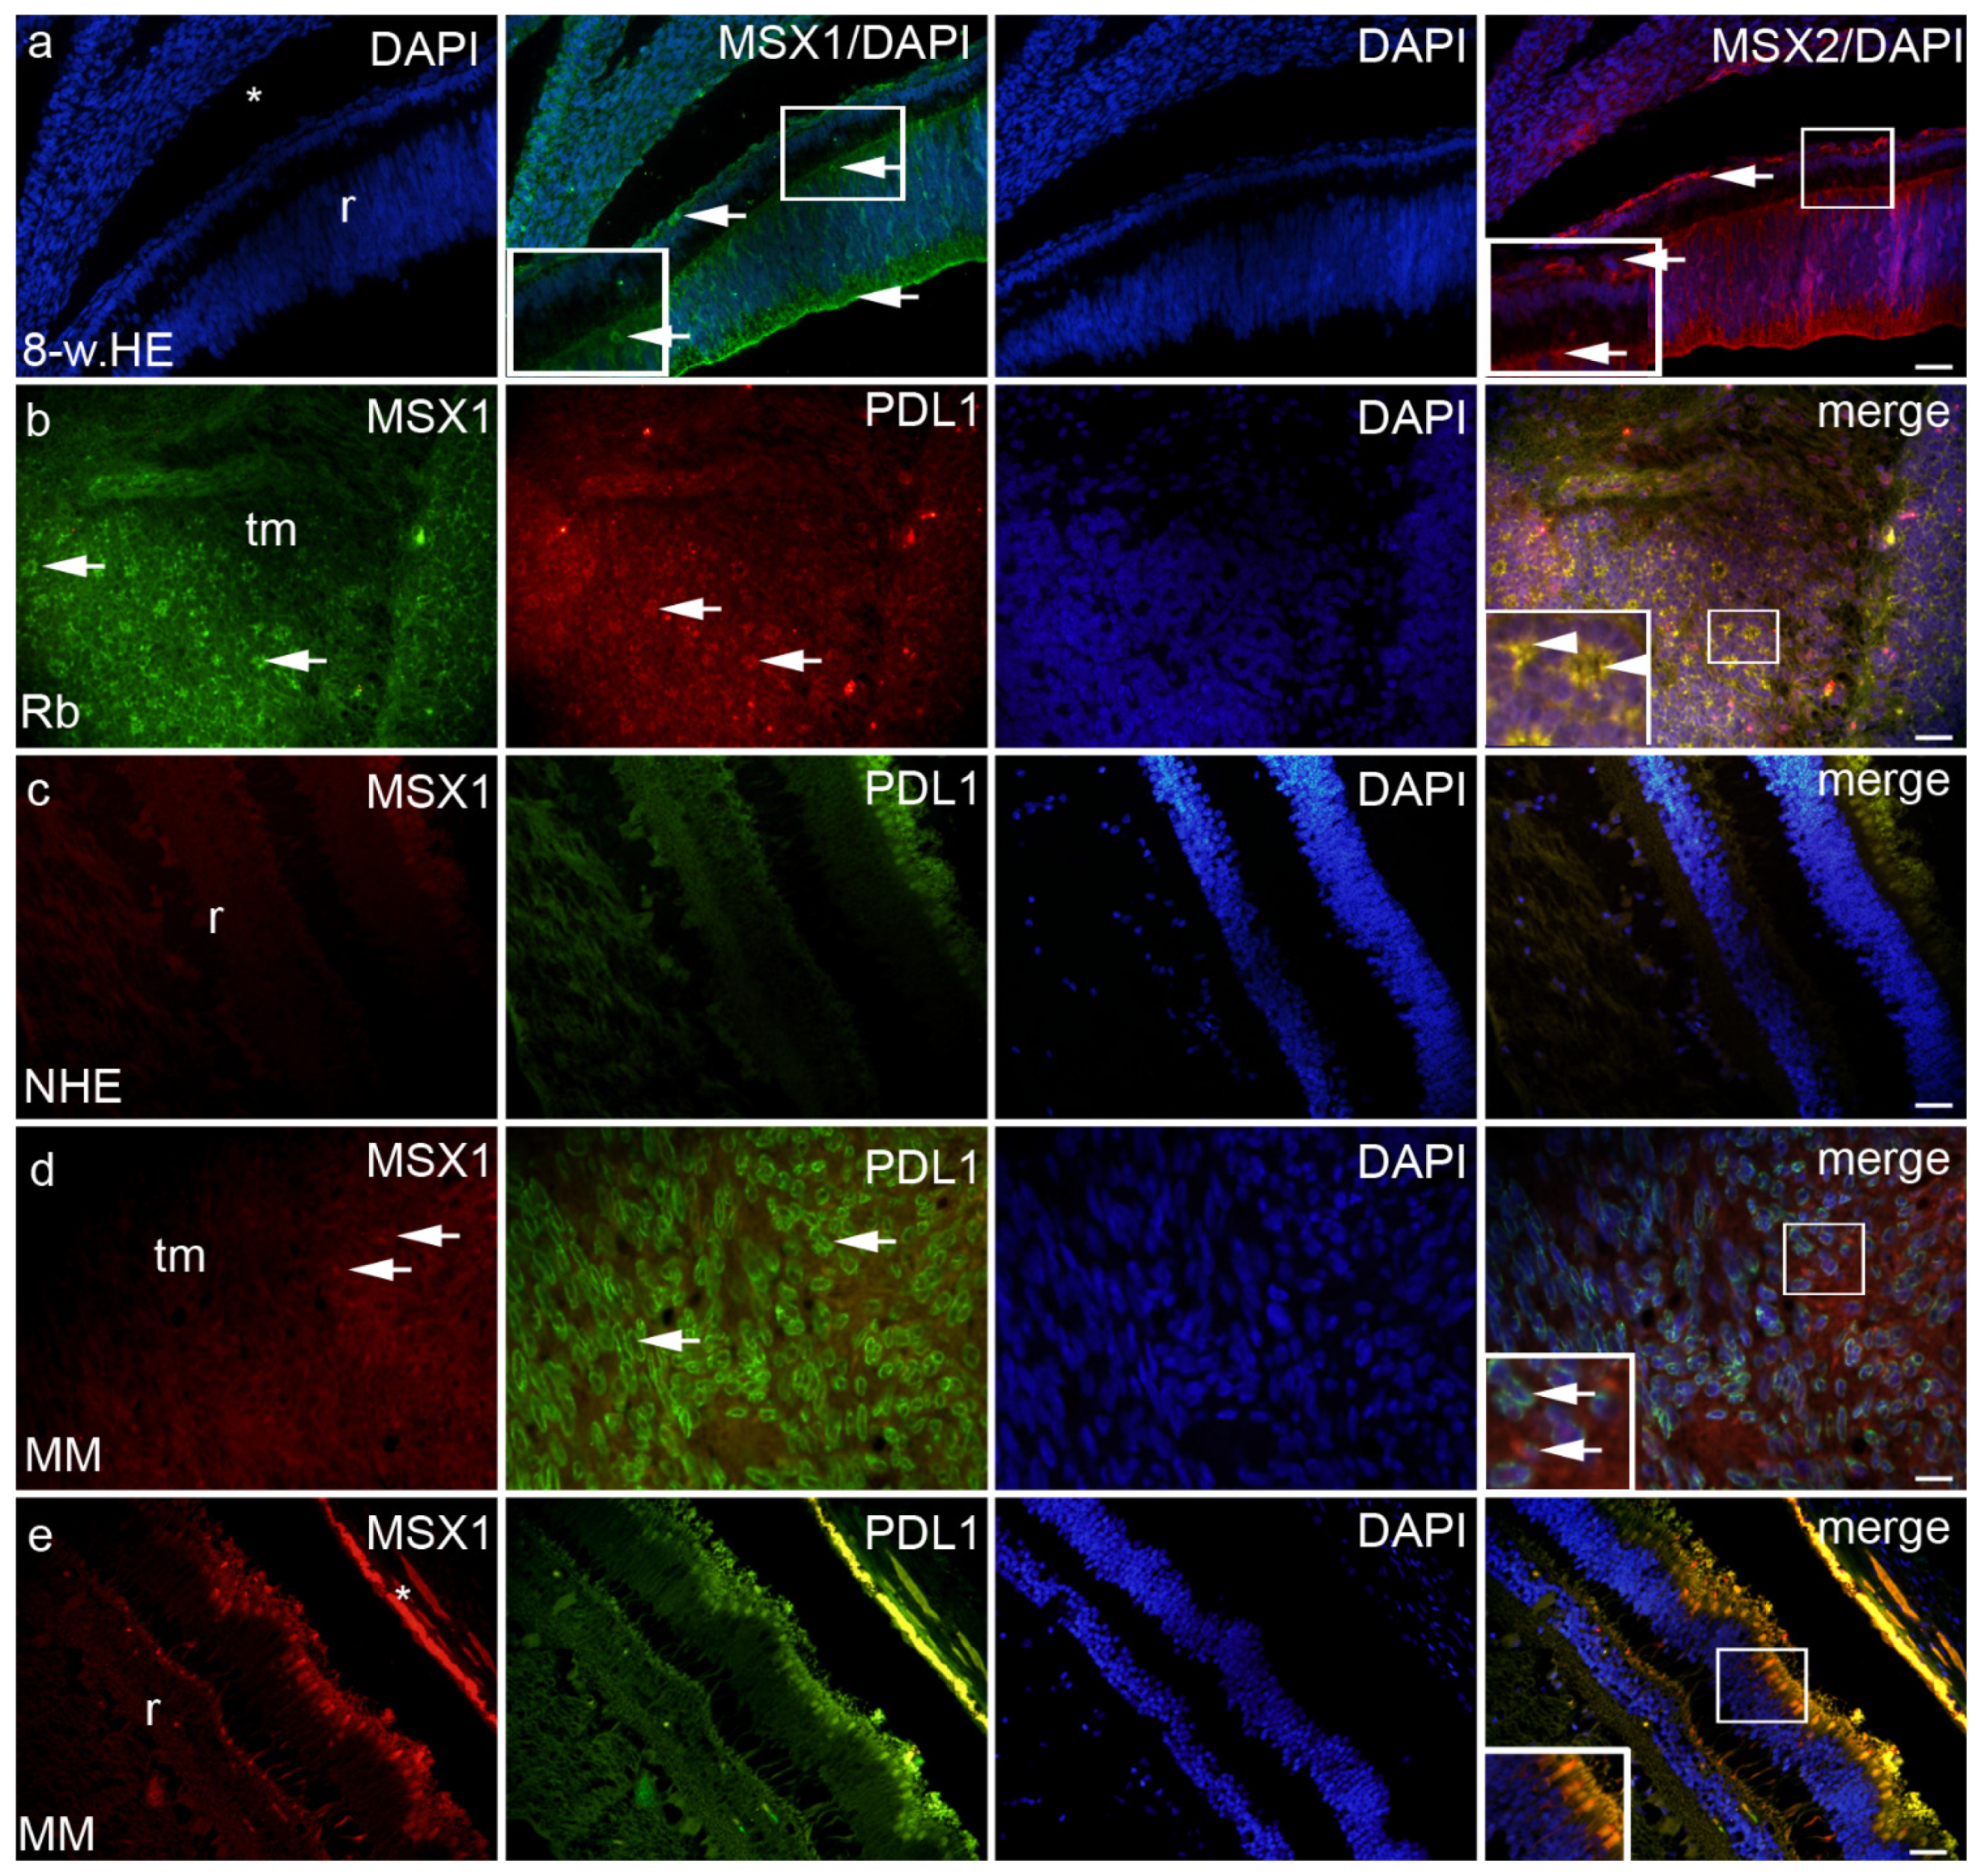
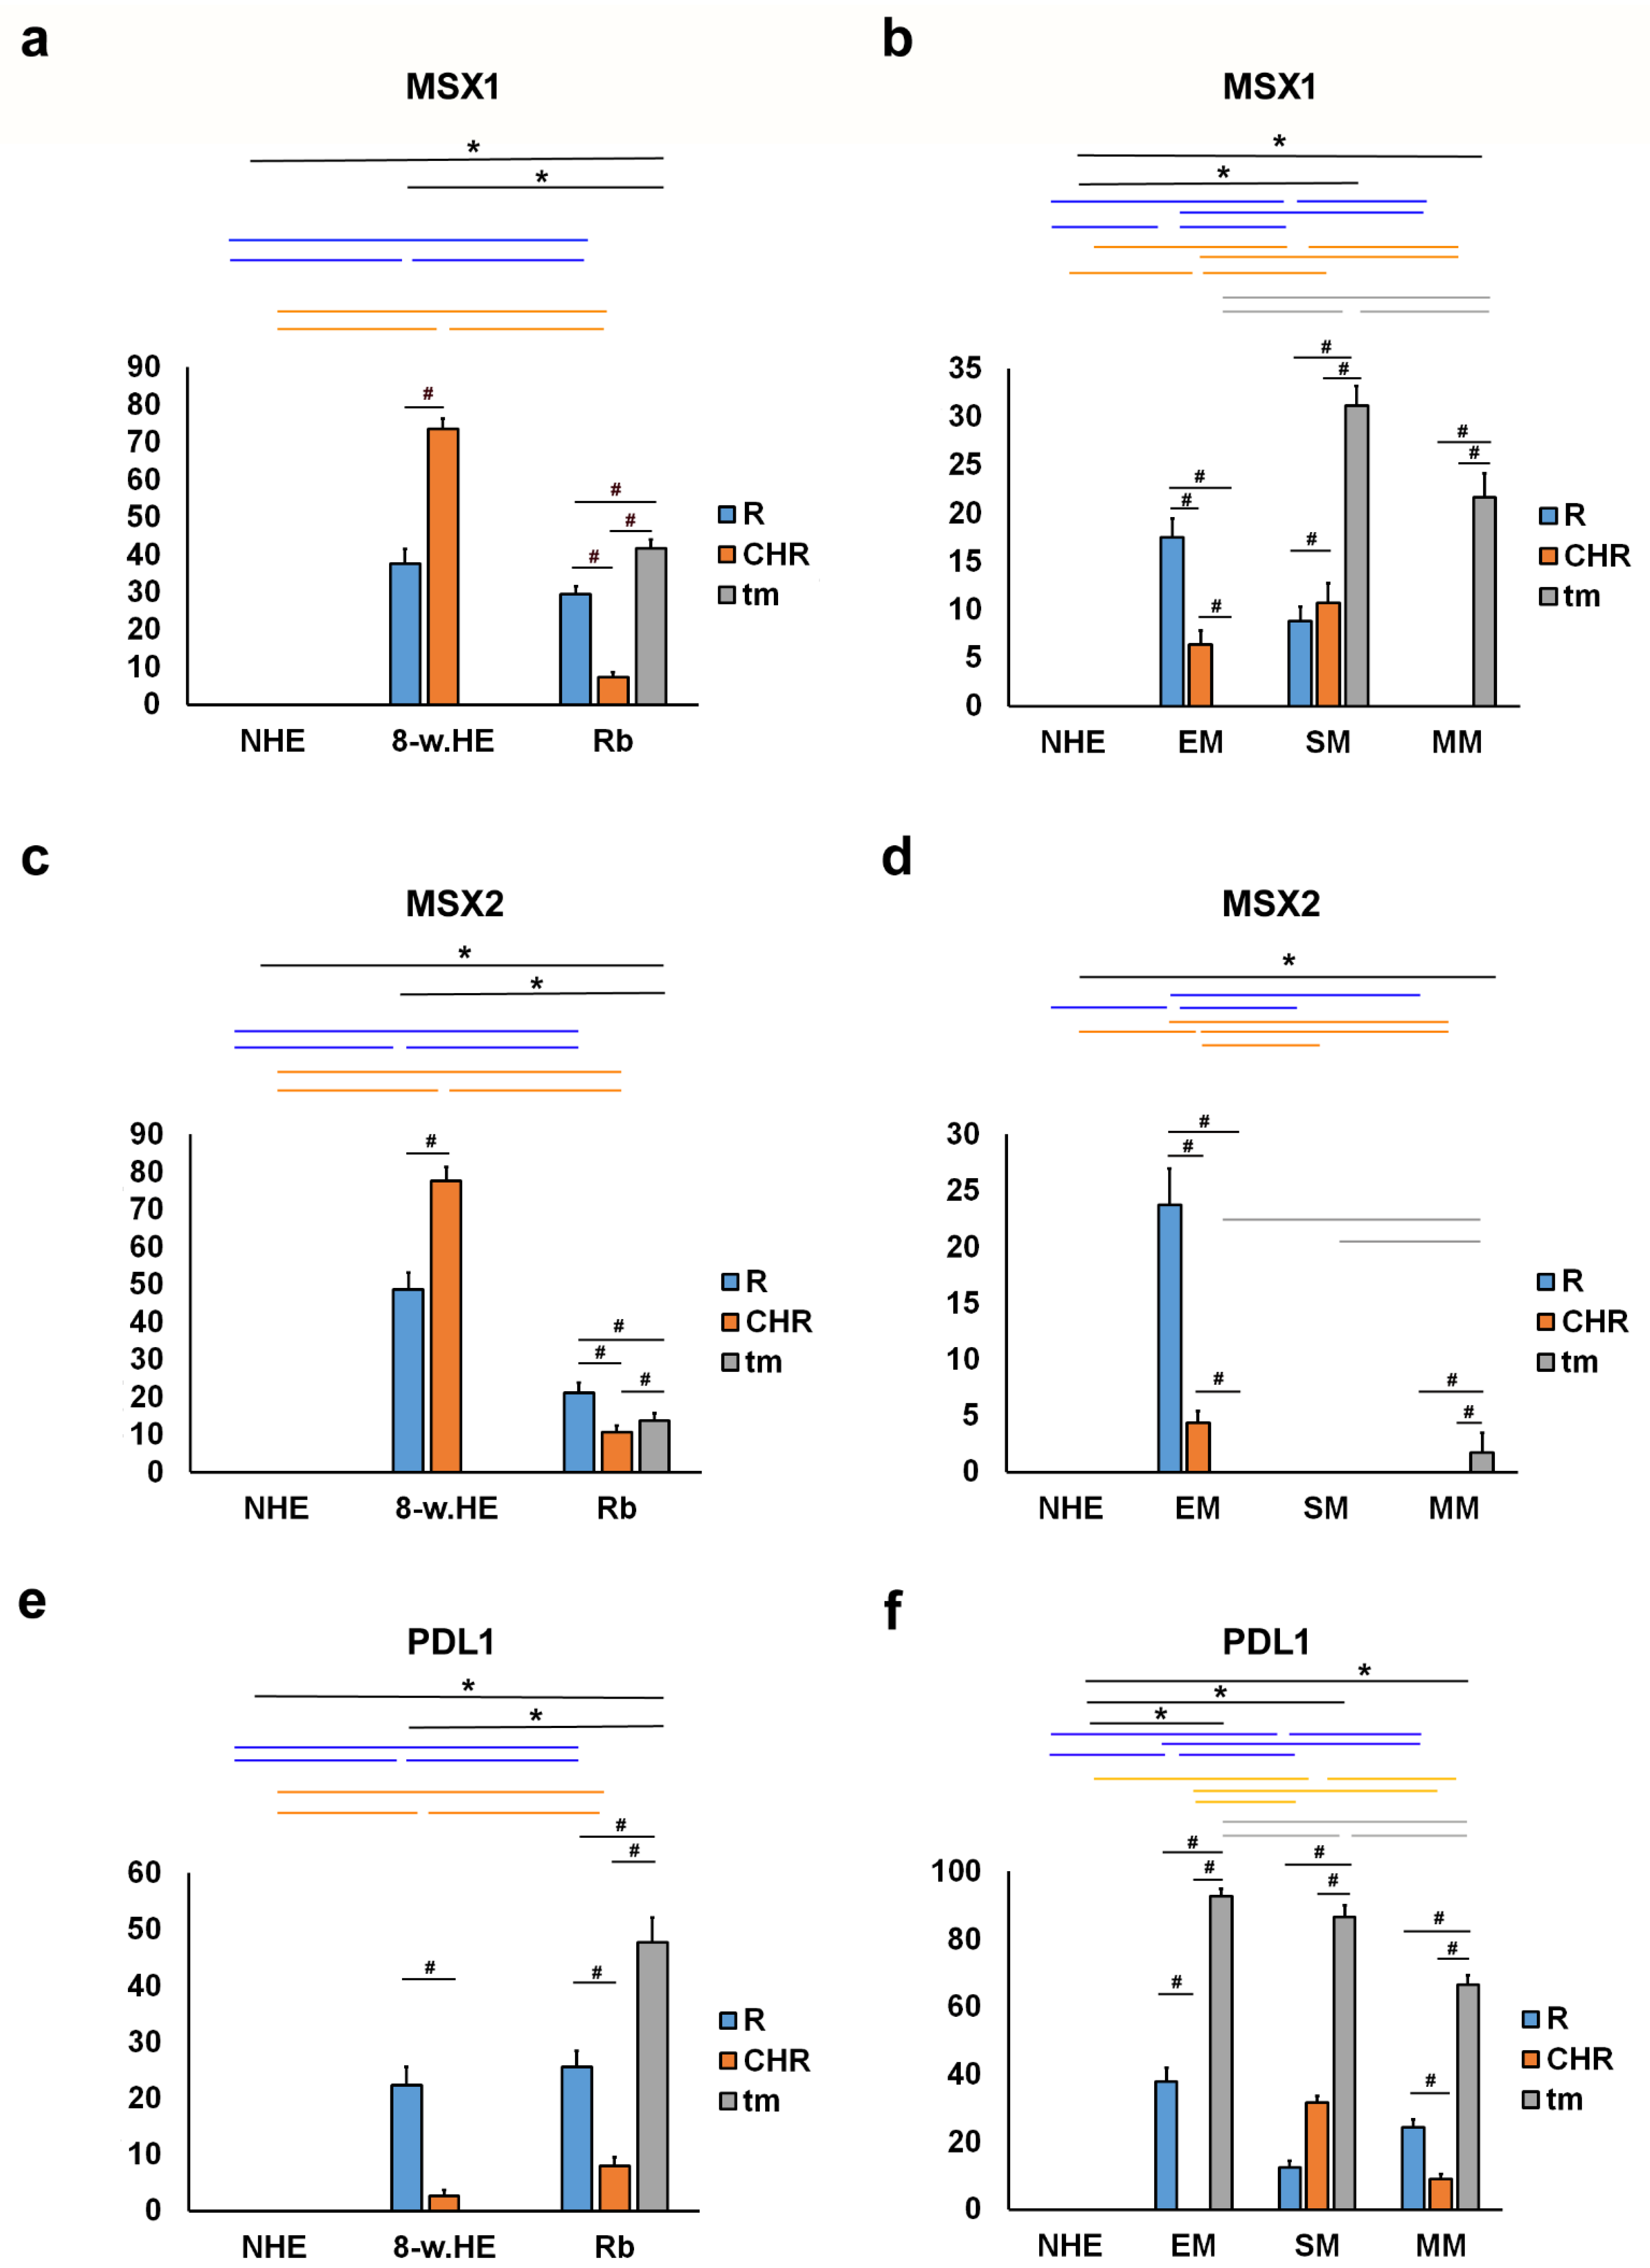
2.2. MSX1, MSX2 and PDL1
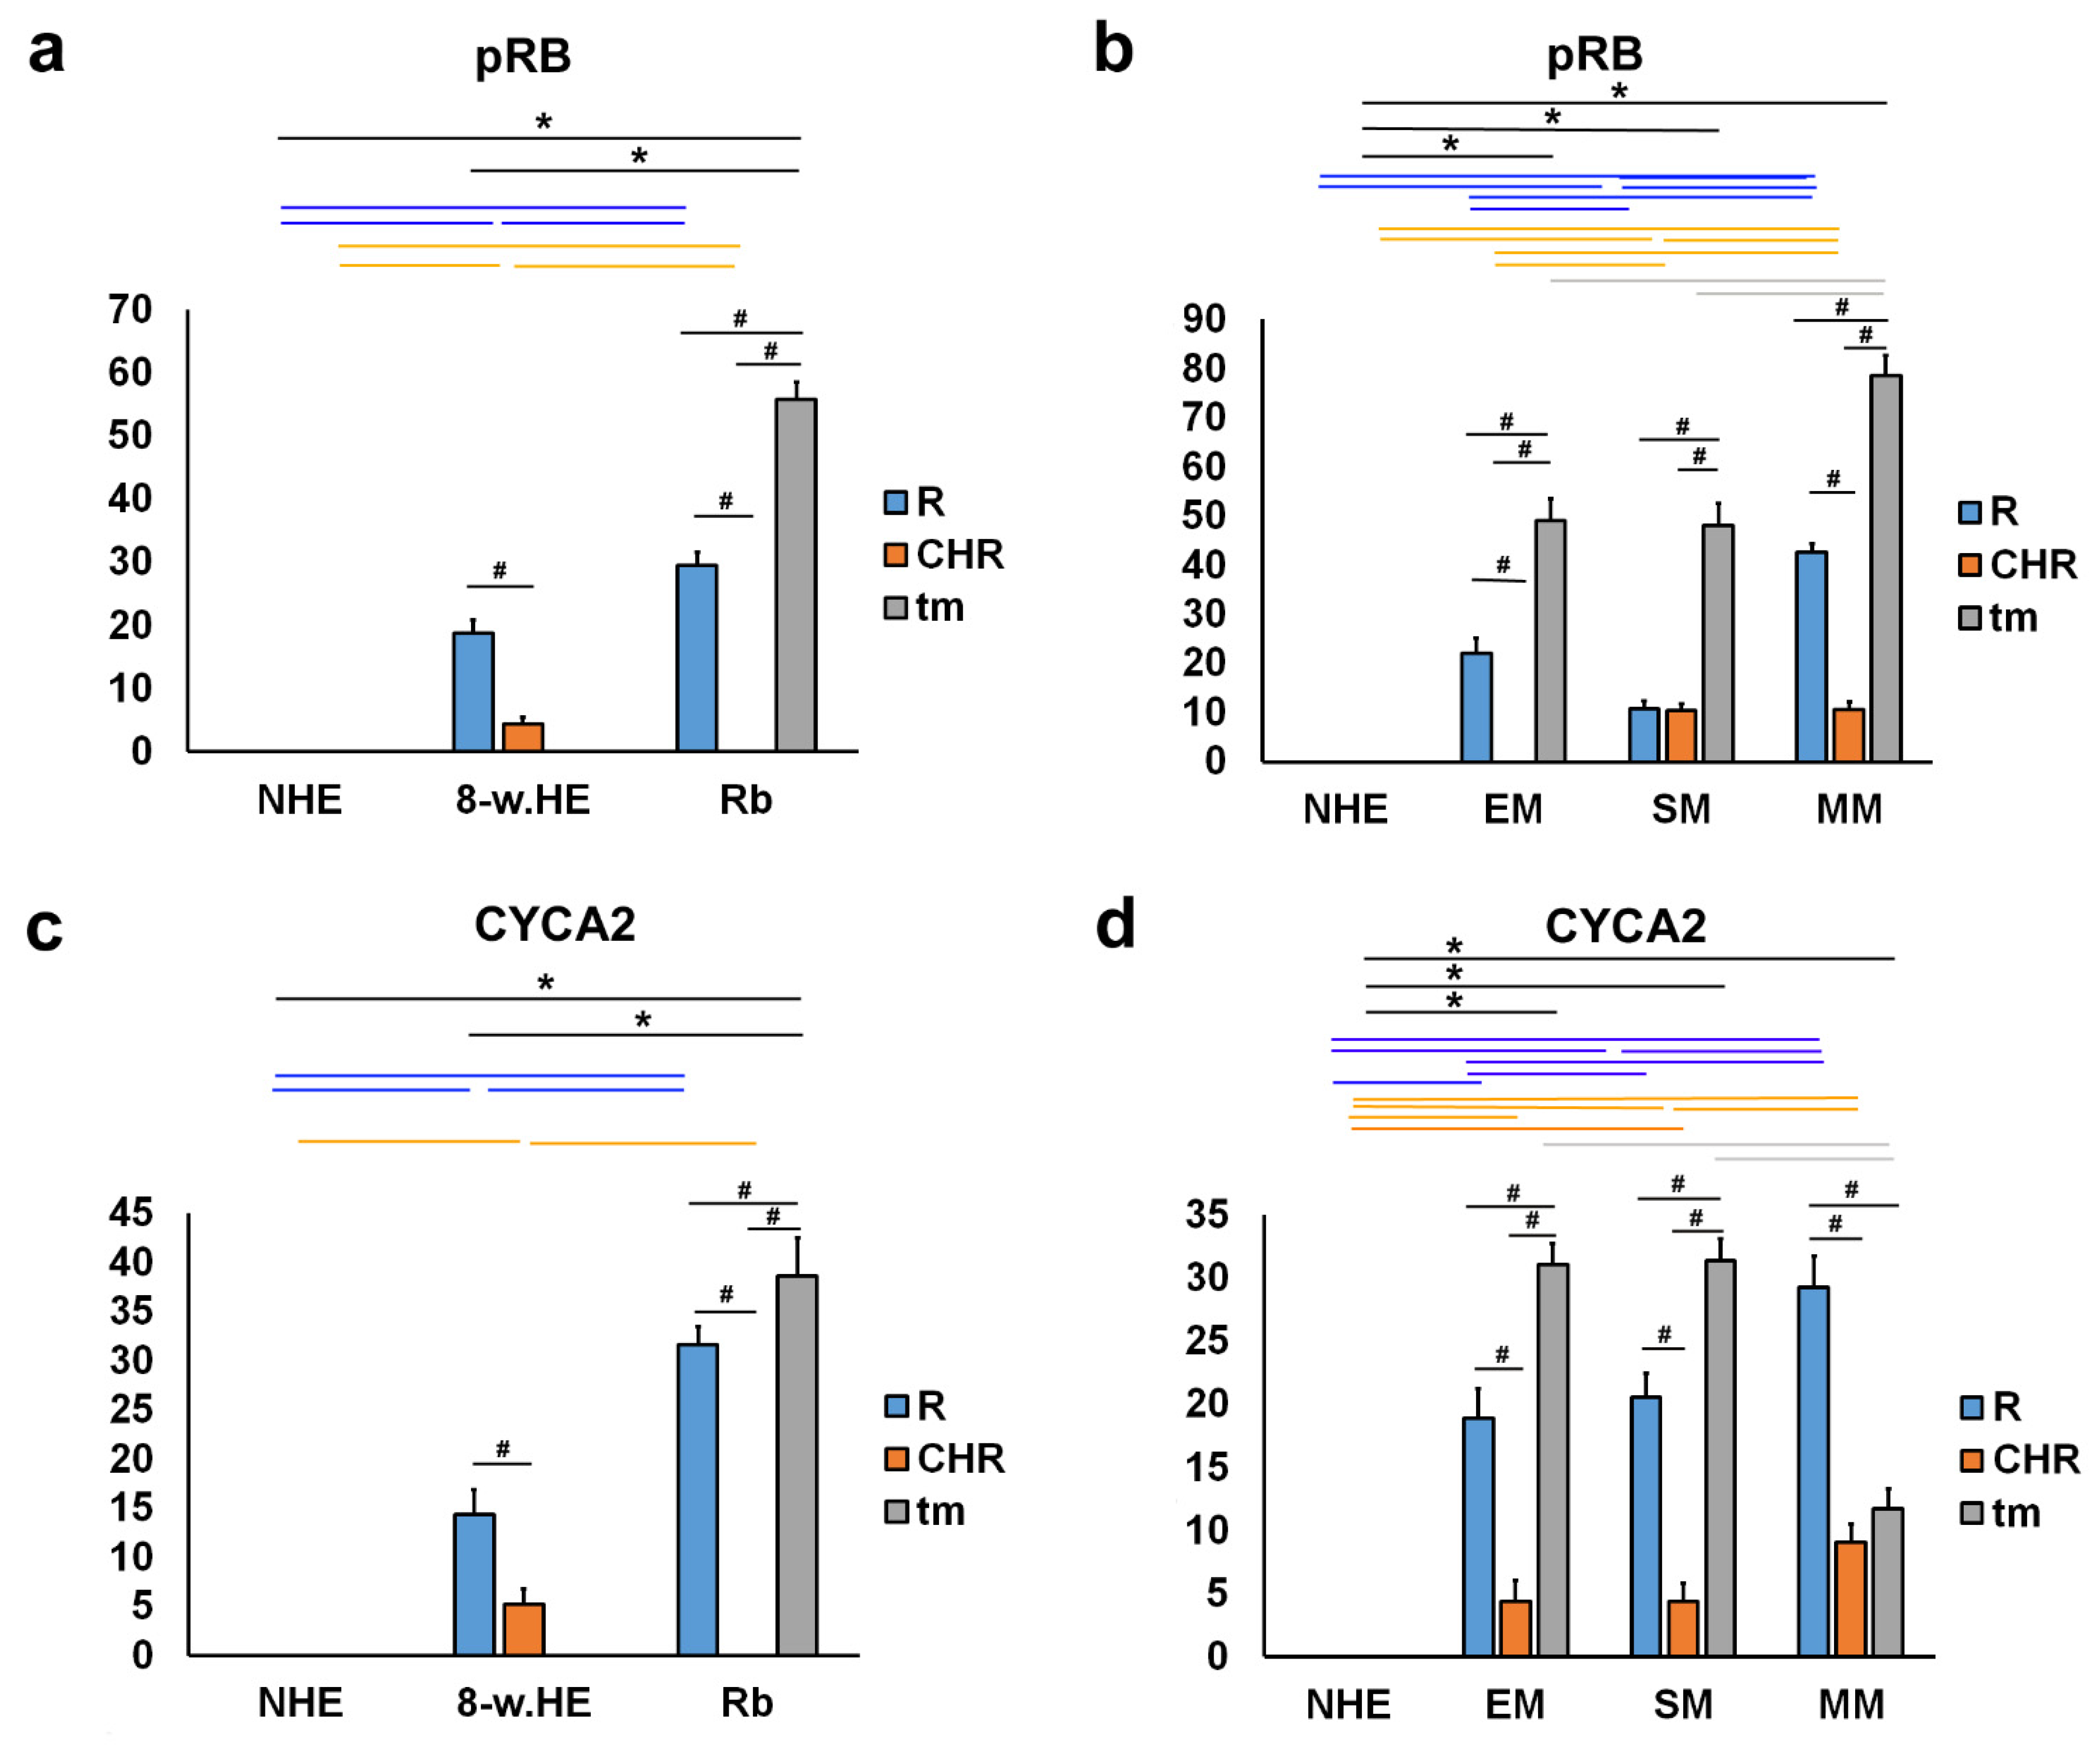
2.3. pRB and CYCA2
3. Discussion
4. Materials and Methods
4.1. Tissue Procurement
4.2. Double Immunofluorescence
4.3. Data Analysis
4.4. Semiquantitative Analysis
4.5. Statistical Analysis
Supplementary Materials
Author Contributions
Funding
Institutional Review Board Statement
Informed Consent Statement
Data Availability Statement
Conflicts of Interest
References
- Vukojevic, K.; Carev, D.; Sapunar, D.; Petrovic, D.; Saraga-Babic, M. Developmental patterns of caspase-3, bax and bcl-2 proteins expression in the human spinal ganglia. J. Mol. Histol. 2008, 39, 339–349. [Google Scholar] [CrossRef] [PubMed]
- Žužul, M.; Lozić, M.; Filipović, N.; Čanović, S.; Didović Pavičić, A.; Petričević, J.; Kunac, N.; Šoljić, V.; Saraga-Babić, M.; Konjevoda, S.; et al. The Expression of Connexin 37, 40, 43, 45 and Pannexin 1 in the Early Human Retina and Choroid Development and Tumorigenesis. Int. J. Mol. Sci. 2022, 23, 5918. [Google Scholar] [CrossRef] [PubMed]
- Zhang, M.H.; Niu, H.; Li, Z.; Huo, R.T.; Wang, J.M.; Liu, J. Activation of PI3K/AKT is involved in TINAG-mediated promotion of proliferation, invasion and migration of hepatocellular carcinoma. Cancer Biomark. Sect. A Dis. Markers 2018, 23, 33–43. [Google Scholar] [CrossRef]
- Xiao, W.; Ye, H.; Zeng, H.; Tang, L.; Chen, R.; Gao, Y.; Mao, Y.; Yang, H. Associations among Socioeconomic Factors, Lag Time, and High-Risk Histopathologic Features in Eyes Primarily Enucleated for Retinoblastoma. Curr. Eye Res. 2019, 44, 1144–1149. [Google Scholar] [CrossRef] [Green Version]
- Kaliki, S.; Shields, C.L. Uveal melanoma: Relatively rare but deadly cancer. Eye (Lond) 2017, 31, 241–257. [Google Scholar] [CrossRef] [Green Version]
- Eagle, R.C., Jr. Ocular tumors: Triumphs, challenges and controversies. Saudi J. Ophthalmol. Off. J. Saudi Ophthalmol. Soc. 2013, 27, 129–132. [Google Scholar] [CrossRef] [PubMed] [Green Version]
- Eagle, R.C., Jr. The pathology of ocular cancer. Eye 2013, 27, 128–136. [Google Scholar] [CrossRef] [Green Version]
- Kero, D.; Vukojevic, K.; Stazic, P.; Sundov, D.; Mardesic Brakus, S.; Saraga-Babic, M. Regulation of proliferation in developing human tooth germs by MSX homeodomain proteins and cyclin-dependent kinase inhibitor p19(INK4d). Organogenesis 2017, 13, 141–155. [Google Scholar] [CrossRef] [Green Version]
- Dyson, N.J. RB1: A prototype tumor suppressor and an enigma. Genes Dev. 2016, 30, 1492–1502. [Google Scholar] [CrossRef] [Green Version]
- Kero, D.; Novakovic, J.; Vukojevic, K.; Petricevic, J.; Kalibovic Govorko, D.; Biocina-Lukenda, D.; Saraga-Babic, M. Expression of Ki-67, Oct-4, gamma-tubulin and alpha-tubulin in human tooth development. Arch. Oral Biol. 2014, 59, 1119–1129. [Google Scholar] [CrossRef]
- Madewell, B.R. Cellular proliferation in tumors: A review of methods, interpretation, and clinical applications. J. Vet. Intern. Med. 2001, 15, 334–340. [Google Scholar] [CrossRef] [PubMed]
- Canepa, E.T.; Scassa, M.E.; Ceruti, J.M.; Marazita, M.C.; Carcagno, A.L.; Sirkin, P.F.; Ogara, M.F. INK4 proteins, a family of mammalian CDK inhibitors with novel biological functions. IUBMB Life 2007, 59, 419–426. [Google Scholar] [CrossRef] [PubMed]
- Belanger, M.C.; Robert, B.; Cayouette, M. Msx1-Positive Progenitors in the Retinal Ciliary Margin Give Rise to Both Neural and Non-neural Progenies in Mammals. Dev. Cell 2017, 40, 137–150. [Google Scholar] [CrossRef] [PubMed] [Green Version]
- Jiang, S.Y.; Wang, J.T. Msx2 alters the timing of retinal ganglion cells fate commitment and differentiation. Biochem. Biophys. Res. Commun. 2010, 395, 524–529. [Google Scholar] [CrossRef]
- Gremel, G.; Ryan, D.; Rafferty, M.; Lanigan, F.; Hegarty, S.; Lavelle, M.; Murphy, I.; Unwin, L.; Joyce, C.; Faller, W.; et al. Functional and prognostic relevance of the homeobox protein MSX2 in malignant melanoma. Br. J. Cancer 2011, 105, 565–574. [Google Scholar] [CrossRef] [PubMed] [Green Version]
- Usui, Y.; Okunuki, Y.; Hattori, T.; Kezuka, T.; Keino, H.; Ebihara, N.; Sugita, S.; Usui, M.; Goto, H.; Takeuchi, M. Functional expression of B7H1 on retinal pigment epithelial cells. Exp. Eye Res. 2008, 86, 52–59. [Google Scholar] [CrossRef] [PubMed]
- Bendris, N.; Loukil, A.; Cheung, C.; Arsic, N.; Rebouissou, C.; Hipskind, R.; Peter, M.; Lemmers, B.; Blanchard, J.M. Cyclin A2: A genuine cell cycle regulator? Biomol. Concepts 2012, 3, 535–543. [Google Scholar] [CrossRef] [Green Version]
- Verdugo-Sivianes, E.M.; Carnero, A. Role of the Holoenzyme PP1-SPN in the Dephosphorylation of the RB Family of Tumor Suppressors During Cell Cycle. Cancers 2021, 13, 2226. [Google Scholar] [CrossRef]
- Matas, A.; Filipovic, N.; Znaor, L.; Mardesic, S.; Saraga-Babic, M.; Vukojevic, K. Interplay of proliferation and differentiation factors is revealed in the early human eye development. Graefe’s Arch. Clin. Exp. Ophthalmol. 2015, 253, 2187–2201. [Google Scholar] [CrossRef]
- Bozanic, D.; Saraga-Babic, M. Cell proliferation during the early stages of human eye development. Anat. Embryol. 2004, 208, 381–388. [Google Scholar] [CrossRef]
- Vukojevic, K.; Skobic, H.; Saraga-Babic, M. Proliferation and differentiation of glial and neuronal progenitors in the development of human spinal ganglia. Differ. Res. Biol. Divers. 2009, 78, 91–98. [Google Scholar] [CrossRef] [PubMed]
- Kaliki, S.; Shields, C.L.; Shields, J.A. Uveal melanoma: Estimating prognosis. Indian J. Ophthalmol. 2015, 63, 93–102. [Google Scholar] [CrossRef] [PubMed]
- Tang, Y.; Durand, S.; Dalle, S.; Caramel, J. EMT-Inducing Transcription Factors, Drivers of Melanoma Phenotype Switching, and Resistance to Treatment. Cancers 2020, 12, 2154. [Google Scholar] [CrossRef] [PubMed]
- Miracco, C.; Toti, P.; Gelmi, M.C.; Aversa, S.; Baldino, G.; Galluzzi, P.; De Francesco, S.; Petrelli, F.; Sorrentino, E.; Belmonte, G.; et al. Retinoblastoma Is Characterized by a Cold, CD8+ Cell Poor, PD-L1- Microenvironment, Which Turns Into Hot, CD8+ Cell Rich, PD-L1+ After Chemotherapy. Investig. Ophthalmol. Vis. Sci. 2021, 62, 6. [Google Scholar] [CrossRef] [PubMed]
- Kim, D.H.; Xing, T.; Yang, Z.; Dudek, R.; Lu, Q.; Chen, Y.H. Epithelial Mesenchymal Transition in Embryonic Development, Tissue Repair and Cancer: A Comprehensive Overview. J. Clin. Med. 2017, 7, 1. [Google Scholar] [CrossRef] [Green Version]
- Guzman, F.; Fazeli, Y.; Khuu, M.; Salcido, K.; Singh, S.; Benavente, C.A. Retinoblastoma Tumor Suppressor Protein Roles in Epigenetic Regulation. Cancers 2020, 12, 2807. [Google Scholar] [CrossRef]
- Ding, L.; Cao, J.; Lin, W.; Chen, H.; Xiong, X.; Ao, H.; Yu, M.; Lin, J.; Cui, Q. The Roles of Cyclin-Dependent Kinases in Cell-Cycle Progression and Therapeutic Strategies in Human Breast Cancer. Int. J. Mol. Sci. 2020, 21, 1960. [Google Scholar] [CrossRef] [Green Version]
- Kuzbicki, L.; Aladowicz, E.; Chwirot, B.W. Cyclin-dependent kinase 2 expression in human melanomas and benign melanocytic skin lesions. Melanoma Res. 2006, 16, 435–444. [Google Scholar] [CrossRef]
- Abukhdeir, A.M.; Park, B.H. P21 and p27: Roles in carcinogenesis and drug resistance. Expert Rev. Mol. Med. 2008, 10, e19. [Google Scholar] [CrossRef] [Green Version]
- Li, J.; Di, C.; Jing, J.; Di, Q.; Nakhla, J.; Adamson, D.C. OTX2 is a therapeutic target for retinoblastoma and may function as a common factor between C-MYC, CRX, and phosphorylated RB pathways. Int. J. Oncol. 2015, 47, 1703–1710. [Google Scholar] [CrossRef] [Green Version]
- Tong, B.; Zeng, J.; Wu, Y.; Xiong, W. Enhanced SOX2 expression in retinoblastoma tissues and peripheral blood is associated with the clinicopathological characteristics of the disease. Oncol. Lett. 2015, 9, 1244–1248. [Google Scholar] [CrossRef] [PubMed] [Green Version]
- Schaefer, S.M.; Segalada, C.; Cheng, P.F.; Bonalli, M.; Parfejevs, V.; Levesque, M.P.; Dummer, R.; Nicolis, S.K.; Sommer, L. Sox2 is dispensable for primary melanoma and metastasis formation. Oncogene 2017, 36, 4516–4524. [Google Scholar] [CrossRef] [PubMed] [Green Version]
- Orquera, D.P.; de Souza, F.S.J. Evolution of the Rax family of developmental transcription factors in vertebrates. Mech. Dev. 2017, 144 Pt B, 163–170. [Google Scholar] [CrossRef]
- Keenan, S.M.; Lents, N.H.; Baldassare, J.J. Expression of cyclin E renders cyclin D-CDK4 dispensable for inactivation of the retinoblastoma tumor suppressor protein, activation of E2F, and G1-S phase progression. J. Biol. Chem. 2004, 279, 5387–5396. [Google Scholar] [CrossRef] [PubMed] [Green Version]
- Lasic, V.; Kosovic, I.; Juric, M.; Racetin, A.; Curcic, J.; Solic, I.; Lozic, M.; Filipovic, N.; Soljic, V.; Martinovic, V.; et al. GREB1L, CRELD2 and ITGA10 expression in the human developmental and postnatal kidneys: An immunohistochemical study. Acta Histochem. 2021, 123, 151679. [Google Scholar] [CrossRef] [PubMed]
- Racetin, A.; Juric, M.; Filipovic, N.; Solic, I.; Kosovic, I.; Glavina Durdov, M.; Kunac, N.; Zekic Tomas, S.; Saraga, M.; Soljic, V.; et al. Expression and localization of DAB1 and Reelin during normal human kidney development. Croat. Med. J. 2019, 60, 521–531. [Google Scholar] [CrossRef]
- Racetin, A.; Raguz, F.; Durdov, M.G.; Kunac, N.; Saraga, M.; Sanna-Cherchi, S.; Soljic, V.; Martinovic, V.; Petricevic, J.; Kostic, S.; et al. Immunohistochemical expression pattern of RIP5, FGFR1, FGFR2 and HIP2 in the normal human kidney development. Acta Histochem. 2019, 121, 531–538. [Google Scholar] [CrossRef]
- Caric, D.; Zekic Tomas, S.; Filipovic, N.; Soljic, V.; Benzon, B.; Glumac, S.; Rakovac, I.; Vukojevic, K. Expression Pattern of iNOS, BCL-2 and MMP-9 in the Hip Synovium Tissue of Patients with Osteoarthritis. Int. J. Mol. Sci. 2021, 22, 1489. [Google Scholar] [CrossRef]
- Jelicic, I.; Vukojevic, K.; Racetin, A.; Caric, D.; Glavina Durdov, M.; Saraga-Babic, M.; Filipovic, N. Expression of Pannexin 1 in the Human Kidney during Embryonal, Early Fetal and Postnatal Development and Its Prognostic Significance in Diabetic Nephropathy. Biomedicines 2022, 10, 944. [Google Scholar] [CrossRef]


| Antibodies | ||||||||
|---|---|---|---|---|---|---|---|---|
| Structure | p19 | Ki67 | Msx1 | Msx2 | PD-L1 | pRB | cyclA2 | |
| 8w human eye | retina | +++ | +++ | ++ | +++ | ++ * cr | +++ * ph | + |
| choroid | ++ | +++ | ++ | +++ | − | − | + | |
| Retinoblastoma | retina | ++ | − | +++ | ++ | +++ | +++ * n | +++ |
| choroid | ++ | − | +++ | ++ | +++ | − | − | |
| tm | + | +++ | ++ | + | ++ | +++ * c | + | |
| Normal human eye | retina | + | − | − | − | − | − | − |
| choroid | − | − | − | − | − | − | − | |
| Melanoma epiteloid type | retina | +++ | − | ++ | ++ | +++ | +++ | +++ |
| choroid | ++ | − | ++ | − | − | − | + | |
| tm | +++ | +++ | − | − | +++ | +++ | + | |
| Melanoma spindle type | retina | + | − | + | − | +++ | +++ | + |
| choroid | + | − | + | − | +++ | +++ | + | |
| tm | + | +++ | ++ | − | +++ | +++ | ++ | |
| Melanoma myxoid type | retina | + | − | ++ * ph | − | +++ | ++ | +++ |
| choroid | + | − | − | − | +++ | ++ * c | ++/+++ | |
| tm | +++ | +++ | + | + | +++ | +++ | + | |
| Antibodies | Host | Dilution | Source | |
|---|---|---|---|---|
| Primary | p19 INK4d | Rabbit | 1:300 | ab102842 Abcam (Cambridge, UK) |
| [EPR182(N)] to phospho S780 | Rabbit | 1:300 | ab173289 Abcam (Cambridge, UK) | |
| Ki67 | Mouse | 1:100 | M7240, DAKO, Glostrup, Denmark | |
| MSX1 | Goat | 1:300 | ab93287 Abcam (Cambridge, UK) | |
| Cyclin A2 (E23.1) | Mouse | 1:300 | ab38 Abcam (Cambridge, UK) | |
| [ABM4E54] to PDL1 | Mouse | 1:500 | ab210931 Abcam (Cambridge, UK) | |
| Msx2/Hox8-N-terminal | Rabbit | 1:300 | ab190070 Abcam (Cambridge, UK) | |
| Secondary | Anti-Rabbit IgG H&L (Alexa Fluor 488) | Donkey | 1:500 | ab150073 Abcam (Cambridge, UK) |
| Anti-Mouse Rhodamin | Goat | 1:300 | AP124R Jackson Immuno Research Laboratories, Inc., (Baltimore, PA, USA) | |
| Anti-Rabbit IgG H&L (Alexa Fluor 594) | Donkey | 1:500 | ab150076 Abcam (Cambridge, UK) | |
| Anti-Goat IgG H&L (Alexa Fluor® 594) | Donkey | 1:500 | ab150132 Abcam (Cambridge, UK) | |
| Anti-Mouse IgG H&L (Alexa Fluor 488) | Donkey | 1:500 | ab150105 Abcam (Cambridge, UK) | |
Publisher’s Note: MDPI stays neutral with regard to jurisdictional claims in published maps and institutional affiliations. |
© 2022 by the authors. Licensee MDPI, Basel, Switzerland. This article is an open access article distributed under the terms and conditions of the Creative Commons Attribution (CC BY) license (https://creativecommons.org/licenses/by/4.0/).
Share and Cite
Marin Lovrić, J.; Filipović, N.; Znaor, L.; Rančić, A.; Petričević, J.; Kunac, N.; Šoljić, V.; Saraga-Babić, M.; Vukojević, K. Expression of Cell Cycle Markers and Proliferation Factors during Human Eye Embryogenesis and Tumorigenesis. Int. J. Mol. Sci. 2022, 23, 9421. https://doi.org/10.3390/ijms23169421
Marin Lovrić J, Filipović N, Znaor L, Rančić A, Petričević J, Kunac N, Šoljić V, Saraga-Babić M, Vukojević K. Expression of Cell Cycle Markers and Proliferation Factors during Human Eye Embryogenesis and Tumorigenesis. International Journal of Molecular Sciences. 2022; 23(16):9421. https://doi.org/10.3390/ijms23169421
Chicago/Turabian StyleMarin Lovrić, Josipa, Natalija Filipović, Ljubo Znaor, Anita Rančić, Joško Petričević, Nenad Kunac, Violeta Šoljić, Mirna Saraga-Babić, and Katarina Vukojević. 2022. "Expression of Cell Cycle Markers and Proliferation Factors during Human Eye Embryogenesis and Tumorigenesis" International Journal of Molecular Sciences 23, no. 16: 9421. https://doi.org/10.3390/ijms23169421