
Chondrocytes from Osteoarthritis Patients Adopt Distinct Phenotypes in Response to Central TH1/TH2/TH17 Cytokines


Abstract
:1. Introduction
2. Results
2.1. Effects of IL-1β on Chondrocyte Phenotype
2.2. Effects of IL-17 on Chondrocyte Phenotype
2.3. Effects of IFNγ on Chondrocyte Phenotype
2.4. Effects of IL-4 on Chondrocyte Phenotype
2.5. Functional Gene Categories in Different Chondrocyte Phenotypes
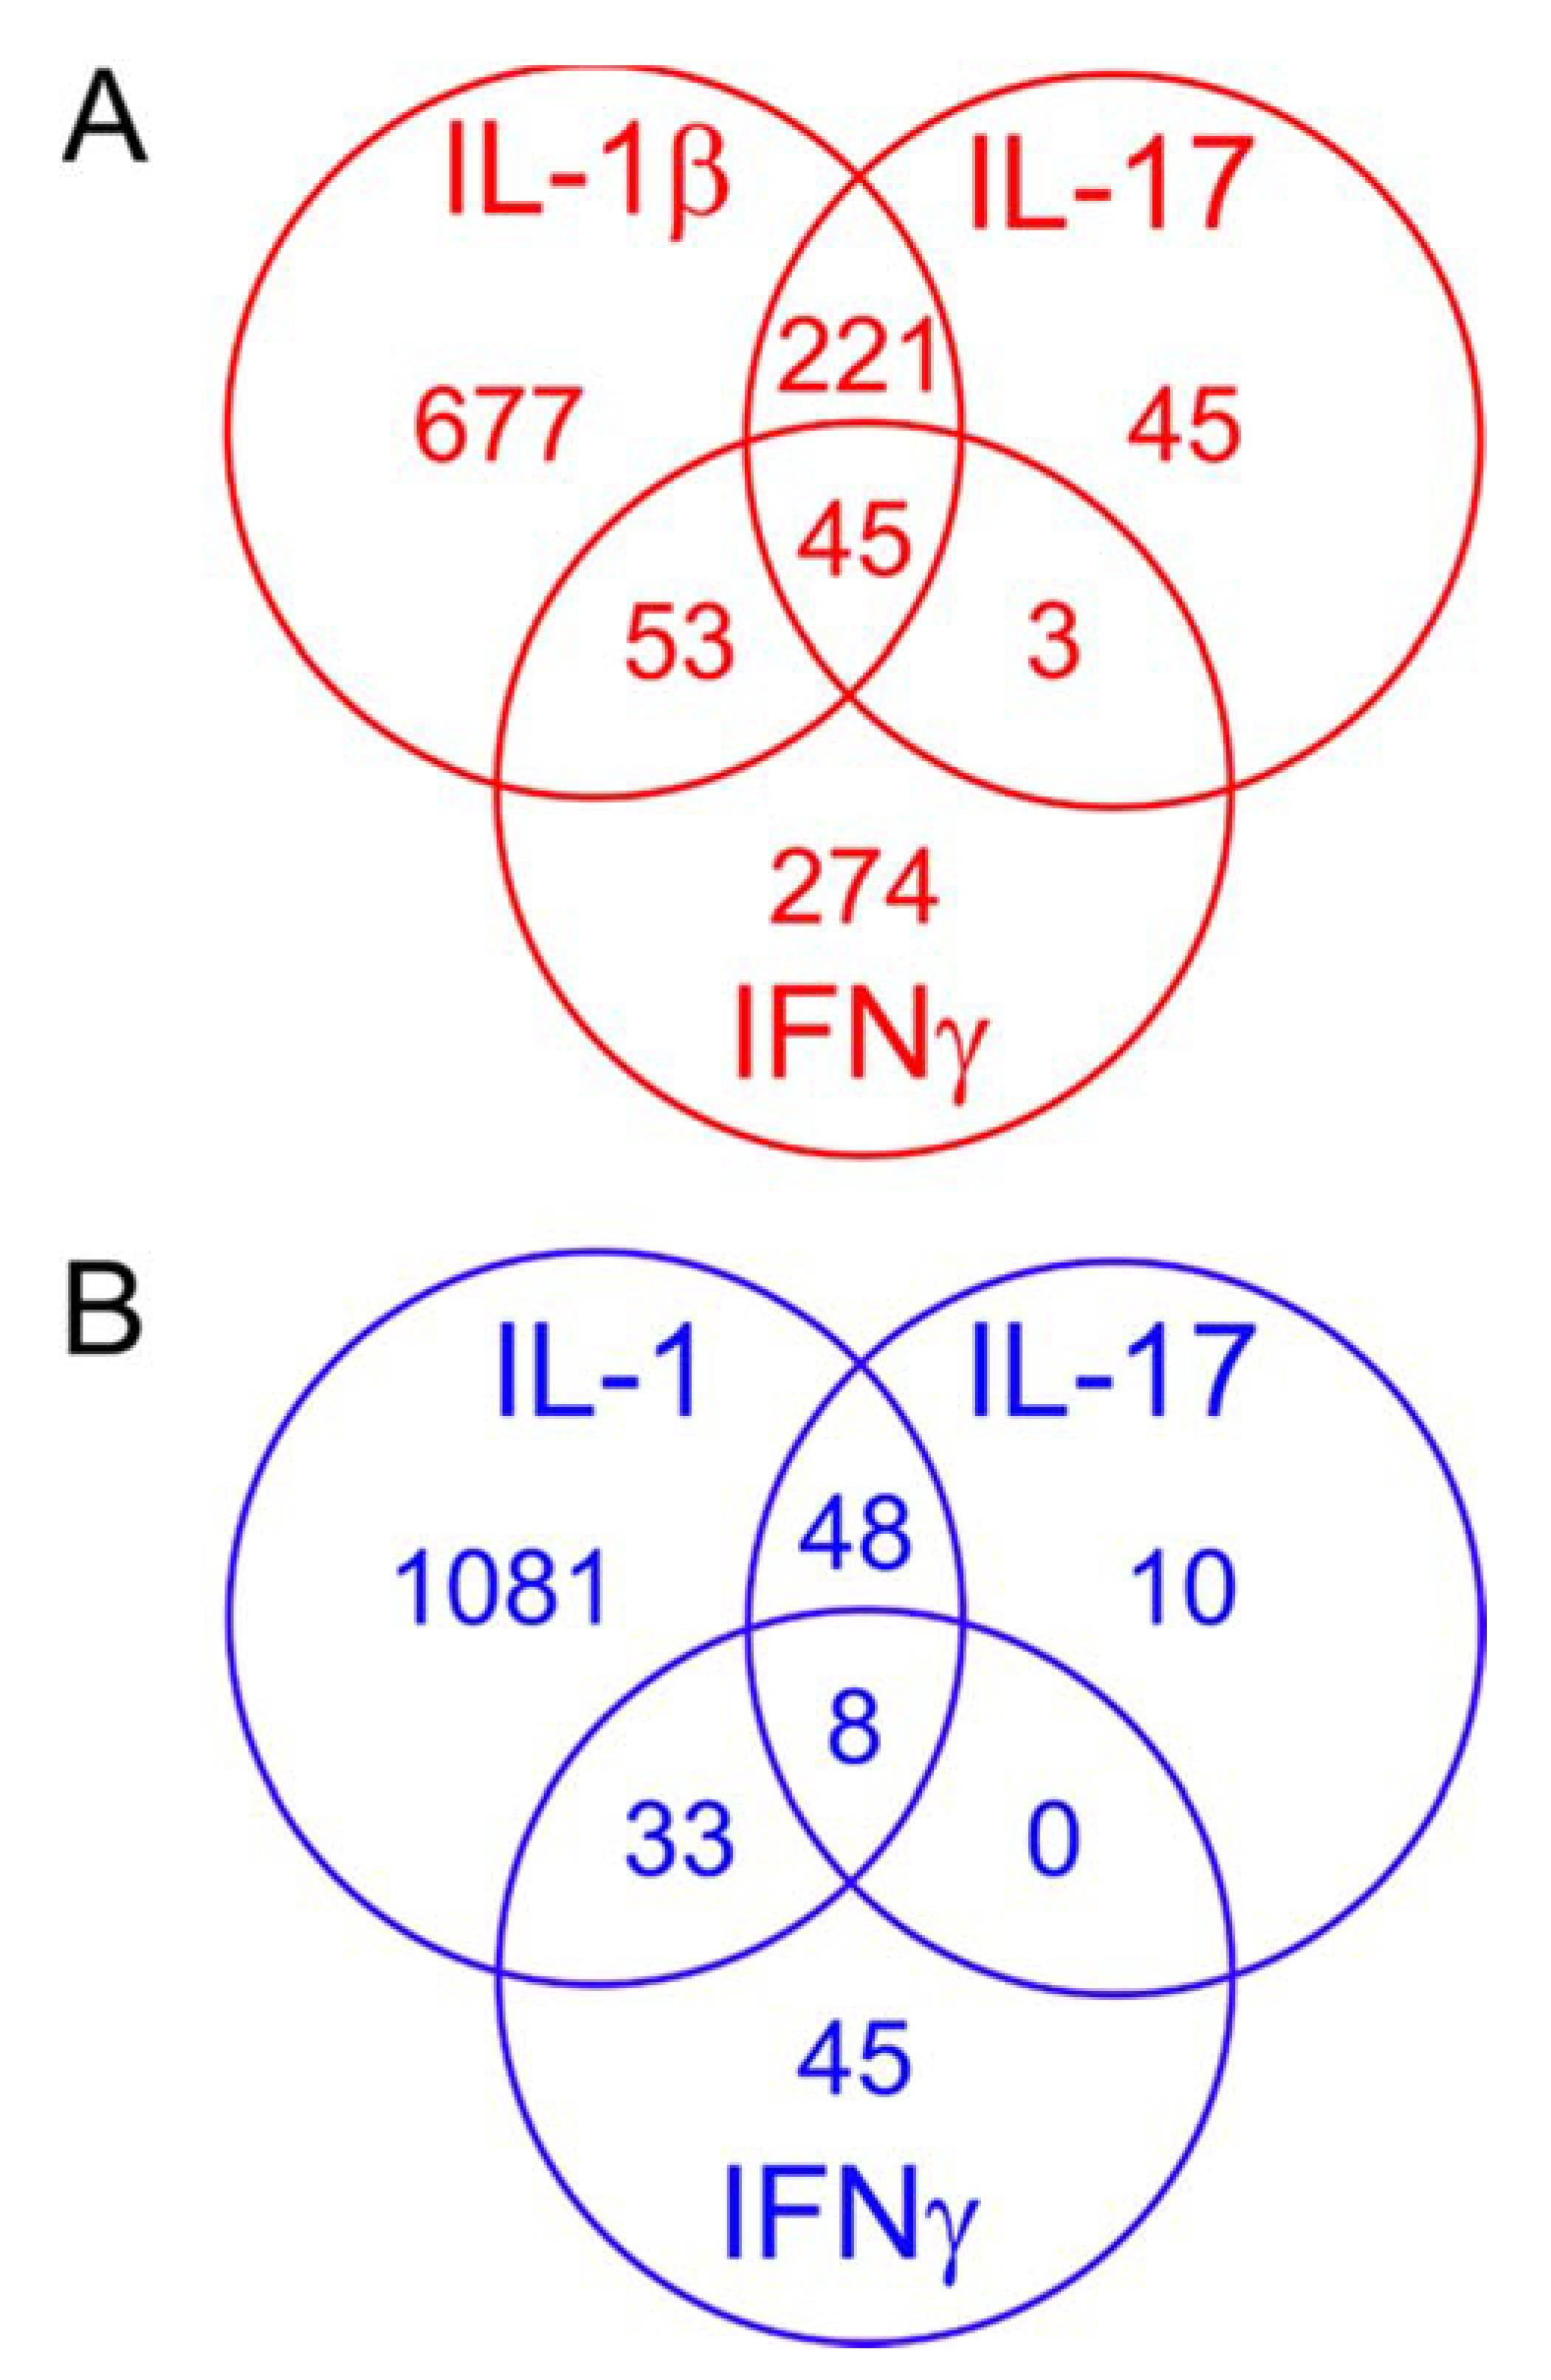
2.6. Comparing the Effects of Different Proinflammatory Cytokines
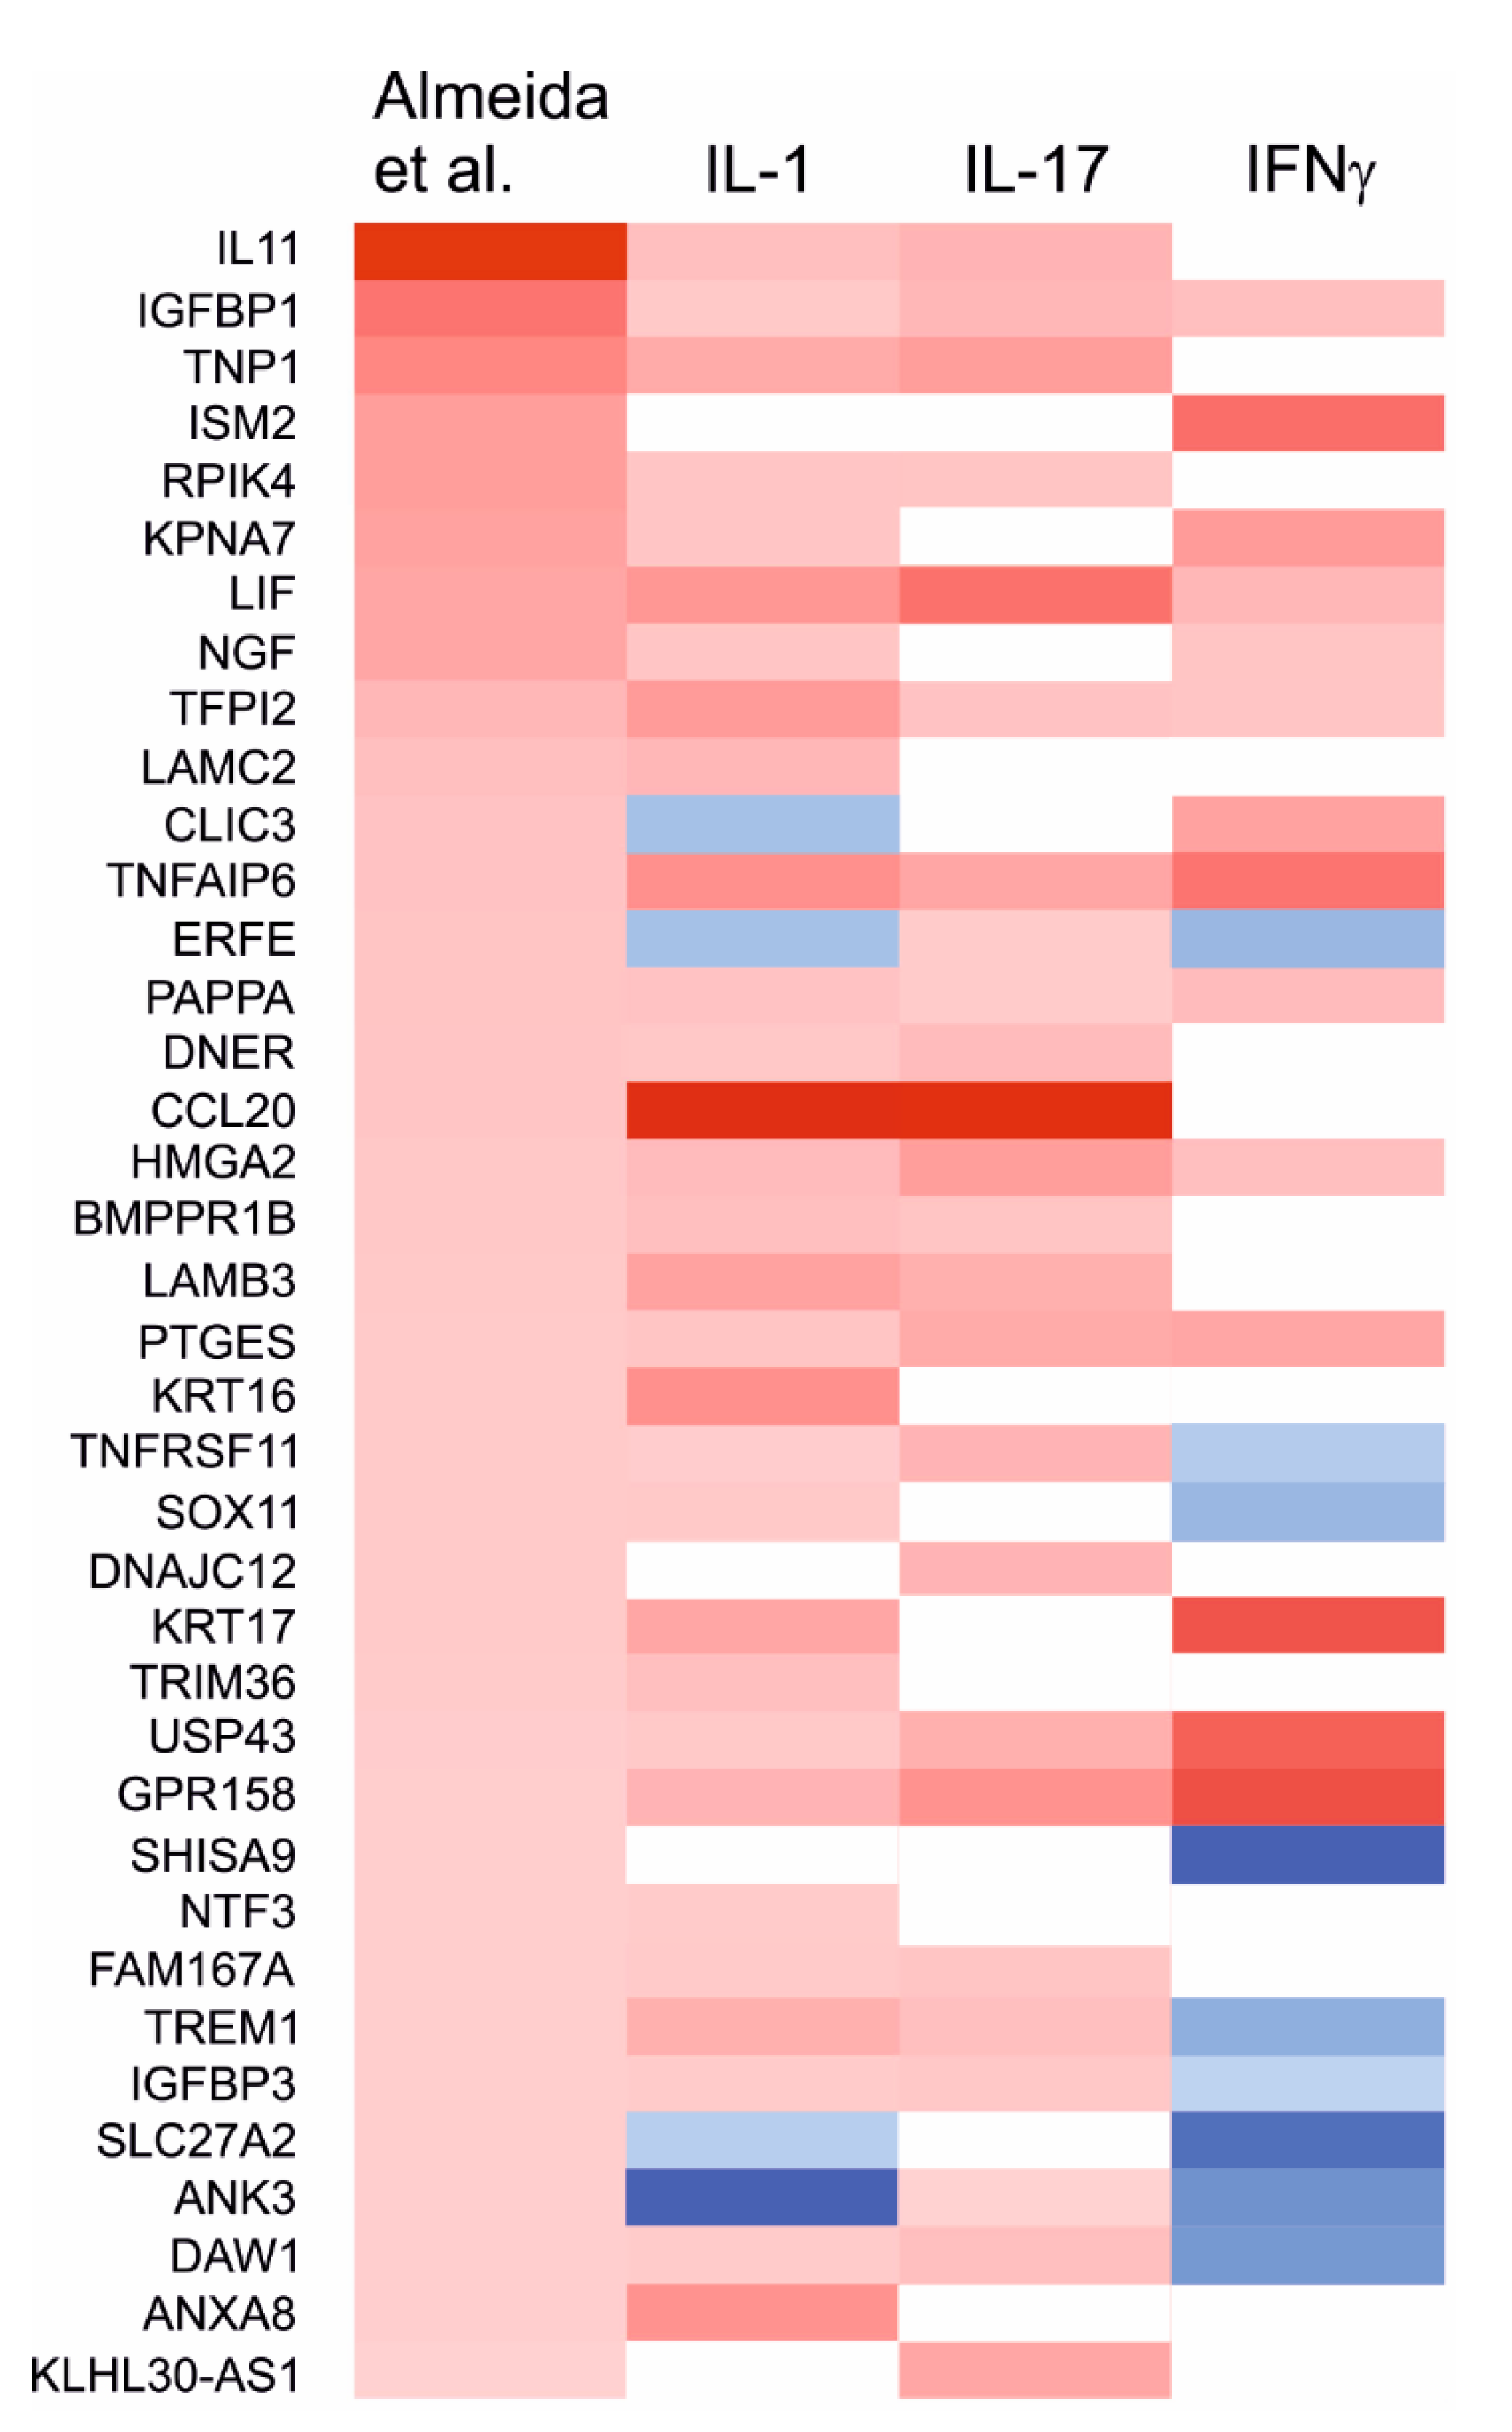
2.7. Effects of the Cytokines on Genes Differentially Expressed in Degraded and Preserved OA Cartilage
3. Discussion
4. Materials and Methods
4.1. Cartilage and Cell Culture
4.2. RNA Isolation and Sample Preparation
4.3. Next Generation Sequencing and Data Analysis
4.4. Statistics
Supplementary Materials
Author Contributions
Funding
Institutional Review Board Statement
Informed Consent Statement
Data Availability Statement
Acknowledgments
Conflicts of Interest
References
- Hunter, D.J.; Bierma-Zeinstra, S. Osteoarthritis. Lancet 2019, 393, 1745–1759. [Google Scholar] [CrossRef]
- Scanzello, C.R. Chemokines and inflammation in osteoarthritis: Insights from patients and animal models. J. Orthop. Res. 2017, 35, 735–739. [Google Scholar] [CrossRef] [PubMed] [Green Version]
- Greene, M.A.; Loeser, R.F. Aging-related inflammation in osteoarthritis. Osteoarth. Cartil. 2015, 23, 1966–1971. [Google Scholar] [CrossRef] [PubMed] [Green Version]
- Robinson, W.H.; Lepus, C.M.; Wang, Q.; Raghu, H.; Mao, R.; Lindstrom, T.M.; Sokolove, J. Low-grade inflammation as a key mediator of the pathogenesis of osteoarthritis. Nat. Rev. Rheumatol. 2016, 12, 580–592. [Google Scholar] [CrossRef]
- Karsdal, M.A.; Michaelis, M.; Ladel, C.; Siebuhr, A.S.; Bihlet, A.R.; Andersen, J.R.; Guehring, H.; Christiansen, C.; Bay-Jensen, A.C.; Kraus, V.B. Disease-modifying treatments for osteoarthritis (DMOADs) of the knee and hip: Lessons learned from failures and opportunities for the future. Osteoarthr. Cartil. 2016, 24, 2013–2021. [Google Scholar] [CrossRef] [PubMed]
- Aigner, T.; Fundel, K.; Saas, J.; Gebhard, P.M.; Haag, J.; Weiss, T.; Zien, A.; Obermayr, F.; Zimmer, R.; Bartnik, E. Large-scale gene expression profiling reveals major pathogenetic pathways of cartilage degeneration in osteoarthritis. Arthritis Rheum. 2006, 54, 3533–3544. [Google Scholar] [CrossRef] [PubMed]
- Sandy, J.D.; Chan, D.D.; Trevino, R.L.; Wimmer, M.A.; Plaas, A. Human genome-wide expression analysis reorients the study of inflammatory mediators and biomechanics in osteoarthritis. Osteoarthr. Cartil. 2015, 23, 1939–1945. [Google Scholar] [CrossRef] [Green Version]
- Hardingham, T. Extracellular matrix and pathogenic mechanisms in osteoarthritis. Curr. Rheumatol. Rep. 2008, 10, 30–36. [Google Scholar] [CrossRef] [PubMed]
- Maldonado, M.; Nam, J. The Role of Changes in Extracellular Matrix of Cartilage in the Presence of Inflammation on the Pathology of Osteoarthritis. BioMed Res. Int. 2013, 2013, 284873. [Google Scholar] [CrossRef] [Green Version]
- Loeser, R.F.; Collins, J.A.; Diekman, B.O. Ageing and the pathogenesis of osteoarthritis. Nat. Rev. Rheumatol. 2016, 12, 412–420. [Google Scholar] [CrossRef] [Green Version]
- Zhu, J.; Paul, W.E. CD4 T cells: Fates, Functions, and Faults. Blood, J. Am. Soc. Hematol. 2008, 112, 1557–1569. [Google Scholar] [CrossRef] [PubMed] [Green Version]
- Dinarello, C.A. Immunological and Inflammatory Functions of the Interleukin-1 Family [Internet]. Annu. Rev. Immunol. 2009, 27, 519–550. [Google Scholar] [CrossRef]
- Harrington, L.E.; Hatton, R.D.; Mangan, P.R.; Turner, H.; Murphy, T.L.; Murphy, K.M.; Weaver, C.T. Interleukin 17-Producing CD4+ Effector T Cells Develop via a Lineage Distinct from the T Helper Type 1 and 2 Lineages. Nat. Immunol. 2005, 6, 1123–1132. [Google Scholar] [CrossRef] [PubMed]
- Kang, S.; Kumanogoh, A. The Spectrum of Macrophage Activation by Immunometabolism [Internet]. Int. Immunol. 2020, 32, 467–473. [Google Scholar] [CrossRef]
- Raucci, F.; Saviano, A.; Casillo, G.M.; Guerra-Rodriguez, M.; Mansour, A.A.; Piccolo, M.; Ferraro, M.G.; Panza, E.; Vellecco, V.; Irace, C.; et al. IL-17-Induced Inflammation Modulates the mPGES-1/PPAR-γ Pathway in Monocytes/Macrophages. Br. J. Pharmacol. 2021. [Google Scholar] [CrossRef]
- Zizzo, G.; Cohen, P.L. IL-17 Stimulates Differentiation of Human Anti-Inflammatory Macrophages and Phagocytosis of Apoptotic Neutrophils in Response to IL-10 and Glucocorticoids. J. Immunol. 2013, 190, 5237–5246. [Google Scholar] [CrossRef] [Green Version]
- Minguzzi, M.; Cetrullo, S.; D’Adamo, S.; Silvestri, Y.; Flamigni, F.; Borzì, R.M. Emerging Players at the Intersection of Chondrocyte Loss of Maturational Arrest, Oxidative Stress, Senescence and Low-Grade Inflammation in Osteoarthritis. Oxid. Med. Cell. Longev. 2018, 2018, 3075293. [Google Scholar] [CrossRef] [Green Version]
- López-Armada, M.J.; Caramés, B.; Lires-Deán, M.; Cillero-Pastor, B.; Ruiz-Romero, C.; Galdo, F.; Blanco, F.J. Cytokines, tumor necrosis factor-alpha and interleukin-1beta, differentially regulate apoptosis in osteoarthritis cultured human chondrocytes. Osteoarthr. Cartil. 2006, 14, 660–669. [Google Scholar] [CrossRef] [PubMed] [Green Version]
- Daheshia, M.; Yao, J.Q. The interleukin 1beta pathway in the pathogenesis of osteoarthritis. J. Rheumatol. 2008, 35, 2306–2312. [Google Scholar] [CrossRef]
- Martel-Pelletier, J.; McCollum, R.; DiBattista, J.; Faure, M.P.; Chin, J.A.; Fournier, S.; Sarfati, M.; Pelletier, J.P. The interleukin-1 receptor in normal and osteoarthritic human articular chondrocytes. Identification as the type I receptor and analysis of binding kinetics and biologic function. Arthritis Rheum. 1992, 35, 530–540. [Google Scholar] [CrossRef]
- Jotanovic, Z.; Mihelic, R.; Sestan, B.; Dembic, Z. Role of Interleukin-1 Inhibitors in Osteoarthritis. Drugs Aging 2012, 29, 343–358. [Google Scholar] [CrossRef]
- Yao, Z.; Painter, S.L.; Fanslow, W.C.; Ulrich, D.; Macduff, B.M.; Spriggs, M.K.; Armitage, R.J. Human IL-17: A novel cytokine derived from T cells. J. Immunol. 1995, 155, 5483–5486. [Google Scholar]
- Miossec, P.; Korn, T.; Kuchroo, V.K. Interleukin-17 and Type 17 Helper T Cells. N. Engl. J. Med. 2009, 361, 888–898. [Google Scholar] [CrossRef] [Green Version]
- Chen, B.; Deng, Y.; Tan, Y.; Qin, J.; Chen, L.-B. Association between severity of knee osteoarthritis and serum and synovial fluid interleukin 17 concentrations. J. Int. Med. Res. 2014, 42, 138–144. [Google Scholar] [CrossRef] [Green Version]
- Martel-Pelletier, J.; Mineau, F.; Jovanovic, D.; Di Battista, J.A.; Pelletier, J.-P. Mitogen-activated protein kinase and nuclear factor κB together regulate interleukin-17-induced nitric oxide production in human osteoarthritic chondrocytes: Possible role of transactivating factor mitogen-activated protein kinase-activated protein kinase. Arthritis Rheum. 1999, 42, 2399–2409. [Google Scholar] [CrossRef]
- Pacquelet, S.; Presle, N.; Boileau, C.; Dumond, H.; Netter, P.; Martel-Pelletier, J.; Pelletier, J.-P.; Terlain, B.; Jouzeau, J.-Y. Interleukin 17, a nitric oxide-producing cytokine with a peroxynitrite-independent inhibitory effect on proteoglycan synthesis. J. Rheumatol. 2002, 29, 2602–2610. [Google Scholar]
- Benderdour, M.; Tardif, G.; Pelletier, J.-P.; Di Battista, J.A.; Reboul, P.; Ranger, P.; Martel-Pelletier, J. Interleukin 17 (IL-17) induces collagenase-3 production in human osteoarthritic chondrocytes via AP-1 dependent activation: Differential activation of AP-1 members by IL-17 and IL-1beta. J. Rheumatol. 2002, 29, 1262–1272. [Google Scholar] [PubMed]
- Nakashima, T.; Kobayashi, Y.; Yamasaki, S.; Kawakami, A.; Eguchi, K.; Sasaki, H.; Sakai, H. Protein Expression and Functional Difference of Membrane-Bound and Soluble Receptor Activator of NF-κB Ligand: Modulation of the Expression by Osteotropic Factors and Cytokines. Biochem. Biophys. Res. Commun. 2000, 275, 768–775. [Google Scholar] [CrossRef] [PubMed]
- Nakae, S.; Nambu, A.; Sudo, K.; Iwakura, Y. Suppression of immune induction of collagen-induced arthritis in IL-17-deficient mice. J. Immunol. 2003, 171, 6173–6177. [Google Scholar] [CrossRef] [PubMed] [Green Version]
- Chabaud, M.; Lubberts, E.; Joosten, L.; van den Berg, W.; Miossec, P. IL-17 derived from juxta-articular bone and synovium contributes to joint degradation in rheumatoid arthritis. Arthritis Res. 2001, 3, 168. [Google Scholar] [CrossRef] [PubMed] [Green Version]
- Xu, Y.; Barter, M.J.; Swan, D.C.; Rankin, K.S.; Rowan, A.D.; Santibanez-Koref, M.; Loughlin, J.; Young, D.A. Identification of the pathogenic pathways in osteoarthritic hip cartilage: Commonality and discord between hip and knee OA. Osteoarthr. Cartil. 2012, 20, 1029–1038. [Google Scholar] [CrossRef] [PubMed] [Green Version]
- Santangelo, K.S.; Nuovo, G.J.; Bertone, A.L. In vivo reduction or blockade of interleukin-1β in primary osteoarthritis influences expression of mediators implicated in pathogenesis. Osteoarthr. Cartil. 2012, 20, 1610–1618. [Google Scholar] [CrossRef] [PubMed] [Green Version]
- Hoff, P.; Buttgereit, F.; Burmester, G.-R.; Jakstadt, M.; Gaber, T.; Andreas, K.; Matziolis, G.; Perka, C.; Röhner, E. Osteoarthritis synovial fluid activates pro-inflammatory cytokines in primary human chondrocytes. Int. Orthop. 2013, 37, 145–151. [Google Scholar] [CrossRef] [Green Version]
- Li, S.; Ren, Y.; Peng, D.; Yuan, Z.; Shan, S.; Sun, H.; Yan, X.; Xiao, H.; Li, G.; Song, H. TIM-3 Genetic Variations Affect Susceptibility to Osteoarthritis by Interfering with Interferon Gamma in CD4+ T Cells. Inflammation 2015, 38, 1857–1863. [Google Scholar] [CrossRef] [PubMed]
- de Almeida, R.C.; Ramos, Y.F.; Mahfouz, A.; den Hollander, W.; Lakenberg, N.; Houtman, E.; van Hoolwerff, M.; Suchiman, H.E.D.; Rodríguez Ruiz, A.; Slagboom, P.E.; et al. RNA sequencing data integration reveals an miRNA interactome of osteoarthritis cartilage. Ann. Rheum Dis. 2019, 78, 270–277. [Google Scholar] [CrossRef]
- Chizzolini, C.; Chicheportiche, R.; Burger, D.; Dayer, J.M. Human Th1 Cells Preferentially Induce Interleukin (IL)-1β While Th2 Cells Induce IL-1 Receptor Antagonist Production upon Cell/Cell Contact with Monocytes. Eur. J. Immunol. 1997, 27, 171–177. [Google Scholar] [CrossRef]
- Weaver, C.T.; Elson, C.O.; Fouser, L.A.; Kolls, J.K. The Th17 Pathway and Inflammatory Diseases of the Intestines, Lungs and Skin. Annu. Rev. Pathol. 2013, 8, 477. [Google Scholar] [CrossRef] [PubMed] [Green Version]
- Hume, D.A. The Many Alternative Faces of Macrophage Activation. Front Immunol. 2015, 6, 370. [Google Scholar] [CrossRef] [Green Version]
- Alonso, M.N.; Wong, M.T.; Zhang, A.L.; Winer, D.; Suhoski, M.M.; Tolentino, L.L.; Gaitan, J.; Davidson, M.G.; Kung, T.H.; Galel, D.M.; et al. TH1, TH2, and TH17 Cells Instruct Monocytes to Differentiate into Specialized Dendritic Cell Subsets. Blood J. Am. Soc. Hematol. 2011, 118, 3311–3320. [Google Scholar] [CrossRef] [Green Version]
- Diniz, S.N.; Nomizo, R.; Cisalpino, P.S.; Teixeira, M.M.; Brown, G.D.; Mantovani, A.; Gordon, S.; Reis, L.F.L.; Dias, A.A.M. PTX3 function as an opsonin for the dectin-1-dependent internalization of zymosan by macrophages. J. Leukoc. Biol. 2004, 75, 649–656. [Google Scholar] [CrossRef] [Green Version]
- Sharma, A.; Khan, R.; Gupta, N.; Sharma, A.; Zaheer, M.S.; Abbas, M.; Khan, S.A. Acute phase reactant, Pentraxin 3, as a novel marker for the diagnosis of rheumatoid arthritis. Clin. Chim. Acta 2018, 480, 65–70. [Google Scholar] [CrossRef] [PubMed]
- Liu, Y.-X.; Wang, G.-D.; Wang, X.; Zhang, Y.-L.; Zhang, T.-L. Effects of TLR-2/NF-κB signaling pathway on the occurrence of degenerative knee osteoarthritis: An in vivo and in vitro study. Oncotarget 2017, 8, 38602–38617. [Google Scholar] [CrossRef] [PubMed]
- Miller, R.E.; Ishihara, S.; Tran, P.B.; Golub, S.B.; Last, K.; Miller, R.J.; Fosang, A.J.; Malfait, A.-M. An aggrecan fragment drives osteoarthritis pain through Toll-like receptor 2. JCI Insight 2018, 3, e95704. [Google Scholar] [CrossRef]
- Raghu, H.; Lepus, C.M.; Wang, Q.; Wong, H.H.; Lingampalli, N.; Oliviero, F.; Punzi, L.; Giori, N.J.; Goodman, S.B.; Chu, C.R.; et al. CCL2/CCR2, but not CCL5/CCR5, mediates monocyte recruitment, inflammation and cartilage destruction in osteoarthritis. Ann. Rheum. Dis. 2017, 76, 914–922. [Google Scholar] [CrossRef] [Green Version]
- Miller, R.J.; Malfait, A.M.; Miller, R.E. The Innate Immune Response as a Mediator of Osteoarthritis Pain [Internet]. Osteoarthr. Cartil. 2020, 28, 562–571. [Google Scholar] [CrossRef]
- Lee, M.-C.; Saleh, R.; Achuthan, A.; Fleetwood, A.J.; Förster, I.; Hamilton, J.A.; Cook, A.D. CCL17 blockade as a therapy for osteoarthritis pain and disease. Arthritis Res. Ther. 2018, 20, 62. [Google Scholar] [CrossRef] [Green Version]
- Adań, N.; Guzmán-Morales, J.; Ledesma-Colunga, M.G.; Perales-Canales, S.I.; Quintanar-Stéphano, A.; López-Barrera, F.; Méndez, I.; Moreno-Carranza, B.; Triebel, J.; Binart, N.; et al. Prolactin promotes cartilage survival and attenuates inflammation in inflammatory arthritis. J. Clin. Investig. 2013, 123, 3902–3913. [Google Scholar] [CrossRef]
- Ogueta, S.; Muñoz, J.; Obregon, E.; Delgado-Baeza, E.; García-Ruiz, J.P. Prolactin Is a Component of the Human Synovial Liquid and Modulates the Growth and Chondrogenic Differentiation of Bone Marrow-Derived Mesenchymal Stem Cells. Mol. Cell. Endocrinol. 2002, 190, 51–63. [Google Scholar] [CrossRef]
- Lorenzo, P.; Aspberg, A.; Onnerfjord, P.; Bayliss, M.T.; Neame, P.J.; Heinegard, D. Identification and characterization of asporin. a novel member of the leucine-rich repeat protein family closely related to decorin and biglycan. J. Biol. Chem. 2001, 276, 12201–12211. [Google Scholar] [CrossRef] [Green Version]
- Xu, L.; Li, Z.; Liu, S.-Y.; Xu, S.-Y.; Ni, G.-X. Asporin and osteoarthritis. Osteoarthr. Cartil. 2015, 23, 933–939. [Google Scholar] [CrossRef] [PubMed] [Green Version]
- Zhu, X.; Jiang, L.; Lu, Y.; Wang, C.; Zhou, S.; Wang, H.; Tian, T. Association of aspartic acid repeat polymorphism in the asporin gene with osteoarthritis of knee, hip, and hand. Medicine (Baltimore) 2018, 97, e0200. [Google Scholar] [CrossRef]
- Wang, J.; Yang, A.; Zhang, J.; Sun, N.; Li, X.; Li, X.; Liu, Q.; Li, J.; Ren, X.; Ke, Z.; et al. Genetic polymorphism in the asporin gene is not a key risk factor for osteoarthritis: Evidence based on an updated cumulative meta-analysis. Exp. Ther. Med. 2018, 15, 3952–3966. [Google Scholar] [CrossRef] [Green Version]
- Wang, P.; Zhu, F.; Lee, N.H.; Konstantopoulos, K. Shear-induced interleukin-6 synthesis in chondrocytes: Roles of E prostanoid (EP) 2 and EP3 in cAMP/protein kinase A- and PI3-K/Akt-dependent NF-kappaB activation. J. Biol. Chem. 2010, 285, 24793–24804. [Google Scholar] [CrossRef] [Green Version]
- Eitner, A.; Müller, S.; König, C.; Wilharm, A.; Raab, R.; Hofmann, G.O.; Kamradt, T.; Schaible, H.G. Inhibition of Inducible Nitric Oxide Synthase Prevents il-1β-Induced Mitochondrial Dysfunction in Human Chondrocytes. Int. J. Mol. Sci. 2021, 22, 2477. [Google Scholar] [CrossRef]
- Kuhne, M.; Erben, U.; Schulze-Tanzil, G.; Köhler, D.; Wu, P.; Richter, F.J.; John, T.; Radbruch, A.; Sieper, J.; Appel, H. HLA-B27-Restricted Antigen Presentation by Human Chondrocytes to CD8+ T Cells: Potential Contribution to Local Immunopathologic Processes in Ankylosing Spondylitis. Arthritis Rheum. 2009, 60, 1635–1646. [Google Scholar] [CrossRef] [PubMed]
- Brennan, F.R.; Mikecz, K.; Buzás, E.I.; Glant, T.T. Interferon-Gamma but not Granulocyte/Macrophage Colony-Stimulating Factor Augments Proteoglycan Presentation by Synovial Cells and Chondrocytes to an Autopathogenic T Cell Hybridoma. Immunol. Lett. 1995, 45, 87–91. [Google Scholar] [CrossRef]
- Lewallen, E.A.; Bonin, C.A.; Li, X.; Smith, J.; Karperien, M.; Larson, A.N.; Lewallen, D.G.; Cool, S.M.; Westendorf, J.J.; Krych, A.J.; et al. The synovial microenvironment of osteoarthritic joints alters RNA-seq expression profiles of human primary articular chondrocytes. Gene 2016, 591, 456–464. [Google Scholar] [CrossRef]
- Dunn, S.L.; Soul, J.; Anand, S.; Schwartz, J.-M.; Boot-Handford, R.P.; Hardingham, T.E. Gene expression changes in damaged osteoarthritic cartilage identify a signature of non-chondrogenic and mechanical responses. Osteoarthr. Cartil. 2016, 24, 1431–1440. [Google Scholar] [CrossRef] [PubMed] [Green Version]
- Ramos, Y.F.M.; den Hollander, W.; Bovée, J.V.M.G.; Bomer, N.; Breggen, R.; Lakenberg, N.; Keurentjes, J.C.; Goeman, J.J.; Slagboom, P.E.; Nelissen, R.G.H.H.; et al. Genes Involved in the Osteoarthritis Process Identified through Genome Wide Expression Analysis in Articular Cartilage; the RAAK Study. PLoS ONE 2014, 9, e103056. [Google Scholar] [CrossRef] [PubMed] [Green Version]
- Altman, R.; Asch, E.; Bloch, D.; Bole, G.; Borenstein, D.; Brandt, K.; Christy, W.; Cooke, T.D.; Greenwald, R.; Hochberg, M.; et al. Development of criteria for the classification and reporting of osteoarthritis: Classification of osteoarthritis of the knee. Arthritis Rheum. 1986, 29, 1039–1049. [Google Scholar] [CrossRef]
- Mobasheri, A.; Vannucci, S.J.; Bondy, C.A.; Carter, S.D.; Innes, J.F.; Arteaga, M.F.; Trujillo, E.; Ferraz, I.; Shakibaei, M.; Martín-Vasallo, P. Glucose transport and metabolism in chondrocytes: A key to understanding chondrogenesis, skeletal development and cartilage degradation in osteoarthritis. Histol. Histopathol. 2002, 17, 1239–1267. [Google Scholar] [PubMed]
- Koskinen, A.; Juslin, S.; Nieminen, R.; Moilanen, T.; Vuolteenaho, K.; Moilanen, E. Adiponectin associates with markers of cartilage degradation in osteoarthritis and induces production of proinflammatory and catabolic factors through mitogen-activated protein kinase pathways. Arthritis Res. Ther. 2011, 13, R184. [Google Scholar] [CrossRef] [PubMed] [Green Version]
- Andrews, S. FastQC: A Quality Control Tool for High Throughput Sequence Data. 2010. Available online: https://www.bioinformatics.babraham.ac.uk/projects/fastqc/ (accessed on 19 April 2021).
- Bolger, A.M.; Lohse, M.; Usadel, B. Trimmomatic: A flexible trimmer for Illumina sequence data. Bioinformatics 2014, 30, 2114–2120. [Google Scholar] [CrossRef] [PubMed] [Green Version]
- Dobin, A.; Davis, C.A.; Schlesinger, F.; Drenkow, J.; Zaleski, C.; Jha, S.; Batut, P.; Chaisson, M.; Gingeras, T.R. STAR: Ultrafast universal RNA-seq aligner. Bioinformatics 2013, 29, 15–21. [Google Scholar] [CrossRef]
- Liao, Y.; Smyth, G.K.; Shi, W. featureCounts: An efficient general purpose program for assigning sequence reads to genomic features. Bioinformatics 2014, 30, 923–930. [Google Scholar] [CrossRef] [Green Version]
- Love, M.I.; Huber, W.; Anders, S. Moderated estimation of fold change and dispersion for RNA-seq data with DESeq2. Genome Biol. 2014, 15, 550. [Google Scholar] [CrossRef] [Green Version]
- Ashburner, M.; Ball, C.A.; Blake, J.A.; Botstein, D.; Butler, H.; Cherry, J.M.; Davis, A.P.; Dolinski, K.; Dwight, S.S.; Eppig, J.T.; et al. Gene Ontology: Tool for the unification of biology. Nat. Genet. 2000, 25, 25–29. [Google Scholar] [CrossRef] [Green Version]
- The Gene Ontology Consortium. Expansion of the Gene Ontology knowledgebase and resources. Nucleic Acids Res. 2017, 45, D331–D338. [Google Scholar] [CrossRef] [Green Version]
- Huang, D.W.; Sherman, B.T.; Lempicki, R.A. Systematic and Integrative Analysis of Large Gene Lists Using DAVID Bioinformatics Resources. Nat. Protoc. 2009, 4, 44–57. [Google Scholar] [CrossRef]
- Supek, F.; Bošnjak, M.; Škunca, N.; Šmuc, T. REVIGO Summarizes and Visualizes Long Lists of Gene Ontology Terms. PLoS ONE 2011, 6, e21800. [Google Scholar] [CrossRef] [Green Version]


| Gene | Name | Function | Mean (Co) | Mean (IL1) | Fold Change | adj. p |
|---|---|---|---|---|---|---|
| IL6 | Interleukin 6 | Inflammation | 12.4 | 18,406.9 | 3685.72 | <1.0 × 10⁻⁴ |
| CXCL1 | C-X-C motif chemokine ligand 1 | Inflammation, chemotaxis | 13.8 | 23,793.7 | 3457.68 | <1.0 × 10⁻⁴ |
| IL1B | Interleukin 1 beta | Inflammation | 2.8 | 9575.7 | 3332.44 | <1.0 × 10⁻⁴ |
| CXCL8 | C-X-C motif chemokine ligand 8 | Inflammation, chemotaxis | 329.5 | 855,146.3 | 2968.9 | <1.0 × 10⁻⁴ |
| CXCL6 | C-X-C motif chemokine ligand 6 | Inflammation, chemotaxis | 2.8 | 4951.8 | 2352.02 | <1.0 × 10⁻⁴ |
| CXCL5 | C-X-C motif chemokine ligand 5 | Inflammation, chemotaxis | 7.4 | 7352.4 | 1239.8 | <1.0 × 10⁻⁴ |
| CXCL2 | C-X-C motif chemokine ligand 2 | Inflammation, chemotaxis | 3.9 | 4798.2 | 1198.05 | <1.0 × 10⁻⁴ |
| CXCL3 | C-X-C motif chemokine ligand 3 | Inflammation, chemotaxis | 3.1 | 3154.6 | 1130.76 | <1.0 × 10⁻⁴ |
| CCL20 | C-C motif chemokine ligand 20 | Inflammation, chemotaxis | 418 | 381,100.8 | 1128.35 | <1.0 × 10⁻⁴ |
| IL36RN | Interleukin 36 receptor antagonist | Regulation of inflammation | 8.6 | 5863.8 | 914.19 | <1.0 × 10⁻⁴ |
| ADORA2A | Adenosine A2a receptor | Regulation of inflammation | 5.5 | 1550.7 | 641.44 | <1.0 × 10⁻⁴ |
| IL36G | Interleukin 36 gamma | Inflammation | 1.8 | 1065.5 | 562.03 | <1.0 × 10⁻⁴ |
| EREG | Epiregulin | Regulation of proliferation | 31.9 | 13,697.7 | 506.87 | <1.0 × 10⁻⁴ |
| CSF3 | Colony stimulating factor 3 | Granulocyte-mediated inflammation | 0.1 | 63.9 | 300.02 | <1.0 × 10⁻⁴ |
| VNN1 | Vanin 1 | T cell migration | 9.2 | 2467.2 | 273.35 | <1.0 × 10⁻⁴ |
| CCL5 | C-C motif chemokine ligand 5 | Inflammation, chemotaxis | 4.1 | 1134.2 | 271.85 | <1.0 × 10⁻⁴ |
| C15orf48 | Chromosome 15 open reading frame 48 | ? | 27.2 | 4669.1 | 253.13 | <1.0 × 10⁻⁴ |
| CCL3 | C-C motif chemokine ligand 3 | Inflammation, granulocyte activation | 0.5 | 166.3 | 242.88 | <1.0 × 10⁻⁴ |
| FCAMR | Fc fragment of IgA and IgM receptor | Adaptive immunity, leukocyte migration | 2.6 | 492 | 213.45 | <1.0 × 10⁻⁴ |
| SERPINB7 | Serpin family B member 7 | Endoproteinase inhibition | 22.1 | 3747.9 | 205.63 | <1.0 × 10⁻⁴ |
| HRCT1 | Histidine rich carboxyl terminus 1 | ? | 105.8 | 4.1 | −38.85 | <1.0 × 10⁻⁴ |
| LSP1 | Lymphocyte specific protein 1 | Regulation of neutrophil mobility | 1749.6 | 58.1 | −31.39 | <1.0 × 10⁻⁴ |
| HIST1H3G | Histone cluster 1 H3 family member g | Regulation of transcription | 183.4 | 9.6 | −28.26 | <1.0 × 10⁻⁴ |
| ACTC1 | Actin, alpha, cardiac muscle 1 | Heart muscle constituent | 195.2 | 10.5 | −24.79 | <1.0 × 10⁻⁴ |
| NXPH3 | Neurexophilin 3 | ? | 39.2 | 2.4 | −23.89 | <1.0 × 10⁻⁴ |
| SCN2B | Sodium voltage-gated channel beta subunit 2 | Cell adhesion and migration | 167 | 8.7 | −22.19 | <1.0 × 10⁻⁴ |
| HIST1H1A | Histone cluster 1 H1 family member a | ? | 908.5 | 47.2 | −21.2 | <1.0 × 10⁻⁴ |
| GDF10 | Growth differentiation factor 10 | Skeletal system development | 813.6 | 45.7 | −20.57 | <1.0 × 10⁻⁴ |
| LINC02593 | Long intergenic non-protein coding RNA 2593 | ? | 68.3 | 3.4 | −20.53 | <1.0 × 10⁻⁴ |
| HIST1H3B | Histone cluster 1 H3 family member b | Regulation of transcription | 990.6 | 59.2 | −20.46 | <1.0 × 10⁻⁴ |
| TMEM26 | Transmembrane protein 26 | ? | 403.7 | 21.4 | −19.3 | <1.0 × 10⁻⁴ |
| PHYHIPL | Phytanoyl-CoA 2-hydroxylase interacting protein like | ? | 22 | 1.6 | −19.19 | <1.0 × 10⁻⁴ |
| SARDH | Sarcosine dehydrogenase | Mitochondrial metabolism | 25.8 | 2.4 | −19.08 | <1.0 × 10⁻⁴ |
| HIST1H2BO | Histone cluster 1 H2B family member o | Regulation of transcription? | 234.4 | 12.7 | −18.99 | <1.0 × 10⁻⁴ |
| ID3 | Inhibitor of DNA binding 3, HLH protein | Regulation of transcription | 676.5 | 45.8 | −18.32 | <1.0 × 10⁻⁴ |
| HIST1H2AJ | Histone cluster 1 H2A family member j | Regulation of transcription? | 857 | 47.1 | −18.12 | <1.0 × 10⁻⁴ |
| HIST1H1B | Histone cluster 1 H1 family member b | Regulation of transcription? | 736 | 50.6 | −17.69 | <1.0 × 10⁻⁴ |
| MFAP2 | Microfibril associated protein 2 | ECM organization | 33 | 3.2 | −17.52 | <1.0 × 10⁻⁴ |
| TNNT3 | Troponin T3, fast skeletal type | Muscle constituent | 95.6 | 6.4 | −17.51 | <1.0 × 10⁻⁴ |
| HIST1H2AL | Histone cluster 1 H2A family member l | Regulation of transcription? | 321.4 | 21.2 | −17.32 | <1.0 × 10⁻⁴ |
| Gene | Name | Function | Mean (Co) | Mean (IL17) | Fold Change | adj. p |
|---|---|---|---|---|---|---|
| SAA2 | Serum amyloid A2 | Chemotaxis | 5.5 | 659.2 | 319.99 | <1.0 × 10⁻⁴ |
| IL6 | Interleukin 6 | Inflammation | 12.2 | 1431.4 | 250.15 | <1.0 × 10⁻⁴ |
| SAA1 | Serum amyloid A1 | Inflammation, chemotaxis | 63.7 | 3520.0 | 183.26 | <1.0 × 10⁻⁴ |
| SAA2-SAA4 | SAA2-SAA4 readthrough | Chemotaxis? | 2.9 | 216.7 | 156.18 | <1.0 × 10⁻⁴ |
| CXCL6 | C-X-C motif chemokine ligand 6 | Inflammation, chemotaxis | 2.8 | 276.4 | 141.01 | <1.0 × 10⁻⁴ |
| CXCL1 | C-X-C motif chemokine ligand 1 | Inflammation, chemotaxis | 13.6 | 1170.5 | 136.48 | <1.0 × 10⁻⁴ |
| VNN1 | Vanin 1 | T cell migration | 9.1 | 820.5 | 84.13 | <1.0 × 10⁻⁴ |
| CCL20 | C-C motif chemokine ligand 20 | Chemotaxis | 412.8 | 26,508.9 | 73.49 | <1.0 × 10⁻⁴ |
| TNFSF18 | TNF superfamily member 18 | T cell survival | 4.2 | 470.3 | 73.05 | <1.0 × 10⁻⁴ |
| IL36RN | Interleukin 36 receptor antagonist | Regulation of inflammation | 8.5 | 468.0 | 69.09 | <1.0 × 10⁻⁴ |
| VNN3 | Vanin 3 | ? | 1.8 | 130.3 | 66.35 | <1.0 × 10⁻⁴ |
| ADORA2A | Adenosine A2a receptor | Inflammation, phagocytosis | 5.4 | 105.9 | 64.74 | <1.0 × 10⁻⁴ |
| CXCL2 | C-X-C motif chemokine ligand 2 | Inflammation, chemotaxis | 3.9 | 220.3 | 55.90 | <1.0 × 10⁻⁴ |
| CXCL8 | C-X-C motif chemokine ligand 8 | Inflammation, chemotaxis | 324.8 | 14,116.5 | 48.18 | <1.0 × 10⁻⁴ |
| C15orf48 | Chromosome 15 open reading frame 48 | Mitochondrial respiration? | 26.9 | 820.3 | 46.34 | <1.0 × 10⁻⁴ |
| PDZK1IP1 | PDZK1 interacting protein 1 | Regulation of apoptosis | 5.2 | 206.9 | 41.18 | <1.0 × 10⁻⁴ |
| NOS2 | Nitric oxide synthase 2 | Inflammation | 137.9 | 3370.2 | 40.02 | <1.0 × 10⁻⁴ |
| ODAPH | Odontogenesis associated phosphoprotein | Enamel production | 1.4 | 41.9 | 37.29 | <1.0 × 10⁻⁴ |
| SLC28A3 | Solute carrier family 28 member 3 | Nucleoside transport | 4.3 | 150.4 | 35.34 | <1.0 × 10⁻⁴ |
| CXCL5 | C-X-C motif chemokine ligand 5 | Inflammation, chemotaxis | 7.3 | 207.5 | 34.25 | <1.0 × 10⁻⁴ |
| ACTC1 | Actin, alpha, cardiac muscle 1 | Cardiac muscle component | 191.7 | 26.7 | −8.14 | <1.0 × 10⁻⁴ |
| TOX | Thymocyte selection associated high mobility group box | T cell development | 14.6 | 3.9 | −5.66 | 0.0010 |
| TMEM26 | Transmembrane protein 26 | ? | 396.3 | 69.8 | −5.47 | <1.0 × 10⁻⁴ |
| TNNT3 | Troponin T3, fast skeletal type | Muscle component | 93.9 | 17.9 | −5.28 | <1.0 × 10⁻⁴ |
| TENT5B | Terminal nucleotidyltransferase 5B | Regulation of cell proliferation | 152.5 | 39.7 | −4.81 | <1.0 × 10⁻⁴ |
| TMEM26-AS1 | TMEM26 antisense RNA 1 | ? | 32.0 | 14.4 | −4.77 | 3.8 × 10⁻⁴ |
| RCAN2 | Regulator of calcineurin 2 | Regulation of transcription | 326.5 | 74.6 | −4.74 | <1.0 × 10⁻⁴ |
| OPRL1 | Opioid related nociceptin receptor 1 | ? | 11.8 | 3.0 | −4.51 | 0.0068 |
| CSRNP3 | Cysteine and serine rich nuclear protein 3 | Regulation of apoptosis | 59.7 | 19.7 | −4.01 | <1.0 × 10⁻⁴ |
| ASPN | Asporin | Cartilage constituent | 2011.2 | 505.2 | −3.92 | <1.0 × 10⁻⁴ |
| HRCT1 | Histidine rich carboxyl terminus 1 | ? | 104.1 | 25.8 | −3.85 | <1.0 × 10⁻⁴ |
| AQP1 | Aquaporin 1 (Colton blood group) | Regulation of osmotic pressure, angiogenesis, apoptosis | 42.9 | 13.4 | −3.69 | <1.0 × 10⁻⁴ |
| YWHAZP5 | YWHAZ pseudogene 5 | ? | 10.2 | 3.2 | −3.68 | 0.013 |
| MRAP2 | Melanocortin 2 receptor accessory protein 2 | cAMP signaling | 1295.9 | 376.5 | −3.62 | <1.0 × 10⁻⁴ |
| C1QTNF7 | C1q and TNF related 7 | ? | 63.4 | 20.1 | −3.54 | <1.0 × 10⁻⁴ |
| MFAP2 | Microfibril associated protein 2 | Connective tissue organization | 32.4 | 8.7 | −3.47 | <1.0 × 10⁻⁴ |
| CLEC3A | C-type lectin domain family 3 member A | Skeletal system development | 847.3 | 264.6 | −3.46 | <1.0 × 10⁻⁴ |
| GREM1 | Gremlin 1, DAN family BMP antagonist | Regulation of connective tissue development | 5141.6 | 1566.4 | −3.41 | <1.0 × 10⁻⁴ |
| CRISPLD1 | Cysteine rich secretory protein LCCL domain containing 1 | Morphogenesis | 946.1 | 280.2 | −3.39 | <1.0 × 10⁻⁴ |
| HRASLS5 (=PLAAT5) | HRAS like suppressor family member 5 | Glycerophospholipid metabolism | 12.8 | 3.6 | −3.37 | 0.019 |
| Gene | Name | Function | Mean (Co) | Mean (IFNγ) | Fold change | adj. p |
|---|---|---|---|---|---|---|
| IDO1 | Indoleamine 2,3-dioxygenase 1 | Regulation of T cell -mediated immunity | 17.5 | 42,320.0 | 4643.74 | <1.0 × 10⁻⁴ |
| LGALS17A | Galectin 14 pseudogene | ? | 0.4 | 1065.1 | 1750.58 | <1.0 × 10⁻⁴ |
| GBP1P1 | Guanylate binding protein 1 pseudogene 1 | ? | 2.6 | 2838.8 | 1245.34 | <1.0 × 10⁻⁴ |
| CXCL10 | C-X-C motif chemokine ligand 10 | Chemotaxis | 2.2 | 2065.2 | 1117.91 | <1.0 × 10⁻⁴ |
| GBP5 | Guanylate binding protein 5 | Inflammasome activation | 1.4 | 1518.3 | 1112.44 | <1.0 × 10⁻⁴ |
| CXCL9 | C-X-C motif chemokine ligand 9 | T cell chemotaxis | 1.1 | 1069.9 | 1033.80 | <1.0 × 10⁻⁴ |
| GBP4 | Guanylate binding protein 4 | Inflammation? | 30.9 | 27,565.6 | 955.57 | <1.0 × 10⁻⁴ |
| IFI44L | Interferon induced protein 44 like | ? | 9.7 | 6185.8 | 694.66 | <1.0 × 10⁻⁴ |
| GBP1 | Guanylate binding protein 1 | Negative regulation of inflammation | 124.3 | 54,562.1 | 454.62 | <1.0 × 10⁻⁴ |
| HLA-DRA | Major histocompatibility complex, class II, DR alpha | Antigen presentation | 5.6 | 2338.3 | 408.93 | <1.0 × 10⁻⁴ |
| HLA-DRB1 | Major histocompatibility complex, class II, DR beta 1 | Antigen presentation | 10.7 | 2430.7 | 383.18 | <1.0 × 10⁻⁴ |
| CD74 | CD74 molecule | Antigen presentation | 31.9 | 11,211.5 | 353.35 | <1.0 × 10⁻⁴ |
| RSAD2 | Radical S-adenosyl methionine domain containing 2 | Antiviral action | 44.5 | 15,365.2 | 338.82 | <1.0 × 10⁻⁴ |
| RARRES3 | Retinoic acid receptor responder 3 | Phospholipid catabolism | 33.1 | 8271.1 | 286.40 | <1.0 × 10⁻⁴ |
| BST2 | Bone marrow stromal cell antigen 2 | Antiviral action | 10.1 | 2908.5 | 285.04 | <1.0 × 10⁻⁴ |
| GBP6 | Guanylate binding protein family member 6 | Inflammation | 1.0 | 193.3 | 273.26 | <1.0 × 10⁻⁴ |
| HLA-DRB5 | Major histocompatibility complex, class II, DR beta 5 | Antigen presentation | 4.4 | 825.4 | 253.47 | <1.0 × 10⁻⁴ |
| HLA-DRB6 | Major histocompatibility complex, class II, DR beta 6 (pseudogene) | Antigen presentation? | 0.3 | 125.7 | 226.68 | <1.0 × 10⁻⁴ |
| APOL4 | Apolipoprotein L4 | Lipid metabolism | 2.6 | 500.8 | 225.95 | <1.0 × 10⁻⁴ |
| IFIT2 | Interferon induced protein with tetratricopeptide repeats 2 | Regulation of proliferation | 96.2 | 20,648.8 | 225.79 | <1.0 × 10⁻⁴ |
| TNFRSF10D | TNF receptor superfamily member 10d | Inhibition of apoptosis | 4135.1 | 501.9 | −7.65 | <1.0 × 10⁻⁴ |
| ARHGAP9 | Rho gtpase activating protein 9 | ? | 10.7 | 2.4 | −5.27 | 0.0028 |
| NANOS1 | Nanos C2HC-type zinc finger 1 | Regulation of translation and cell migration | 83.4 | 16.9 | −4.94 | <1.0 × 10⁻⁴ |
| SNORD108 | Small nucleolar RNA, C/D box 108 | ? | 66.6 | 13.8 | −4.81 | <1.0 × 10⁻⁴ |
| FAM189A2 | Family with sequence similarity 189 member A2 | ? | 13.6 | 4.3 | −4.39 | 0.0033 |
| PWAR6 | Prader Willi/Angelman region RNA 6 | ? | 34.0 | 7.9 | −4.32 | <1.0 × 10⁻⁴ |
| GABRA4 | Gamma-aminobutyric acid type A receptor alpha4 subunit | Synaptic transmission | 2346.1 | 549.2 | −4.28 | <1.0 × 10⁻⁴ |
| CORO2A | Coronin 2A | ? | 13.5 | 3.7 | −4.11 | 0.020 |
| WFDC1 | WAP four-disulfide core domain 1 | Regulation of proliferation | 65.1 | 18.0 | −4.06 | <1.0 × 10⁻⁴ |
| PRSS35 | Serine protease 35 | ? | 51.4 | 13.5 | −4.01 | <1.0 × 10⁻⁴ |
| SLC16A14 | Solute carrier family 16 member 14 | Organic acid transport | 40.2 | 13.3 | −3.98 | <1.0 × 10⁻⁴ |
| PWAR5 | Prader Willi/Angelman region RNA 5 | ? | 359.7 | 91.4 | −3.93 | <1.0 × 10⁻⁴ |
| MTURN | Maturin, neural progenitor differentiation regulator homolog | ? | 1857.1 | 519.7 | −3.63 | <1.0 × 10⁻⁴ |
| C1QTNF5 | C1q and TNF related 5 | Cell adhesion | 152.4 | 46.1 | −3.47 | <1.0 × 10⁻⁴ |
| LONRF2 | LON peptidase N-terminal domain and ring finger 2 | ? | 206.8 | 59.5 | −3.46 | <1.0 × 10⁻⁴ |
| FGFR4 | Fibroblast growth factor receptor 4 | Cell proliferation and migration | 11.1 | 5.1 | −3.31 | 0.045 |
| TRABD2B | Trab domain containing 2B | Wnt signaling, proteolysis | 14.2 | 5.5 | −3.29 | 0.0014 |
| TNNT3 | Troponin T3, fast skeletal type | Muscle contraction | 106.0 | 31.6 | −3.26 | <1.0 × 10⁻⁴ |
| NCALD | Neurocalcin delta | Endocytosis | 17.3 | 6.6 | −3.24 | 0.029 |
| CDH2 | Cadherin 2 | Cell adhesion | 12.0 | 4.1 | −3.23 | 0.0012 |
| Term | IL1 | IL17 | IFNγ | Term | IL1 | IL17 | IFNγ |
|---|---|---|---|---|---|---|---|
| Inflammatory response | X | X | X | Nucleosome assembly | X | ||
| Immune response | X | X | X | Chromosome segregation | X | ||
| Response to lipopolysaccharide | X | X | X | Protein heterotetramerization | X | ||
| Chemotaxis | X | X | X | Wound healing | X | ||
| Negative regulation of viral entry | X | X | X | Regulation of cell proliferation | X | ||
| into host cell | Cell migration | X | |||||
| Negative regulation of type I | X | X | X | Regulation of gene silencing | X | ||
| interferon production | Positive regulation of interleukin-12 production | X | |||||
| Response to progesterone | X | X | Odontogenesis | X | |||
| Cell-cell signaling | X | X | Cellular response to mechanical stimulus | X | |||
| Angiogenesis | X | X | Peptidyl-tyrosine phosphorylation | X | |||
| Negative regulation of growth | X | X | Collagen catabolic process | X | |||
| Positive regulation of mitotic | X | X | Positive regulation of cell division | X | |||
| nuclear division | Positive chemotaxis | X | |||||
| Negative regulation of cell | X | X | Positive regulation of nitric-oxide synthase biosynthetic | X | |||
| proliferation | process | ||||||
| Signal transduction | X | X | Acute-phase response | X | |||
| Response to virus | X | X | Positive regulation of cytosolic calcium ion concentration | X | |||
| Positive regulation of interleukin-6 | X | X | Positive regulation of gtpase activity | X | |||
| production | Response to glucocorticoid | X | |||||
| Response to hydrogen peroxide | X | X | Response to wounding | X | |||
| Positive regulation of I-kappab | X | X | Positive regulation of NF-kappab transcription factor | X | |||
| kinase/NF-kappab signaling | activity | ||||||
| Response to drug | X | X | Negative regulation of tumor necrosis factor production | X | |||
| Cellular response to zinc ion | X | X | Cellular response to organic cyclic compound | X | |||
| Response to toxic substance | X | X | Antigen processing and presentation | X | |||
| Tumor necrosis factor-mediated | X | X | Antigen processing and presentation of peptide or | X | |||
| signaling pathway | polysaccharide antigen via MHC class II | ||||||
| Cell division | X | Antigen processing and presentation of exogenous peptide | X | ||||
| DNA replication | X | antigen via MHC class I, TAP-independent | |||||
| Telomere organization | X | Response to interferon-beta | X | ||||
| Positive regulation of gene | X | Response to interferon-alpha | X | ||||
| expression | T cell costimulation | X | |||||
| Cell adhesion | X | Positive regulation of T cell mediated cytotoxicity | X | ||||
| Extracellular matrix organization | X | Defense response | X | ||||
| Skeletal system development | X | Protein trimerization | X | ||||
| Sister chromatid cohesion | X | Proteolysis | X | ||||
| DNA replication initiation | X | Defense response to protozoan | X | ||||
| Cellular protein metabolic process | X | Positive regulation of peptidyl-tyrosine phosphorylation | X | ||||
| Cell proliferation | X | Protein polyubiquitination | X | ||||
| Negative regulation of gene | X | ||||||
| expression, epigenetic |
| Gene | Name | Mean exp. (Co) | Mean exp. (IL1) | Mean exp. (IL17) | Mean exp. (IFNγ) | FC (IL1 vs. Co) | adj. p (IL1 vs. Co) | FC (IL17 vs. Co) | adj. p (IL17 vs. Co) | FC (IFNγ vs. Co) | adj. p (IFNγ vs. Co) |
|---|---|---|---|---|---|---|---|---|---|---|---|
| IL6 | Interleukin 6 | 12.8 | 18,406.9 | 1431.4 | 94.2 | 3685.72 | <1.0 × 10⁻⁴ | 250.15 | <1.0 × 10⁻⁴ | 12.34 | <1.0 × 10⁻⁴ |
| IL36RN | Interleukin 36 receptor antagonist | 8.9 | 5863.8 | 468.0 | 36.7 | 914.19 | <1.0 × 10⁻⁴ | 69.09 | <1.0 × 10⁻⁴ | 4.59 | <1.0 × 10⁻⁴ |
| ESM1 | Endothelial cell specific molecule 1 | 276.7 | 37,984.1 | 1373.5 | 1449.2 | 157.25 | <1.0 × 10⁻⁴ | 5.09 | <1.0 × 10⁻⁴ | 4.70 | <1.0 × 10⁻⁴ |
| SAA2 | Serum amyloid A2 | 5.8 | 371.4 | 659.2 | 27.1 | 149.11 | <1.0 × 10⁻⁴ | 319.99 | <1.0 × 10⁻⁴ | 8.73 | <1.0 × 10⁻⁴ |
| iNOS/NOS2 | Inducible nitric oxide synthase/Nitric oxide synthase 2 | 144.2 | 12,704.9 | 3370.2 | 3046.1 | 131.22 | <1.0 × 10⁻⁴ | 40.02 | <1.0 × 10⁻⁴ | 30.16 | <1.0 × 10⁻⁴ |
| NOD2 | Nucleotide binding oligomerization domain containing 2 | 7.6 | 919.4 | 96.7 | 43.9 | 116.73 | <1.0 × 10⁻⁴ | 13.67 | <1.0 × 10⁻⁴ | 5.61 | <1.0 × 10⁻⁴ |
| PTX3 | Pentraxin 3 | 184.4 | 18,888.7 | 4615.3 | 479.6 | 113.19 | <1.0 × 10⁻⁴ | 27.47 | <1.0 × 10⁻⁴ | 2.60 | <1.0 × 10⁻⁴ |
| SAA1 | Serum amyloid A1 | 66.6 | 2188.7 | 3520.0 | 227.6 | 94.66 | <1.0 × 10⁻⁴ | 183.26 | <1.0 × 10⁻⁴ | 6.46 | <1.0 × 10⁻⁴ |
| CD300E | CD300e molecule | 3.6 | 316.9 | 32.7 | 71.6 | 72.79 | <1.0 × 10⁻⁴ | 7.91 | <1.0 × 10⁻⁴ | 17.15 | <1.0 × 10⁻⁴ |
| IL36B | Interleukin 36 beta | 11.3 | 466.3 | 80.1 | 39.1 | 67.27 | <1.0 × 10⁻⁴ | 9.65 | <1.0 × 10⁻⁴ | 3.60 | <1.0 × 10⁻⁴ |
| TNFRSF1B | TNF receptor superfamily member 1B | 40.0 | 2370.7 | 525.8 | 118.9 | 62.58 | <1.0 × 10⁻⁴ | 14.66 | <1.0 × 10⁻⁴ | 3.02 | <1.0 × 10⁻⁴ |
| TNFAIP6 | TNF alpha induced protein 6 | 1176.4 | 42,950.3 | 5512.4 | 4561.2 | 36.87 | <1.0 × 10⁻⁴ | 4.59 | <1.0 × 10⁻⁴ | 3.59 | <1.0 × 10⁻⁴ |
| TMEM132A | Transmembrane protein 132A | 10.3 | 328.1 | 165.0 | 32.6 | 33.90 | <1.0 × 10⁻⁴ | 16.64 | <1.0 × 10⁻⁴ | 3.18 | <1.0 × 10⁻⁴ |
| ICAM1 | Intercellular adhesion molecule 1 | 1415.2 | 42,657.2 | 4388.3 | 8524.5 | 31.66 | <1.0 × 10⁻⁴ | 3.15 | <1.0 × 10⁻⁴ | 5.54 | <1.0 × 10⁻⁴ |
| C3AR1 | Complement C3a receptor 1 | 2.2 | 66.2 | 11.4 | 11.2 | 28.15 | <1.0 × 10⁻⁴ | 6.36 | 1.5 × 10⁻⁴ | 5.32 | 4.9 × 10⁻⁴ |
| CLEC2B | C-type lectin domain family 2 member B | 5.3 | 145.0 | 48.5 | 20.6 | 27.53 | <1.0 × 10⁻⁴ | 9.35 | <1.0 × 10⁻⁴ | 3.85 | <1.0 × 10⁻⁴ |
| COX-2/PTGS2 | Cyclooxygenase-2/Prostaglandin-endoperoxide synthase 2 | 1310.7 | 37,281.5 | 4678.6 | 5349.2 | 26.96 | <1.0 × 10⁻⁴ | 3.28 | <1.0 × 10⁻⁴ | 3.57 | <1.0 × 10⁻⁴ |
| TLR2 | Toll like receptor 2 | 134.9 | 3348.9 | 782.0 | 371.4 | 22.64 | <1.0 × 10⁻⁴ | 5.02 | <1.0 × 10⁻⁴ | 2.54 | <1.0 × 10⁻⁴ |
| CCL7 | C-C motif chemokine ligand 7 | 2.1 | 36.7 | 20.6 | 24.4 | 20.66 | <1.0 × 10⁻⁴ | 12.14 | <1.0 × 10⁻⁴ | 10.56 | <1.0 × 10⁻⁴ |
| CCL2 | C-C motif chemokine ligand 2 | 150.4 | 2475.0 | 815.0 | 430.6 | 19.42 | <1.0 × 10⁻⁴ | 5.85 | <1.0 × 10⁻⁴ | 2.61 | <1.0 × 10⁻⁴ |
| IRF4 | Interferon regulatory factor 4 | 23.5 | 400.1 | 94.9 | 114.2 | 18.20 | <1.0 × 10⁻⁴ | 4.62 | <1.0 × 10⁻⁴ | 4.69 | <1.0 × 10⁻⁴ |
| CD274 | CD274 molecule | 61.8 | 1048.8 | 350.1 | 3845.7 | 17.56 | <1.0 × 10⁻⁴ | 6.18 | <1.0 × 10⁻⁴ | 60.08 | <1.0 × 10⁻⁴ |
| RBM47 | RNA binding motif protein 47 | 8.8 | 122.3 | 30.6 | 22.8 | 14.96 | <1.0 × 10⁻⁴ | 3.38 | <1.0 × 10⁻⁴ | 2.67 | 0.040 |
| CD38 | CD38 molecule | 9.8 | 133.8 | 74.3 | 211.4 | 14.81 | <1.0 × 10⁻⁴ | 7.67 | <1.0 × 10⁻⁴ | 20.76 | <1.0 × 10⁻⁴ |
| BDKRB1 | Bradykinin receptor B1 | 29.0 | 401.5 | 129.6 | 105.0 | 13.95 | <1.0 × 10⁻⁴ | 4.88 | <1.0 × 10⁻⁴ | 3.19 | <1.0 × 10⁻⁴ |
| GCH1 | GTP cyclohydrolase 1 | 591.7 | 7968.7 | 2212.7 | 3584.2 | 13.38 | <1.0 × 10⁻⁴ | 3.90 | <1.0 × 10⁻⁴ | 5.63 | <1.0 × 10⁻⁴ |
| LRRC38 | Leucine rich repeat containing 38 | 11.2 | 132.1 | 44.4 | 35.8 | 11.59 | <1.0 × 10⁻⁴ | 3.79 | <1.0 × 10⁻⁴ | 2.98 | <1.0 × 10⁻⁴ |
| KIAA1217 | KIAA1217 | 15.3 | 157.8 | 55.1 | 109.1 | 10.61 | <1.0 × 10⁻⁴ | 3.80 | <1.0 × 10⁻⁴ | 6.39 | <1.0 × 10⁻⁴ |
| SSTR2 | Somatostatin receptor 2 | 90.0 | 971.2 | 1549.7 | 340.1 | 10.56 | <1.0 × 10⁻⁴ | 16.11 | <1.0 × 10⁻⁴ | 3.36 | <1.0 × 10⁻⁴ |
| DUSP5 | Dual specificity phosphatase 5 | 77.3 | 746.8 | 302.4 | 236.1 | 10.54 | <1.0 × 10⁻⁴ | 4.02 | <1.0 × 10⁻⁴ | 2.90 | <1.0 × 10⁻⁴ |
| TYMP | Thymidine phosphorylase | 311.3 | 3020.1 | 1275.1 | 9324.0 | 10.15 | <1.0 × 10⁻⁴ | 4.24 | <1.0 × 10⁻⁴ | 28.71 | <1.0 × 10⁻⁴ |
| GPR158 | G protein-coupled receptor 158 | 6.9 | 38.0 | 22.0 | 21.5 | 9.98 | <1.0 × 10⁻⁴ | 6.77 | 0.0018 | 5.55 | 7.6 × 10⁻⁴ |
| PRLR | Prolactin receptor | 8.3 | 78.8 | 29.7 | 33.0 | 9.93 | <1.0 × 10⁻⁴ | 3.05 | 0.0034 | 3.92 | <1.0 × 10⁻⁴ |
| GSAP | Gamma-secretase activating protein | 122.2 | 1109.8 | 378.0 | 509.3 | 9.18 | <1.0 × 10⁻⁴ | 3.26 | <1.0 × 10⁻⁴ | 3.74 | <1.0 × 10⁻⁴ |
| GPR39 | G protein-coupled receptor 39 | 15.4 | 110.6 | 39.1 | 41.4 | 9.17 | <1.0 × 10⁻⁴ | 3.24 | 1.7 × 10⁻⁴ | 2.71 | <1.0 × 10⁻⁴ |
| LYPD1 | LY6/PLAUR domain containing 1 | 10.5 | 71.5 | 28.7 | 27.7 | 8.44 | <1.0 × 10⁻⁴ | 3.31 | 5.6 × 10⁻⁴ | 2.62 | 0.0023 |
| ODF3B | Outer dense fiber of sperm tails 3B | 34.6 | 261.0 | 106.0 | 773.8 | 7.98 | <1.0 × 10⁻⁴ | 3.28 | <1.0 × 10⁻⁴ | 21.57 | <1.0 × 10⁻⁴ |
| SLC15A3 | Solute carrier family 15 member 3 | 16.3 | 119.4 | 54.7 | 607.4 | 7.63 | <1.0 × 10⁻⁴ | 3.45 | <1.0 × 10⁻⁴ | 35.59 | <1.0 × 10⁻⁴ |
| HAL | Histidine ammonia-lyase | 6.2 | 44.1 | 28.7 | 47.4 | 7.57 | <1.0 × 10⁻⁴ | 4.71 | <1.0 × 10⁻⁴ | 6.97 | <1.0 × 10⁻⁴ |
| DOCK4 | Dedicator of cytokinesis 4 | 44.0 | 306.8 | 144.9 | 139.2 | 6.94 | <1.0 × 10⁻⁴ | 3.21 | <1.0 × 10⁻⁴ | 2.91 | <1.0 × 10⁻⁴ |
| RAB27B | RAB27B, member RAS oncogene family | 16.5 | 77.2 | 60.5 | 84.5 | 5.98 | <1.0 × 10⁻⁴ | 3.85 | <1.0 × 10⁻⁴ | 5.62 | <1.0 × 10⁻⁴ |
| CH25H | Cholesterol 25-hydroxylase | 7.4 | 36.5 | 25.8 | 41.8 | 4.41 | <1.0 × 10⁻⁴ | 3.27 | 0.022 | 6.32 | <1.0 × 10⁻⁴ |
| USP43 | Ubiquitin specific peptidase 43 | 4.4 | 12.8 | 13.6 | 16.1 | 3.94 | 0.020 | 3.41 | 0.013 | 4.50 | 0.0091 |
| AC104966.1 | Ceruloplasmin (ferroxidase) (CP) pseudogene | 16.5 | 47.6 | 57.3 | 53.7 | 3.39 | <1.0 × 10⁻⁴ | 3.79 | <1.0 × 10⁻⁴ | 3.36 | <1.0 × 10⁻⁴ |
| KLK10 | Kallikrein related peptidase 10 | 14.0 | 37.1 | 33.0 | 43.1 | 3.11 | 0.022 | 3.29 | 0.0067 | 2.65 | 0.0028 |
| Gene | Name | Function | Mean exp. (Co) | Mean exp. (IL1) | Mean exp. (IL17) | Mean exp. (IFNγ) | FC (IL1 vs. Co) | adj. p (IL1 vs. Co) | FC (IL17 vs. Co) | adj. p (IL17 vs. Co) | FC (IFNγ vs. Co) | adj. p (IFNγ vs. Co) |
|---|---|---|---|---|---|---|---|---|---|---|---|---|
| SCN2B | Sodium voltage-gated channel beta subunit 2 | Sodium ion transport | 170.8 | 8.7 | 65.9 | 63.7 | −22.19 | <1.0 × 10⁻⁴ | −2.59 | <1.0 × 10⁻⁴ | −2.90 | <1.0 × 10⁻⁴ |
| TNNT3 | Troponin T3, fast skeletal type | Skeletal muscle constituent | 97.8 | 6.4 | 17.9 | 31.6 | −17.51 | <1.0 × 10⁻⁴ | −5.28 | <1.0 × 10⁻⁴ | −3.26 | <1.0 × 10⁻⁴ |
| MRAP2 | Melanocortin 2 receptor accessory protein 2 | Metabolism? | 1348.7 | 91.1 | 376.5 | 572.0 | −15.12 | <1.0 × 10⁻⁴ | −3.62 | <1.0 × 10⁻⁴ | −2.85 | <1.0 × 10⁻⁴ |
| WFDC1 | WAP four-disulfide core domain 1 | Negative regulation of cell growth | 60.1 | 6.1 | 34.9 | 18.0 | −12.06 | <1.0 × 10⁻⁴ | −2.68 | 0.0019 | −4.06 | <1.0 × 10⁻⁴ |
| RANBP3L | RAN binding protein 3 like | Nuclear export | 654.8 | 74.6 | 284.8 | 280.0 | −9.40 | <1.0 × 10⁻⁴ | −2.54 | <1.0 × 10⁻⁴ | −2.60 | <1.0 × 10⁻⁴ |
| ASPN | Asporin | Skeletal system development, negative regulation of TGFβ signaling | 2094.0 | 206.3 | 505.2 | 837.5 | −8.28 | <1.0 × 10⁻⁴ | −3.92 | <1.0 × 10⁻⁴ | −2.77 | <1.0 × 10⁻⁴ |
| FGFR4 | Fibroblast growth factor receptor 4 | Cell proliferation and migration | 10.3 | 2.3 | 3.1 | 5.1 | −5.59 | 5.2 × 10⁻⁴ | −3.12 | 0.036 | −3.31 | 0.045 |
| PTGER3 | Prostaglandin E receptor 3 | Inflammation, cell death | 494.1 | 173.6 | 162.3 | 188.8 | −2.69 | <1.0 × 10⁻⁴ | −3.03 | <1.0 × 10⁻⁴ | −2.82 | <1.0 × 10⁻⁴ |
Publisher’s Note: MDPI stays neutral with regard to jurisdictional claims in published maps and institutional affiliations. |
© 2021 by the authors. Licensee MDPI, Basel, Switzerland. This article is an open access article distributed under the terms and conditions of the Creative Commons Attribution (CC BY) license (https://creativecommons.org/licenses/by/4.0/).
Share and Cite
Pemmari, A.; Leppänen, T.; Hämäläinen, M.; Moilanen, T.; Moilanen, E. Chondrocytes from Osteoarthritis Patients Adopt Distinct Phenotypes in Response to Central TH1/TH2/TH17 Cytokines. Int. J. Mol. Sci. 2021, 22, 9463. https://doi.org/10.3390/ijms22179463
Pemmari A, Leppänen T, Hämäläinen M, Moilanen T, Moilanen E. Chondrocytes from Osteoarthritis Patients Adopt Distinct Phenotypes in Response to Central TH1/TH2/TH17 Cytokines. International Journal of Molecular Sciences. 2021; 22(17):9463. https://doi.org/10.3390/ijms22179463
Chicago/Turabian StylePemmari, Antti, Tiina Leppänen, Mari Hämäläinen, Teemu Moilanen, and Eeva Moilanen. 2021. "Chondrocytes from Osteoarthritis Patients Adopt Distinct Phenotypes in Response to Central TH1/TH2/TH17 Cytokines" International Journal of Molecular Sciences 22, no. 17: 9463. https://doi.org/10.3390/ijms22179463