
Vitamin D3 Enriches Ceramide Content in Exosomes Released by Embryonic Hippocampal Cells

 , , , , , and
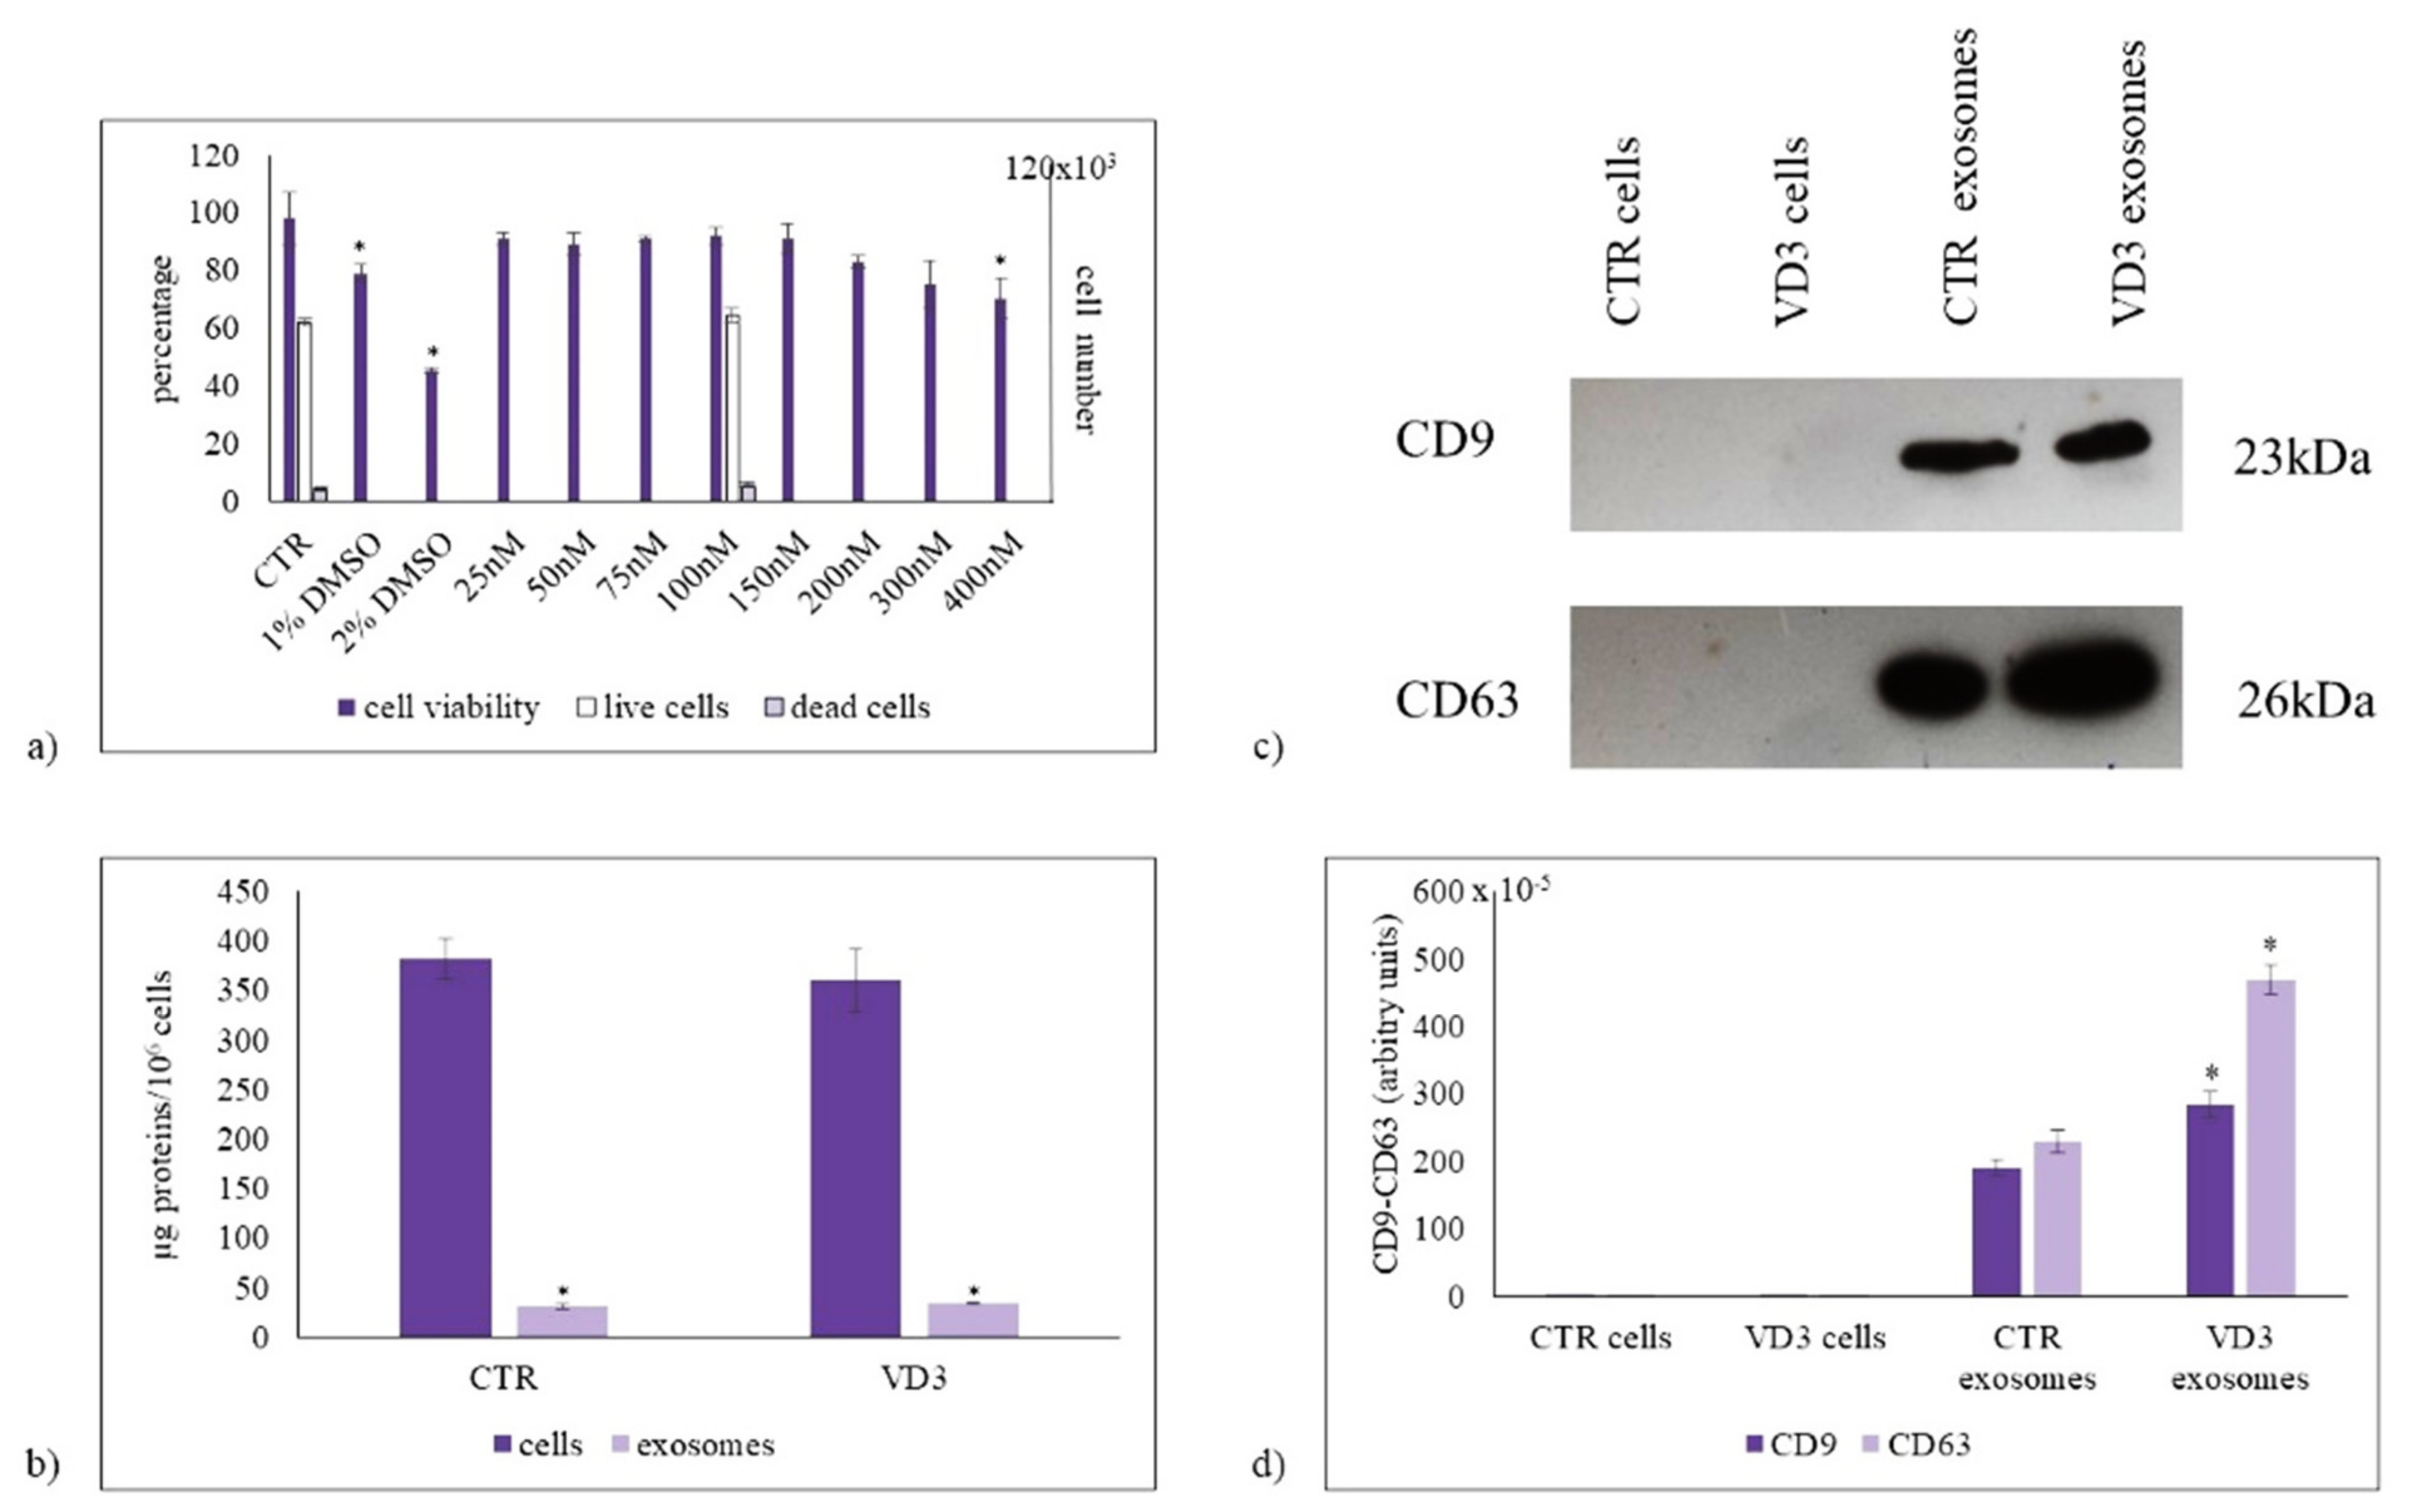
Abstract
:1. Introduction
2. Results
2.1. Parameters for Cell and Exosome Measurements
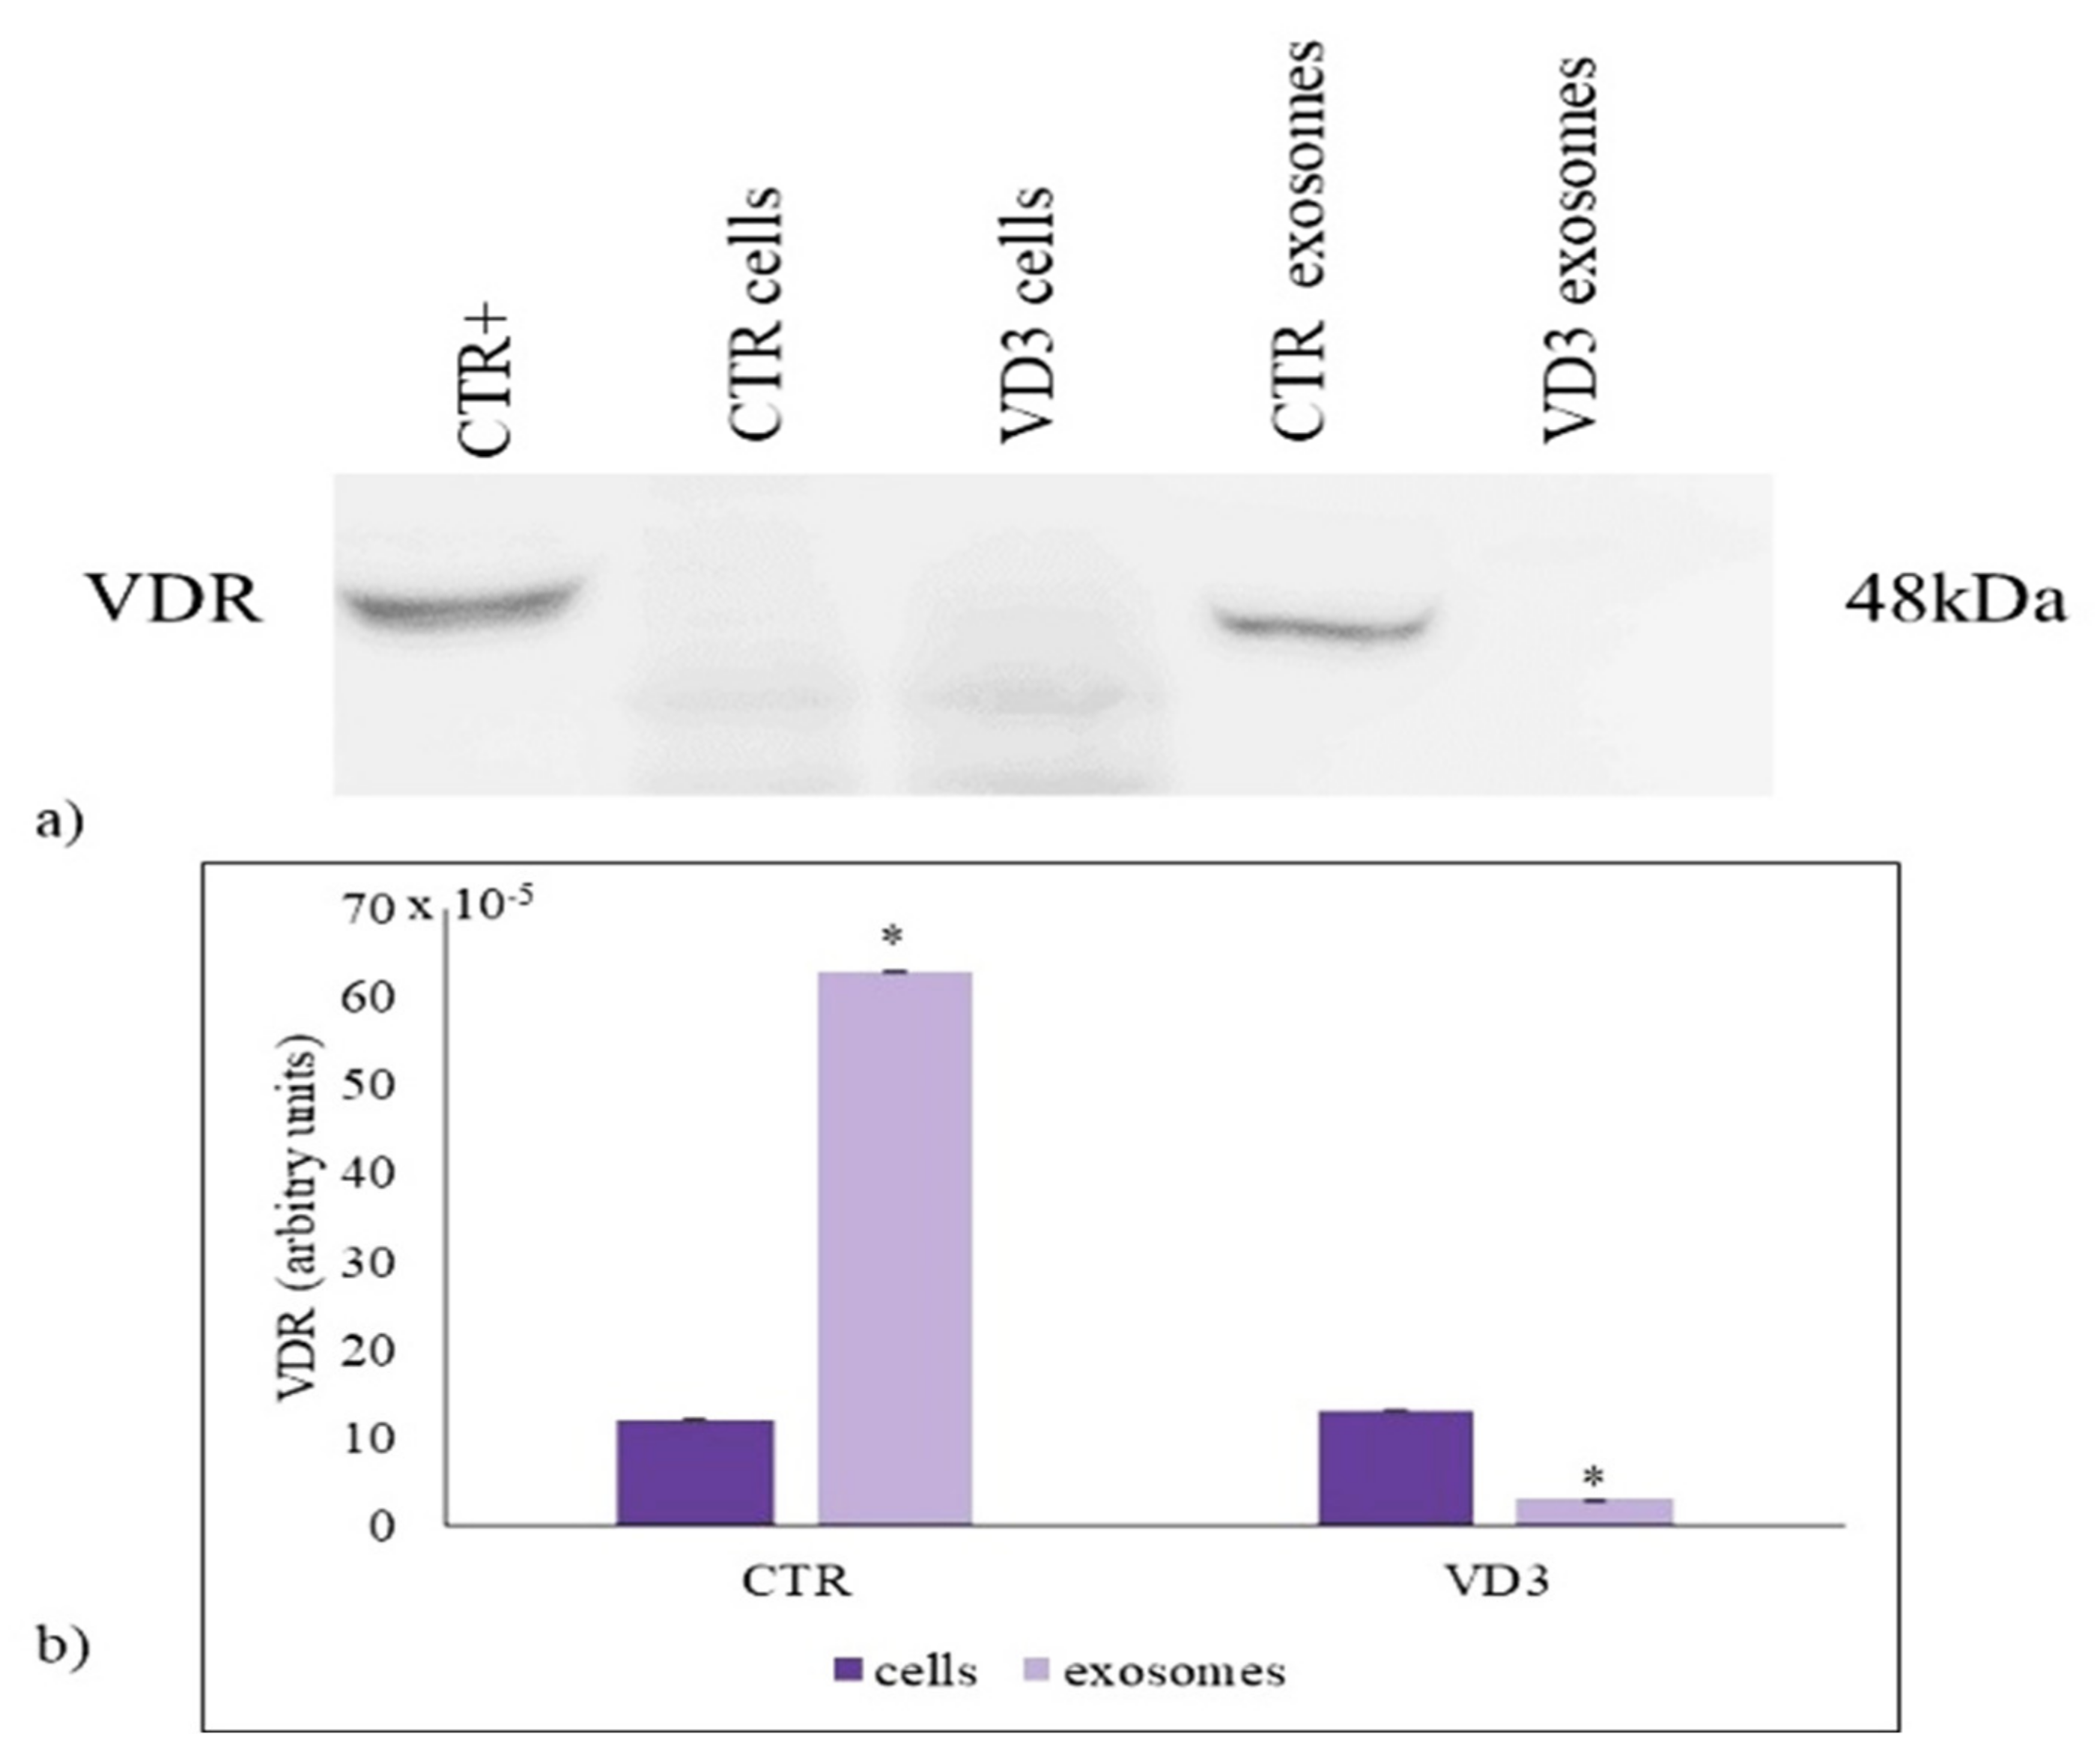
2.2. VD3 Causes VDR Suppression in Exosomes
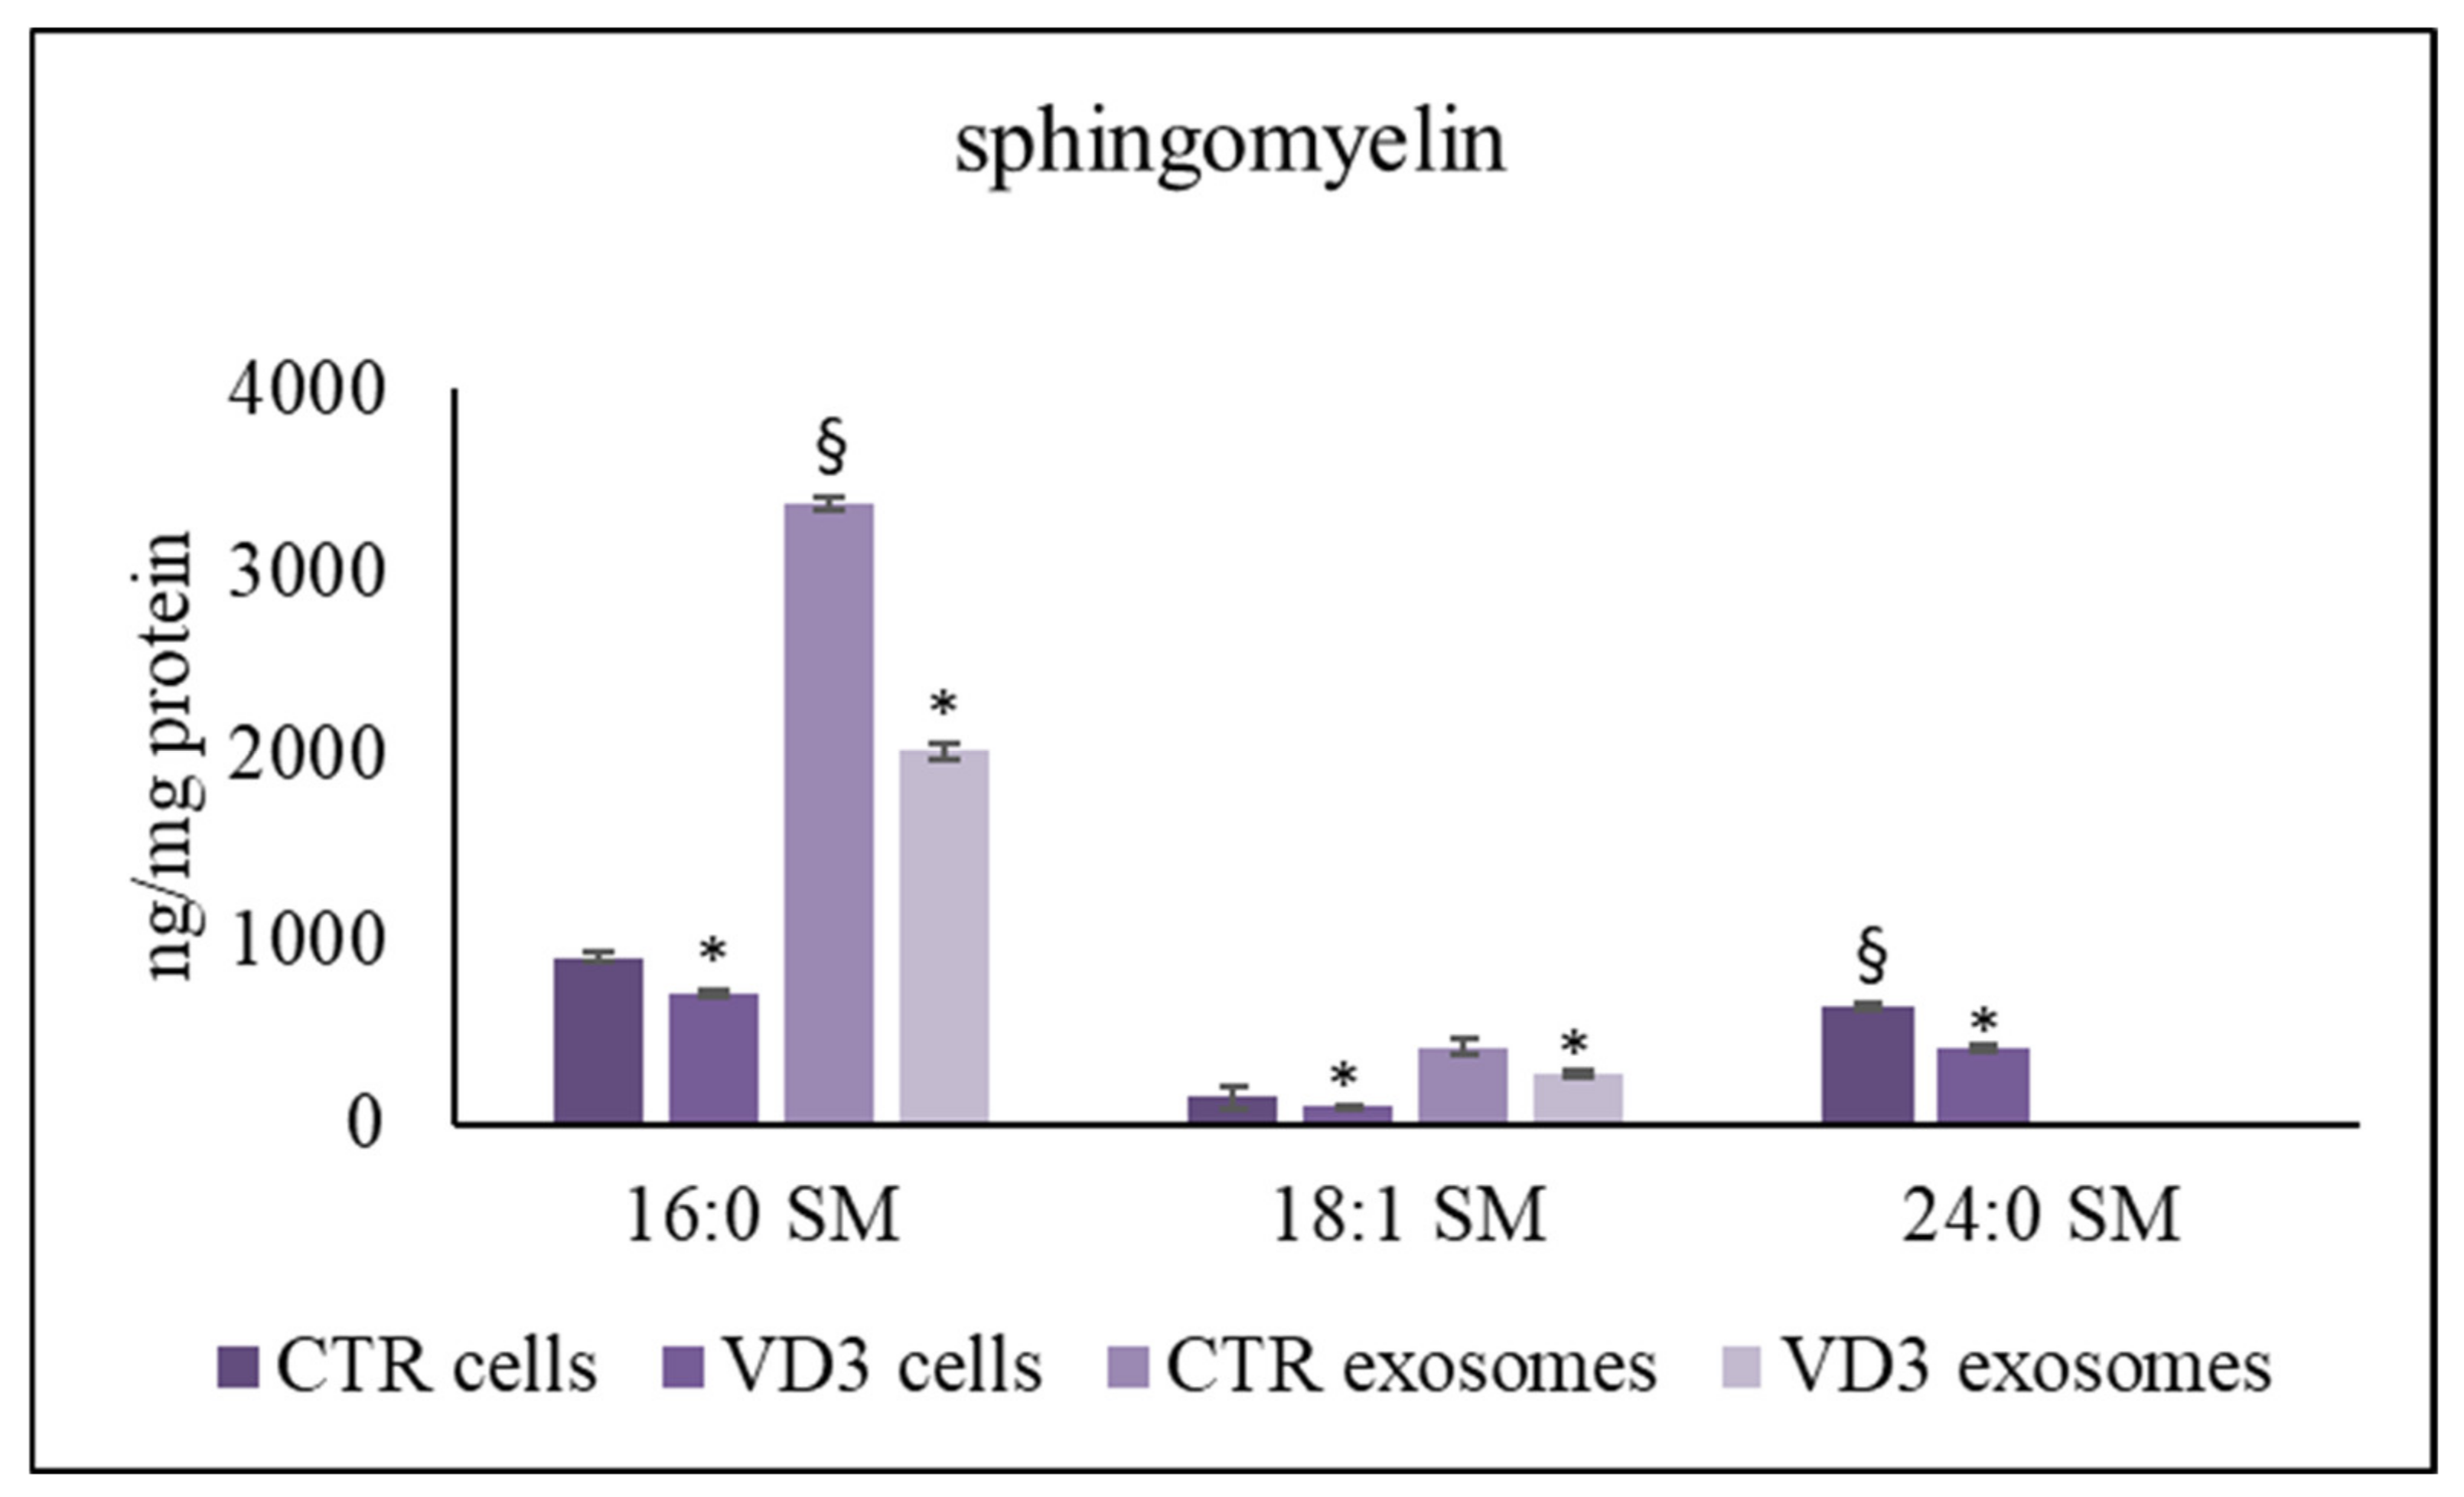
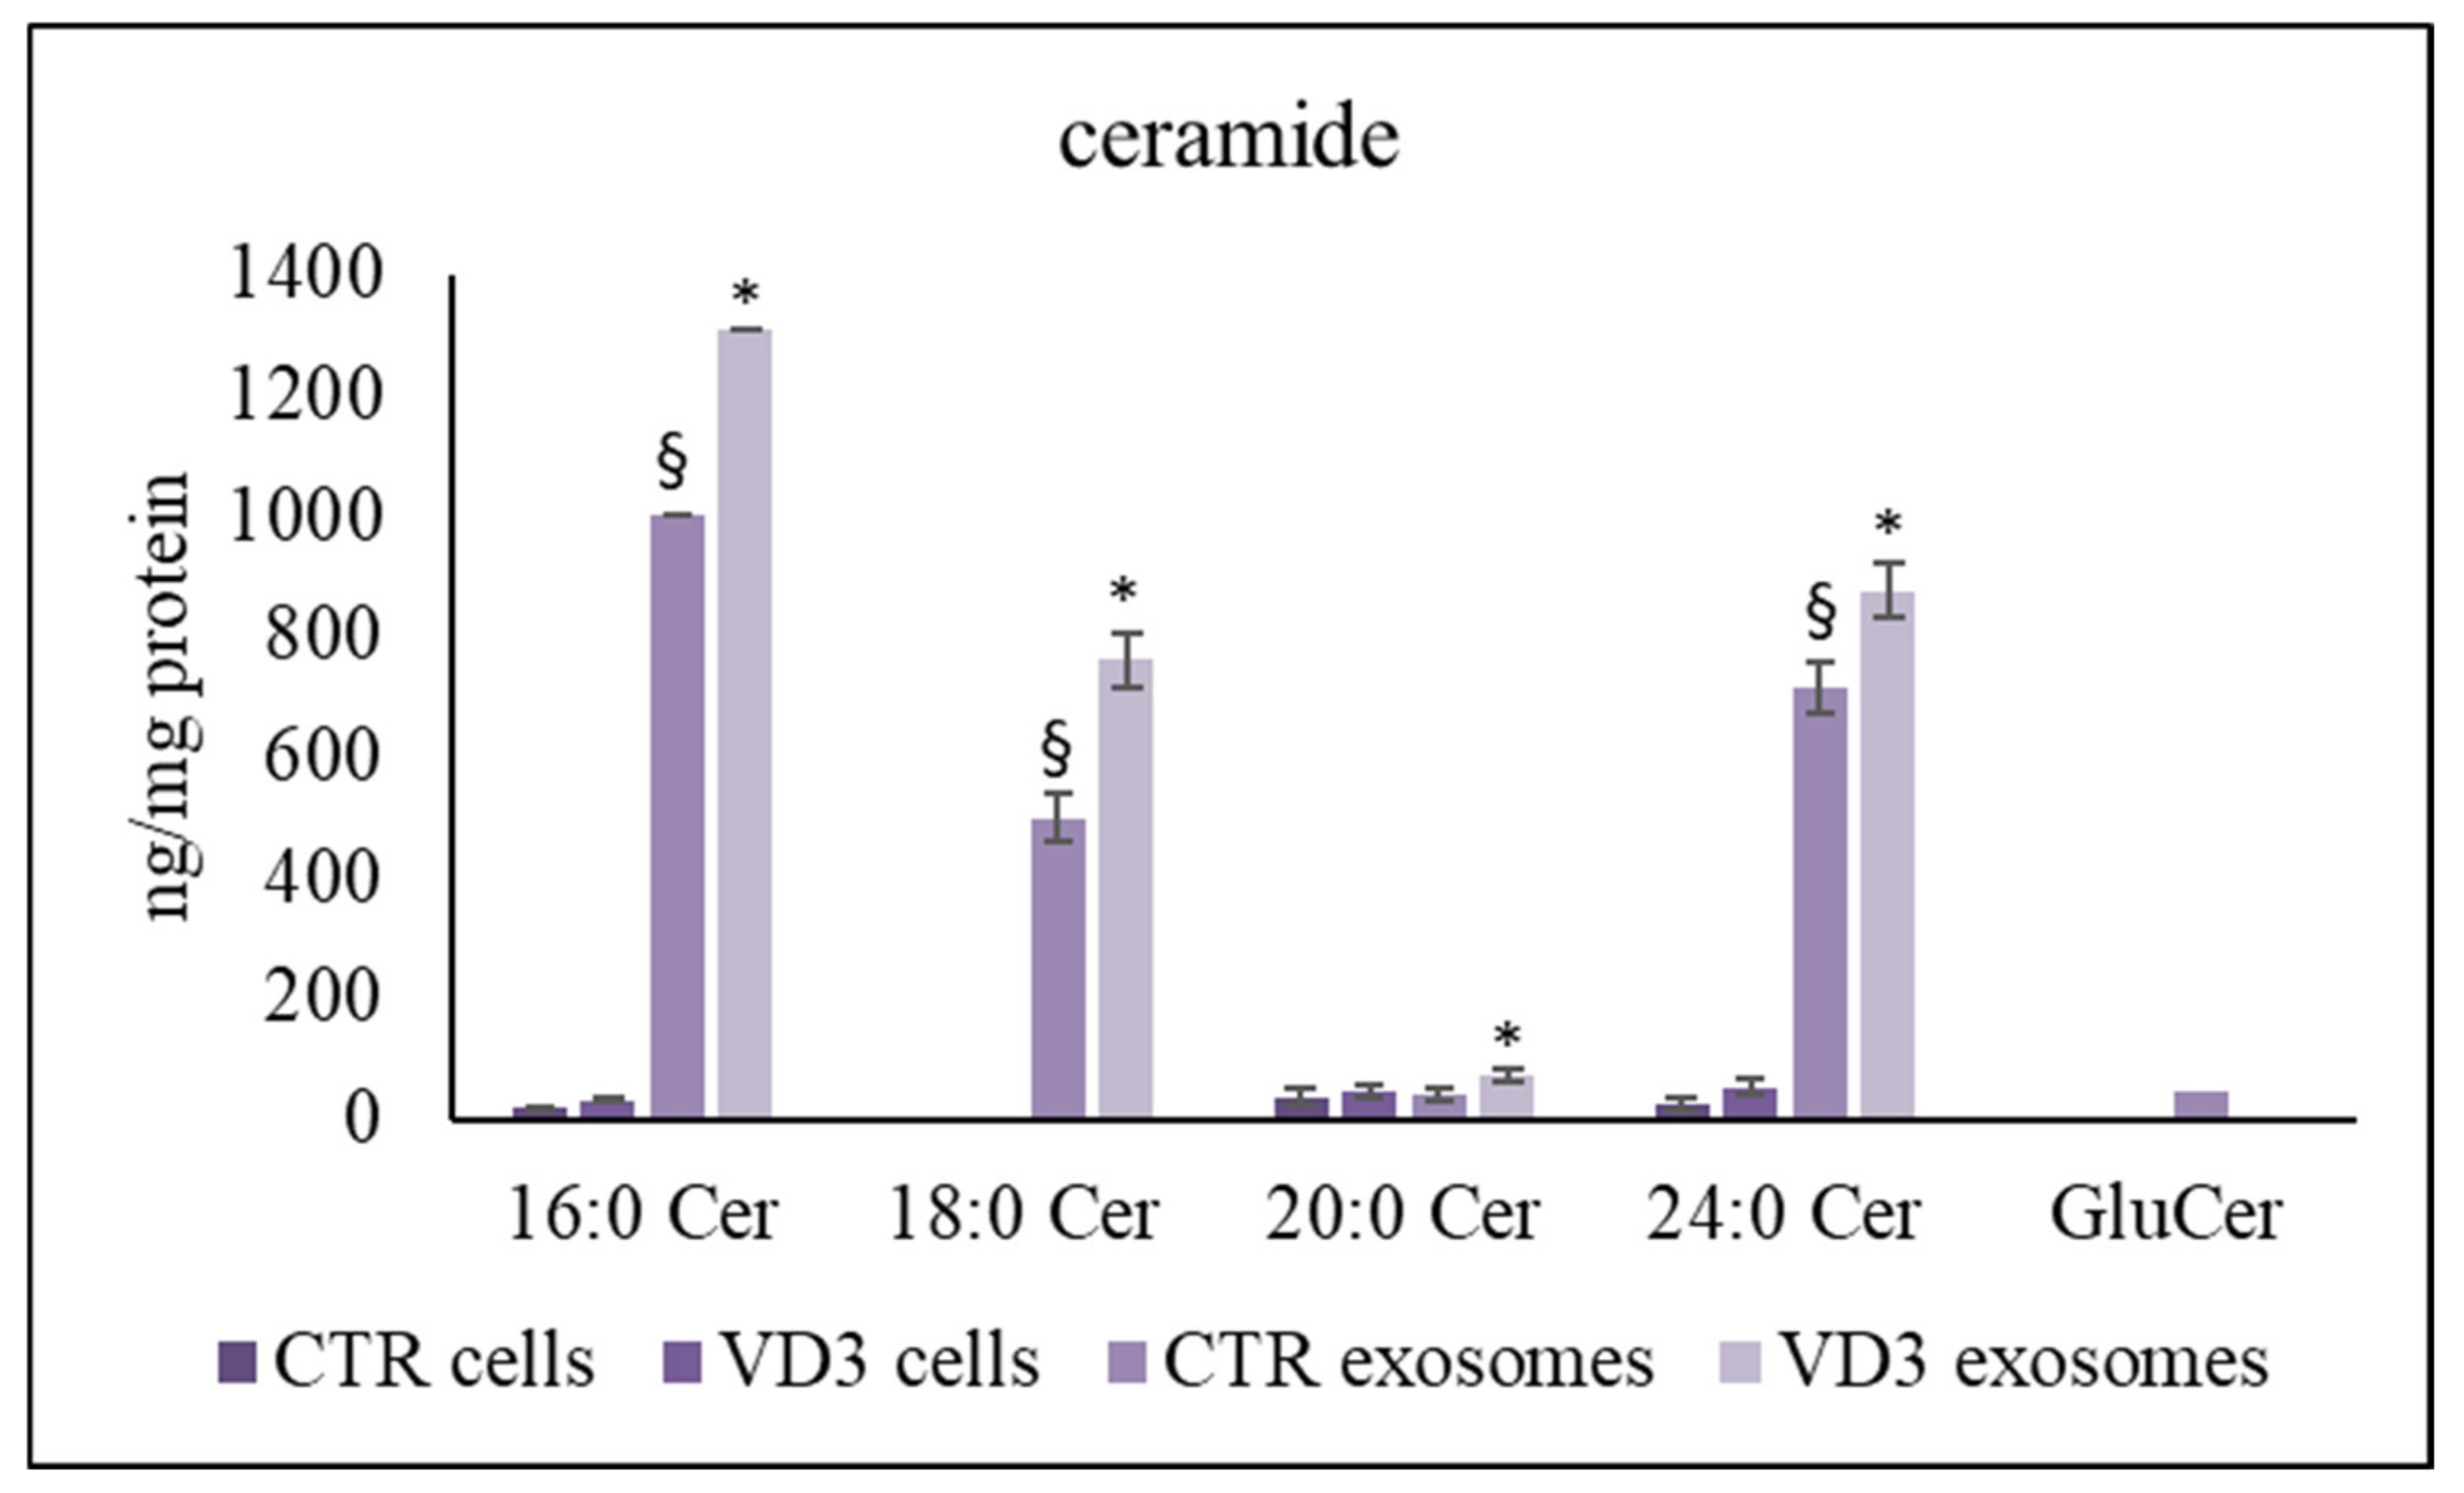
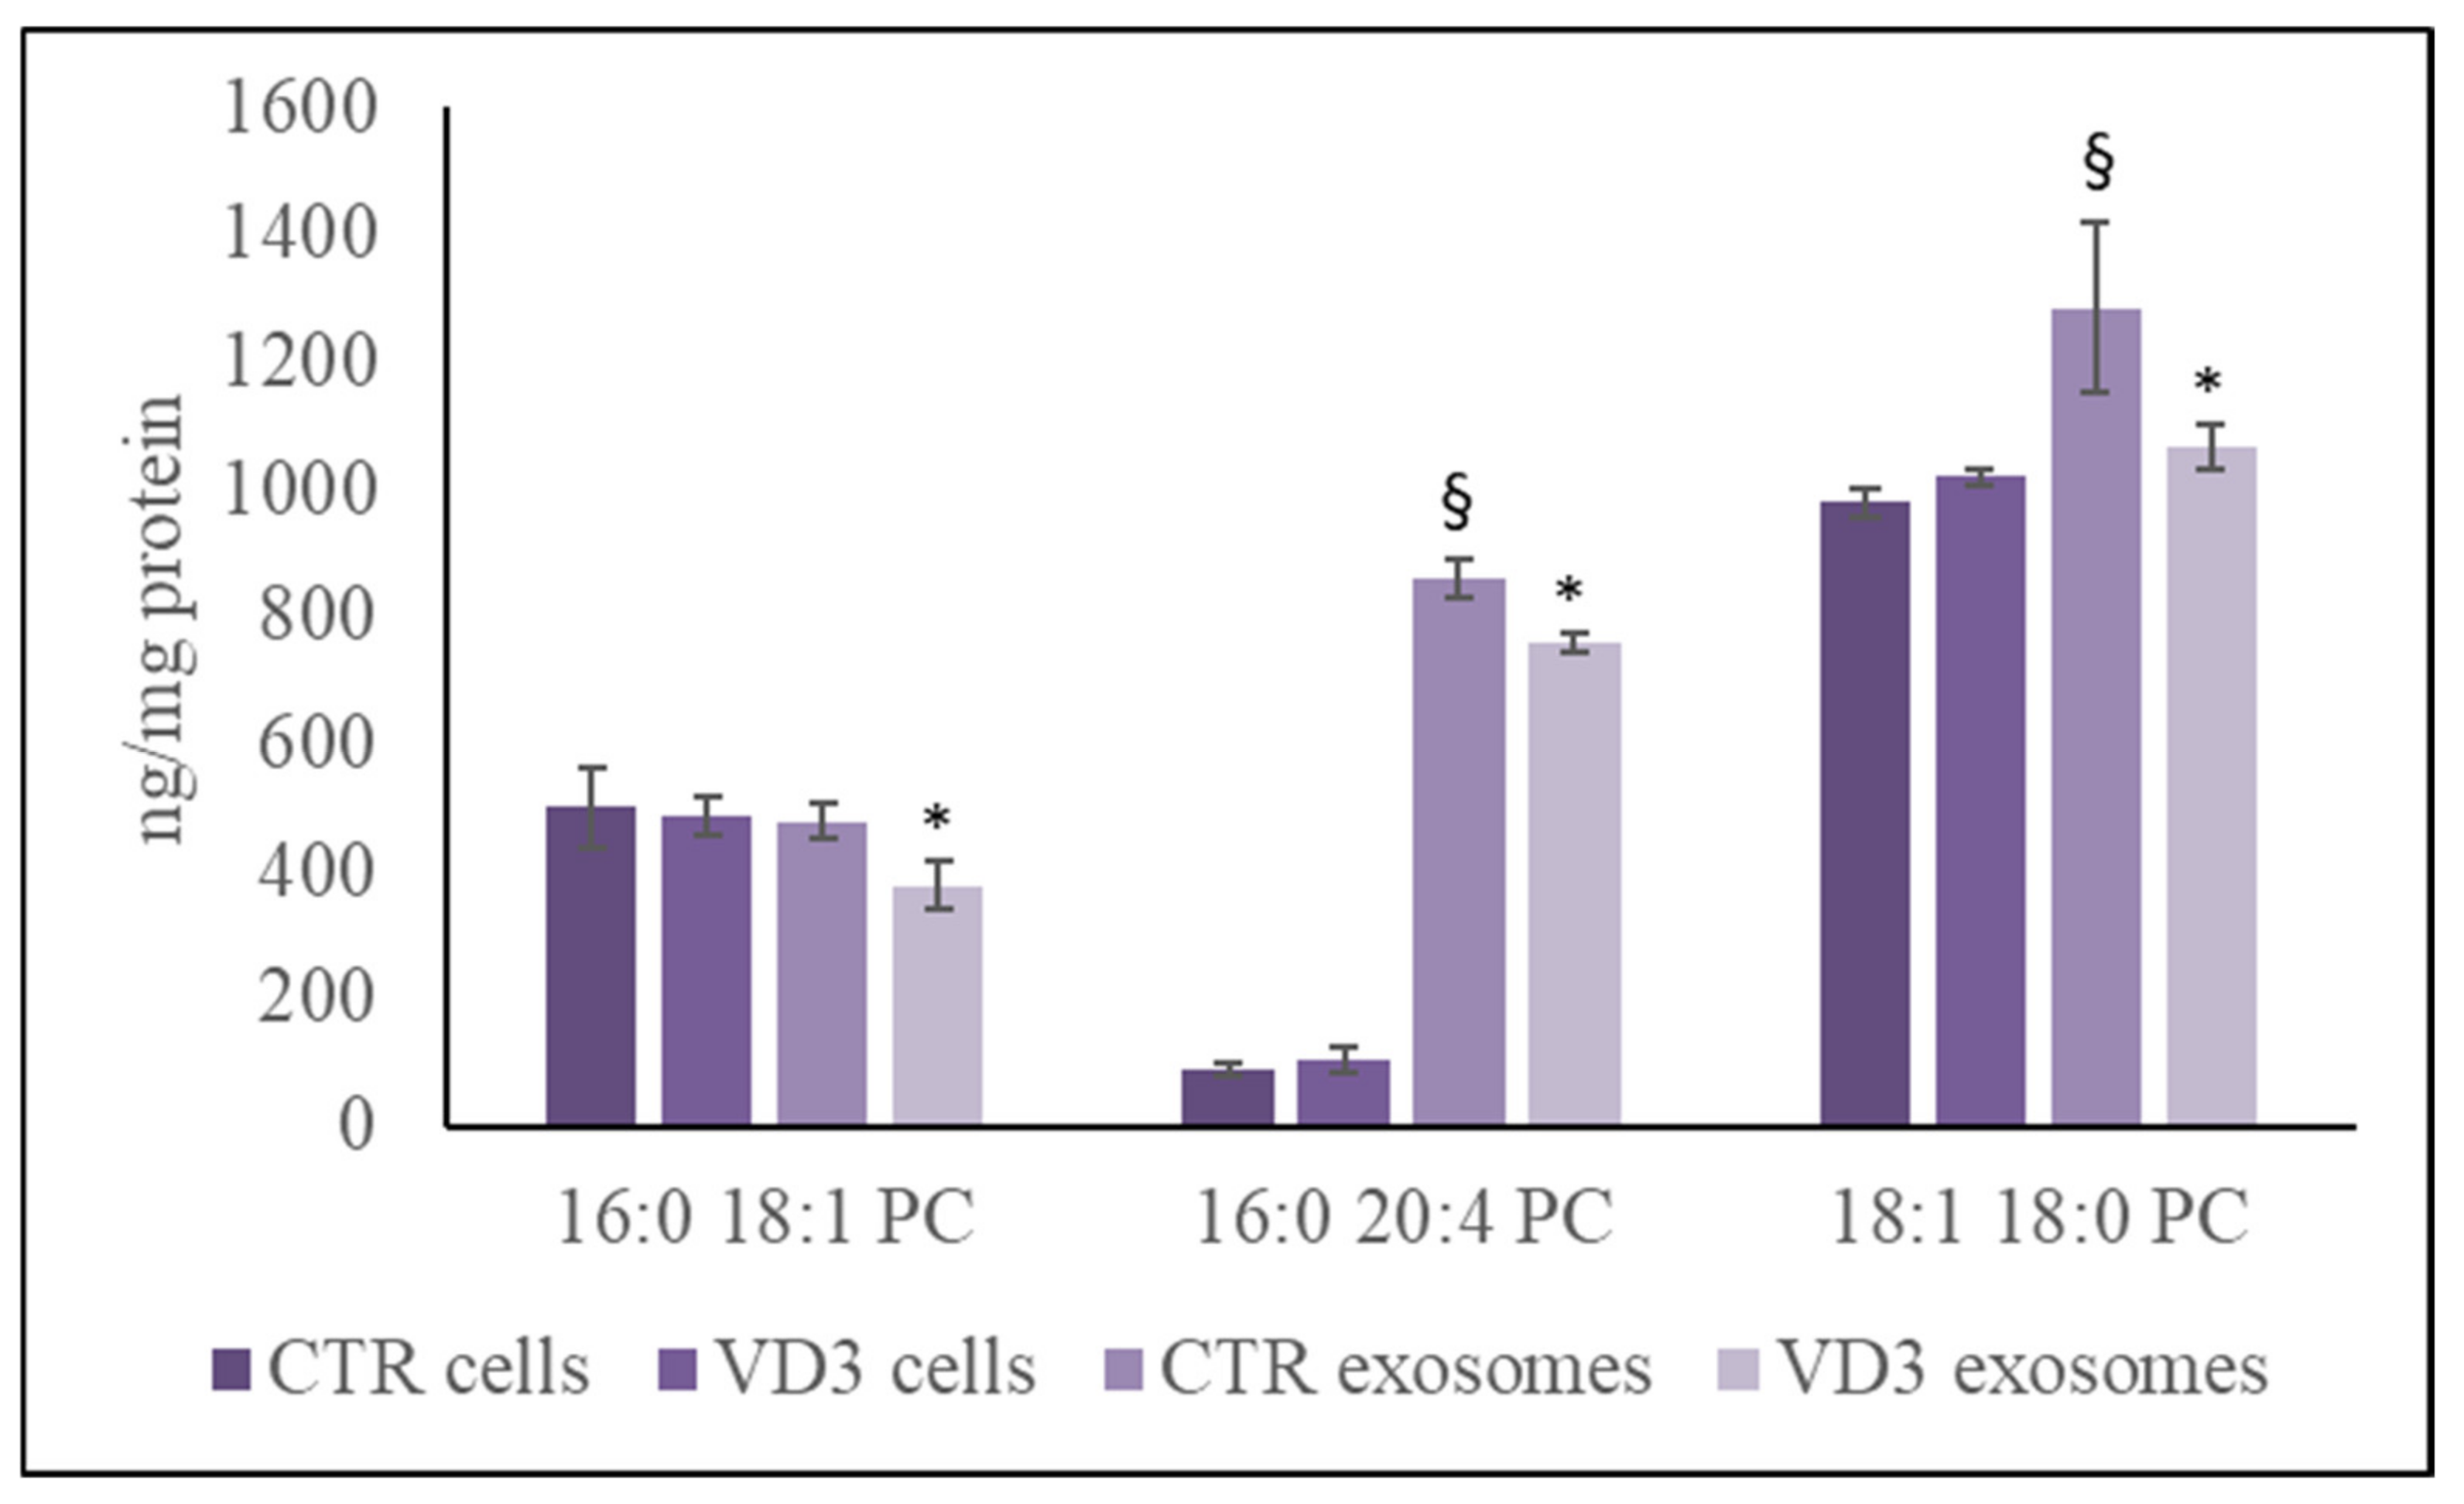
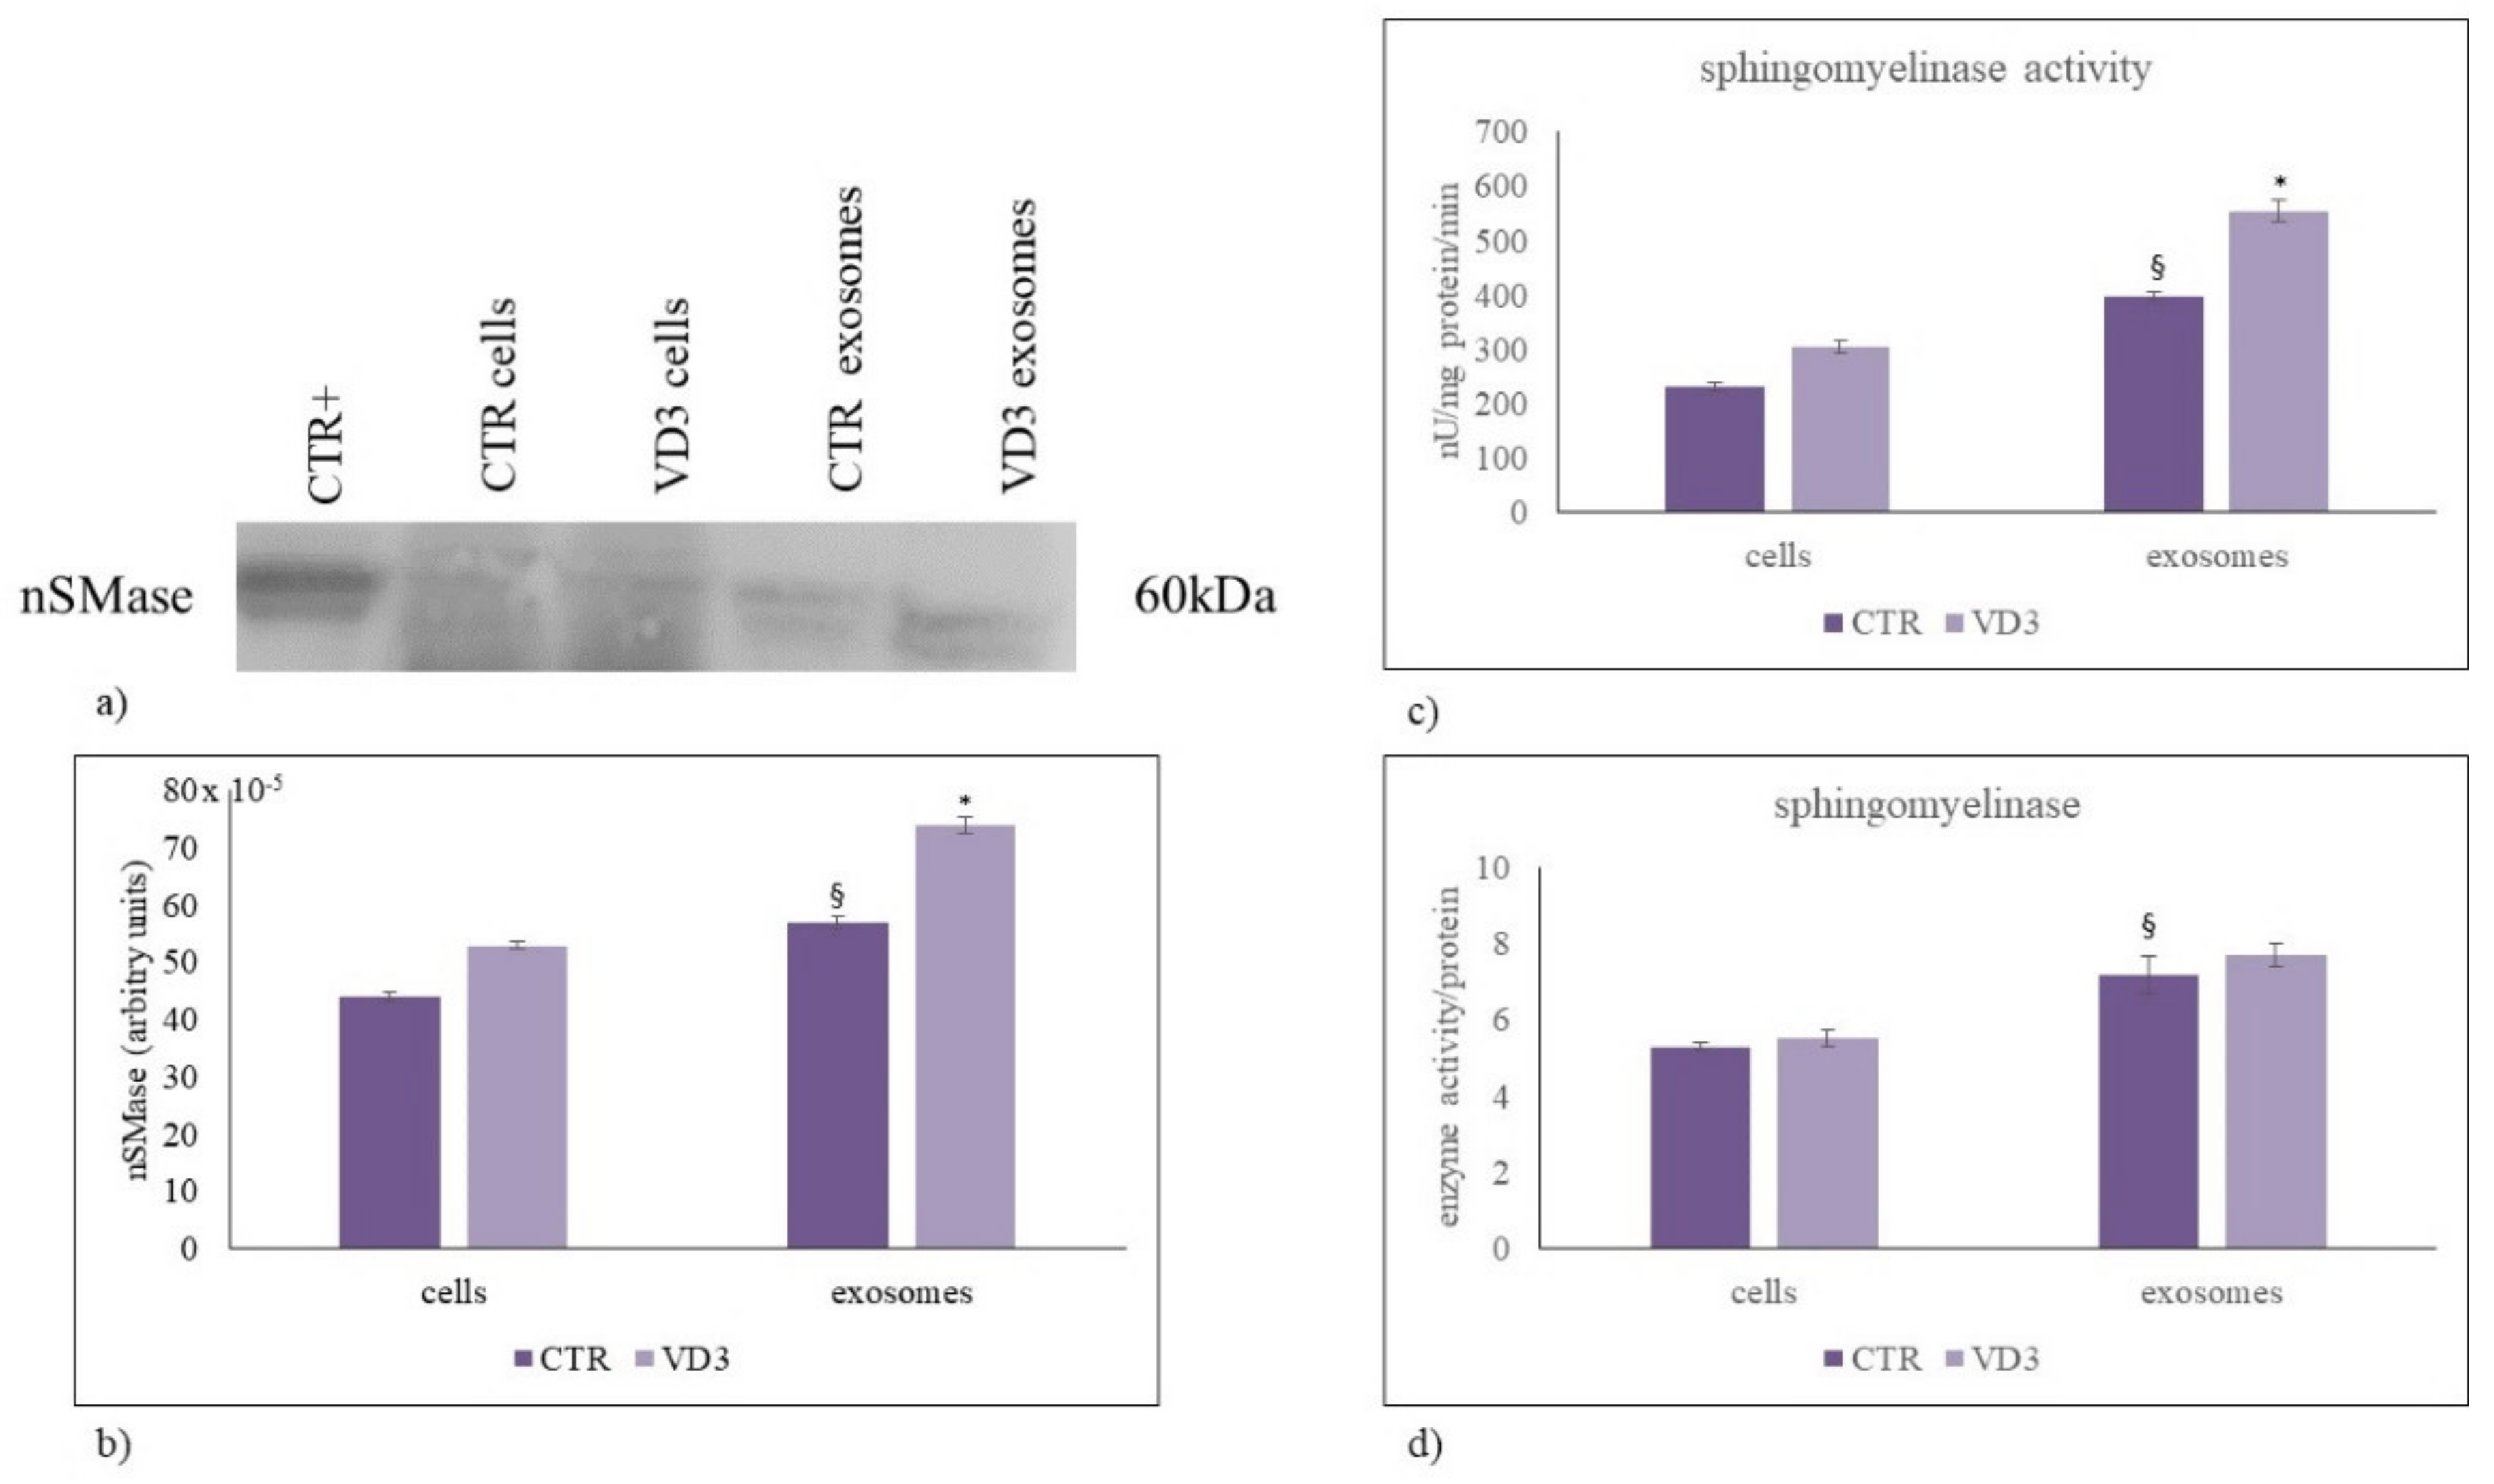
2.3. Regulation of Exosome Sphingolipid Pathway by VD3
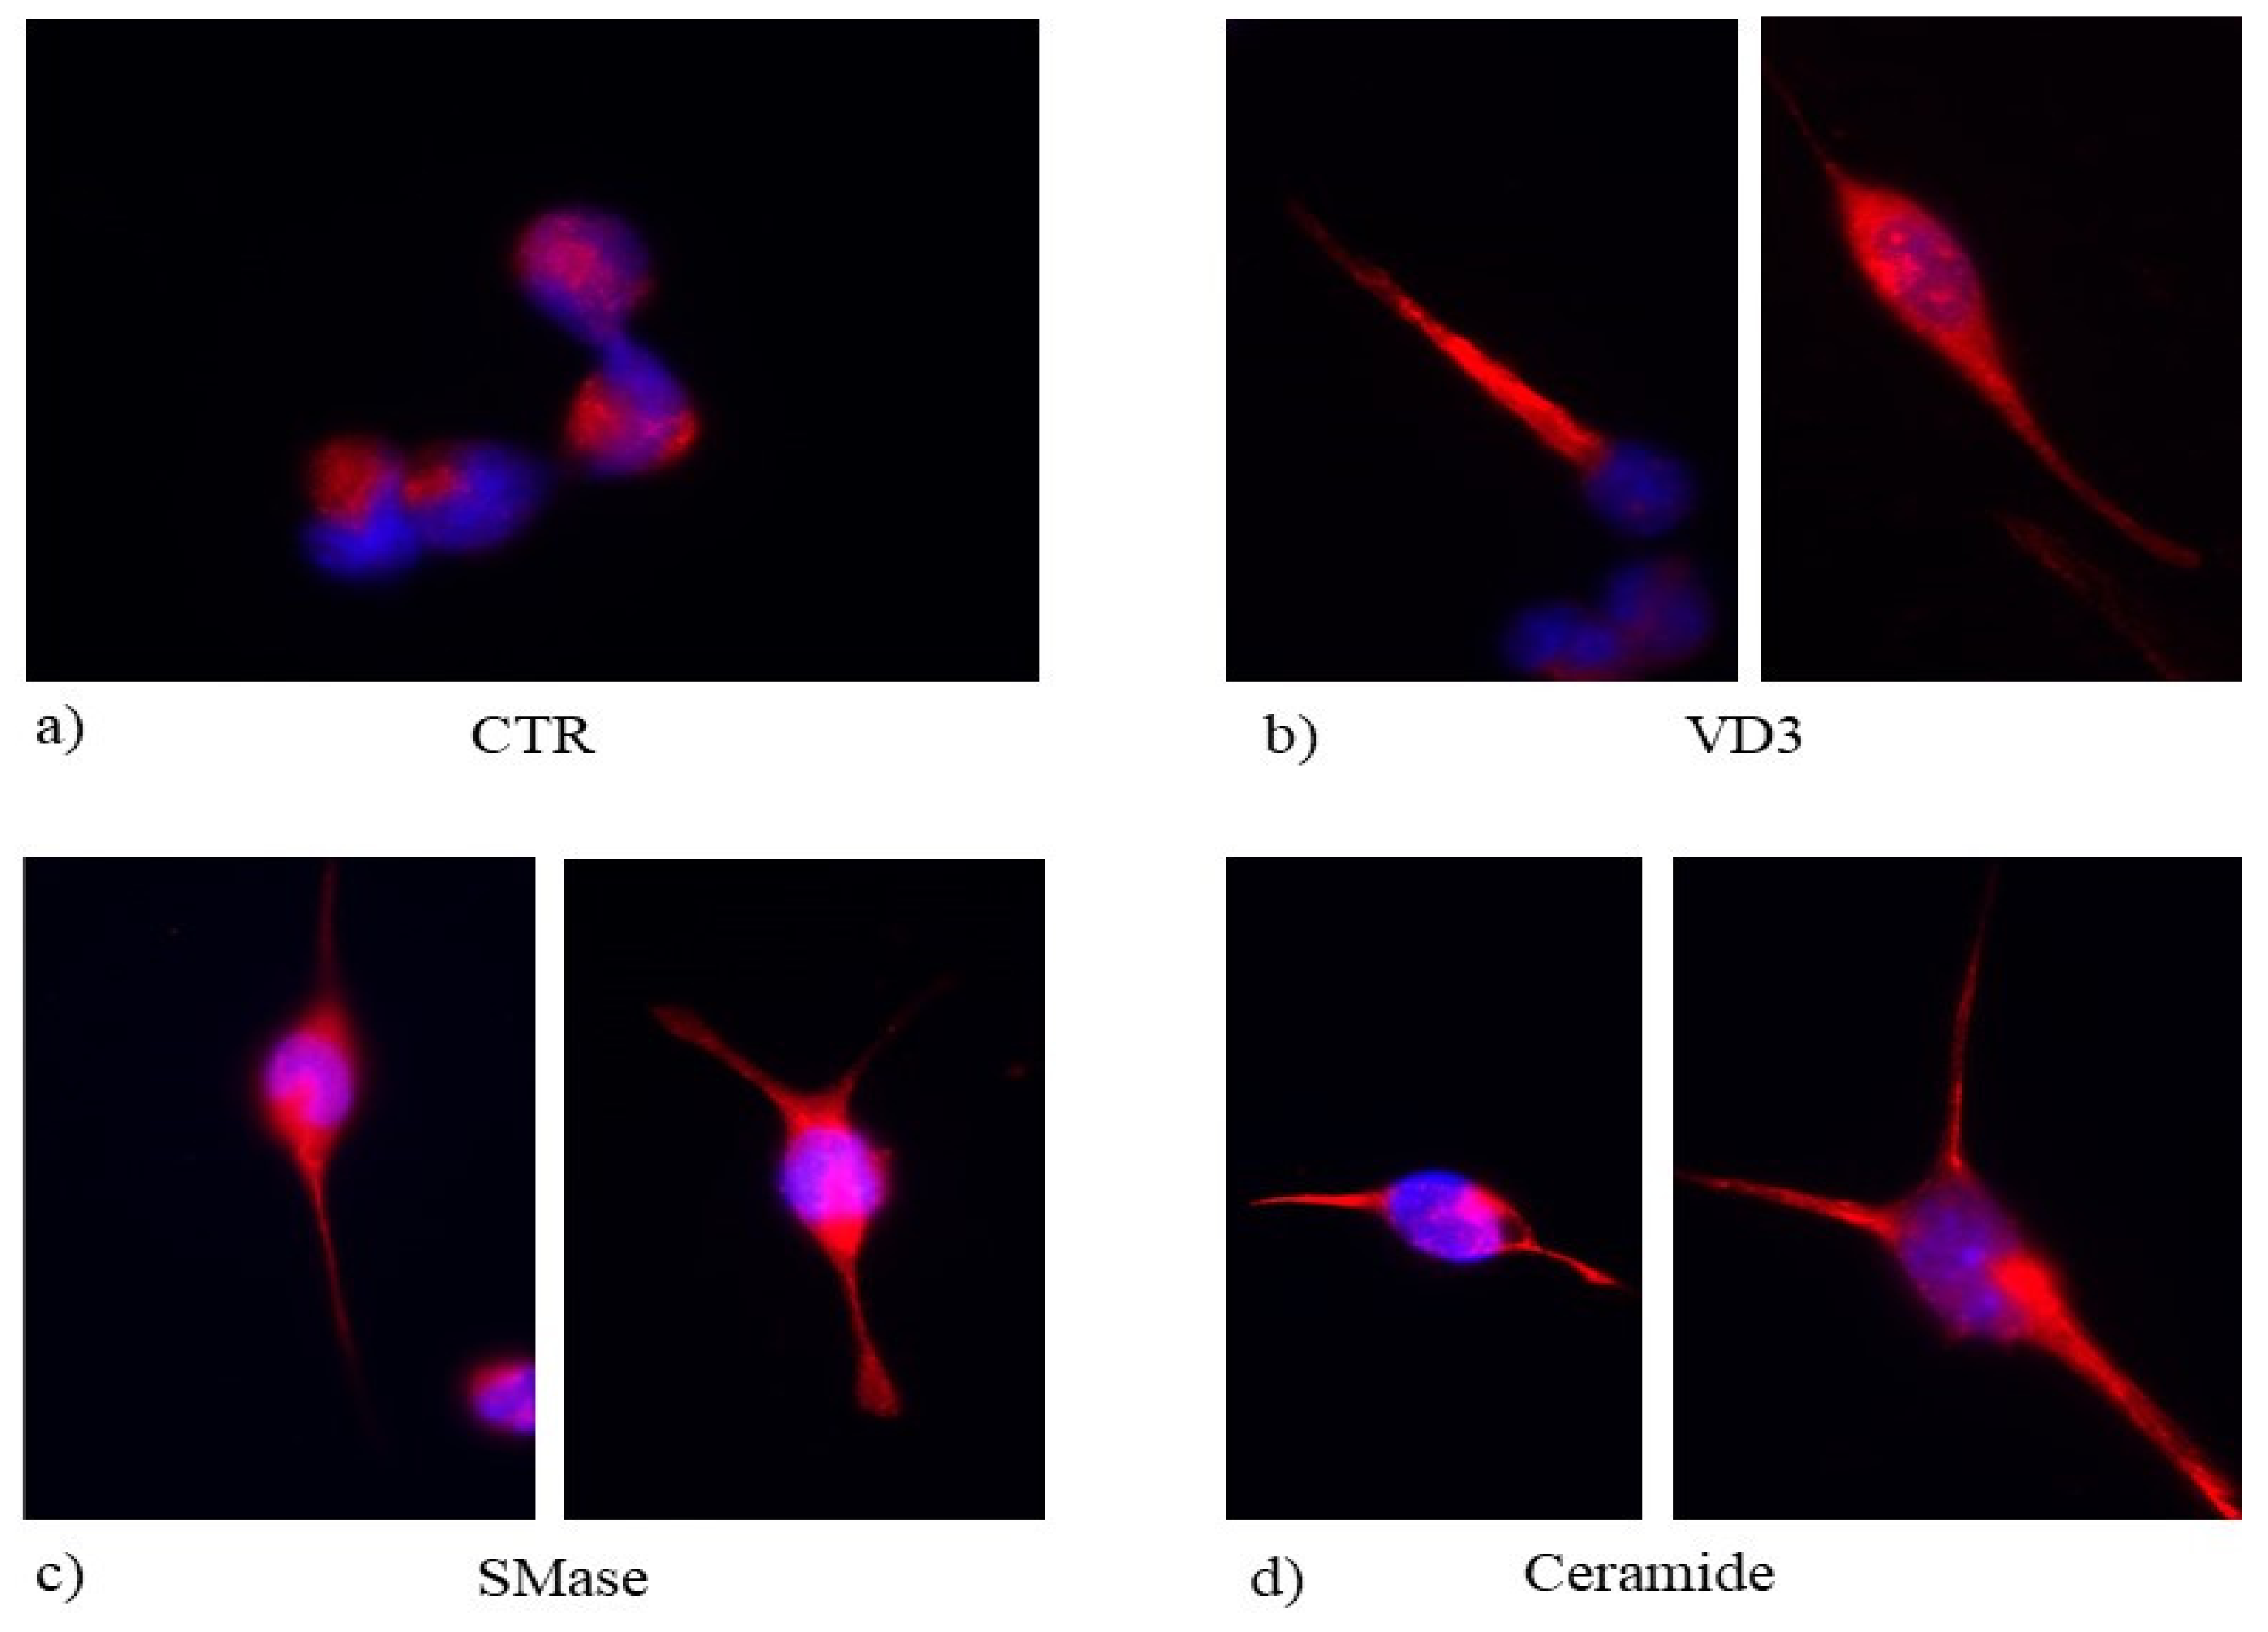
2.4. Effect of Ceramide on HN9.10 Cell Differentiation
3. Discussion
4. Materials and Methods
4.1. Reagents
4.2. Cell Culture and Treatments
4.3. Cell Viability
4.4. Trypan Blue Exclusion Assay
4.5. Exosome Isolation
4.6. Protein Content
4.7. Electrophoresis and Western Blot Analysis
4.8. Sphingomyelinase Activity Assay
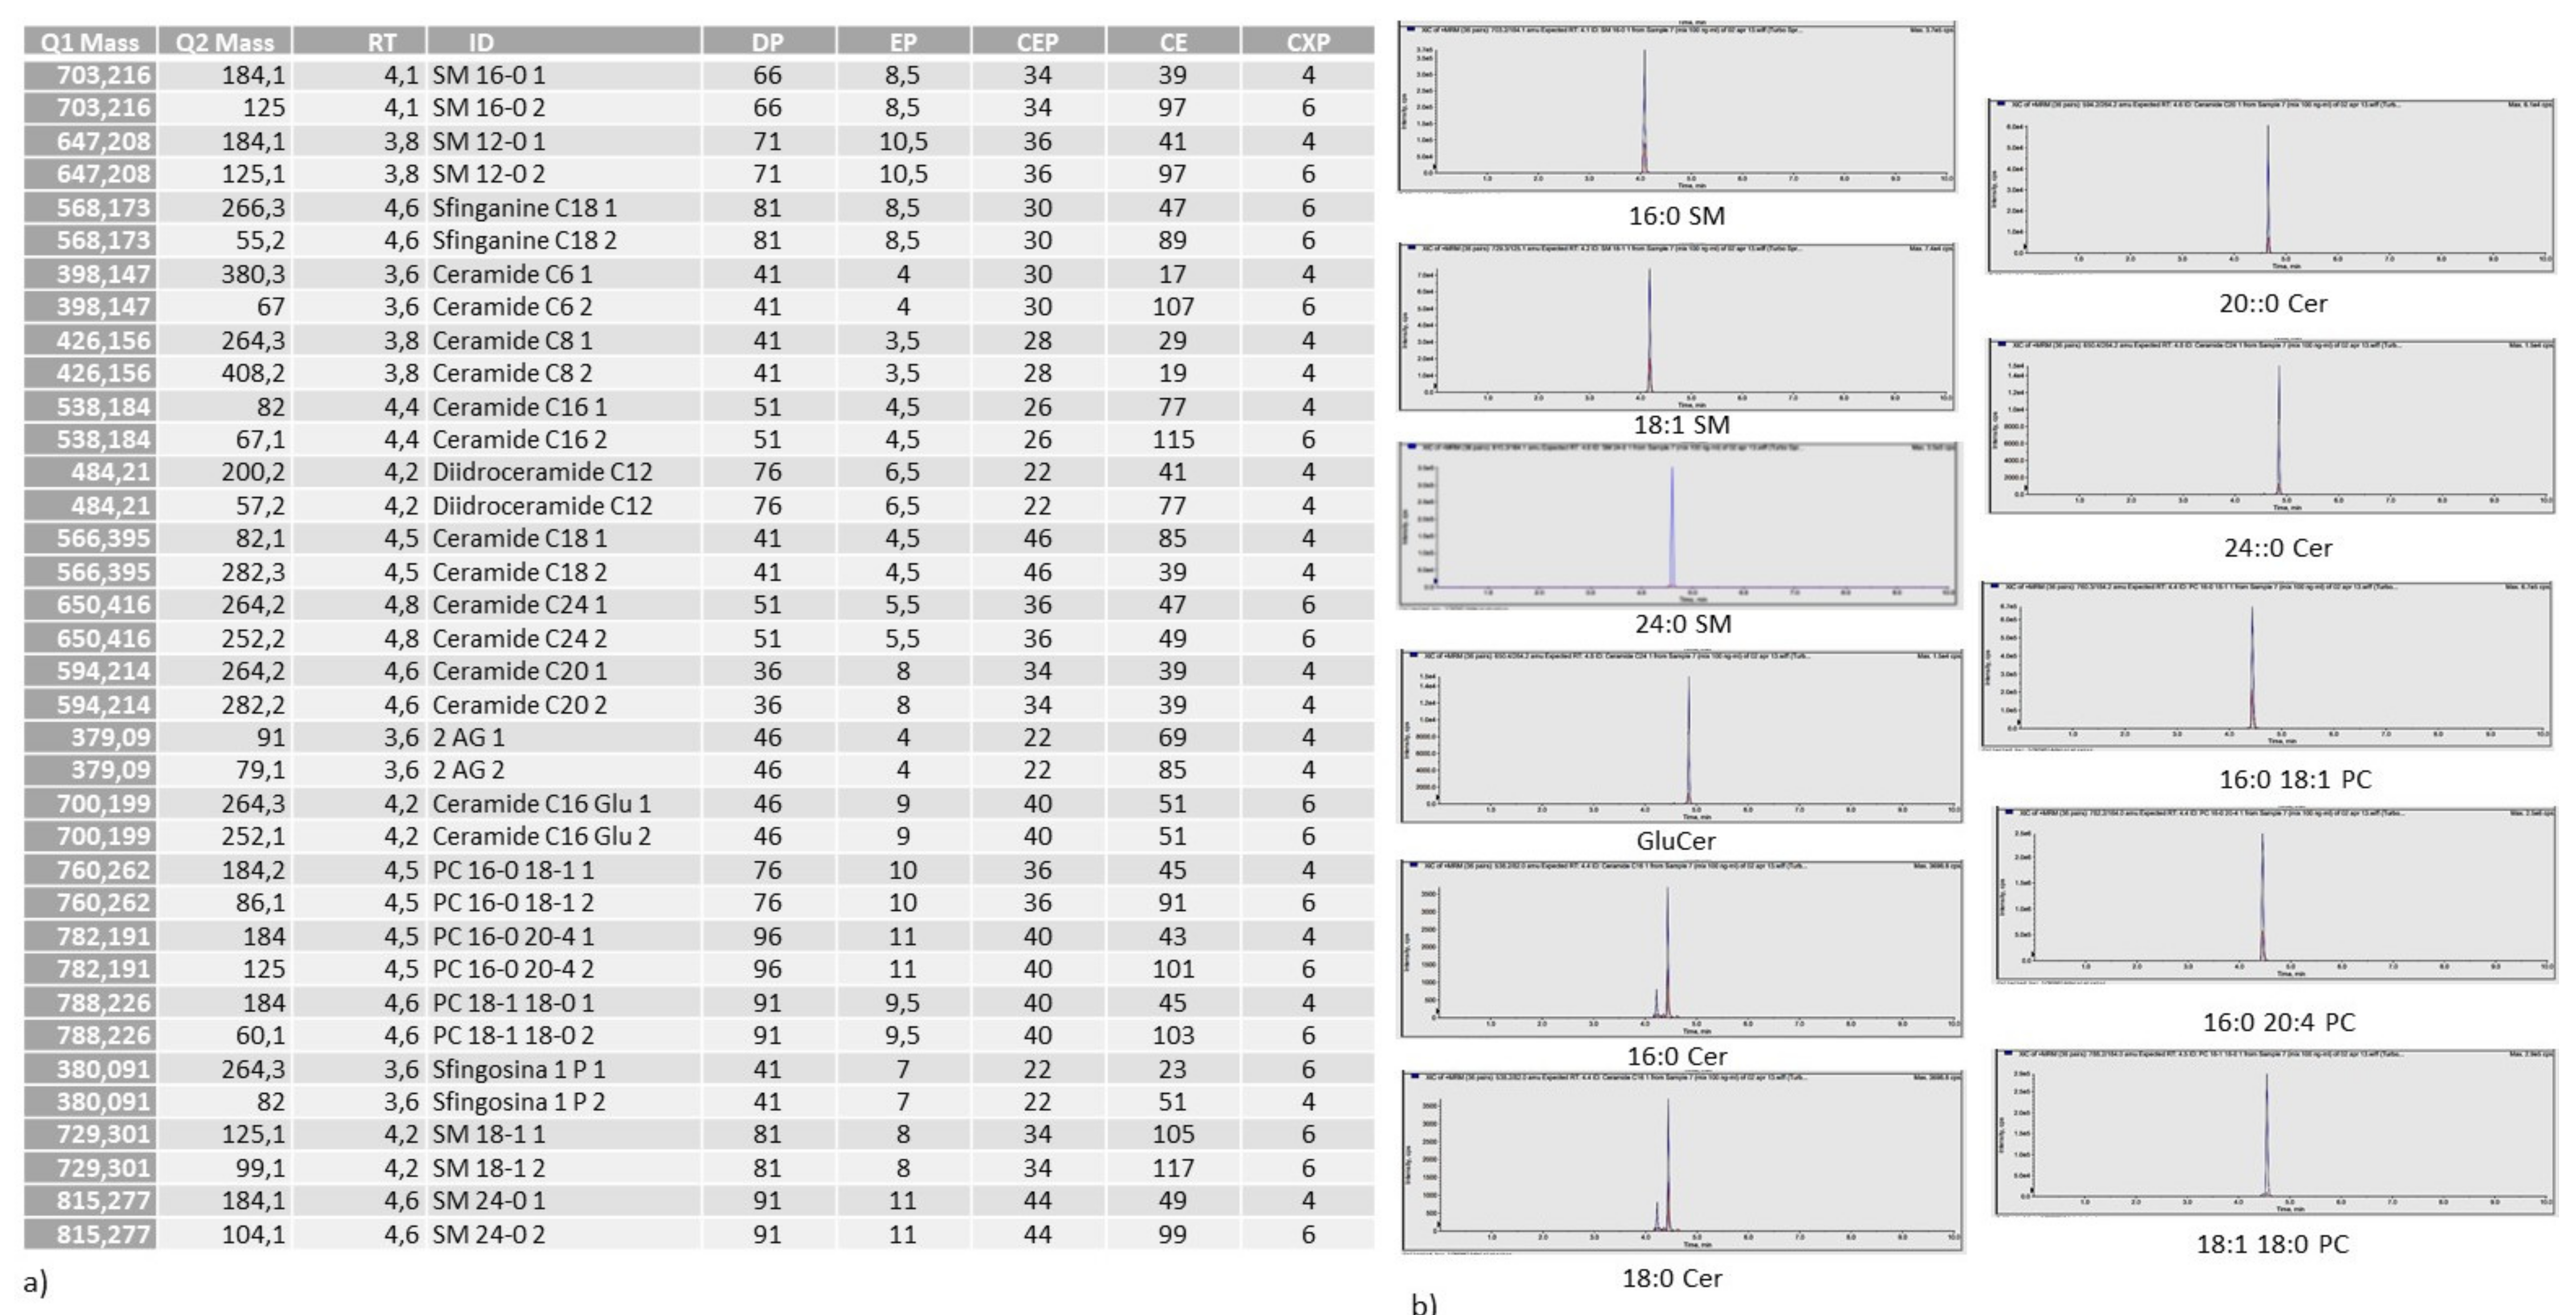
4.9. Ultrafast Liquid Chromatography–Tandem Mass Spectrometry
4.10. Immunofluorescence
4.11. Statistical Analysis
Author Contributions
Funding
Institutional Review Board Statement
Informed Consent Statement
Data Availability Statement
Conflicts of Interest
Abbreviations
References
- Gurunathan, S.; Kang, M.-H.; Jeyaraj, M.; Qasim, M.; Kim, J.-H. Review of the Isolation, Characterization, Biological Function, and Multifarious Therapeutic Approaches of Exosomes. Cells 2019, 8, 307. [Google Scholar] [CrossRef] [Green Version]
- Cocucci, E.; Meldolesi, J. Ectosomes and exosomes: Shedding the confusion between extracellular vesicles. Trends Cell Biol. 2015, 25, 364–372. [Google Scholar] [CrossRef]
- McMahon, H.T.; Boucrot, E. Membrane curvature at a glance. J. Cell Sci. 2015, 128, 1065–1070. [Google Scholar] [CrossRef] [PubMed] [Green Version]
- Simons, M.; Raposo, G. Exosomes—vesicular carriers for intercellular communication. Curr. Opin. Cell Biol. 2009, 21, 575–581. [Google Scholar] [CrossRef]
- Pegtel, D.M.; Gould, S.J. Exosomes. Annu. Rev. Biochem. 2019, 88, 487–514. [Google Scholar] [CrossRef] [PubMed]
- Raposo, G.; Stoorvogel, W. Extracellular vesicles: Exosomes, microvesicles, and friends. J. Cell Biol. 2013, 200, 373–383. [Google Scholar] [CrossRef] [PubMed] [Green Version]
- Properzi, F.; Logozzi, M.; Fais, S. Exosomes: The future of biomarkers in medicine. Biomarkers Med. 2013, 7, 769–778. [Google Scholar] [CrossRef]
- Bruns, H.; Böttcher, M.; Qorraj, M.; Fabri, M.; Jitschin, S.; Dindorf, J.; Busch, L.; Mackensen, A.; Mougiakakos, D. CLL-cell-mediated MDSC induction by exosomal miR-155 transfer is disrupted by vitamin D. Leukemia 2016, 31, 985–988. [Google Scholar] [CrossRef] [PubMed]
- Martinez-Bravo, M.-J.; Wahlund, C.J.; Qazi, K.R.; Moulder, R.; Lukic, A.; Rådmark, O.; Lahesmaa, R.; Grunewald, J.; Eklund, A.; Gabrielsson, S. Pulmonary sarcoidosis is associated with exosomal vitamin D–binding protein and inflammatory molecules. J. Allergy Clin. Immunol. 2017, 139, 1186–1194. [Google Scholar] [CrossRef] [PubMed] [Green Version]
- Han, J.-S.; Kim, S.; Jin, J.-Q.; Park, N.; Lee, J.-Y.; Kim, H.; Lee, S.-B.; Yang, S.-W.; Lim, D.-J. Tear-Derived Exosome Proteins Are Increased in Patients with Thyroid Eye Disease. Int. J. Mol. Sci. 2021, 22, 1115. [Google Scholar] [CrossRef]
- Bonica, J.; Mao, C.; Obeid, L.; Hannun, Y. Transcriptional Regulation of Sphingosine Kinase 1. Cells 2020, 9, 2437. [Google Scholar] [CrossRef]
- Garcia-Gil, M.; Pierucci, F.; Vestri, A.; Meacci, E. Crosstalk between sphingolipids and vitamin D3: Potential role in the nervous system. Br. J. Pharmacol. 2017, 174, 605–627. [Google Scholar] [CrossRef]
- Kelly, R.S.; Chawes, B.L.; Guo, F.; Zhang, L.; Blighe, K.; Litonjua, A.A.; Raby, B.A.; Levy, B.D.; Rago, D.; Stokholm, J.; et al. The role of the 17q21 genotype in the prevention of early childhood asthma and recurrent wheeze by vitamin D. Eur. Respir. J. 2019, 54, 1900761. [Google Scholar] [CrossRef]
- Chen, L.; Dong, Y.; Bhagatwala, J.; Raed, A.; Huang, Y.; Zhu, H. Vitamin D3 Supplementation Increases Long-Chain Ceramide Levels in Overweight/Obese African Americans: A Post-Hoc Analysis of a Randomized Controlled Trial. Nutrients 2020, 12, 981. [Google Scholar] [CrossRef] [Green Version]
- Nejatian, N.; Trautmann, S.; Thomas, M.; Pfeilschifter, J.; Badenhoop, K.; Koch, A.; Penna-Martinez, M. Vitamin D effects on sphingosine 1-phosphate signaling and metabolism in monocytes from type 2 diabetes patients and controls. J. Steroid Biochem. Mol. Biol. 2018, 186, 130–135. [Google Scholar] [CrossRef] [PubMed]
- Bartoccini, E.; Marini, F.; Damaskopoulou, E.; Lazzarini, R.; Cataldi, S.; Cascianelli, G.; Gil Garcia, M.; Albi, E. Nuclear lipid microdomains regulate nuclear vitamin D3 uptake and influence embryonic hippocampal cell differentiation. Mol. Biol. Cell 2011, 22, 3022–3031. [Google Scholar] [CrossRef] [PubMed]
- Albi, E.; Cataldi, S.; Ceccarini, M.R.; Conte, C.; Ferri, I.; Fettucciari, K.; Patria, F.F.; Beccari, T.; Codini, M. Gentamicin Targets Acid Sphingomyelinase in Cancer: The Case of the Human Gastric Cancer NCI-N87 Cells. Int. J.Mol. Sci. 2019, 20, 4375. [Google Scholar] [CrossRef] [PubMed] [Green Version]
- Marini, F.; Bartoccini, E.; Cascianelli, G.; Voccoli, V.; Baviglia, M.G.; Magni, M.V.; Garcia-Gil, M.; Albi, E. Effect of 1α,25-dihydroxyvitamin D3 in embryonic hippocampal cells. Hippocampus 2009, 20, 696–705. [Google Scholar] [CrossRef] [PubMed]
- Patria, F.F.; Ceccarini, M.R.; Codini, M.; Conte, C.; Perioli, L.; Beccari, T.; Albi, E. A Role for Neutral Sphingomyelinase in Wound Healing Induced by Keratinocyte Proliferation upon 1α, 25-Dihydroxyvitamin D3 Treatment. Int. J. Mol. Sci. 2019, 20, 3634. [Google Scholar] [CrossRef] [Green Version]
- Lai, Y.-H.; Fang, T.-C. The Pleiotropic Effect of Vitamin D. ISRN Nephrol. 2013, 2013, 1–6. [Google Scholar] [CrossRef] [PubMed]
- Yepes-Nuñez, J.J.; Brożek, J.L.; Fiocchi, A.; Pawankar, R.; Cuello-Garcia, C.; Zhang, Y.; Morgano, G.P.; Agarwal, A.; Gandhi, S.; Terracciano, L.; et al. Vitamin D supplementation in primary allergy prevention: Systematic review of randomized and non-randomized studies. Allergy 2018, 73, 37–49. [Google Scholar] [CrossRef] [PubMed] [Green Version]
- Morello, M.; Pieri, M.; Zenobi, R.; Talamo, A.; Stephan, D.; Landel, V.; Féron, F.; Millet, P. The Influence of Vitamin D on Neurodegeneration and Neurological Disorders: A Rationale for its Physio-pathological Actions. Curr. Pharm. Des. 2020, 26, 2475–2491. [Google Scholar] [CrossRef] [PubMed]
- Wang, G.; Spassieva, S.D.; Bieberich, E. Ceramide and S1P Signaling in Embryonic Stem Cell Differentiation. Methods Mol. Biol. 2017, 1697, 153–171. [Google Scholar] [CrossRef] [Green Version]
- Toman, R.E.; Spiegel, S.; Faden, A.I. Role of Ceramide in Neuronal Cell Death and Differentiation. J. Neurotrauma 2000, 17, 891–898. [Google Scholar] [CrossRef] [PubMed]
- Ceccarini, M.R.; Codini, M.; Cataldi, S.; Vannini, S.; Lazzarini, A.; Floridi, A.; Moretti, M.; Villarini, M.; Fioretti, B.; Beccari, T.; et al. Acid sphingomyelinase as target of Lycium Chinense: Promising new action for cell health. Lipids Health Dis. 2016, 15, 1–10. [Google Scholar] [CrossRef] [PubMed] [Green Version]
- Lazzarini, A.; Floridi, A.; Pugliese, L.; Villani, M.; Cataldi, S.; Codini, M.; Lazzarini, R.; Beccari, T.; Ambesi-Impiombat, F.S.; Curcio, F.; et al. Analysis of Serum Sphingomyelin Species by Uflc-Ms/Ms in Patients Affected with Monoclonal Gammopathy. J. Chromatogr. Sep. Tech. 2014, 5, 1000239. [Google Scholar] [CrossRef] [Green Version]
- Lazzarini, A.; Macchiarulo, A.; Floridi, A.; Coletti, A.; Cataldi, S.; Codini, M.; Lazzarini, R.; Bartoccini, E.; Cascianelli, G.; Ambesi-Impiombato, F.S.; et al. Very-long-chain fatty acid sphingomyelin in nuclear lipid microdomains of hepatocytes and hepatoma cells: Can the exchange from C24:0 to C16:0 affect signal proteins and vitamin D receptor? Mol. Biol. Cell 2015, 26, 2418–2425. [Google Scholar] [CrossRef] [PubMed]
- Matyash, V.; Liebisch, G.; Kurzchalia, T.V.; Shevchenko, A.; Schwudke, D. Lipid extraction by methyl-tert-butyl ether for high-throughput lipidomics. J. Lipid Res. 2008, 49, 1137–1146. [Google Scholar] [CrossRef] [Green Version]
- Garcia-Gil, M.; Lazzarini, A.; Lazzarini, R.; Floridi, E.; Cataldi, S.; Floridi, A.; Albi, E. Serum deprivation alters lipid profile in HN9.10e embryonic hippocampal cells. Neurosci. Lett. 2015, 589, 83–87. [Google Scholar] [CrossRef]
- Rabagny, Y.; Herrmann, W.; Geisel, J.; Kirsch, S.H.; Obeid, R. Quantification of plasma phospholipids by ultra performance liquid chromatography tandem mass spectrometry. Anal. Bioanal. Chem. 2011, 401, 891–899. [Google Scholar] [CrossRef]
- Cataldi, S.; Arcuri, C.; Hunot, S.; Mecca, C.; Codini, M.; Laurenti, M.E.; Ferri, I.; Loreti, E.; Garcia-Gil, M.; Traina, G.; et al. Effect of Vitamin D in HN9.10e Embryonic Hippocampal Cells and in Hippocampus from MPTP-Induced Parkinson’s Disease Mouse Model. Front. Cell. Neurosci. 2018, 12, 31. [Google Scholar] [CrossRef] [PubMed] [Green Version]


Publisher’s Note: MDPI stays neutral with regard to jurisdictional claims in published maps and institutional affiliations. |
© 2021 by the authors. Licensee MDPI, Basel, Switzerland. This article is an open access article distributed under the terms and conditions of the Creative Commons Attribution (CC BY) license (https://creativecommons.org/licenses/by/4.0/).
Share and Cite
Conte, C.; Cataldi, S.; Arcuri, C.; Mirarchi, A.; Lazzarini, A.; Garcia-Gil, M.; Beccari, T.; Curcio, F.; Albi, E. Vitamin D3 Enriches Ceramide Content in Exosomes Released by Embryonic Hippocampal Cells. Int. J. Mol. Sci. 2021, 22, 9287. https://doi.org/10.3390/ijms22179287
Conte C, Cataldi S, Arcuri C, Mirarchi A, Lazzarini A, Garcia-Gil M, Beccari T, Curcio F, Albi E. Vitamin D3 Enriches Ceramide Content in Exosomes Released by Embryonic Hippocampal Cells. International Journal of Molecular Sciences. 2021; 22(17):9287. https://doi.org/10.3390/ijms22179287
Chicago/Turabian StyleConte, Carmela, Samuela Cataldi, Cataldo Arcuri, Alessandra Mirarchi, Andrea Lazzarini, Mercedes Garcia-Gil, Tommaso Beccari, Francesco Curcio, and Elisabetta Albi. 2021. "Vitamin D3 Enriches Ceramide Content in Exosomes Released by Embryonic Hippocampal Cells" International Journal of Molecular Sciences 22, no. 17: 9287. https://doi.org/10.3390/ijms22179287