
Behavioural Fever Promotes an Inflammatory Reflex Circuit in Ectotherms

 , , , and
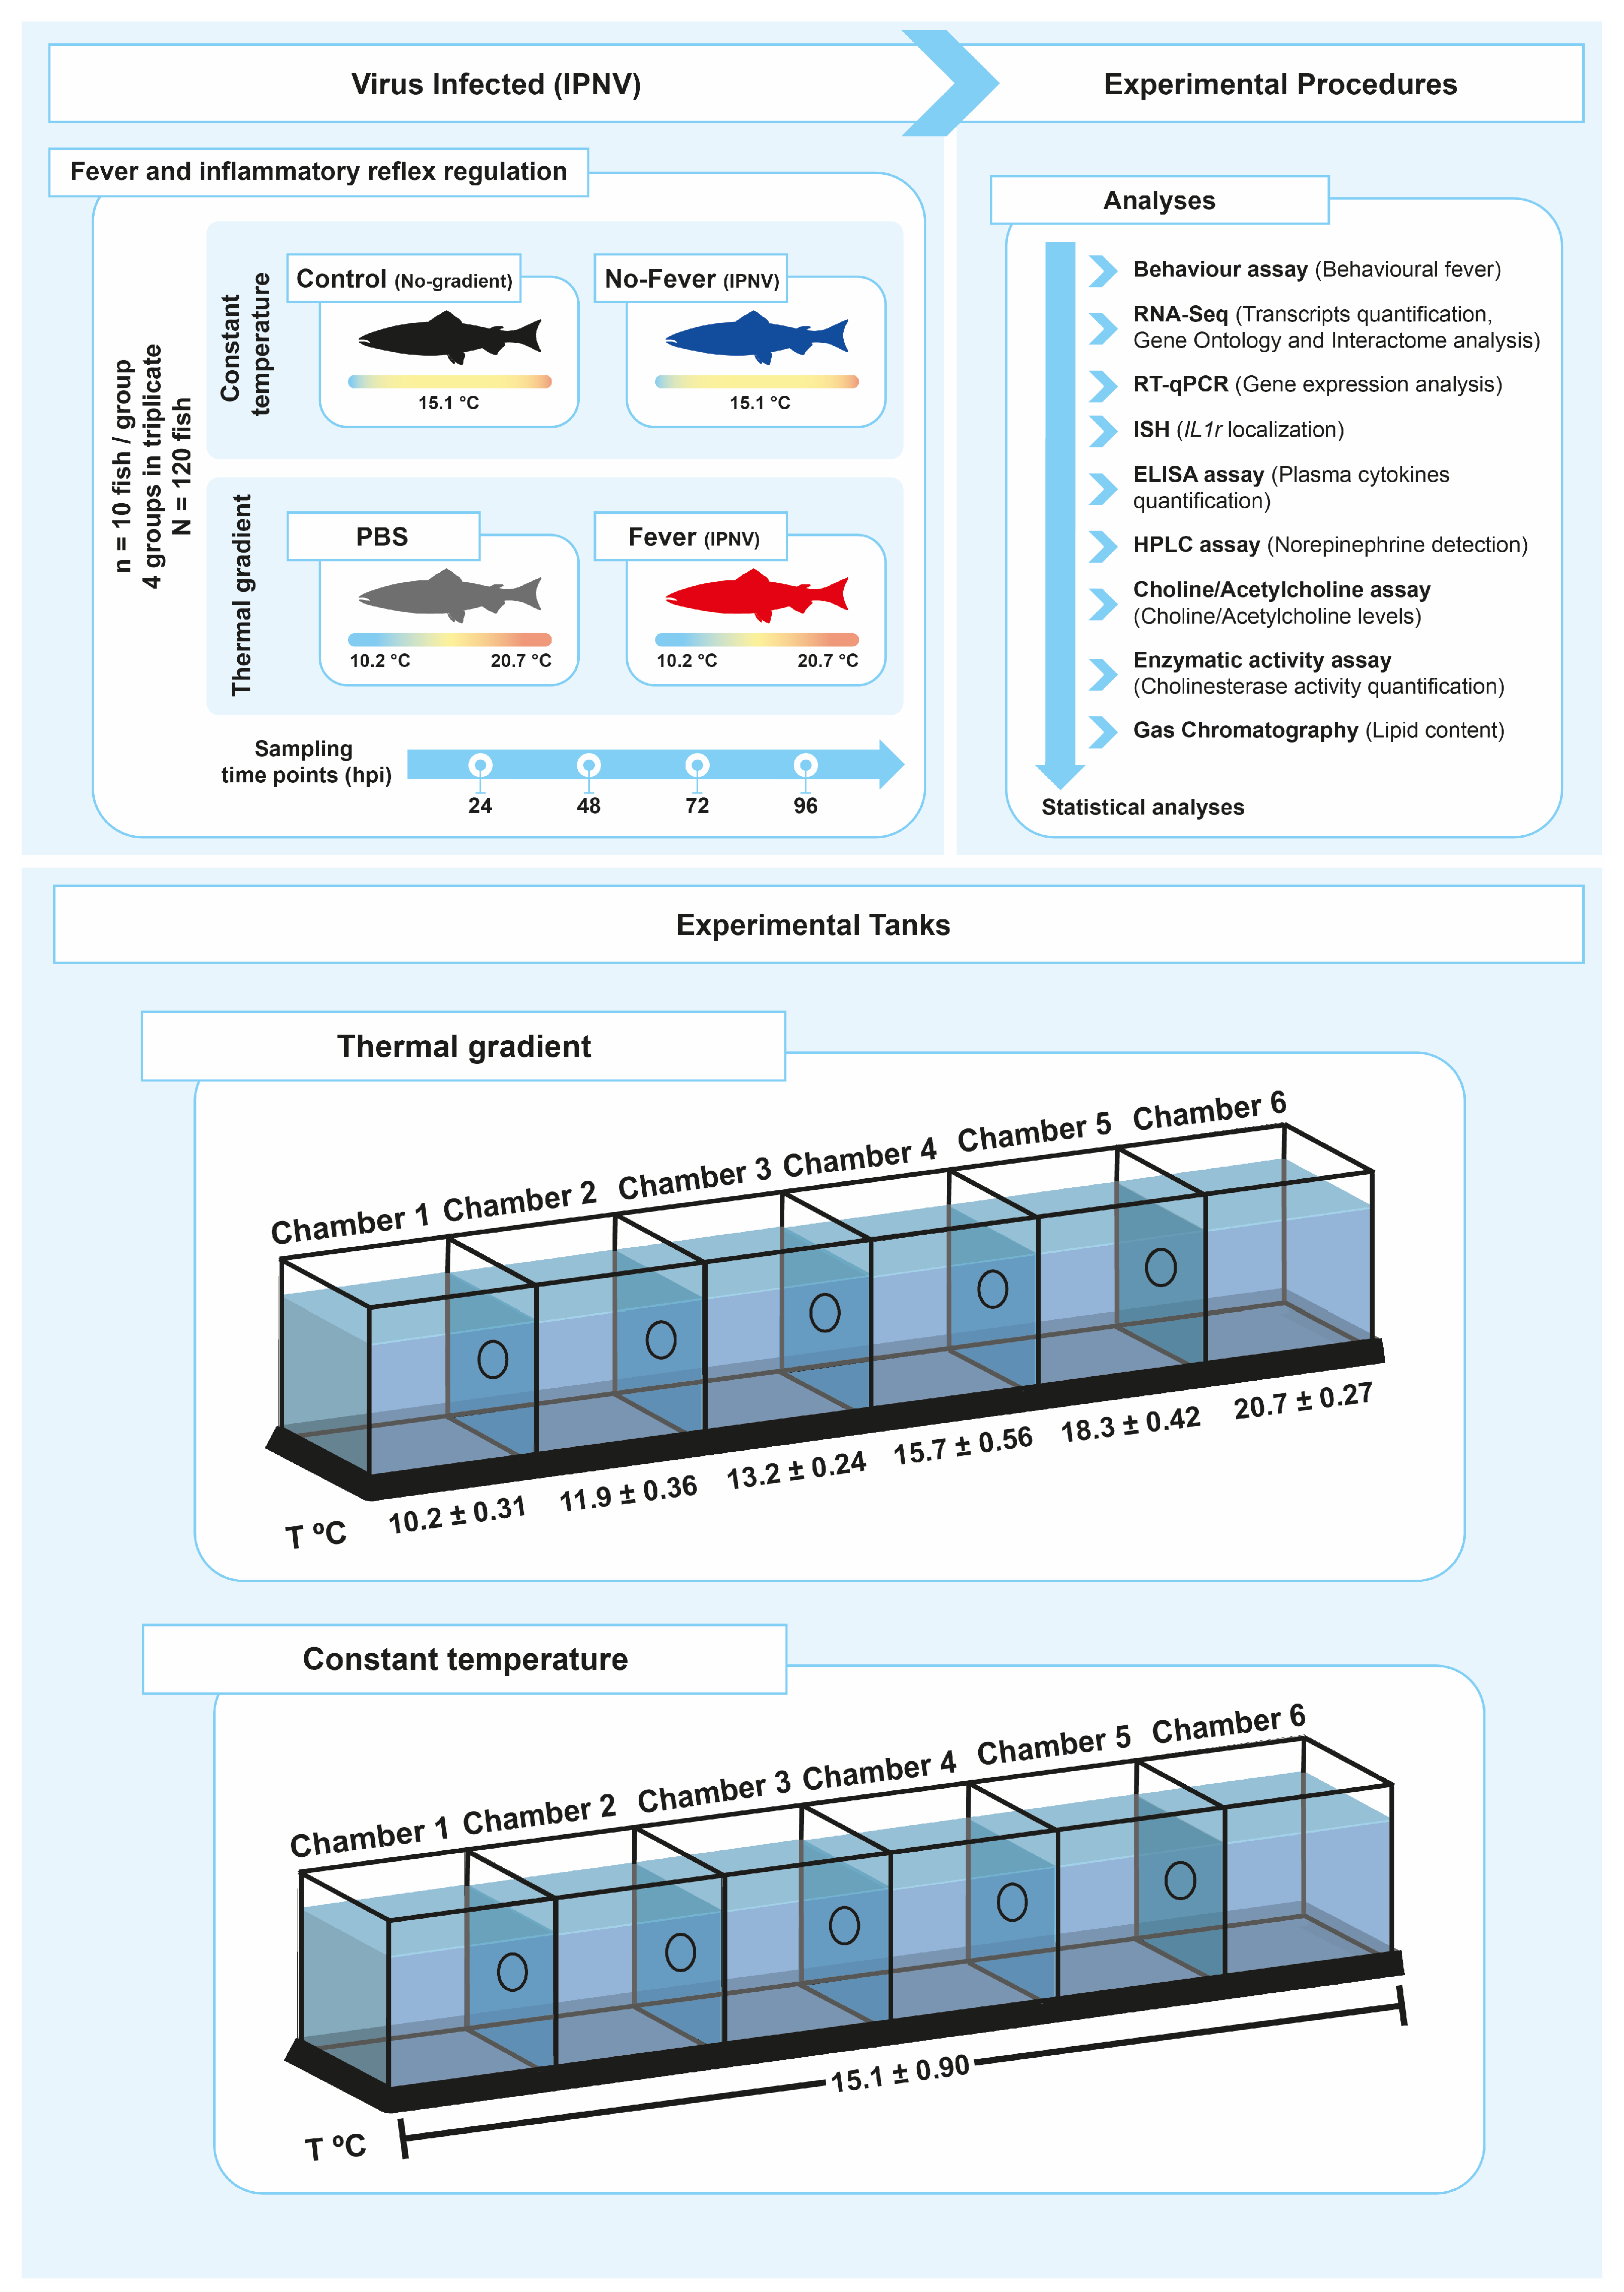
Abstract
:1. Background
2. Results
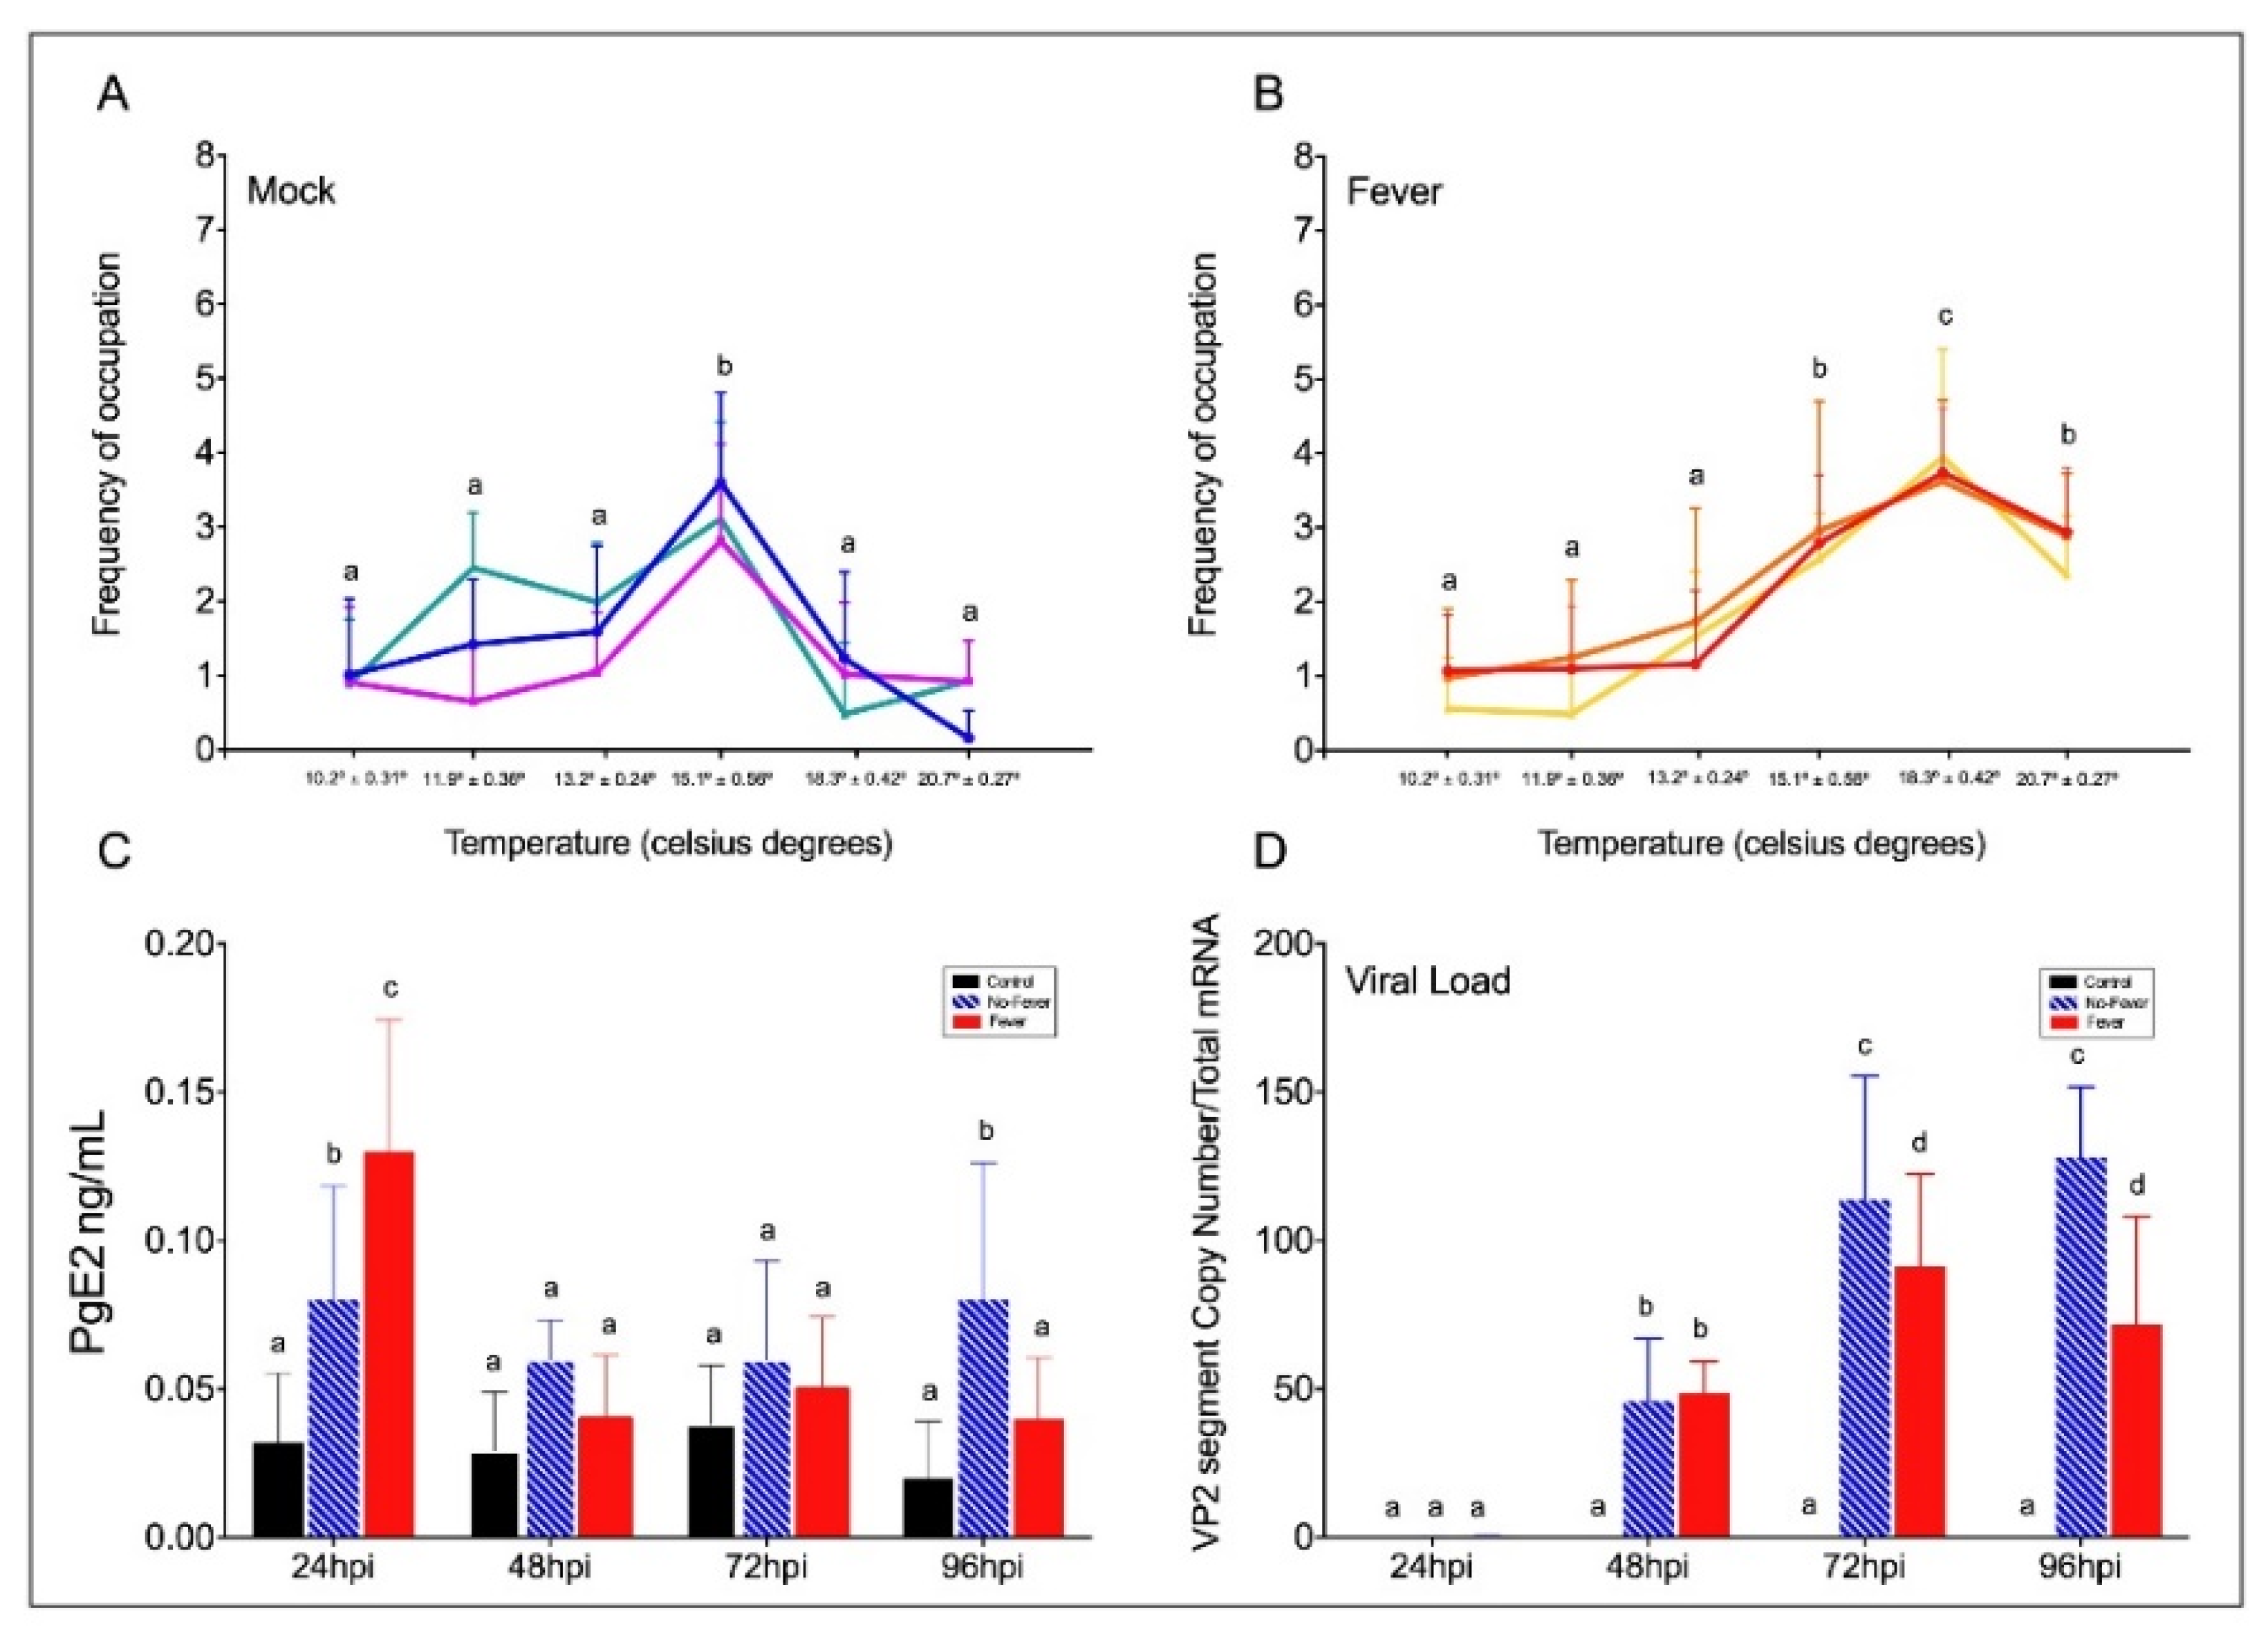
2.1. Viral Infection Influences a Behavioural Fever Mechanism in Mobile Ectotherms
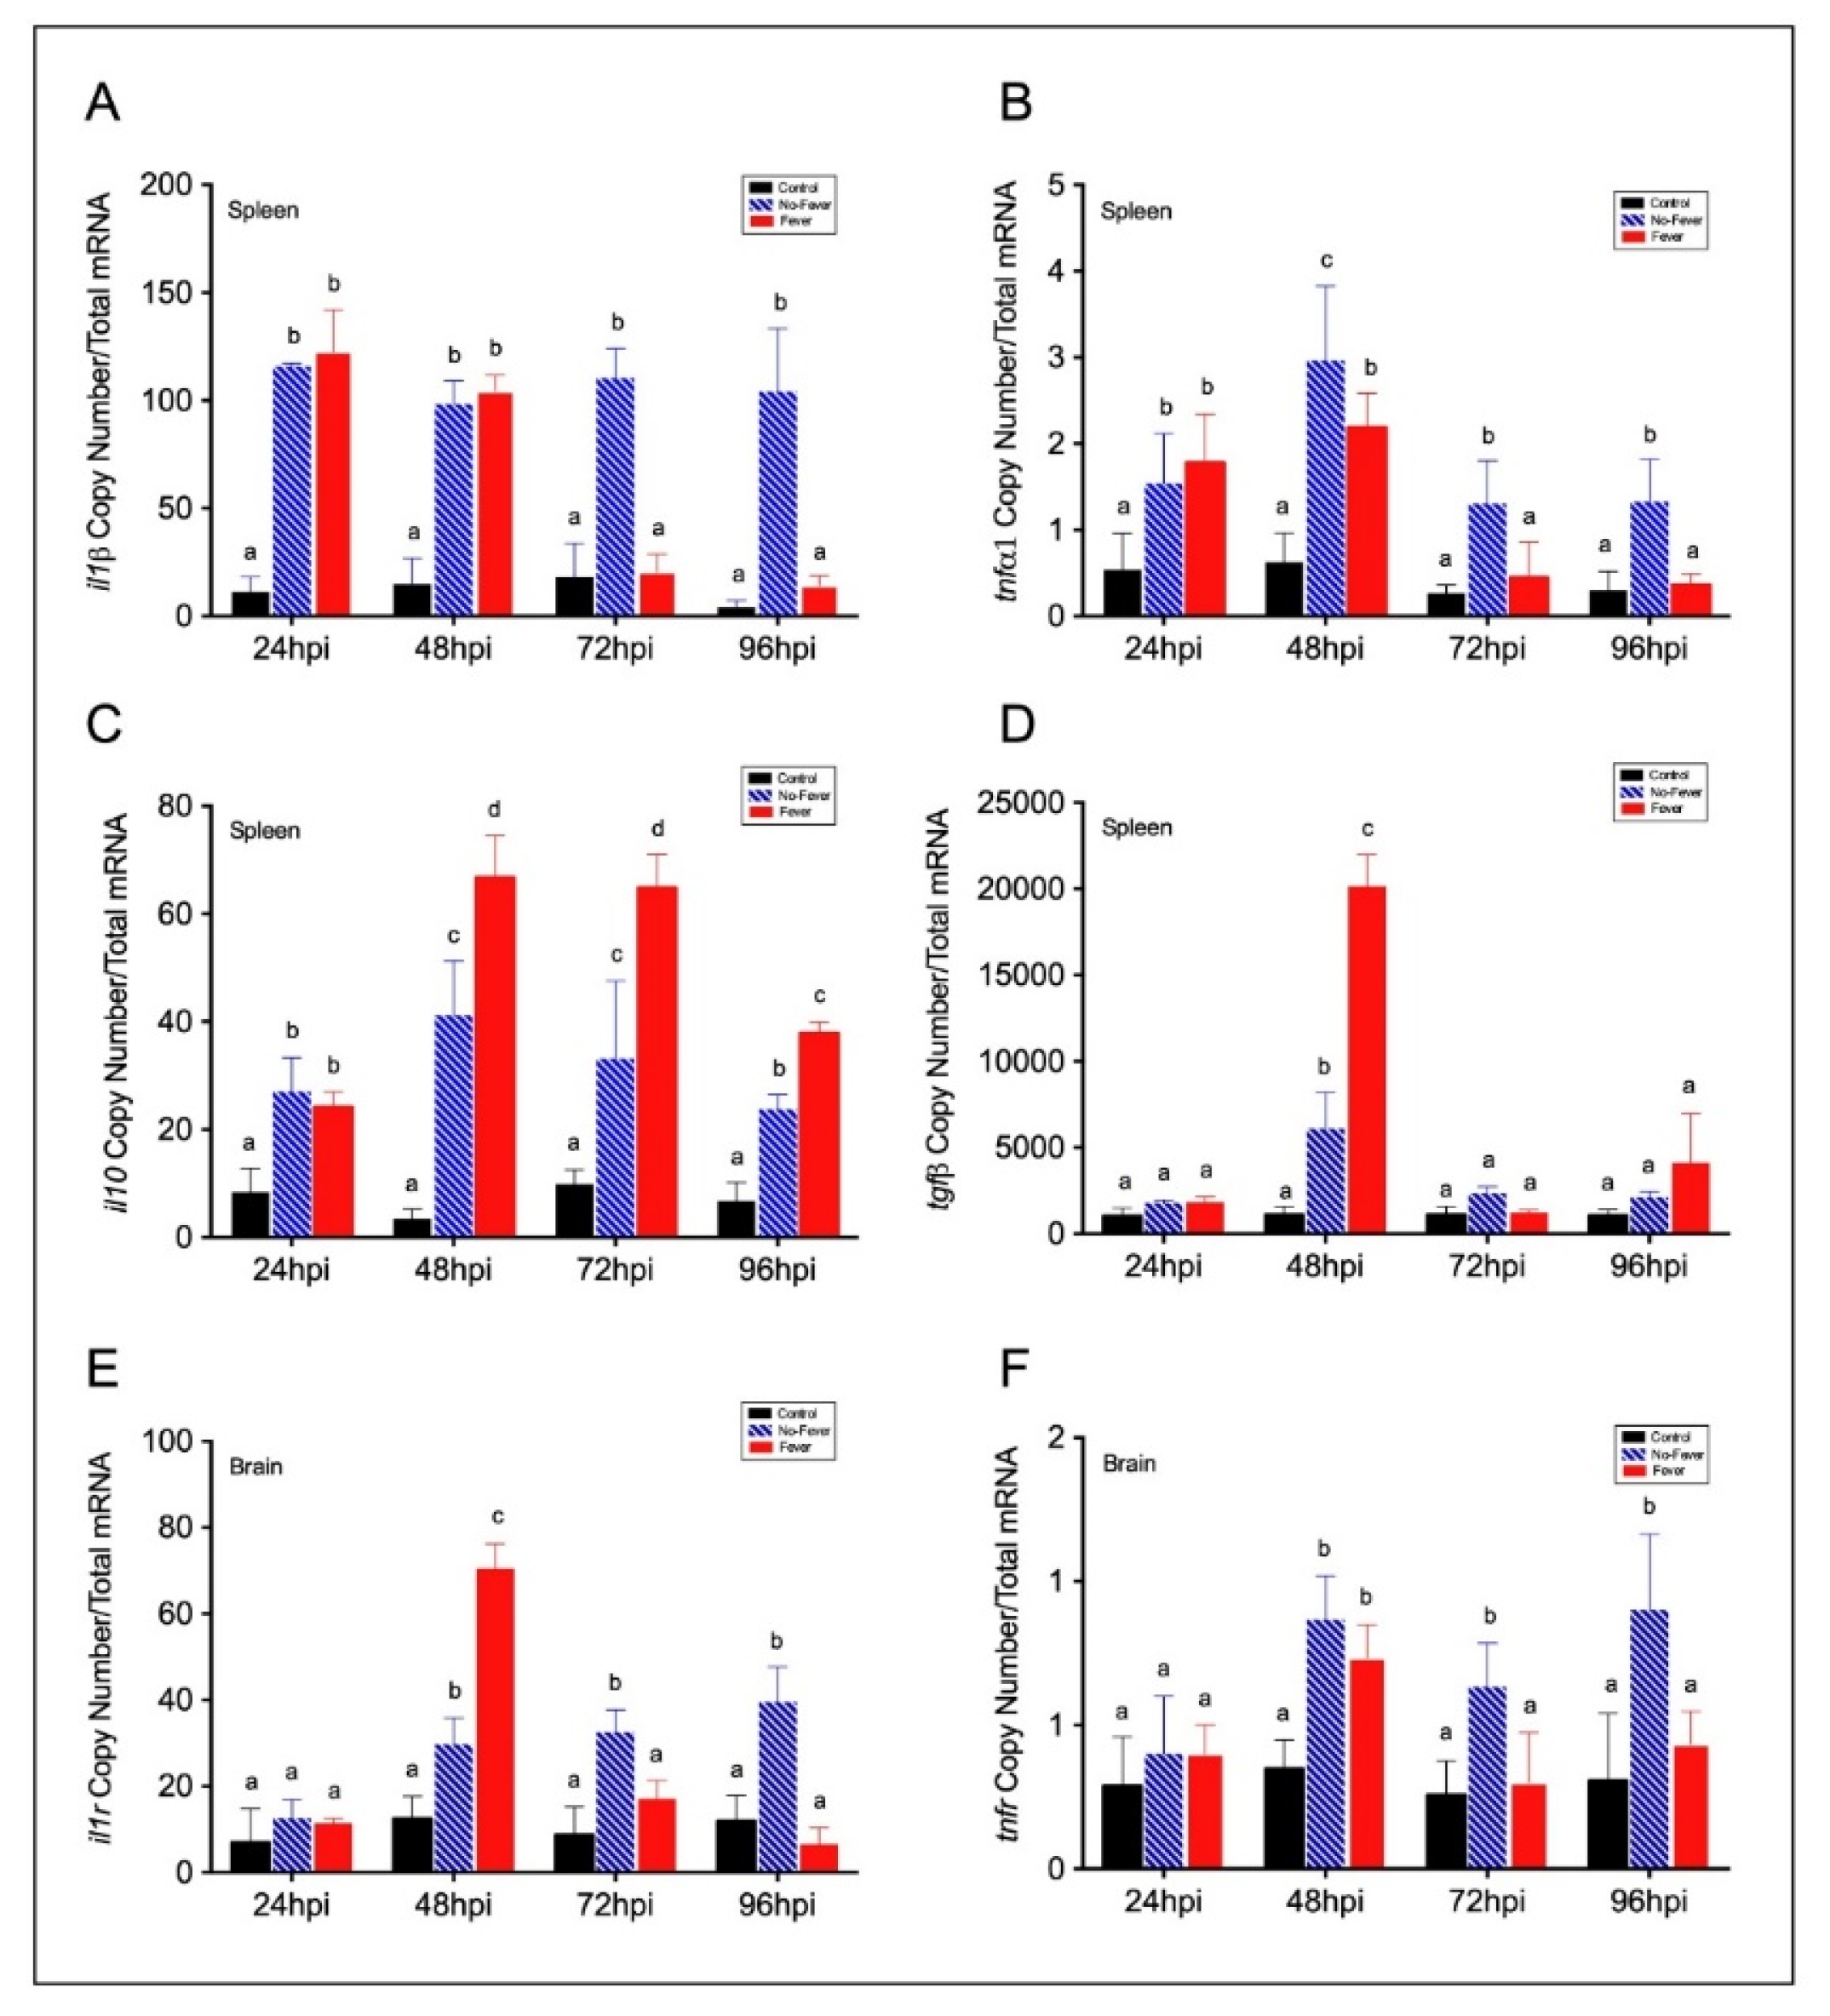
2.2. An Inflammation Activation Threshold Is Modulated by Behavioural Fever
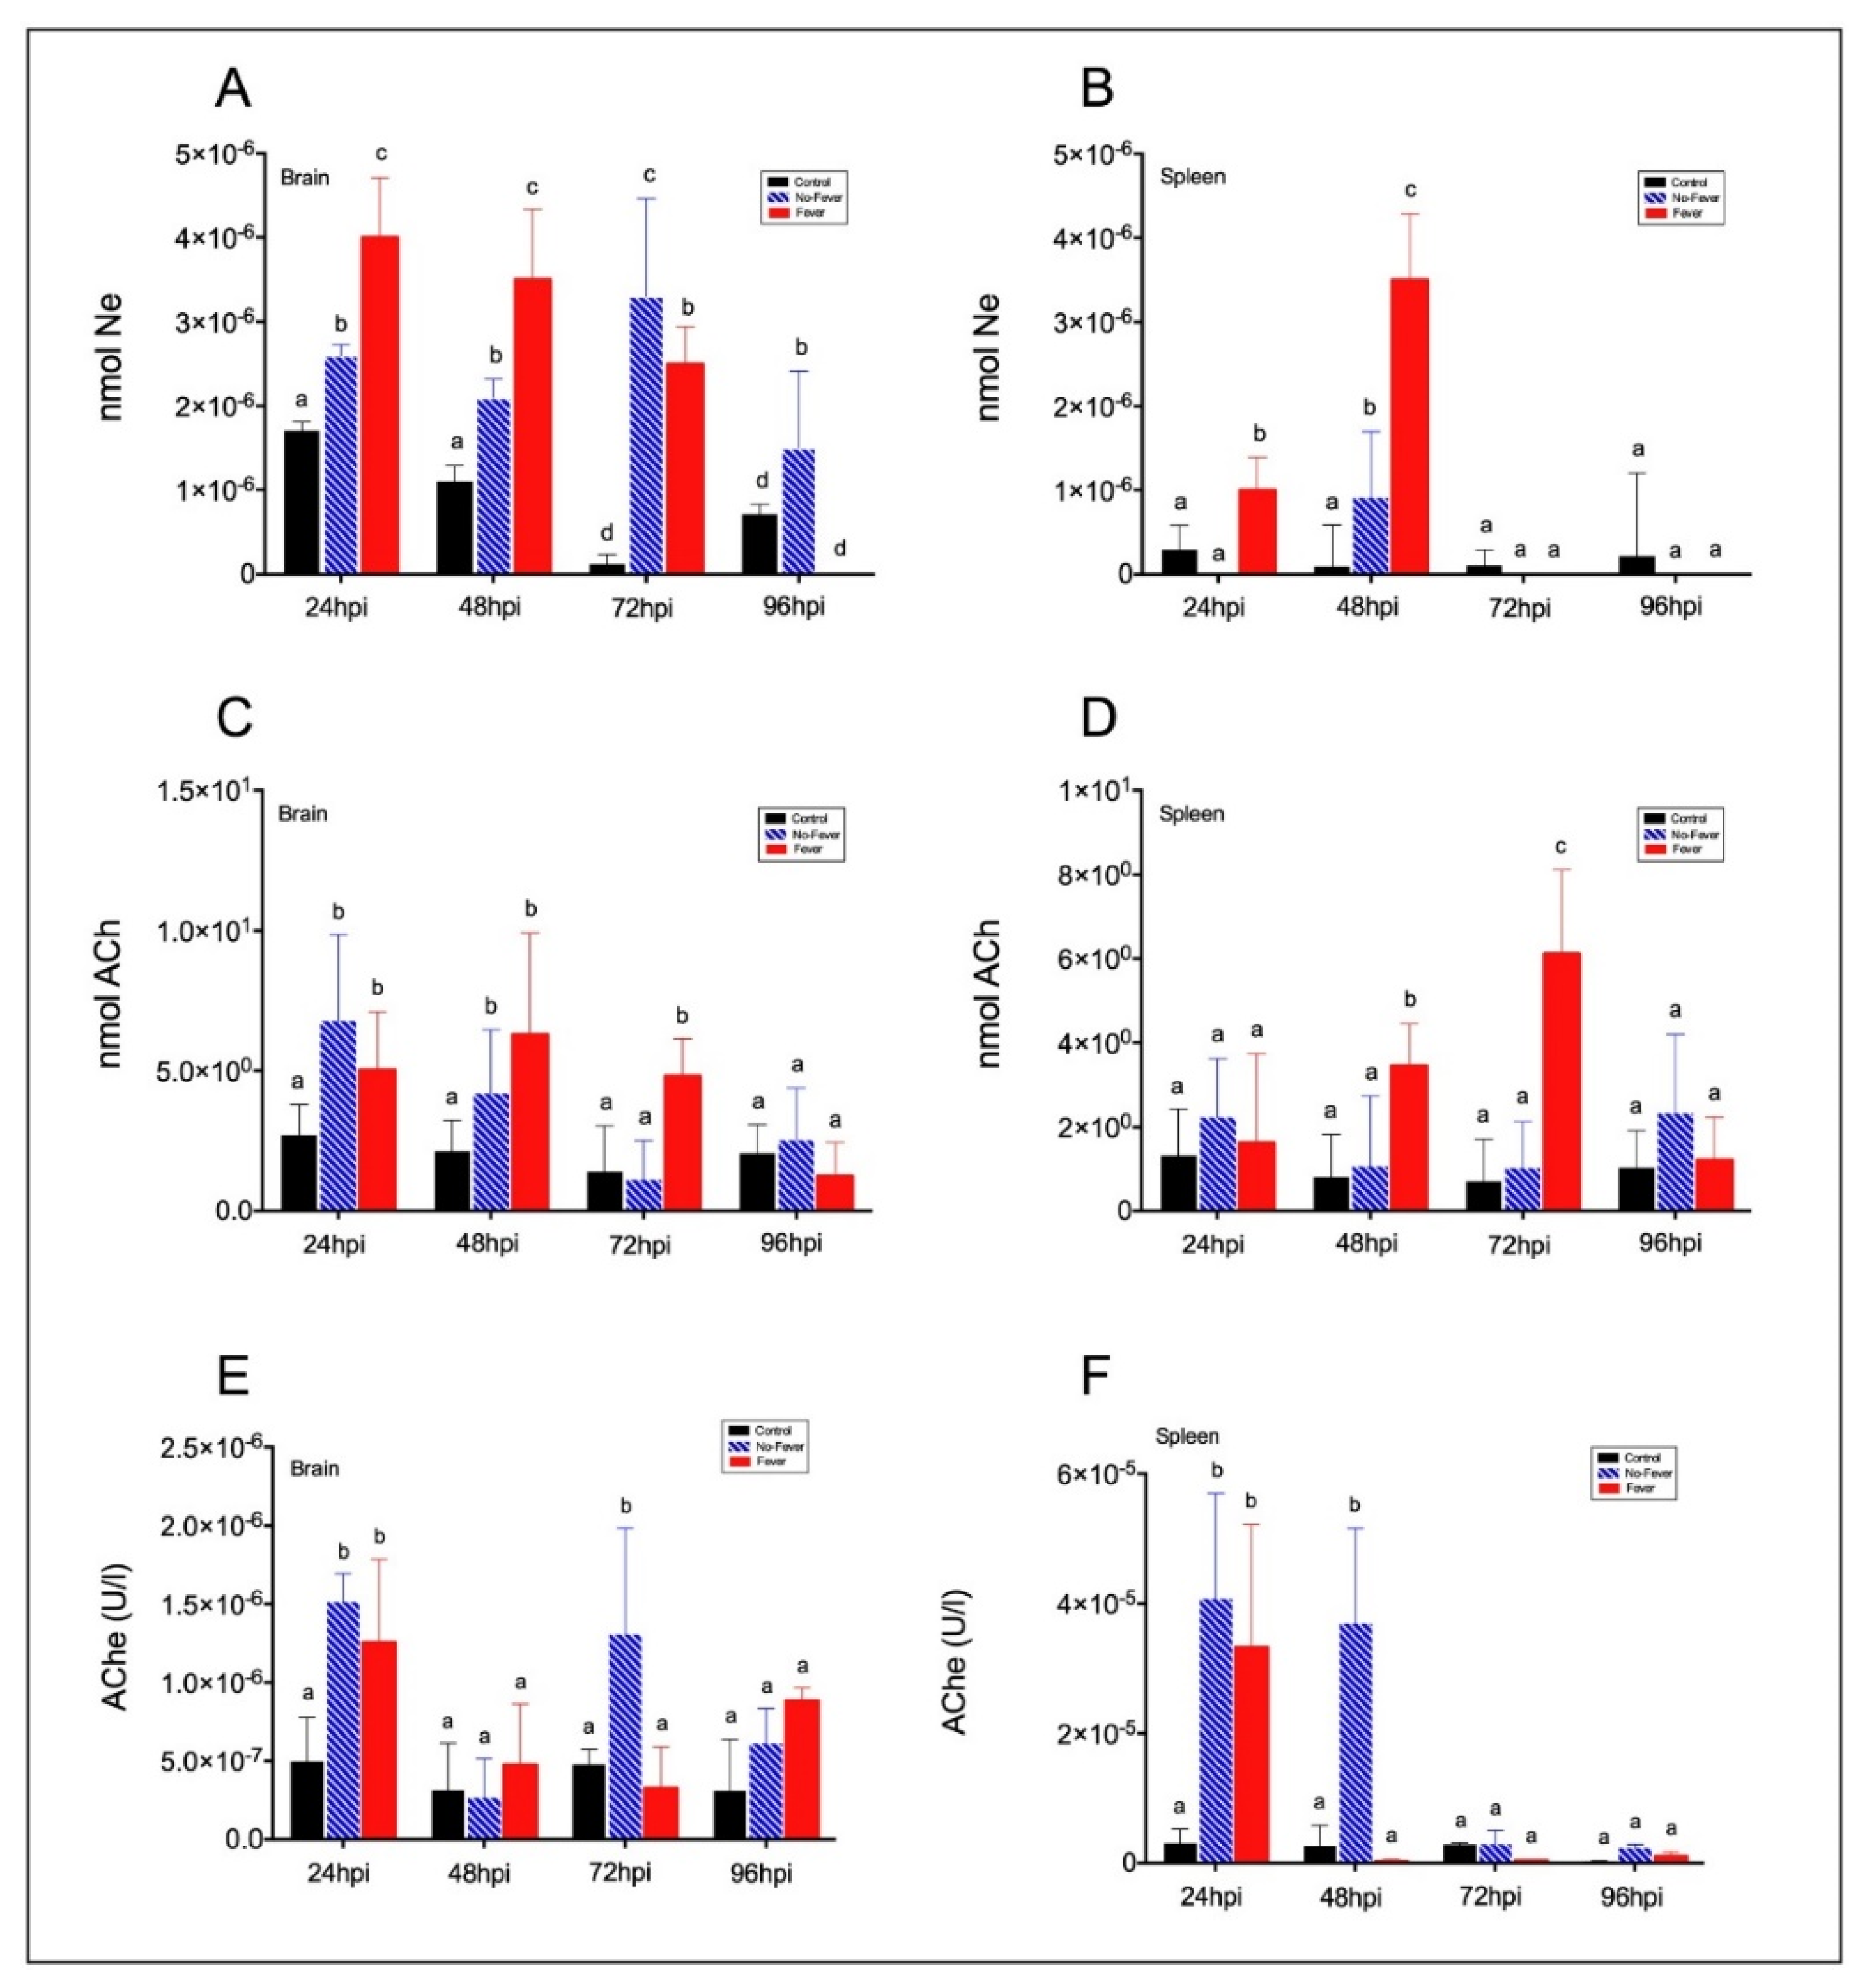
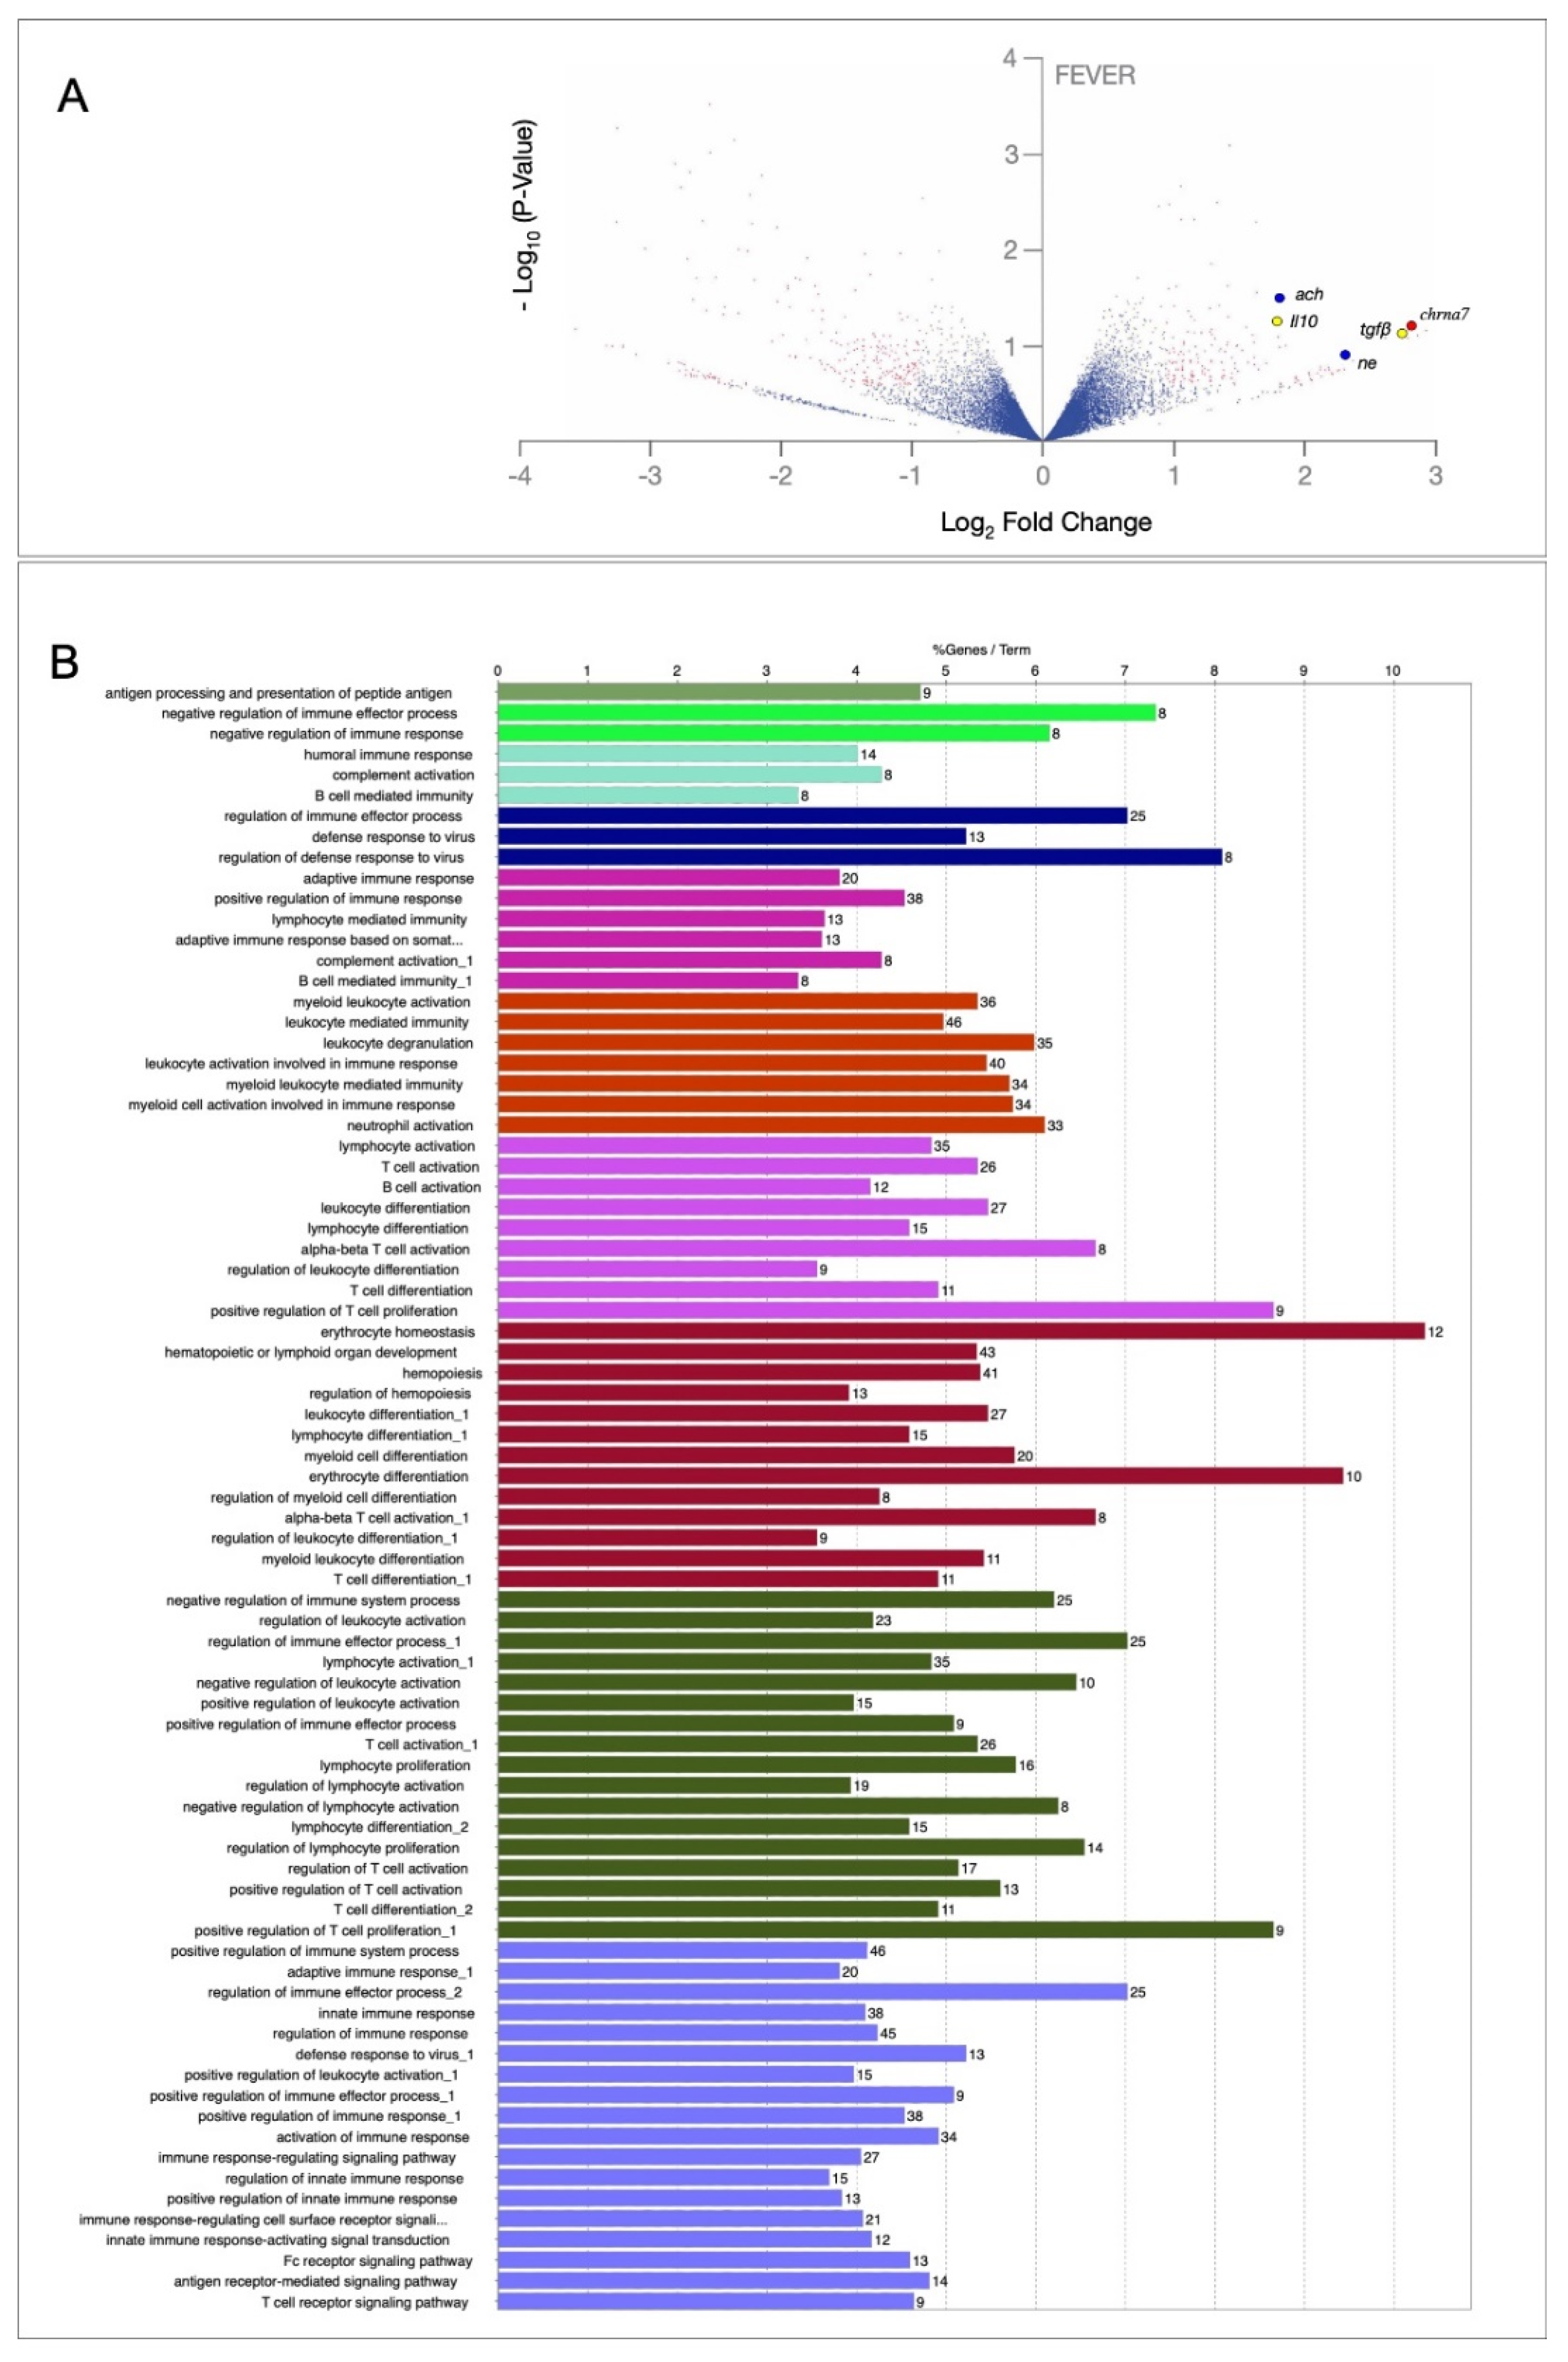
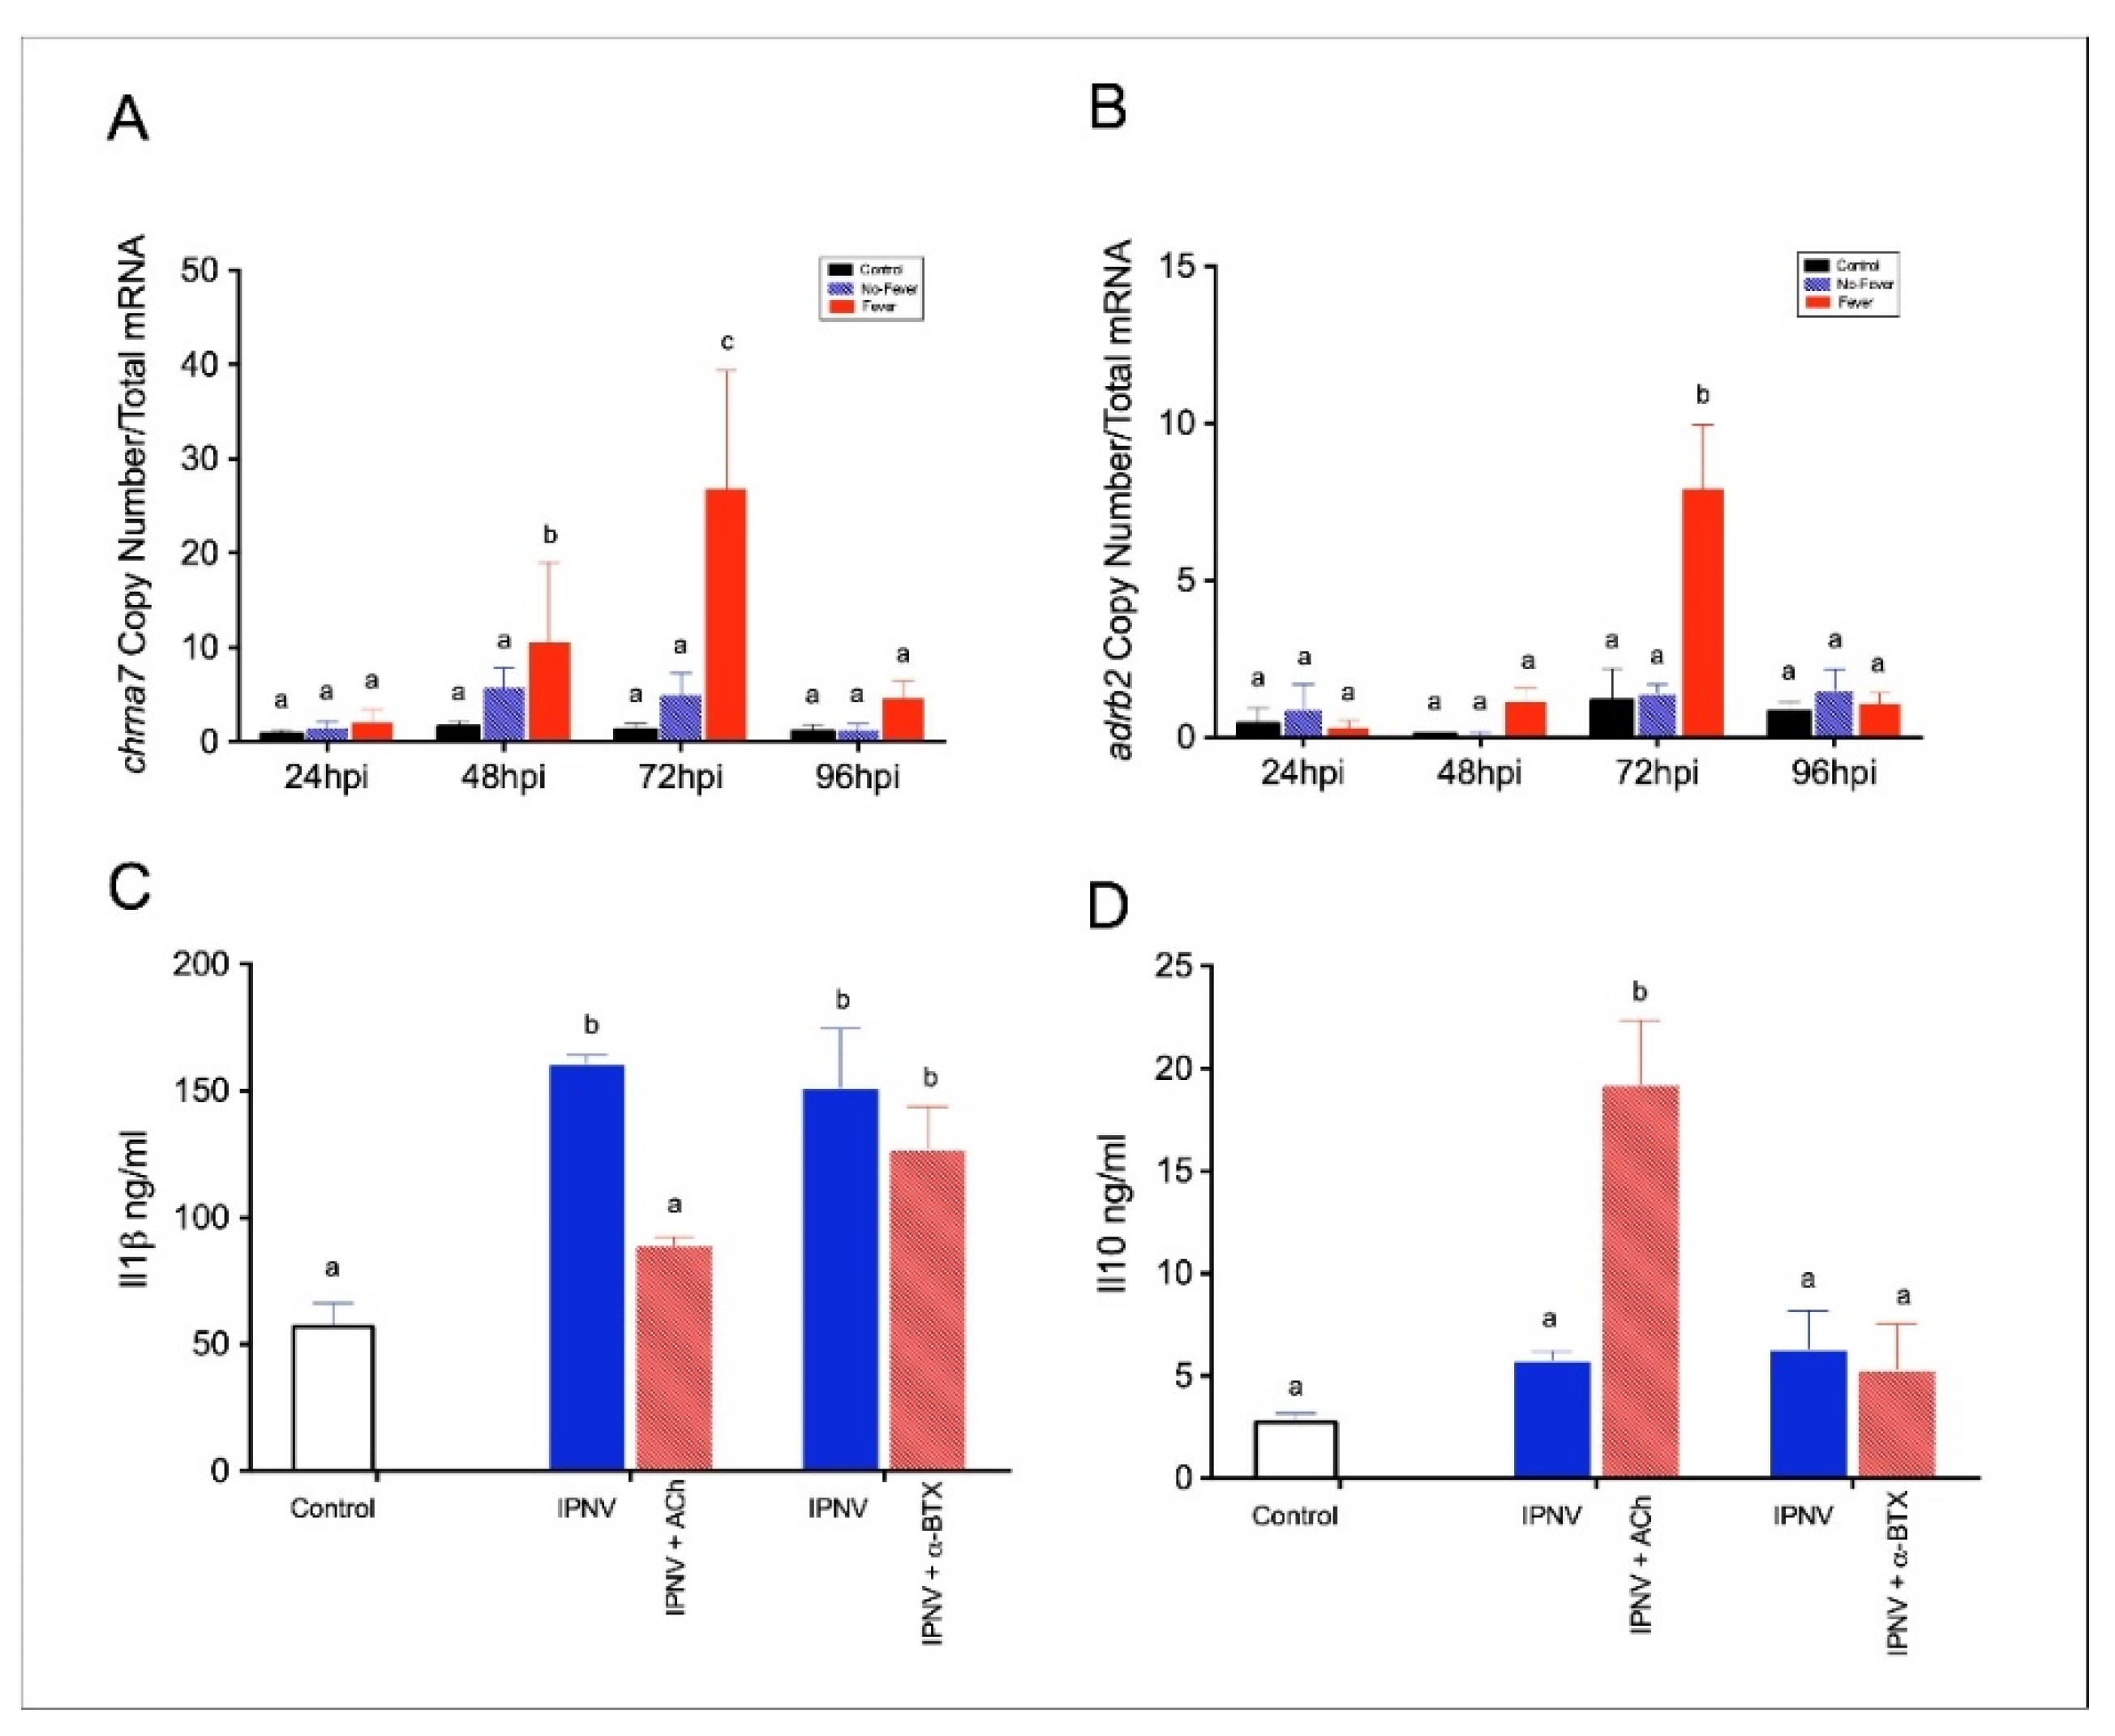
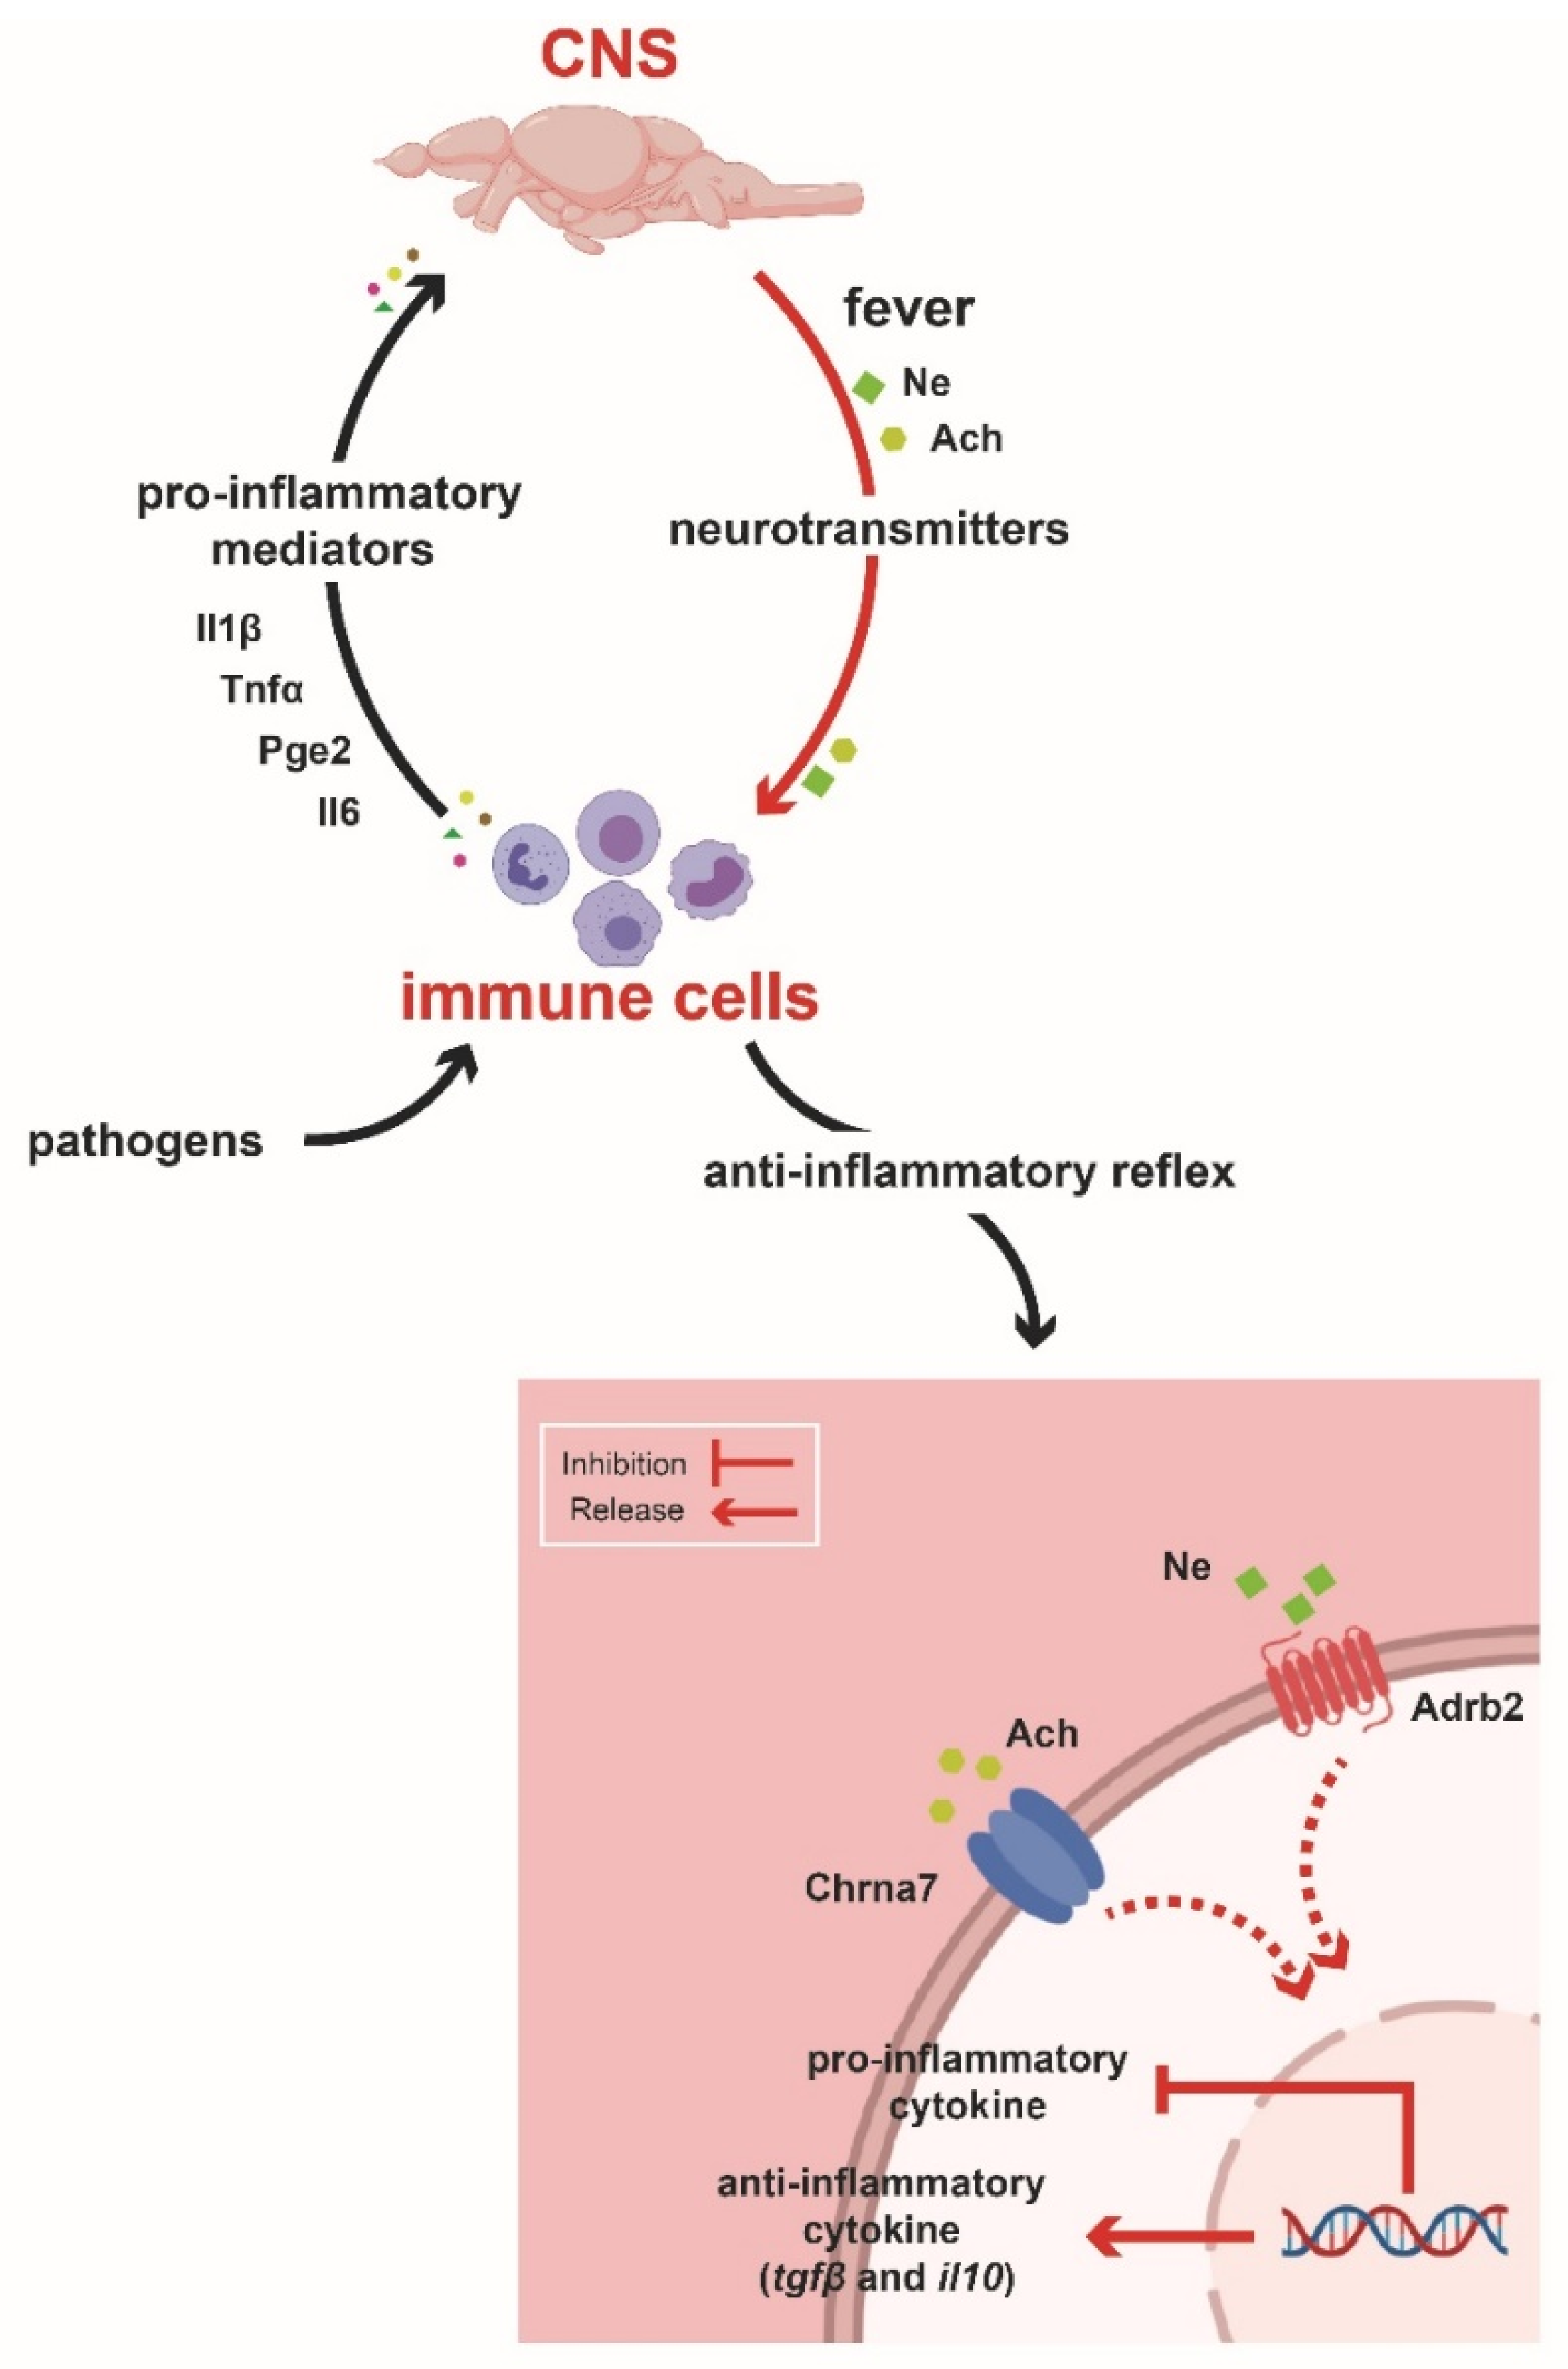
2.3. Behavioural Fever Initiates a Neural–Immune Regulation of Inflammation
3. Discussion
4. Materials and Methods
4.1. Animal and Experimental Conditions
4.2. Infectious Pancreatic Necrosis Virus (IPNV) Assay
4.3. Behaviour Studies
4.4. RNA Extraction, cDNA Synthesis, and Transcript Quantification
4.5. In Situ Hybridization
4.6. ELISA Measurement of Plasma Cytokines
4.7. Norepinephrine Detection by High-Performance Liquid Chromatography with Fluorescence Detection (HPLC-FL)
4.8. Choline/Acetylcholine Assay
4.9. Cholinesterase Enzymatic Activity Assay
4.10. Lipid Content
4.11. High-Throughput Transcriptome Profiling: Library Construction, Illumina Sequencing, and Data Analysis
4.12. Gene Ontology (GO) Enrichment and Interactome Analysis
4.13. Pharmacological and Functional Studies
4.14. Flow Cytometry Analysis
4.15. Statistical Analysis
5. Conclusions
Supplementary Materials
Author Contributions
Funding
Institutional Review Board Statement
Informed Consent Statement
Data Availability Statement
Conflicts of Interest
Ethics Approval and Consent to Participate
Abbreviations
| Chrna7 | Cholinergic receptor nicotinic alpha 7 subunit; |
| Adrb2 | Beta-2 adrenergic receptor |
| Ach | Acetylcholine |
| Tnfα | Tumour necrosis factor alpha |
| Il1β | Interleukin-1 beta |
| Il6 | Interleukin-6 |
| Il10 | Interleukin-10 |
| Tgfβ | Transforming growth factor β |
| PgE2 | Prostaglandin E2 |
| qPCR | Quantitative polymerase chain reaction |
| MS-222 | Tricaine methane sulphonate |
| α-BTX | α-bungarotoxin |
| PBS | Phosphate-buffered saline |
References
- Angilletta, M.J. Thermal Adaptation: A Theoretical and Empirical Synthesis; Oxford University Press: Oxford, UK, 2009. [Google Scholar]
- Boltana, S.; Reynaldo, V.; Roher, N.; Vargas, R.; Huerta, M.; Huntingford, F.A.; Goetz, F.W.; Moore, J.; Valtanen, P.G.; Estepa, A.; et al. Behavioural fever is a synergic signal amplifying the innate immune response. Proc. R. Soc. B Boil. Sci. 2013, 280, 20131381. [Google Scholar] [CrossRef] [PubMed]
- Chavan, S.S.; Pavlov, V.A.; Tracey, K.J. Mechanisms and Therapeutic Relevance of Neuro-immune Communication. Immunity 2017, 46, 927–942. [Google Scholar] [CrossRef] [PubMed] [Green Version]
- Ordovas-Montanes, J.; Rakoff-Nahoum, S.; Huang, S.; Riol-Blanco, L.; Barreiro, O.; von Andrian, U.H. The Regulation of Immunological Processes by Peripheral Neurons in Homeostasis and Disease. Trends Immunol. 2015, 36, 578–604. [Google Scholar] [CrossRef] [PubMed] [Green Version]
- Tracey, K.J. Reflex control of immunity. Nat. Rev. Immunol. 2009, 9, 418–428. [Google Scholar] [CrossRef] [Green Version]
- Martelli, D.; Farmer, D.; McKinley, M.J.; Yao, S.T.; McAllen, R. Anti-inflammatory reflex action of splanchnic sympathetic nerves is distributed across abdominal organs. Am. J. Physiol. Integr. Comp. Physiol. 2019, 316, R235–R242. [Google Scholar] [CrossRef]
- Boltaña, S.; Aguilar, A.; Sanhueza, N.; Donoso, A.; Mercado, L.; Imarai, M.; MacKenzie, S. Behavioral Fever Drives Epigenetic Modulation of the Immune Response in Fish. Front. Immunol. 2018, 9, 1241. [Google Scholar] [CrossRef] [Green Version]
- Boltana, S.; Sanhueza, N.; Donoso, A.; Aguilar, A.; Crespo, D.; Vergara, D.; Arriagada, G.; Morales-Lange, B.; Mercado, L.; Rey, S.; et al. The expression of TRPV channels, prostaglandin E2 and pro-inflammatory cytokines during behavioural fever in fish. Brain Behav. Immun. 2018, 71, 169–181. [Google Scholar] [CrossRef] [Green Version]
- Evans, S.S.; Repasky, E.A.; Fisher, D.T. Fever and the thermal regulation of immunity: The immune system feels the heat. Nat. Rev. Immunol. 2015, 15, 335–349. [Google Scholar] [CrossRef] [PubMed]
- Gallowitsch-Puerta, M.; Pavlov, V.A. Neuro-immune interactions via the cholinergic anti-inflammatory pathway. Life Sci. 2007, 80, 2325–2329. [Google Scholar] [CrossRef] [Green Version]
- Olofsson, P.S.; Katz, D.A.; Rosas-Ballina, M.; Levine, Y.; Ochani, M.; Valdés-Ferrer, S.I.; Pavlov, V.; Tracey, K.J.; Chavan, S.S. α7 Nicotinic Acetylcholine Receptor (α7nAChR) Expression in Bone Marrow-Derived Non-T Cells Is Required for the Inflammatory Reflex. Mol. Med. 2011, 18, 539–543. [Google Scholar] [CrossRef]
- Wang, H.; Yu, M.; Ochani, M.; Amella, C.A.; Tanovic, M.; Susarla, S.; Li, J.H.; Wang, H.; Tang, H.; Ulloa, L.; et al. Nicotinic acetylcholine receptor α7 subunit is an essential regulator of inflammation. Nature 2003, 421, 384–392. [Google Scholar] [CrossRef]
- Pavlov, V.A. Cholinergic Modulation of Inflammation. Int. J. Clin. Exp. Med. 2008, 1, 203–212. [Google Scholar] [PubMed]
- Tracey, K.J. Physiology and immunology of the cholinergic antiinflammatory pathway. J. Clin. Investig. 2007, 117, 289–296. [Google Scholar] [CrossRef] [Green Version]
- Guarini, S.; Altavilla, D.; Cainazzo, M.-M.; Giuliani, D.; Bigiani, A.; Marini, H.; Squadrito, G.; Minutoli, L.; Bertolini, A.; Marini, R.; et al. Efferent Vagal Fibre Stimulation Blunts Nuclear Factor-κB Activation and Protects Against Hypovolemic Hemorrhagic Shock. Circulation 2003, 107, 1189–1194. [Google Scholar] [CrossRef] [Green Version]
- Bernik, T.R.; Friedman, S.G.; Ochani, M.; DiRaimo, R.; Ulloa, L.; Yang, H.; Sudan, S.; Czura, C.J.; Ivanova, S.M.; Tracey, K.J. Pharmacological Stimulation of the Cholinergic Antiinflammatory Pathway. J. Exp. Med. 2002, 195, 781–788. [Google Scholar] [CrossRef] [PubMed] [Green Version]
- van Westerloo, D.J.; Giebelen, I.A.; Florquin, S.; Bruno, M.J.; LaRosa, G.J.; Ulloa, L.; Tracey, K.J.; van der Poll, T. The Vagus Nerve and Nicotinic Receptors Modulate Experimental Pancreatitis Severity in Mice. Gastroenterology 2006, 130, 1822–1830. [Google Scholar] [CrossRef]
- De Jonge, W.J.; Van Der Zanden, E.P.; The, F.O.; Bijlsma, M.F.; Van Westerloo, D.J.; Bennink, R.J.; Berthoud, H.-R.; Uematsu, S.; Akira, S.; Wijngaard, R.M.V.D.; et al. Stimulation of the vagus nerve attenuates macrophage activation by activating the Jak2-STAT3 signaling pathway. Nat. Immunol. 2005, 6, 844–851. [Google Scholar] [CrossRef] [PubMed]
- Wang, L.; Opland, D.; Tsai, S.; Luk, C.T.; Schroer, S.A.; Allison, M.B.; Elia, A.J.; Furlonger, C.; Suzuki, A.; Paige, C.J.; et al. Pten deletion in RIP-Cre neurons protects against type 2 diabetes by activating the anti-inflammatory reflex. Nat. Med. 2014, 20, 484–492. [Google Scholar] [CrossRef]
- Zirger, J.M.; Beattie, C.E.; McKay, D.B.; Boyd, R.T. Cloning and expression of zebrafish neuronal nicotinic acetylcholine receptors. Gene Expr. Patterns 2003, 3, 747–754. [Google Scholar] [CrossRef]
- Jones, A.; Elgar, G.; Sattelle, D.B. The nicotinic acetylcholine receptor gene family of the pufferfish, Fugu rubripes. Genomics 2003, 82, 441–451. [Google Scholar] [CrossRef]
- Drescher, D.; Ramakrishnan, N.; Drescher, M.; Chun, W.; Wang, X.; Myers, S.; Green, G.; Sadrazodi, K.; Karadaghy, A.; Poopat, N.; et al. Cloning and characterization of α9 subunits of the nicotinic acetylcholine receptor expressed by saccular hair cells of the rainbow trout (Oncorhynchus mykiss). Neuroscience 2004, 127, 737–752. [Google Scholar] [CrossRef]
- Torrealba, D.; Balasch, J.C.; Criado, M.; Tort, L.; MacKenzie, S.; Roher, N. Functional evidence for the inflammatory reflex in teleosts: A novel α7 nicotinic acetylcholine receptor modulates the macrophage response to dsRNA. Dev. Comp. Immunol. 2018, 84, 279–291. [Google Scholar] [CrossRef] [PubMed] [Green Version]
- Toledo-Ibarra, G.A.; Rojas-Mayorquín, A.E.; Girón-Pérez, M.I. Influence of the Cholinergic System on the Immune Response of Teleost Fishes: Potential Model in Biomedical Research. Clin. Dev. Immunol. 2013, 2013, 1–9. [Google Scholar] [CrossRef]
- Sussman, J.; Harel, M.; Frolow, F.; Oefner, C.; Goldman, A.; Toker, L.; Silman, I. Atomic structure of acetylcholinesterase from Torpedo californica: A prototypic acetylcholine-binding protein. Science 1991, 253, 872–879. [Google Scholar] [CrossRef] [PubMed]
- Dinarello, C.A. Review: Infection, fever, and exogenous and endogenous pyrogens: Some concepts have changed. J. Endotoxin Res. 2004, 10, 201–222. [Google Scholar] [CrossRef] [PubMed] [Green Version]
- Gordon, C.J. Temperature Regulation in Laboratory Rodents; Cambridge University Press: Cambridge, UK, 1993. [Google Scholar]
- Kluger, M.J.; Kozak, W.; Conn, C.A.; Leon, L.R.; Soszynski, D. The adaptive value of fever. Infect. Dis. Clin. N. Am. 1996, 10, 1–20. [Google Scholar] [CrossRef]
- Rakus, K.; Ronsmans, M.; Vanderplasschen, A. Behavioral fever in ectothermic vertebrates. Dev. Comp. Immunol. 2017, 66, 84–91. [Google Scholar] [CrossRef] [Green Version]
- Żbikowska, E.; Lombardo, P.; Żbikowski, J.; Jabłońska, G.; Marszewska, A.; Cichy, A. Ketoprofen-induced inhibition of symptoms of behavioural fever observed in wintering Planorbarius corneus (L.) (Gastropoda: Planorbidae). J. Molluscan Stud. 2017, 83, 434–439. [Google Scholar] [CrossRef] [Green Version]
- Rakus, K.; Ronsmans, M.; Forlenza, M.; Boutier, M.; Piazzon, M.C.; Jazowiecka-Rakus, J.; Gatherer, D.; Athanasiadis, A.; Farnir, F.; Davison, A.J.; et al. Conserved Fever Pathways across Vertebrates: A Herpesvirus Expressed Decoy TNF-α Receptor Delays Behavioral Fever in Fish. Cell Host Microbe 2017, 21, 244–253. [Google Scholar] [CrossRef] [Green Version]
- Bicego, K.C.; Branco, L.G.S. Discrete electrolytic lesion of the preoptic area prevents LPS-induced behavioral fever in toads. J. Exp. Biol. 2002, 205, 3513–3518. [Google Scholar] [CrossRef]
- Hwang, H.J.; Moon, C.H.; Kim, H.G.; Kim, J.Y.; Lee, J.M.; Park, J.W.; Chung, D.K. Identification and Functional Analysis of Salmon Annexin 1 Induced by a Virus Infection in a Fish Cell Line. J. Virol. 2007, 81, 13816–13824. [Google Scholar] [CrossRef] [PubMed] [Green Version]
- Pavlov, V.A.; Tracey, K.J. The cholinergic anti-inflammatory pathway. Brain Behav. Immun. 2005, 19, 493–499. [Google Scholar] [CrossRef]
- Huang, D.W.; Sherman, B.T.; Stephens, R.; Baseler, M.W.; Clifford, H.; Lempicki, R.A. DAVID gene ID conversion tool. Bioinformation 2008, 2, 428. [Google Scholar] [CrossRef] [Green Version]
- Bindea, G.; Mlecnik, B.; Hackl, H.; Charoentong, P.; Tosolini, M.; Kirilovsky, A.; Fridman, W.H.; Pagès, F.; Trajanoski, Z.; Galon, J. ClueGO: A Cytoscape plug-in to decipher functionally grouped gene ontology and pathway annotation networks. Bioinformatics 2009, 25, 1091–1093. [Google Scholar] [CrossRef] [Green Version]
- Schedel, A.; Thornton, S.; Schloss, P.; Klüter, H.; Bugert, P. Human Platelets Express Functional α7-Nicotinic Acetylcholine Receptors. Arter. Thromb. Vasc. Biol. 2011, 31, 928–934. [Google Scholar] [CrossRef] [Green Version]
- Zhang, C.; Yu, P.; Zhu, L.; Zhao, Q.; Lu, X.; Bo, S. Blockade of α7 nicotinic acetylcholine receptors inhibit nicotine-induced tumor growth and vimentin expression in non-small cell lung cancer through MEK/ERK signaling way. Oncol. Rep. 2017, 38, 3309–3318. [Google Scholar] [CrossRef] [PubMed] [Green Version]
- Liu, D.; Li, T.; Luo, H.; Zuo, X.; Liu, S.; Wu, S. The effect of the cholinergic anti-inflammatory pathway on collagen-induced arthritis involves the modulation of dendritic cell differentiation. Arthritis Res. Ther. 2018, 20, 263. [Google Scholar] [CrossRef] [Green Version]
- Banchereau, J.; Briere, F.; Caux, C.; Davoust, J.; Lebecque, S.; Liu, Y.J.; Pulendran, B.; Palucka, K. Immunobiology of dendritic cells. Annu. Rev. Immunol. 2000, 18, 767–811. [Google Scholar] [CrossRef] [PubMed]
- Medzhitov, R. Recognition of microorganisms and activation of the immune response. Nat. Cell Biol. 2007, 449, 819–826. [Google Scholar] [CrossRef] [PubMed]
- Akira, S.; Uematsu, S.; Takeuchi, O. Pathogen Recognition and Innate Immunity. Cell 2006, 124, 783–801. [Google Scholar] [CrossRef] [Green Version]
- Roth, J.; Blatteis, C.M. Mechanisms of Fever Production and Lysis: Lessons from Experimental LPS Fever. Compr. Physiol. 2014, 4, 1563–1604. [Google Scholar] [CrossRef]
- Roth, J.; de Souza, G.E.P. Fever induction pathways: Evidence from responses to systemic or local cytokine for-mation. Braz. J. Med. Biol. Res. 2001, 34, 301–314. [Google Scholar] [CrossRef] [PubMed]
- Zou, J.; Peddie, S.; Scapigliati, G.; Zhang, Y.; Bols, N.; Ellis, A.; Secombes, C. Functional characterisation of the recombinant tumor necrosis factors in rainbow trout, Oncorhynchus mykiss. Dev. Comp. Immunol. 2003, 27, 813–822. [Google Scholar] [CrossRef]
- Andrei, I.I.; Romanovsky, A.A. Prostaglandin E2 as a mediator of fever: Synthesis and catabolism. Front. Biosci. 2004, 9, 1977–1993. [Google Scholar] [CrossRef]
- Tisoncik, J.R.; Korth, M.J.; Simmons, C.P.; Farrar, J.; Martin, T.R.; Katze, M.G. Into the Eye of the Cytokine Storm. Microbiol. Mol. Biol. Rev. 2012, 76, 16–32. [Google Scholar] [CrossRef] [Green Version]
- Andersson, U.; Tracey, K.J. Neural reflexes in inflammation and immunity. J. Exp. Med. 2012, 209, 1057–1068. [Google Scholar] [CrossRef] [PubMed]
- Tracey, K.J. The inflammatory reflex. Nature 2002, 420, 853–859. [Google Scholar] [CrossRef] [PubMed]
- Rosas-Ballina, M.; Olofsson, P.S.; Ochani, M.; Valdés-Ferrer, S.I.; Levine, Y.; Reardon, C.; Tusche, M.W.; Pavlov, V.; Andersson, U.; Chavan, S.; et al. Acetylcholine-Synthesizing T Cells Relay Neural Signals in a Vagus Nerve Circuit. Science 2011, 334, 98–101. [Google Scholar] [CrossRef] [PubMed] [Green Version]
- Chung, F. Anti-inflammatory cytokines in asthma and allergy: Interleukin-10, interleukin-12, interferon-γ. Mediat. Inflamm. 2001, 10, 51–59. [Google Scholar] [CrossRef] [Green Version]
- Fiorentino, D.F.; Bond, M.W.; Mosmann, T.R. Two types of mouse T helper cell. IV. Th2 clones secrete a factor that inhibits cytokine production by Th1 clones. J. Exp. Med. 1989, 170, 2081–2095. [Google Scholar] [CrossRef]
- Bluestone, J.A.; Abbas, A.K. Natural versus adaptive regulatory T cells. Nat. Rev. Immunol. 2003, 3, 253–257. [Google Scholar] [CrossRef] [PubMed]
- Wherry, E.J.; Ahmed, R. Memory CD8 T-Cell Differentiation during Viral Infection. J. Virol. 2004, 78, 5535–5545. [Google Scholar] [CrossRef] [PubMed] [Green Version]
- Liao, W.; Lin, J.-X.; Wang, L.; Li, P.; Leonard, W.J. Modulation of cytokine receptors by IL-2 broadly regulates differentiation into helper T cell lineages. Nat. Immunol. 2011, 12, 551–559. [Google Scholar] [CrossRef] [Green Version]
- Maisey, K.; Montero, R.; Corripio-Miyar, Y.; Toro-Ascuy, D.; Valenzuela, B.; Reyes-Cerpa, S.; Sandino, A.M.; Zou, J.; Wang, T.; Secombes, C.J.; et al. Isolation and Characterization of Salmonid CD4+T Cells. J. Immunol. 2016, 196, 4150–4163. [Google Scholar] [CrossRef] [Green Version]
- Li, P.; Spolski, R.; Liao, W.; Leonard, W.J. Complex interactions of transcription factors in mediating cytokine biologyin T cells. Immunol. Rev. 2014, 261, 141. [Google Scholar] [CrossRef] [Green Version]
- Deaglio, S.; Vaisitti, T.; Billington, R.; Bergui, L.; Omede’, P.; Genazzani, A.A.; Malavasi, F. CD38/CD19: A lipid raft–dependent signaling complex in human B cells. Blood 2007, 109, 5390–5398. [Google Scholar] [CrossRef] [PubMed]
- O’Garra, A.; Vieira, P. Regulatory T cells and mechanisms of immune system control. Nat. Med. 2004, 10, 801–805. [Google Scholar] [CrossRef] [PubMed]
- Piazzon, M.C.; Lutfalla, G.; Forlenza, M. IL10, A Tale of an Evolutionarily Conserved Cytokine across Vertebrates. Crit. Rev. Immunol. 2016, 36, 99–129. [Google Scholar] [CrossRef]
- Borovikova, L.V.; Ivanova, S.; Zhang, M.; Yang, H.; Botchkina, G.I.; Watkins, L.R.; Wang, H.; Abumrad, N.; Eaton, J.W.; Tracey, K.J. Vagus nerve stimulation attenuates the systemic inflammatory response to endotoxin. Nature 2000, 405, 458–462. [Google Scholar] [CrossRef]
- Davidson, J.; May, T.; Good, C.; Waldrop, T.; Kenney, B.; Terjesen, B.F.; Summerfelt, S. Production of market-size North American strain Atlantic salmon Salmo salar in a land-based recirculation aquaculture system using freshwater. Aquac. Eng. 2016, 74, 1–16. [Google Scholar] [CrossRef] [Green Version]
- Taksdal, T.; Stangeland, K.; Dannevig, B. Induction of infectious pancreatic necrosis (IPN) in Atlantic salmon Salmo salar and brook trout Salvelinus fontinalis by bath challenge of fry with infectious pancreatic necrosis virus (IPNV) serotype Sp. Dis. Aquat. Org. 1997, 28, 39–44. [Google Scholar] [CrossRef]
- Ørpetveit, I.; Mikalsen, A.B.; Sindre, H.; Evensen, Ø.; Dannevig, B.H.; Midtlyng, P.J. Detection of Infectious Pancreatic Necrosis Virus in Subclinically Infected Atlantic Salmon by Virus Isolation in Cell Culture or Real-Time Reverse Transcription Polymerase Chain Reaction: Influence of Sample Preservation and Storage. J. Veter. Diagn. Investig. 2010, 22, 886–895. [Google Scholar] [CrossRef] [PubMed] [Green Version]
- Avendaño-Herrera, R.; Tobar, J.A.; Tobar, I.; Fernández-Caro, C. Universal probe library assay for the detection of infectious pancreatic necrosis virus genogroups 1 and 5 in salmonid organs. Aquac. Res. 2017, 48, 1962–1967. [Google Scholar] [CrossRef]
- Calleja, F.; Godoy, M.; Cárcamo, J.G.; Bandín, I.; Yáñez, A.J.; Dopazo, C.P.; Kibenge, F.S.; Avendaño-Herrera, R. Use of reverse transcription-real time polymerase chain reaction (real time RT-PCR) assays with Universal Probe Library (UPL) probes for the detection and genotyping of infectious pancreatic necrosis virus strains isolated in Chile. J. Virol. Methods 2012, 183, 80–85. [Google Scholar] [CrossRef]
- Hardin, J.W.; Hilbe, J. Generalized Linear Models and Extensions, 3rd ed.; Stata Press: College Station, TX, USA, 2012; 455p. [Google Scholar]
- Zuur, A.F.; Hilbe, J.M.; Ieno, E.N. A Beginner’s Guide to GLM and GLMM with R: A Frequentist and Bayesian Perspective for Ecologists; Highland Statistics Ltd.: Newburgh, UK, 2013. [Google Scholar]
- Morales, B.; Bethke, J.; Schmitt, P.; Mercado, L. Phenotypical parameters as a tool to evaluate the immunostimulatory effects of laminarin inOncorhynchus mykiss. Aquac. Res. 2014, 46, 2707–2715. [Google Scholar] [CrossRef]
- Bethke, J.; Rojas, V.; Berendsen, J.; Cárdenas, C.; Guzmán, F.; Gallardo, J.; Mercado, L. Development of a new antibody for detecting natural killer enhancing factor (NKEF)-like protein in infected salmonids. J. Fish Dis. 2012, 35, 379–388. [Google Scholar] [CrossRef]
- Rojas, V.; Morales-Lange, B.; Guzmán, F.; Gallardo, J.A.; Mercado, L. Immunological strategy for detecting the pro-inflammatory cytokine TNF-alpha in salmonids. Electron. J. Biotechnol. 2012, 15, 21. [Google Scholar]
- Schmitt, P.; Wacyk, J.; Morales, B.; Rojas, V.; Guzmán, F.; Dixon, B.; Mercado, L. Immunomodulatory effect of cathelicidins in response to a β-glucan in intestinal epithelial cells from rainbow trout. Dev. Comp. Immunol. 2015, 51, 160–169. [Google Scholar] [CrossRef]
- Santana, P.A.; Álvarez, C.A.; Guzmán, F.; Mercado, L. Development of a sandwich ELISA for quantifying hepcidin in Rainbow trout. Fish Shellfish. Immunol. 2013, 35, 748–755. [Google Scholar] [CrossRef]
- Thomas, J.; Khanam, R.; Vohora, D. A validated HPLC-UV method and optimization of sample preparation technique for norepinephrine and serotonin in mouse brain. Pharm. Biol. 2015, 53, 1539–1544. [Google Scholar] [CrossRef] [Green Version]
- Ellman, G.L.; Courtney, K.D.; Andres, V.; Featherstone, R.M. A new and rapid colorimetric determination of acetylcholinesterase activity. Biochem. Pharmacol. 1961, 7, 88–95. [Google Scholar] [CrossRef]
- Jiménez-Díaz, M.; Martínez-Monge, V. Validación de la determinación de colinesterasa plasmática humana a 340 nM. Rev. Biomédica 2000, 11, 91–98. [Google Scholar] [CrossRef] [Green Version]
- Eyer, P.; Worek, F.; Kiderlen, D.; Šinko, G.; Stuglin, A.; Simeon-Rudolf, V.; Reiner, E. Molar absorption coefficients for the reduced Ellman reagent: Reassessment. Anal. Biochem. 2003, 312, 224–227. [Google Scholar] [CrossRef]
- Bligh, E.G.; Dyer, W.J. A rapid method of total lipid extraction and purification. Can. J. Biochem. Physiol. 1959, 37, 911–917. [Google Scholar] [CrossRef] [Green Version]
- Lien, S.; Koop, B.F.; Sandve, S.R.; Miller, J.R.; Kent, M.P.; Nome, T.; Hvidsten, T.R.; Leong, J.S.; Minkley, D.R.; Zimin, A.; et al. The Atlantic salmon genome provides insights into rediploidization. Nature 2016, 533, 200–205. [Google Scholar] [CrossRef] [Green Version]
- Kim, D.; Pertea, G.; Trapnell, C.; Pimentel, H.; Kelley, R.; Salzberg, S.L. TopHat2: Accurate alignment of transcriptomes in the presence of insertions, deletions and gene fusions. Genome Biol. 2013, 14, 1–13. [Google Scholar] [CrossRef] [Green Version]
- Trapnell, C.; Roberts, A.; Goff, L.; Pertea, G.; Kim, D.; Kelley, D.R.; Pimentel, H.; Salzberg, S.L.; Rinn, J.L.; Pachter, L. Differential gene and transcript expression analysis of RNA-seq experiments with TopHat and Cufflinks. Nat. Protoc. 2012, 7, 562–578. [Google Scholar] [CrossRef] [PubMed] [Green Version]
- Huang, D.W.; Sherman, B.T.; Tan, Q.; Collins, J.R.; Alvord, W.G.; Roayaei, J.; Stephens, R.; Baseler, M.W.; Lane, H.C.; Lempick, R.A. The DAVID Gene Functional Classification Tool: A novel biological module-centric algorithm to functionally analyze large gene lists. Genome Biol. 2007, 8, 1–16. [Google Scholar] [CrossRef] [PubMed] [Green Version]
- Benjamini, Y.; Hochberg, Y. Controlling the false discovery rate: A practical and powerful approach to multiple testing. J. R. Stat. Soc. 1995, 57, 289–300. [Google Scholar] [CrossRef]
- Montojo, J.; Zuberi, K.; Rodriguez, H.; Kazi, F.; Wright, G.; Donaldson, S.L.; Morris, Q.; Bader, G.D. GeneMANIA Cytoscape plugin: Fast gene function predictions on the desktop. Bioinformatics 2010, 26, 2927–2928. [Google Scholar] [CrossRef]
- Smoot, M.E.; Ono, K.; Ruscheinski, J.; Wang, P.L.; Ideker, T. Cytoscape 2.8: New features for data integration and network visualization. Bioinformatics 2011, 27, 431–432. [Google Scholar] [CrossRef] [PubMed] [Green Version]
- Boltaña, S. PAMPs, PRRs and the genomics of gram negative bacterial recognition in fish. Dev. Comp. Immunol. 2011, 35, 1195–1203. [Google Scholar] [CrossRef] [PubMed]
- Nombela, I.; Requena-Platek, R.; Morales-Lange, B.; Chico, V.; Puente-Marin, S.; Ciordia, S.; Mena, M.C.; Coll, J.; Perez, L.; Mercado, L.; et al. Rainbow Trout Red Blood Cells Exposed to Viral Hemorrhagic Septicemia Virus Up-Regulate Antigen-Processing Mechanisms and MHC I&II, CD86, and CD83 Antigen-presenting Cell Markers. Cells 2019, 8, 386. [Google Scholar] [CrossRef] [Green Version]
- DeLuca, D.; Wilson, M.; Warr, G.W. Lymphocyte heterogeneity in the trout, Salmo gairdneri, defined with monoclonal antibodies to IgM. Eur. J. Immunol. 1983, 13, 546–551. [Google Scholar] [CrossRef] [PubMed]


Publisher’s Note: MDPI stays neutral with regard to jurisdictional claims in published maps and institutional affiliations. |
© 2021 by the authors. Licensee MDPI, Basel, Switzerland. This article is an open access article distributed under the terms and conditions of the Creative Commons Attribution (CC BY) license (https://creativecommons.org/licenses/by/4.0/).
Share and Cite
Sanhueza, N.; Fuentes, R.; Aguilar, A.; Carnicero, B.; Vega, K.; Muñoz, D.; Contreras, D.; Moreno, N.; Troncoso, E.; Mercado, L.; et al. Behavioural Fever Promotes an Inflammatory Reflex Circuit in Ectotherms. Int. J. Mol. Sci. 2021, 22, 8860. https://doi.org/10.3390/ijms22168860
Sanhueza N, Fuentes R, Aguilar A, Carnicero B, Vega K, Muñoz D, Contreras D, Moreno N, Troncoso E, Mercado L, et al. Behavioural Fever Promotes an Inflammatory Reflex Circuit in Ectotherms. International Journal of Molecular Sciences. 2021; 22(16):8860. https://doi.org/10.3390/ijms22168860
Chicago/Turabian StyleSanhueza, Nataly, Ricardo Fuentes, Andrea Aguilar, Beatriz Carnicero, Karina Vega, David Muñoz, David Contreras, Nataly Moreno, Eduardo Troncoso, Luis Mercado, and et al. 2021. "Behavioural Fever Promotes an Inflammatory Reflex Circuit in Ectotherms" International Journal of Molecular Sciences 22, no. 16: 8860. https://doi.org/10.3390/ijms22168860