
Effect of Lipopolysaccharide-Induced Inflammatory Challenge on β-Glucuronidase Activity and the Concentration of Quercetin and Its Metabolites in the Choroid Plexus, Blood Plasma and Cerebrospinal Fluid

 , , , , ,
  , and
, and 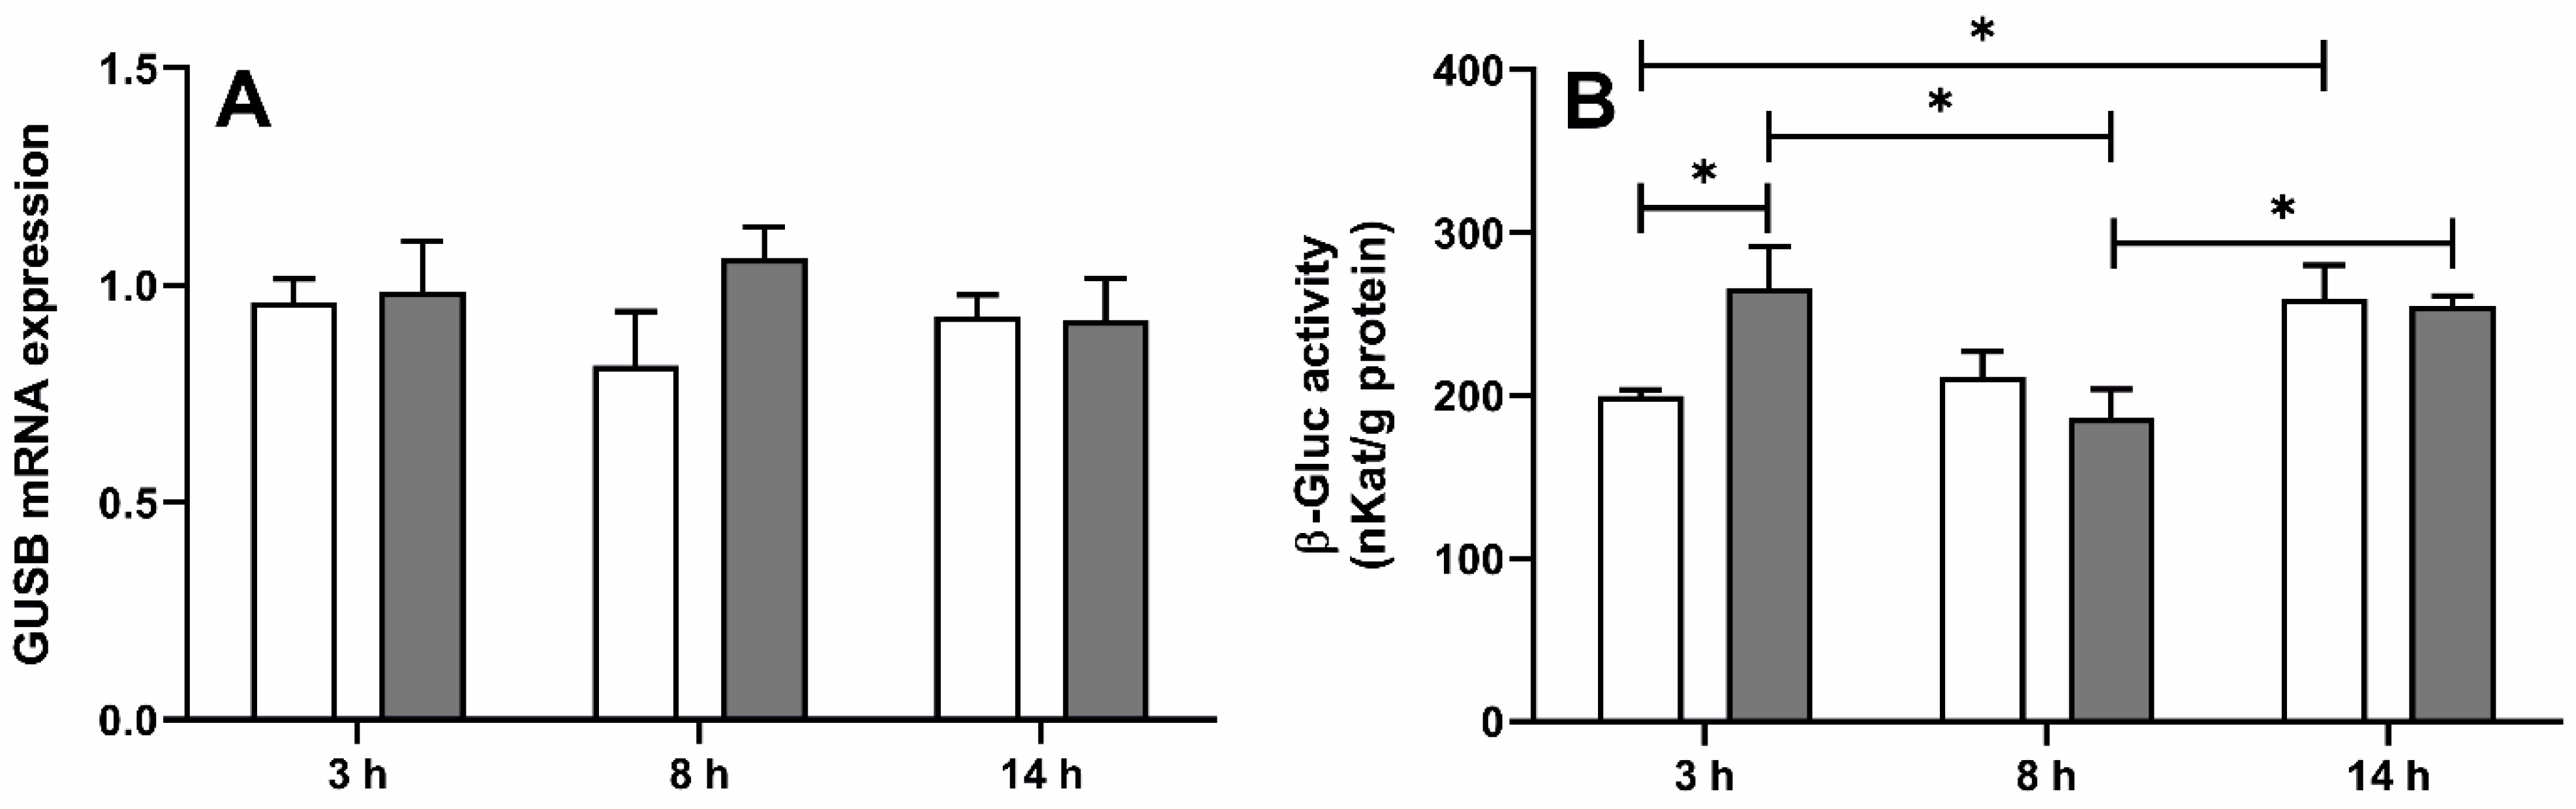
Abstract
:1. Introduction
2. Results
2.1. Effect of LPS-Induced Acute Inflammation on Gene Expression and Activity of β-Glucuronidase in the ChP (Exp. 1)
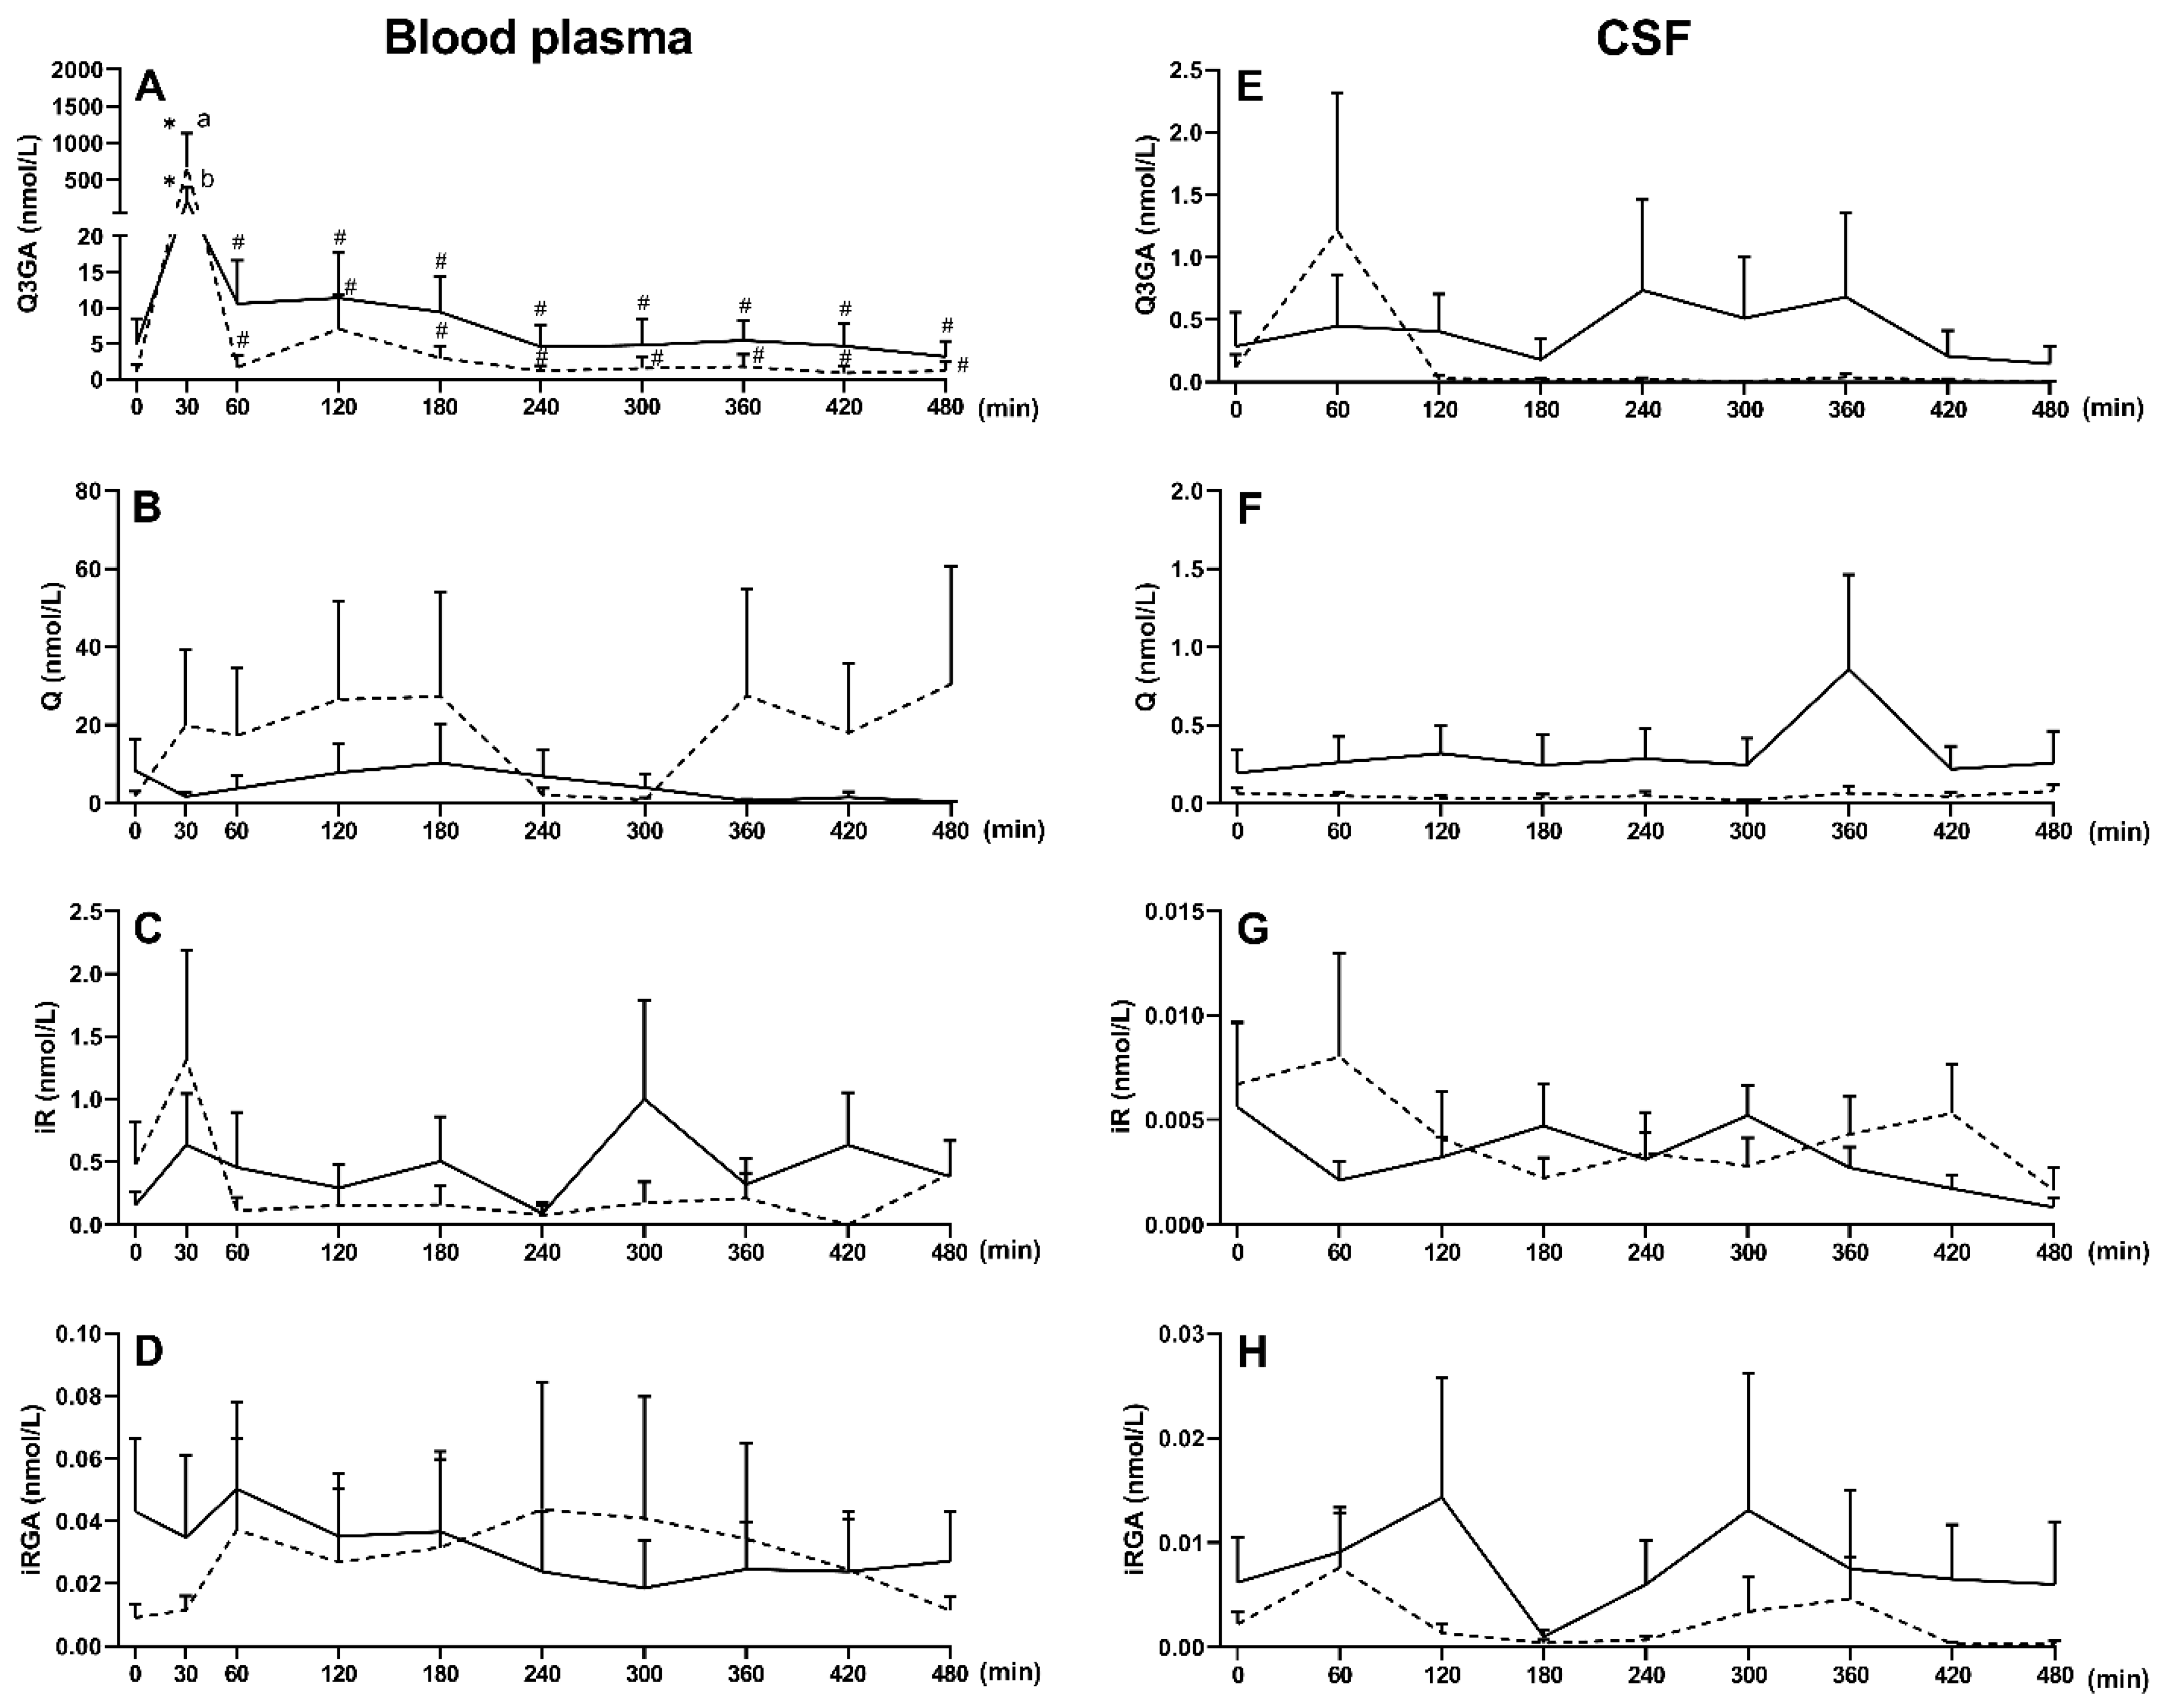
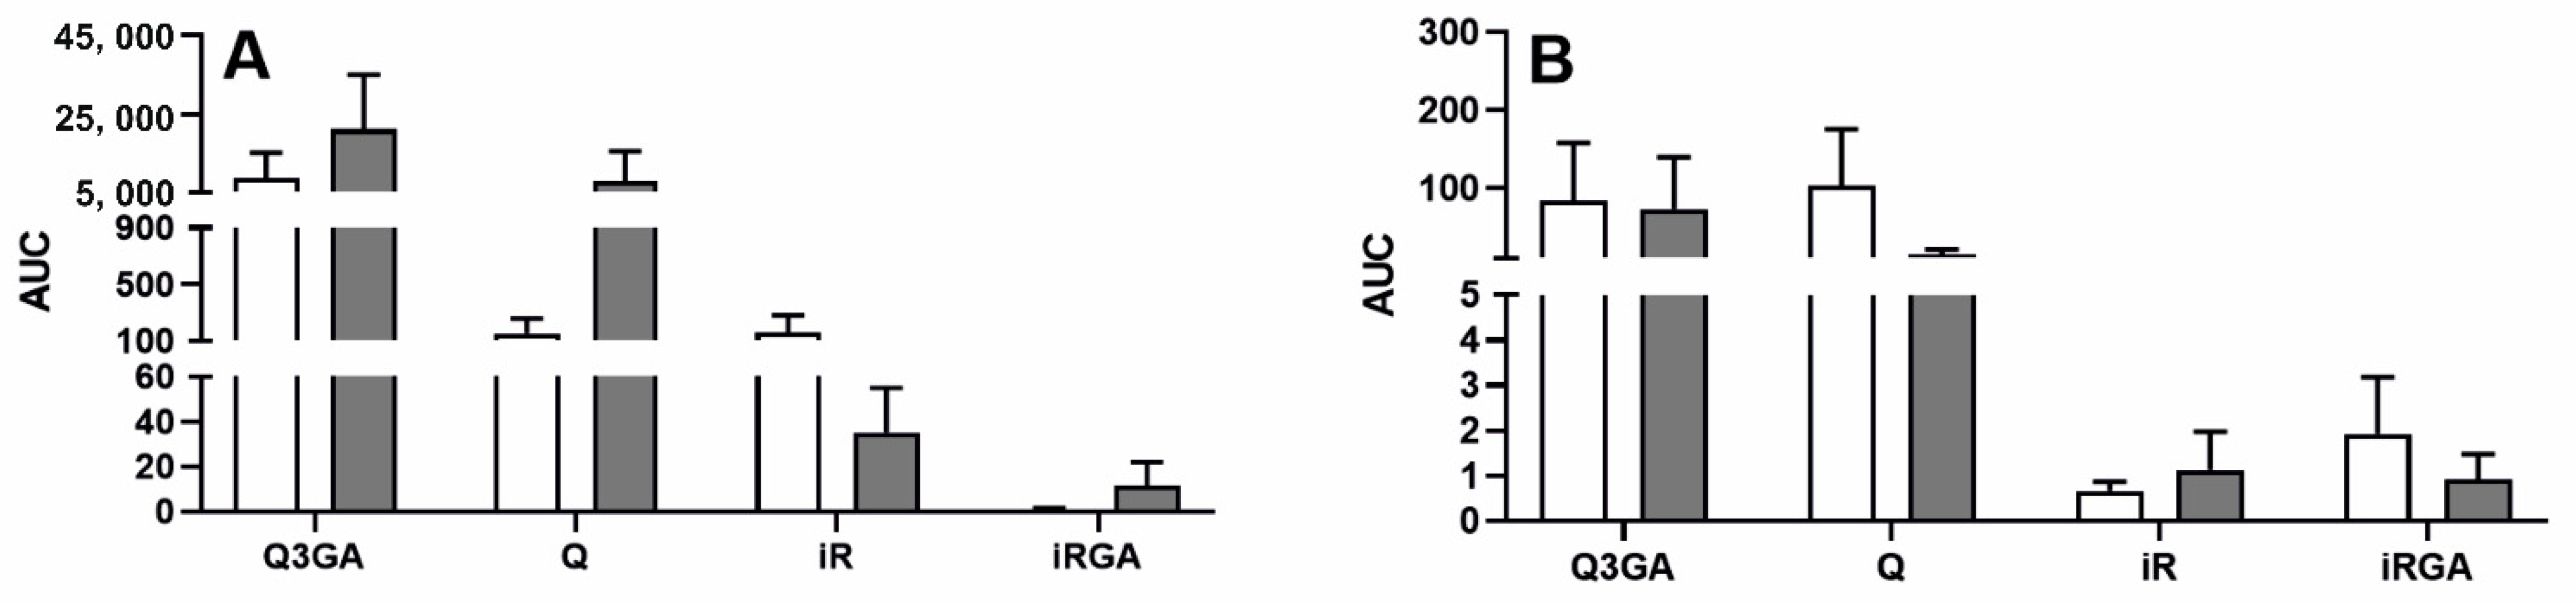
2.2. Effect of LPS-Induced Acute Inflammation on β-Glucuronidase Activity and the Concentration of Q and Its Phase II Metabolites in Blood Plasma and Cerebrospinal Fluid (Exp. 2)
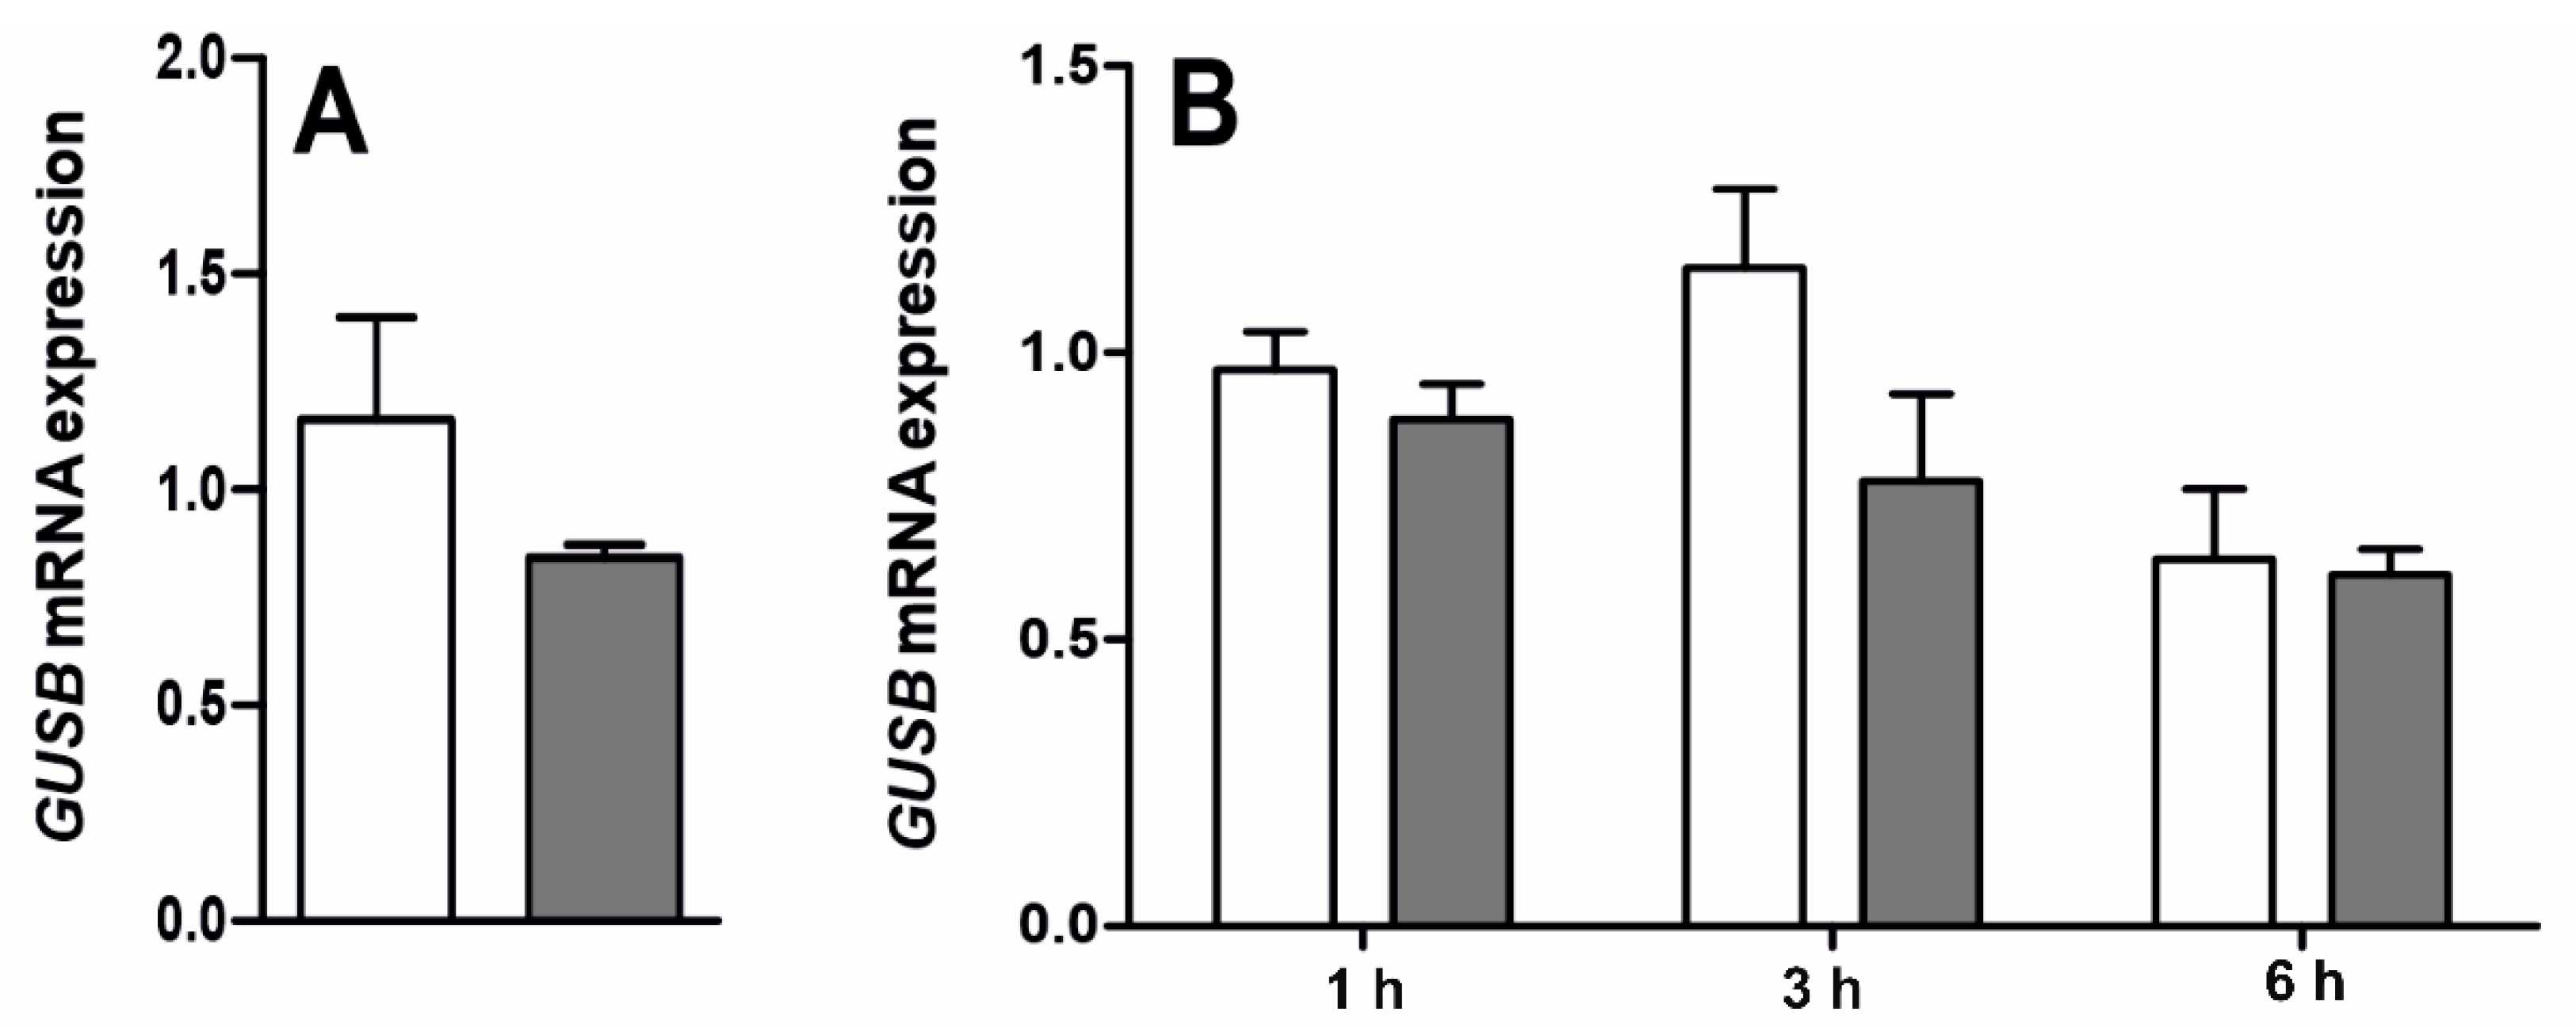
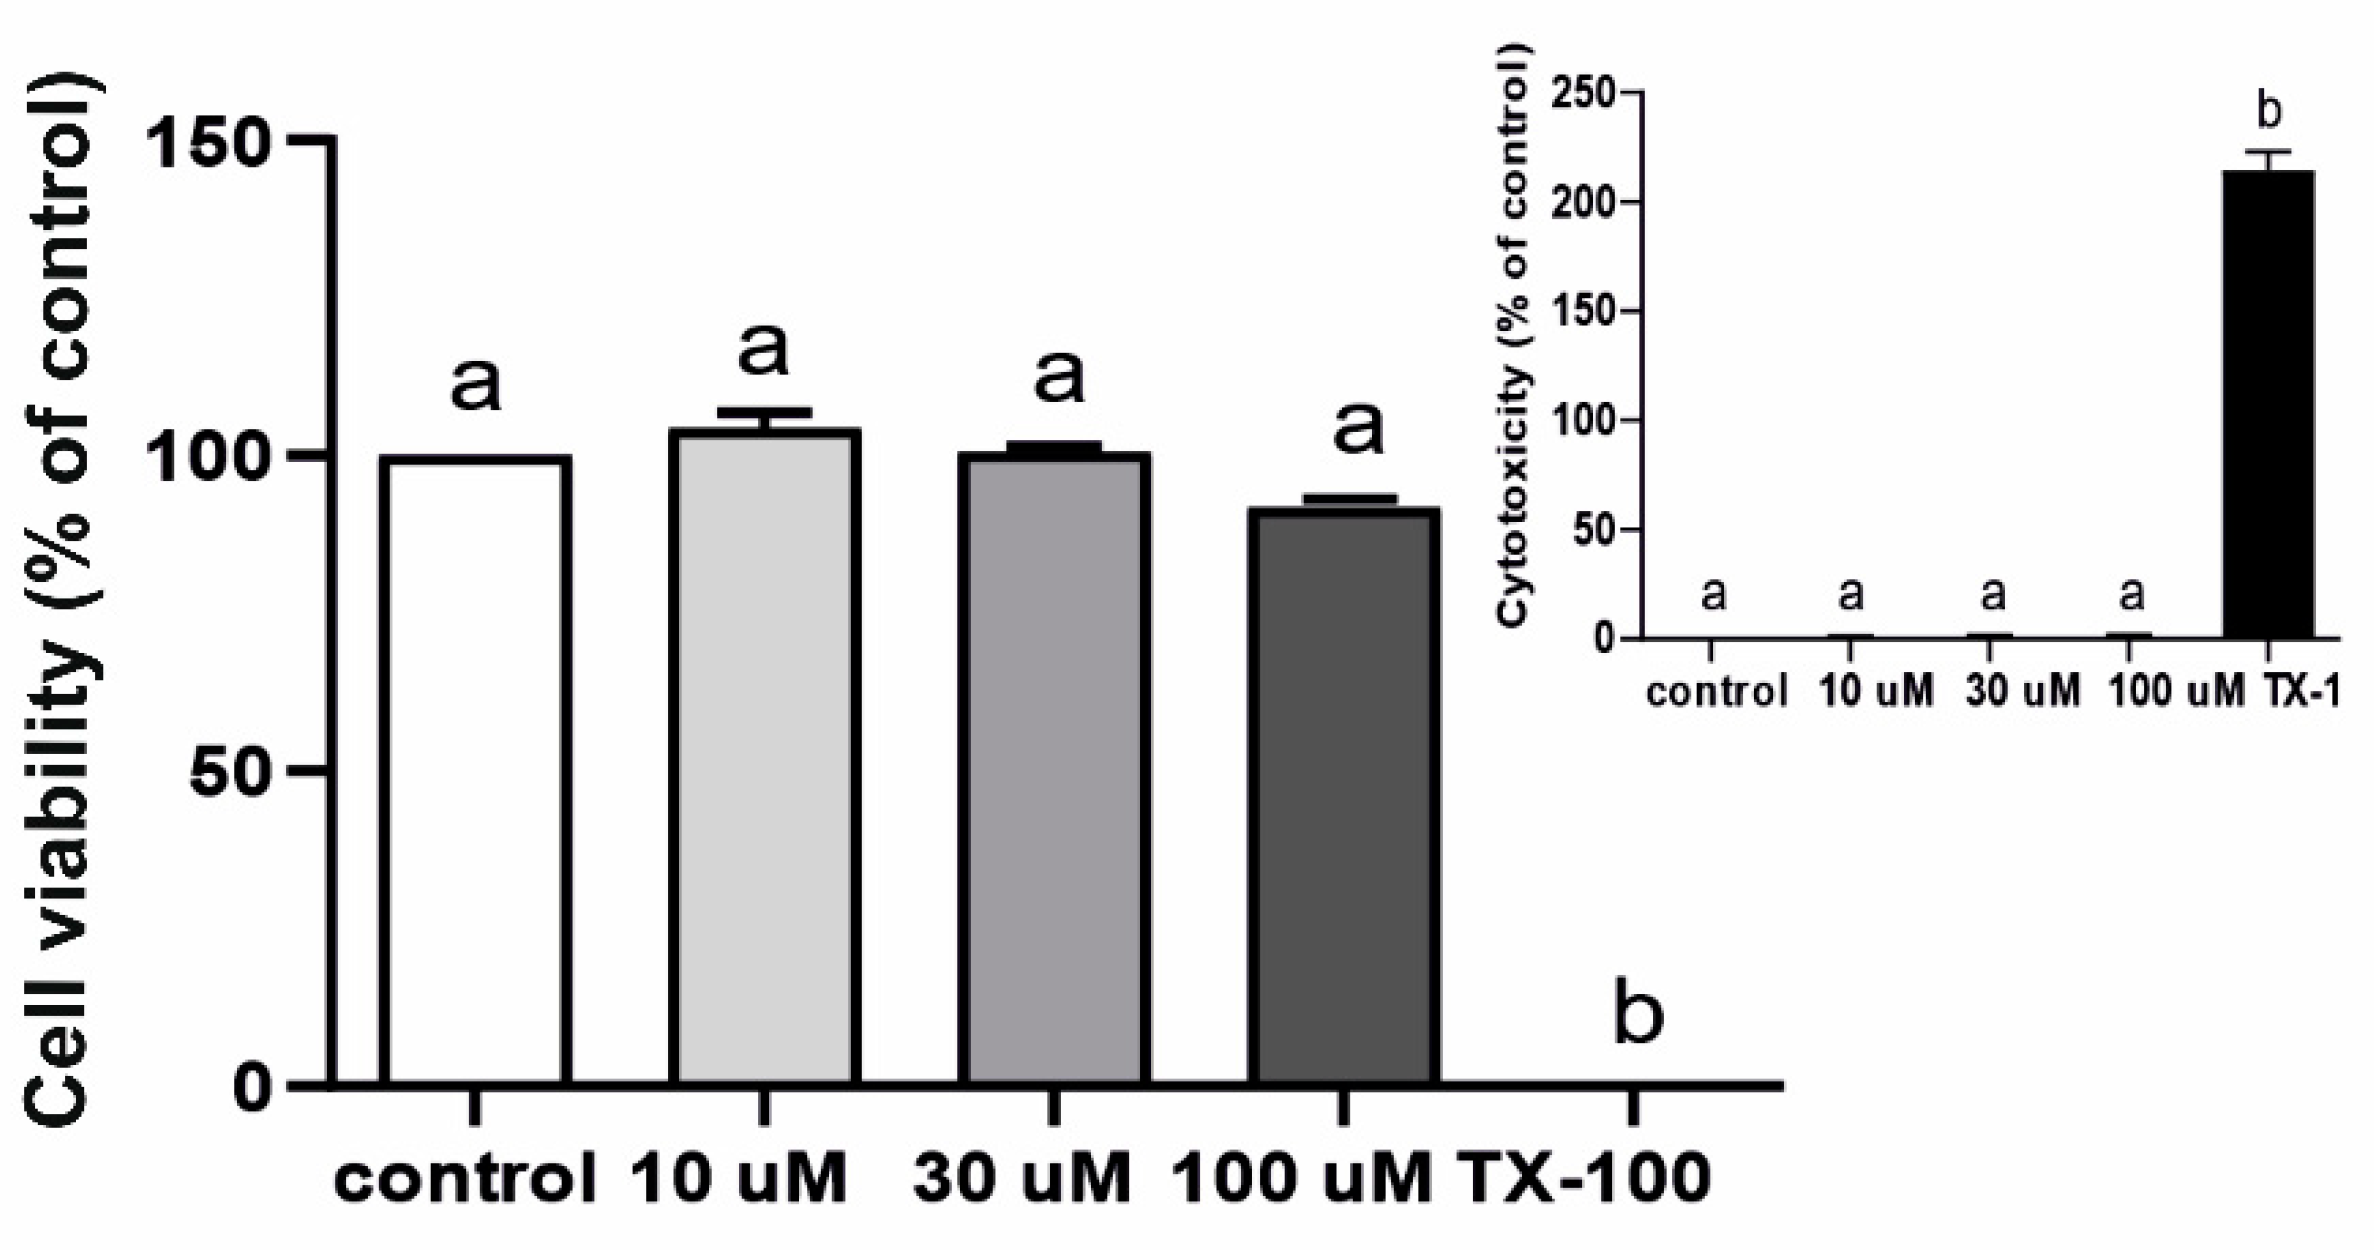
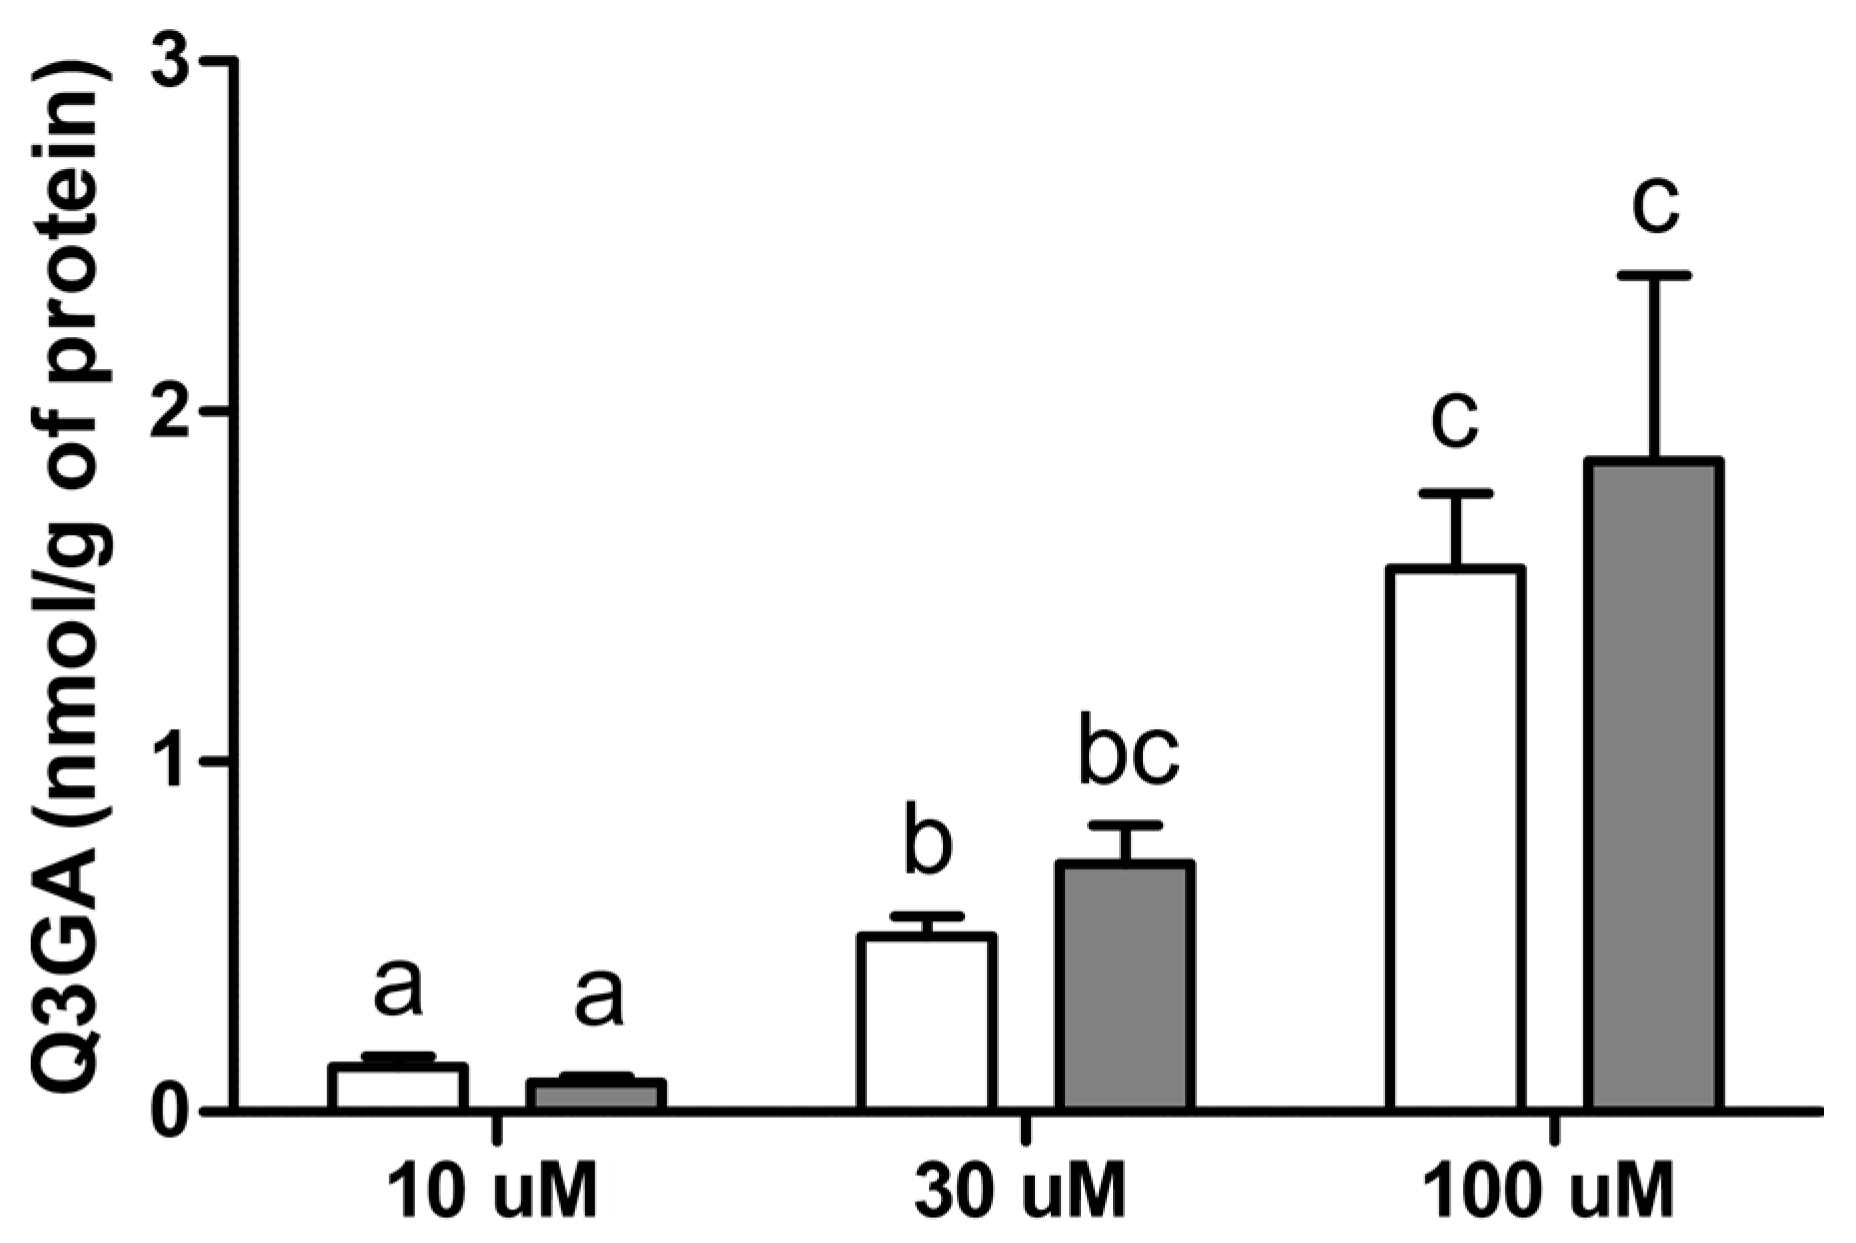
2.3. Effect of LPS on Gene Expression and Activity of β-Glucuronidase (Exp. 3) and Q3GA Accumulation in the Epithelial Cells of the Choroid Plexus In Vitro (Exp. 4)
3. Discussion
4. Materials and Methods
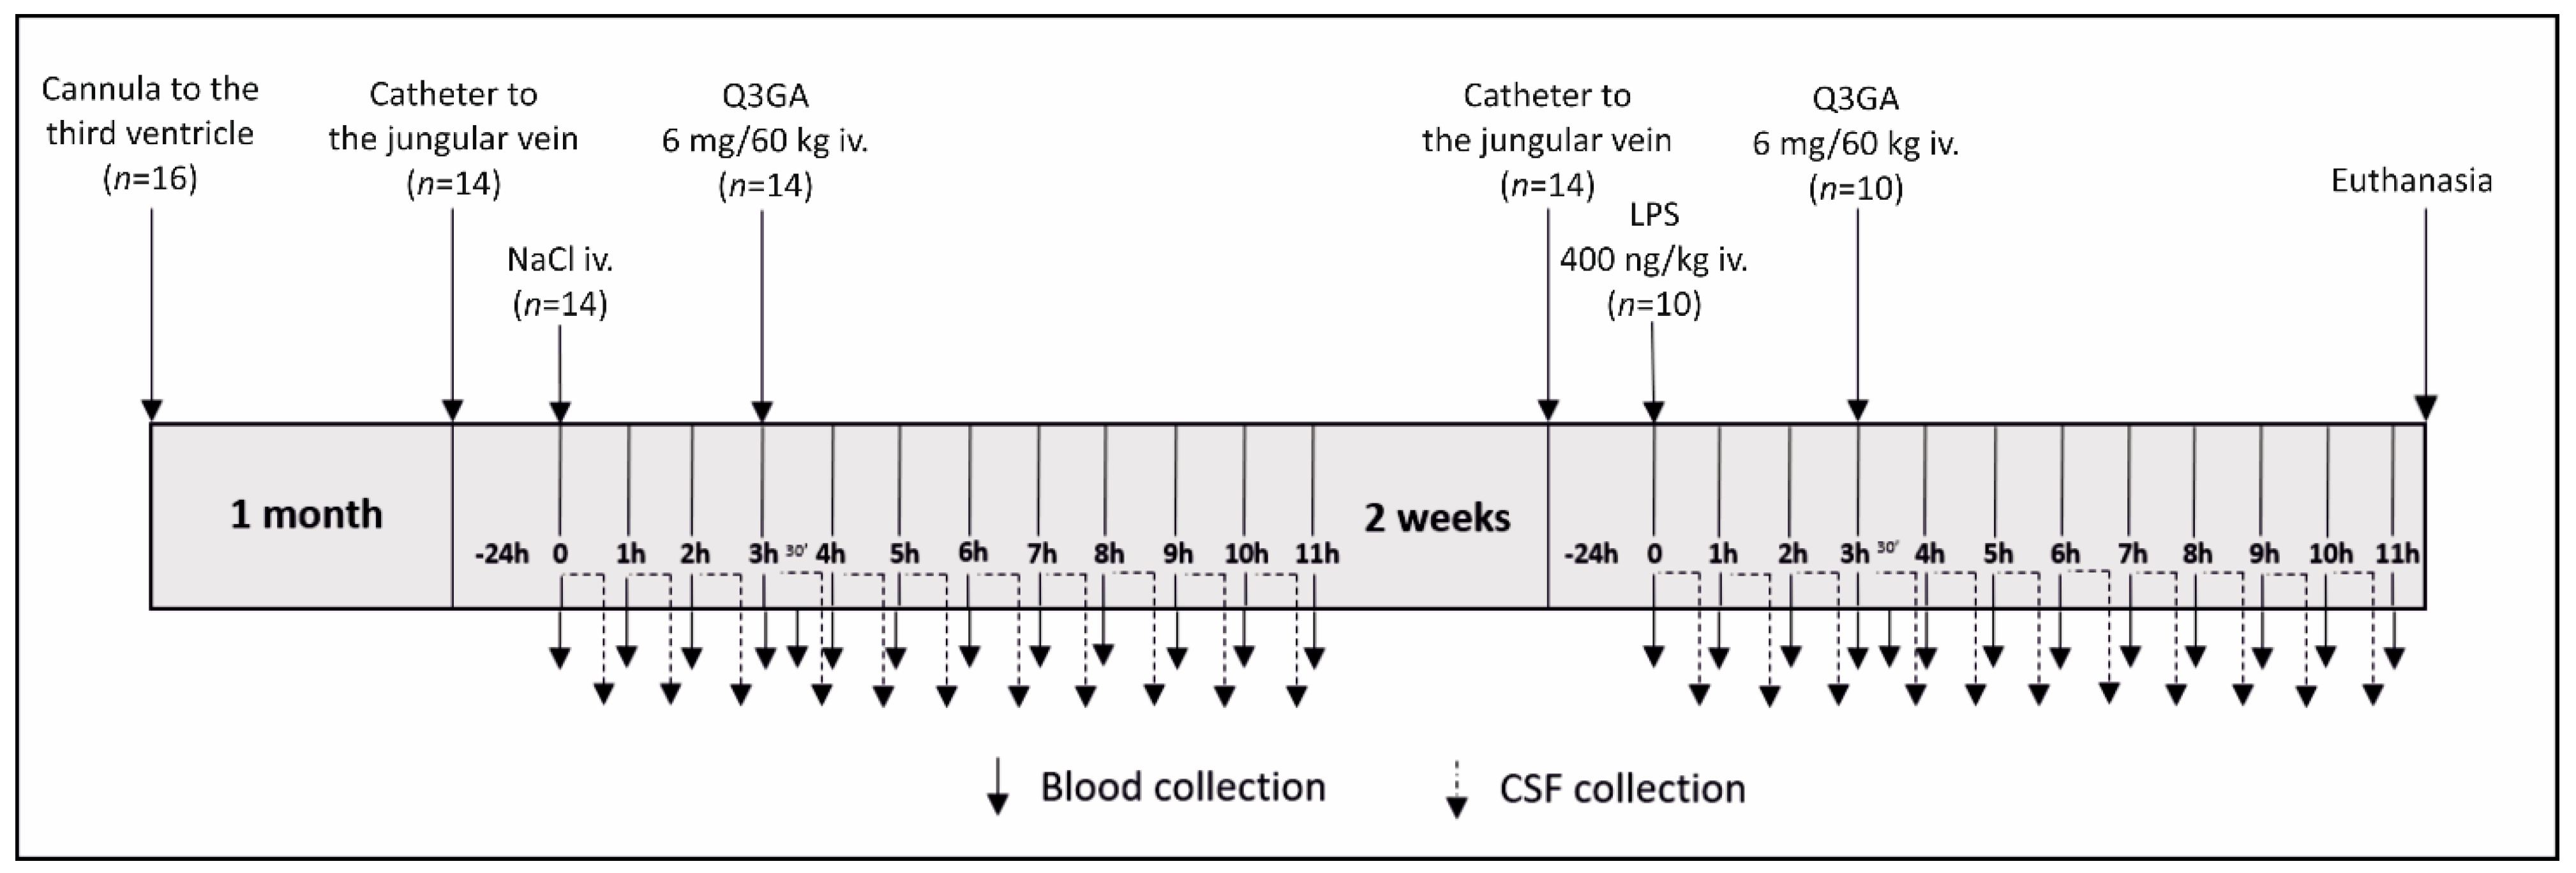
4.1. Animals and Experimental Design
4.2. Analytical Methods
4.2.1. Cortisol, Protein Level and β-Glucuronidase Activity
4.2.2. Cell Viability Assay (MTT) and Cytotoxicity Assay (LDH)
4.2.3. Western Blotting and CSF/Blood Plasma Quotient
4.2.4. Relative Gene Expression Assays
4.2.5. Analysis of Q and Its Metabolites with HPLC-MS/MS
4.3. Calculations and Statistical Analysis
Supplementary Materials
Author Contributions
Funding
Institutional Review Board Statement
Data Availability Statement
Acknowledgments
Conflicts of Interest
References
- Rice Evans, C.A.; Miller, N.J.; Paganga, G. Antioxidant properties of phenolic compounds. Trends Plant Sci. 1997, 2, 152–159. [Google Scholar] [CrossRef]
- Anand David, A.V.; Arulmoli, R.; Parasuraman, S. Overviews of biological importance of quercetin: A bioactive flavonoid. Pharmacogn. Rev. 2016, 10, 84–89. [Google Scholar]
- Chekalina, N.; Burmak, Y.; Petrov, Y.; Borisova, Z.; Manusha, Y.; Kazakov, Y.; Kaidashev, I. Quercetin reduces the transcriptional activity of NF-kB in stable coronary artery disease. Indian Heart J. 2018, 70, 593–597. [Google Scholar] [CrossRef]
- Halliwell, B. Oxidative stress and neurodegeneration: Where are we now? J. Neurochem. 2006, 97, 1634–1658. [Google Scholar] [CrossRef]
- Skipor, J.; Thiery, J.C. The choroid plexus-cerebrospinal fluid system: Under valuated pathway of neuroendocrine signaling into the brain. Acta Neurobiol. Exp. 2008, 68, 414–428. [Google Scholar]
- Youdim, K.A.; Qaiser, M.Z.; Begley, D.J.; Rice-Evans, C.A.; Abbott, N.J. Flavonoid permeability across an in situ model of the blood-brain barrier. Free Radic. Biol. Med. 2004, 36, 592–604. [Google Scholar] [CrossRef] [PubMed]
- Faria, A.; Pestana, D.; Teixeira, D.; Azevedo, J.; De Freitas, V.; Mateus, N.; Calhau, C. Flavonoid transport across RBE4 cells: A blood-brain barrier model. Cell. Mol. Biol. Lett. 2010, 15, 234–241. [Google Scholar] [CrossRef]
- Day, A.J.; Mellon, F.; Barron, D.; Sarrazin, G.; Morgan, M.R.; Williamson, G. Human metabolism of dietary flavonoids: Identification of plasma metabolites of quercetin. Free Radic. Res. 2001, 35, 941–952. [Google Scholar] [CrossRef] [PubMed]
- Kroon, P.A.; Clifford, M.N.; Crozier, A.; Day, A.J.; Donovan, J.L.; Manach, C.; Williamson, G. How should we assess the effects of exposure to dietary polyphenols in vitro? Am. J. Clin. Nutr. 2004, 80, 15–21. [Google Scholar] [CrossRef] [PubMed]
- Kawai, Y.; Nishikawa, T.; Shiba, Y.; Saito, S.; Murota, K.; Shibata, N.; Kobayashi, M.; Kanayama, M.; Uchida, K.; Terao, J. Macrophage as a target of quercetin glucuronides in human atherosclerotic arteries: Implication in the anti-atherosclerotic mechanism of dietary flavonoids. J. Biol. Chem. 2008, 283, 9424–9434. [Google Scholar] [CrossRef] [Green Version]
- Murota, K.; Hotta, A.; Ido, H.; Kawai, Y.; Moon, J.H.; Sekido, K.; Hayashi, H.; Inakuma, T.; Terao, J. Antioxidant capacity of albumin-bound quercetin metabolites after onion consumption in humans. J. Med. Investig. 2007, 54, 370–374. [Google Scholar] [CrossRef] [Green Version]
- Menendez, C.; Duenas, M.; Galindo, P.; Gonzalez-Manzano, S.; Jimenez, R.; Moreno, L.; Jose Zarzuelo, M.; Rodrıguez-Gomez, I.; Duarte, J.; Santos-Buelga, C.; et al. Vascular deconjugation of quercetin glucuronide: The flavonoid paradox revealed? Mol. Nutr. Food Res. 2011, 55, 1780–1790. [Google Scholar] [CrossRef] [PubMed]
- Almeida, F.A.; Borge, G.I.A.; Piskula, M.; Tudose, A.; Tudoreanu, L.; Valentová, K.; Williamson, G.; Santos, C.N. Bioavailability of quercetin in humans with a focus on interindividual variation. Compr. Rev. Food Sci. Food Saf. 2018, 17, 714–731. [Google Scholar] [CrossRef] [Green Version]
- Awolade, P.; Cele, N.; Kerru, N.; Gummidi, L.; Oluwakemi, E.; Singh, P. Therapeutic significance of β-glucuronidase activity and its inhibitors: A review. Eur. J. Med. Chem. 2020, 187, 111921. [Google Scholar] [CrossRef]
- Perez, A.; Gonzalez-Manzano, S.; Jimenez, R.; Perez-Abud, R.; Haro, J.M.; Osuna, A.; Santos-Buelga, C.; Duarte, J.; Perez-Vizcaino, F. The flavonoid quercetin induces acute vasodilator effects in healthy volunteers: Correlation with beta-glucuronidase activity. Pharmacol. Res. 2014, 89, 11–18. [Google Scholar] [CrossRef] [PubMed]
- Wiczkowski, W.; Skipor, J.; Misztal, T.; Szawara-Nowak, D.; Topolska, J.; Piskula, M.K. Quercetin and isorhamnetin aglycones are the main metabolites of dietary quercetin in cerebrospinal fluid. Mol. Nutr. Food Res. 2015, 59, 1088–1094. [Google Scholar] [CrossRef] [PubMed]
- Waltimo, O.; Talanti, S. Histochemical localization of beta-glucuronidase in the rat brain. Nature 1965, 205, 499–500. [Google Scholar] [CrossRef]
- Ishisaka, A.; Mukai, R.; Terao, J.; Shibata, N.; Kawai, Y. Specific localization of quercetin-3-O-glucuronide in human brain. Arch. Biochem. Biophys. 2014, 557, 11–17. [Google Scholar] [CrossRef]
- Meeker, R.B.; Williams, K.; Killebrew, D.A.; Hudson, L.C. Cell trafficking through the choroid plexus. Cell Adhes. Migr. 2012, 6, 390–396. [Google Scholar] [CrossRef] [Green Version]
- Ishisaka, A.; Kawabata, K.; Miki, S.; Shiba, Y.; Minekawa, S.; Nishikawa, T.; Mukai, R.; Terao, J.; Kawai, Y. Mitochondrial dysfunction leads to deconjugation of quercetin glucuronides in inflammatory macrophages. PLoS ONE 2013, 8, e80843. [Google Scholar]
- Marshal, T.; Shult, P.; Busse, W.W. Release of lysosomal enzyme beta-glucuronidase from isolated human eosinophils. J. Allergy Clin. Immunol. 1988, 82, 550–555. [Google Scholar] [CrossRef]
- Shimoi, K.; Saka, N.; Nozawa, R.; Sato, M.; Amano, I.; Nakayama, T.; Kinae, N. Deglucuronidation of a flavonoid, luteolin monoglucuronide, during inflammation. Drug Metab. Dispos. 2001, 29, 1521–1524. [Google Scholar]
- Petito, C.K.; Adkins, B. Choroid plexus selectively accumulates T-lymphocytes in normal controls and after peripheral immune activation. J. Neuroimmunol. 2005, 162, 19–27. [Google Scholar] [CrossRef] [PubMed]
- Mitchell, K.; Yang, H.-Y.T.; Berk, J.D.; Tran, J.H.; Iadarola, M.J. Monocyte chemoattractant Protein-1 in the choroid plexus: Apotential link between vascular pro-inflammatory mediators andthe CNS during peripheral tissue inflammation. Neuroscience 2009, 158, 885–895. [Google Scholar] [CrossRef] [PubMed] [Green Version]
- Skipor, J.; Misztal, T.; Piskuła, M.; Wiczkowski, W.; Thiery, J.-C. Phytoestrogens and thyroid hormone levels in the cerebrospinal fluid of ewes fed red clover silage. Small Ruminant Res. 2012, 102, 157–162. [Google Scholar] [CrossRef]
- Platosz, N.; Bączek, N.; Topolska, J.; Szawara-Nowak, D.; Misztal, T.; Wiczkowski, W. The blood–cerebrospinal fluid barrier is selective for red cabbage anthocyanins and their metabolites. J. Agric. Food Chem. 2020, 68, 8274–8285. [Google Scholar] [CrossRef]
- Płatosz, N.; Bączek, N.; Topolska, J.; Szawara-Nowak, D.; Skipor, J.; Milewski, S.; Wiczkowski, W. Chokeberry anthocyanins and their metabolites ability to cross the blood-cerebrospinal fluid barrier. Food Chem. 2021, 346, 128730. [Google Scholar] [CrossRef] [PubMed]
- Skipor, J.; Kowalewska, M.; Szczepkowska, A.; Majewska, A.; Misztal, T.; Jalynski, M.; Herman, A.P.; Zabek, K. Plasma and cerebrospinal fluid interleukin-1β during lipopolysaccharide-induced systemic inflammation in ewes implanted or not with slow-release melatonin. J. Anim. Sci. Biotechnol. 2017, 8, 76. [Google Scholar] [CrossRef] [Green Version]
- Kowalewska, M.; Herman, A.P.; Szczepkowska, A.; Skipor, J. The effect of melatonin from slow-release implants on basic and TLR-4-mediated gene expression of inflammatory cytokines and their receptors in the choroid plexus in ewes. Res. Vet. Sci. 2017, 113, 50–55. [Google Scholar] [CrossRef] [PubMed]
- Kowalewska, M.; Szczepkowska, A.; Herman, A.P.; Pellicer-Rubio, M.T.; Jalynski, M.; Skipor, J. Melatonin from slow-release implants did not influence the gene expression of the lipopolysaccharide receptor complex in the choroid plexus of seasonally anoestrous adult ewes subjected or not to a systemic inflammatory stimulus. Small Rum. Res. 2017, 147, 1–7. [Google Scholar] [CrossRef]
- Herman, A.P.; Wojtulewicz, K.; Bochenek, J.; Krawczyńska, A.; Antushevich, H.; Pawlina, B.; Zielińska-Górska, M.; Herman, A.; Romanowicz, K.; Tomaszewska-Zaremba, D. Endotoxin-induced inflammation disturbs melatonin secretion in ewe. Asian-Australas. J. Anim. Sci. 2017, 30, 1784–1795. [Google Scholar] [CrossRef] [PubMed] [Green Version]
- Marques, F.; Sousa, J.C.; Coppola, G.; Falcao, A.M.; Rodrigues, A.J.; Geschwind, D.H.; Sousa, N.; Correia-Neves, M.; Palha, J.A. Kinetic profile of the transcriptome changes induced in the choroid plexus by peripheral inflammation. J. Cereb. Blood Flow Metab. 2009, 29, 921–932. [Google Scholar] [CrossRef] [Green Version]
- Szmydynger-Chodobska, J.; Chodobski, A.; Johanson, C.E. Postnatal developmental changes in blood flow to choroid plexuses and cerebral cortex of the rat. Am. J. Physiol. 1994, 266, R1488–R1492. [Google Scholar] [CrossRef] [PubMed]
- Shimoi, K.; Nakayama, T. Glucuronidase deconjugation in inflammation. Methods Enzymol. 2005, 400, 263–272. [Google Scholar] [PubMed]
- Kawabata, K.; Mukai, R.; Ishisaka, A. Quercetin and related polyphenols: New insights and implications for their bioactivity and bioavailability. Food Funct. 2015, 6, 1399–4117. [Google Scholar] [CrossRef] [PubMed]
- Beratis, N.G.; Mavrommatis, T.; Hatiris, I.; Kavaliotis, J.; Tsagaropoulou-Stiga, H.; Syrogiannopoulos, G.A. Increased activity of lysosomal acid hydrolases in the cell-free cerebrospinal fluid of bacterial meningitis. Pediatr. Res. 1997, 41, 235–241. [Google Scholar] [CrossRef] [PubMed] [Green Version]
- Long, J.F.; Jacoby, R.O.; Olson, M.; Koestner, A. Beta-glucuronidase activity, and levels of protein and protein fractions in serum and cerebrospinal fluid of dogs with distemper associated demyelinating encephalopathy. Acta Neuropathol. 1973, 25, 179–187. [Google Scholar] [CrossRef] [PubMed]
- Ishisaka, A.; Ichikawa, S.; Sakakibara, H.; Piskula, M.K.; Nakamura, T.; Kato, Y.; Ito, M.; Miyamoto, K.; Tsuji, A.; Kawai, Y.; et al. Accumulation of orally administered quercetin in brain tissue and its antioxidative effects in rats. Free Radic. Biol. Med. 2011, 51, 1329–1336. [Google Scholar] [CrossRef]
- Skipor, J.; Misztal, T.; Szczepkowska, A. Thyroid hormones in the cerebrospinal fluid of the third ventricle of adult female sheep during different periods of reproductive activity. Pol. J. Vet. Sci. 2010, 13, 587–595. [Google Scholar]
- Ishiwata, I.; Ishiwata, C.; Ishiwata, E.; Sato, Y.; Kiguchi, K.; Tachibana, T.; Hashimoto, H.; Ishikawa, H. Establishment and characterization of a human malignant choroids plexus papilloma cell line (HIBCPP). Hum. Cell 2005, 18, 67–72. [Google Scholar] [CrossRef]
- Monnot, A.D.; Zheng, W. Culture of choroid plexus epithelial cells and in vitro model of blood–CSF barrier. Methods Mol. Biol. 2013, 945, 13–29. [Google Scholar] [PubMed] [Green Version]
- Borkowski, J.; Li, L.; Steinmann, U.; Quednau, N.; Stump-Guthier, C.; Weiss, C.; Findeisen, P.; Gretz, N.; Ishikawa, H.; Tenenbaum, T.; et al. Neisseria meningitidis elicits a pro-inflammatory response involving IκBζ in a human blood-cerebrospinal fluid barrier model. J. Neuroinflamm. 2014, 11, 163. [Google Scholar] [CrossRef] [Green Version]
- Kokot, F. Metody Radioimmunologiczne i Radiokompetycyjne Stosowane w Klinice; Państwowy Zakład Wydawnictw Lekarskich: Warsaw, Poland, 1985. [Google Scholar]
- Chojnowska, S.; Zalewska, A.; Knaś, M.; Waszkiewicz, N.; Waszkiel, D.; Kossakowska, A.; Zwierz, K. Determination of lysosomal exoglycosidases in human saliva. Acta Biochim. Pol. 2014, 61, 85–90. [Google Scholar] [CrossRef] [PubMed]
- Chojnowska, S.; Ptaszynska-Sarosiek, I.; Kepka, A.; Szajda, S.D.; Waszkiewicz, N.; Zwierz, K. Optymization of the method for α-L-fucosidase, β-D-galactosidase and β-D-glucuronidase determination in serum from hemolyzed blood. Adv. Med. Sci. 2018, 63, 306–311. [Google Scholar] [CrossRef] [PubMed]
- Peinnequin, A.; Mouret, C.; Birot, O.; Alonso, A.; Mathieu, J.; Clarençon, D.; Agay, D.; Chancerelle, Y.; Multon, E. Rat pro-inflammatory cytokine and cytokine related mRNA quantification by real-time polymerase chain reaction using SYBR green. BMC Immunol. 2004, 5, 3. [Google Scholar] [CrossRef] [Green Version]
- Malik, I.A.; Moriconi, F.; Sheikh, N.; Naz, N.; Khan, S.; Dudas, J.; Mansuroglu, T.; Hess, C.F.; Rave-Fränk, M.; Christiansen, H.; et al. Single-dose gamma-irradiation induces up-regulation of chemokine gene expression and recruitment of granulocytes into the portal area but not into other regions of rat hepatic tissue. Am. J. Pathol. 2010, 176, 1801–1815. [Google Scholar] [CrossRef] [Green Version]
- Zheng, F.; Kim, Y.J.; Moran, T.H.; Li, H.; Bi, S. Central transthyretin acts to decrease food intake and body weight. Sci. Rep. 2016, 6, 24238. [Google Scholar] [CrossRef] [Green Version]
- Bonefeld, B.E.; Elfving, B.; Wegener, G. Reference genes for normalization: A study of rat brain tissue. Synapse 2008, 62, 302–309. [Google Scholar] [CrossRef]
- Takizawa, N.; Tanaka, S.; Oe, S.; Koike, T.; Matsuda, T.; Yamada, H. Hypothalamo-hypophysial system in rats with autotransplantation of the adrenal cortex. Mol. Med. Rep. 2017, 15, 3215–3221. [Google Scholar] [CrossRef]
- Langnaese, K.; John, R.; Schweizer, H.; Ebmeyer, U.; Keilhoff, G. Selection of reference genes for quantitative real-time PCR in a rat asphyxial cardiac arrest model. BMC Mol. Biol. 2008, 9, 53. [Google Scholar] [CrossRef] [PubMed] [Green Version]
- Szczepkowska, A.; Kowalewska, M.; Krawczyńska, A.; Herman, A.P.; Skipor, J. Photoperiod affects leptin action on the choroid plexus in ewes challenged with lipopolysaccharide—Study on the mRNA level. Int. J. Mol. Sci. 2020, 21, 7647. [Google Scholar] [CrossRef] [PubMed]
- Zhao, S.; Fernald, R.D. Comprehensive algorithm for quantitative real-time polymerase chain reaction. J. Comput. Biol. 2005, 12, 1047–1064. [Google Scholar] [CrossRef] [PubMed]


Publisher’s Note: MDPI stays neutral with regard to jurisdictional claims in published maps and institutional affiliations. |
© 2021 by the authors. Licensee MDPI, Basel, Switzerland. This article is an open access article distributed under the terms and conditions of the Creative Commons Attribution (CC BY) license (https://creativecommons.org/licenses/by/4.0/).
Share and Cite
Domżalska, M.; Wiczkowski, W.; Szczepkowska, A.; Chojnowska, S.; Misztal, T.; Walter, F.R.; Deli, M.A.; Ishikawa, H.; Schroten, H.; Schwerk, C.; et al. Effect of Lipopolysaccharide-Induced Inflammatory Challenge on β-Glucuronidase Activity and the Concentration of Quercetin and Its Metabolites in the Choroid Plexus, Blood Plasma and Cerebrospinal Fluid. Int. J. Mol. Sci. 2021, 22, 7122. https://doi.org/10.3390/ijms22137122
Domżalska M, Wiczkowski W, Szczepkowska A, Chojnowska S, Misztal T, Walter FR, Deli MA, Ishikawa H, Schroten H, Schwerk C, et al. Effect of Lipopolysaccharide-Induced Inflammatory Challenge on β-Glucuronidase Activity and the Concentration of Quercetin and Its Metabolites in the Choroid Plexus, Blood Plasma and Cerebrospinal Fluid. International Journal of Molecular Sciences. 2021; 22(13):7122. https://doi.org/10.3390/ijms22137122
Chicago/Turabian StyleDomżalska, Małgorzata, Wiesław Wiczkowski, Aleksandra Szczepkowska, Sylwia Chojnowska, Tomasz Misztal, Fruzsina R. Walter, Maria A. Deli, Hiroshi Ishikawa, Horst Schroten, Christian Schwerk, and et al. 2021. "Effect of Lipopolysaccharide-Induced Inflammatory Challenge on β-Glucuronidase Activity and the Concentration of Quercetin and Its Metabolites in the Choroid Plexus, Blood Plasma and Cerebrospinal Fluid" International Journal of Molecular Sciences 22, no. 13: 7122. https://doi.org/10.3390/ijms22137122