
Dual Mechanisms of Metabolism and Gene Expression of the CCRF-CEM Leukemia Cells under Glucocorticoid Treatment

 ,
, 

Abstract
:1. Introduction
1.1. Glucocorticoids and Apoptosis Resistance
1.2. Tumor Metabolomics
1.3. GC-Induced Apoptosis Resistance and High Throughput Methodologies
1.4. Scope of the Present Work
2. Results
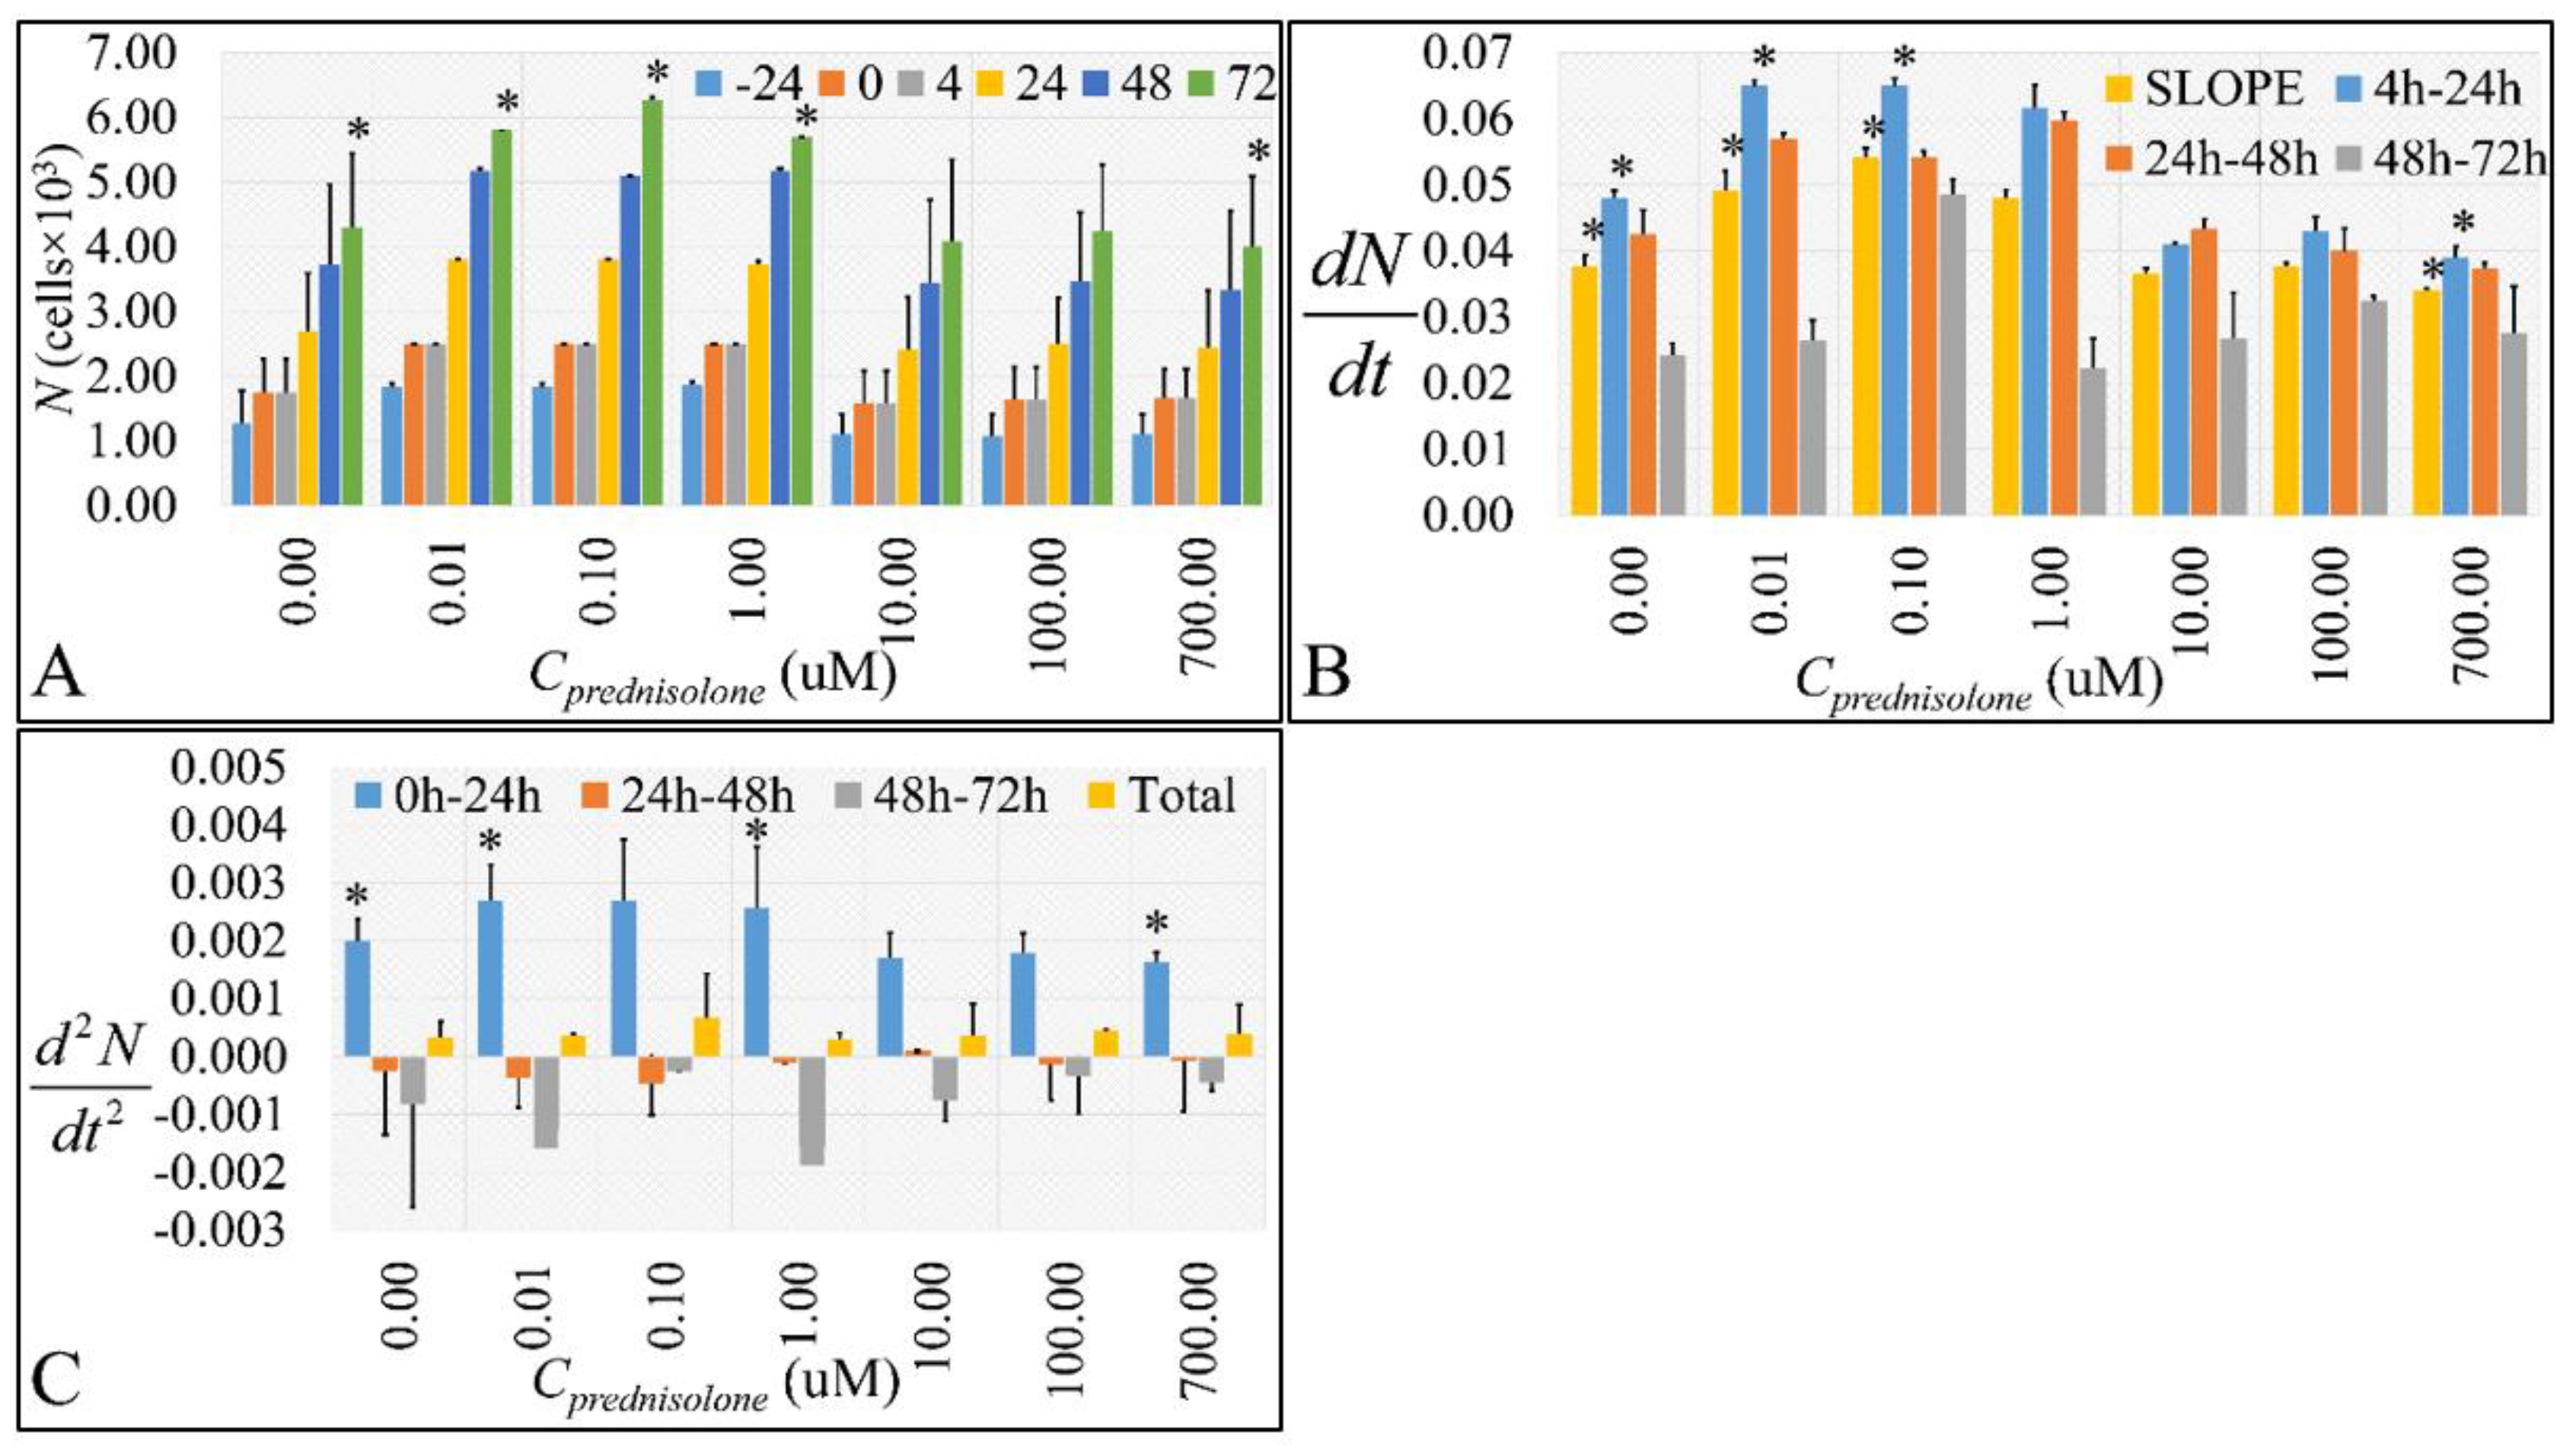
2.1. Cell Proliferation, Growht Rate, Growth Acceleration
2.2. Cell Biological Properties
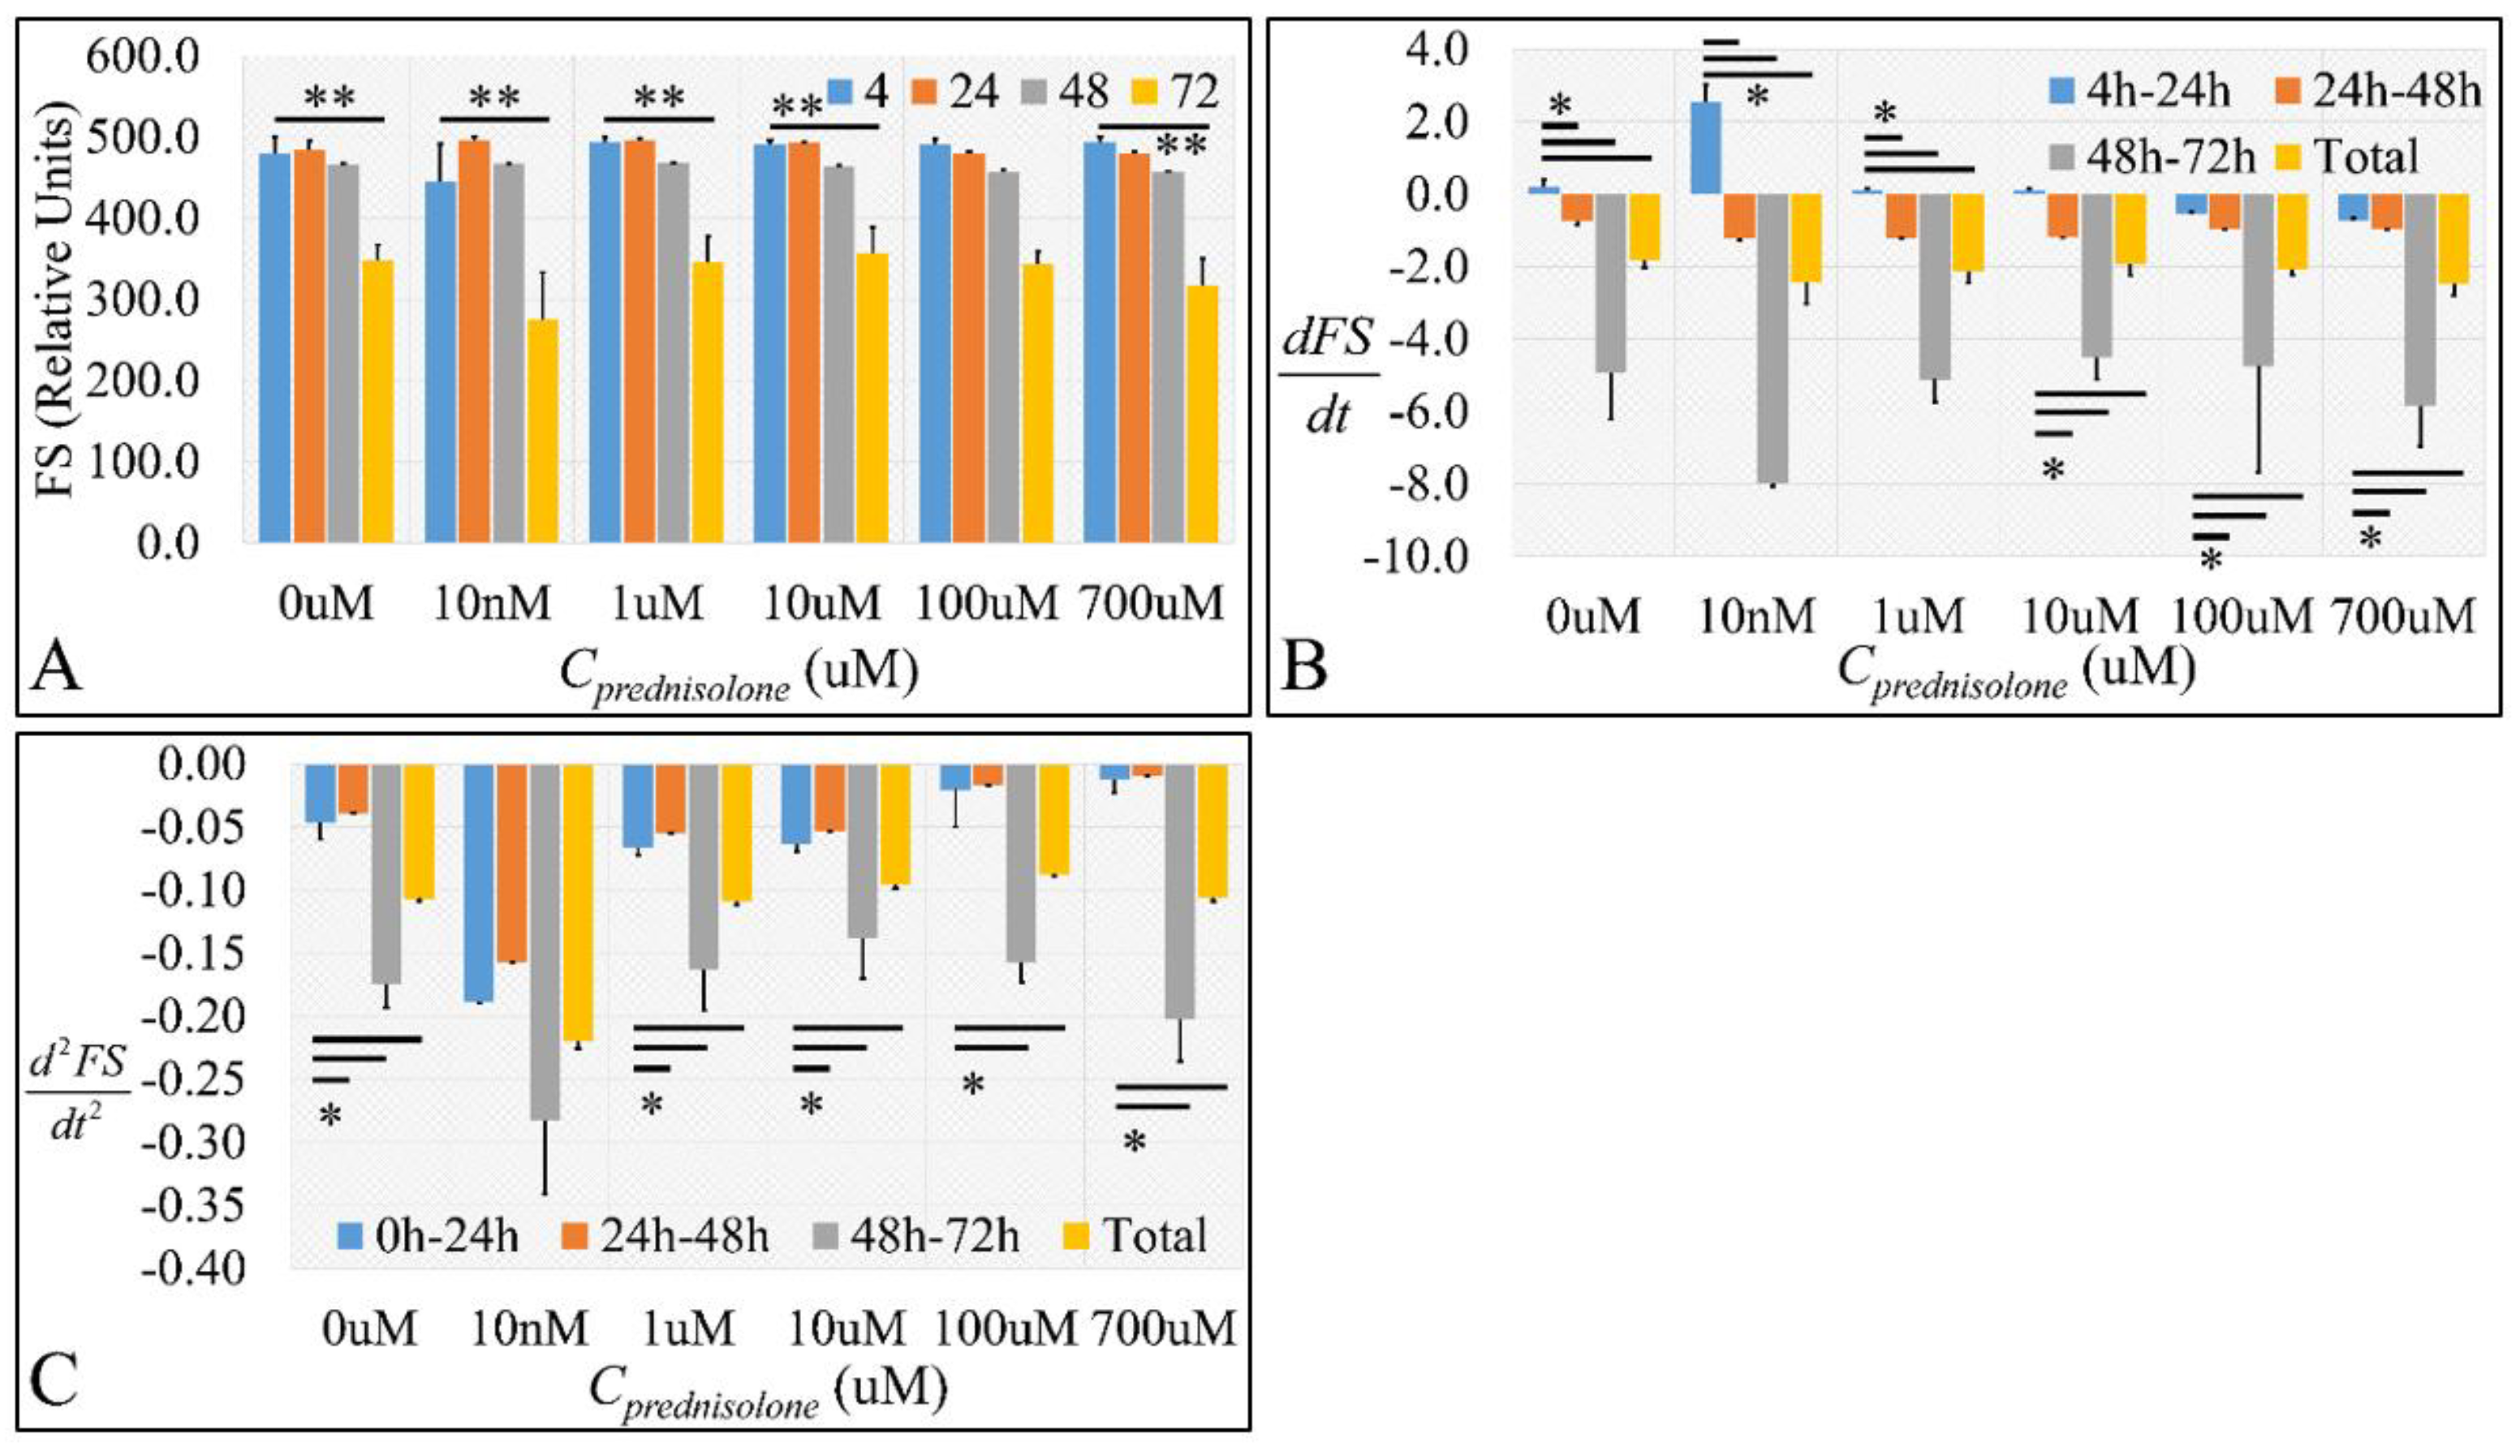
2.2.1. Cell Size
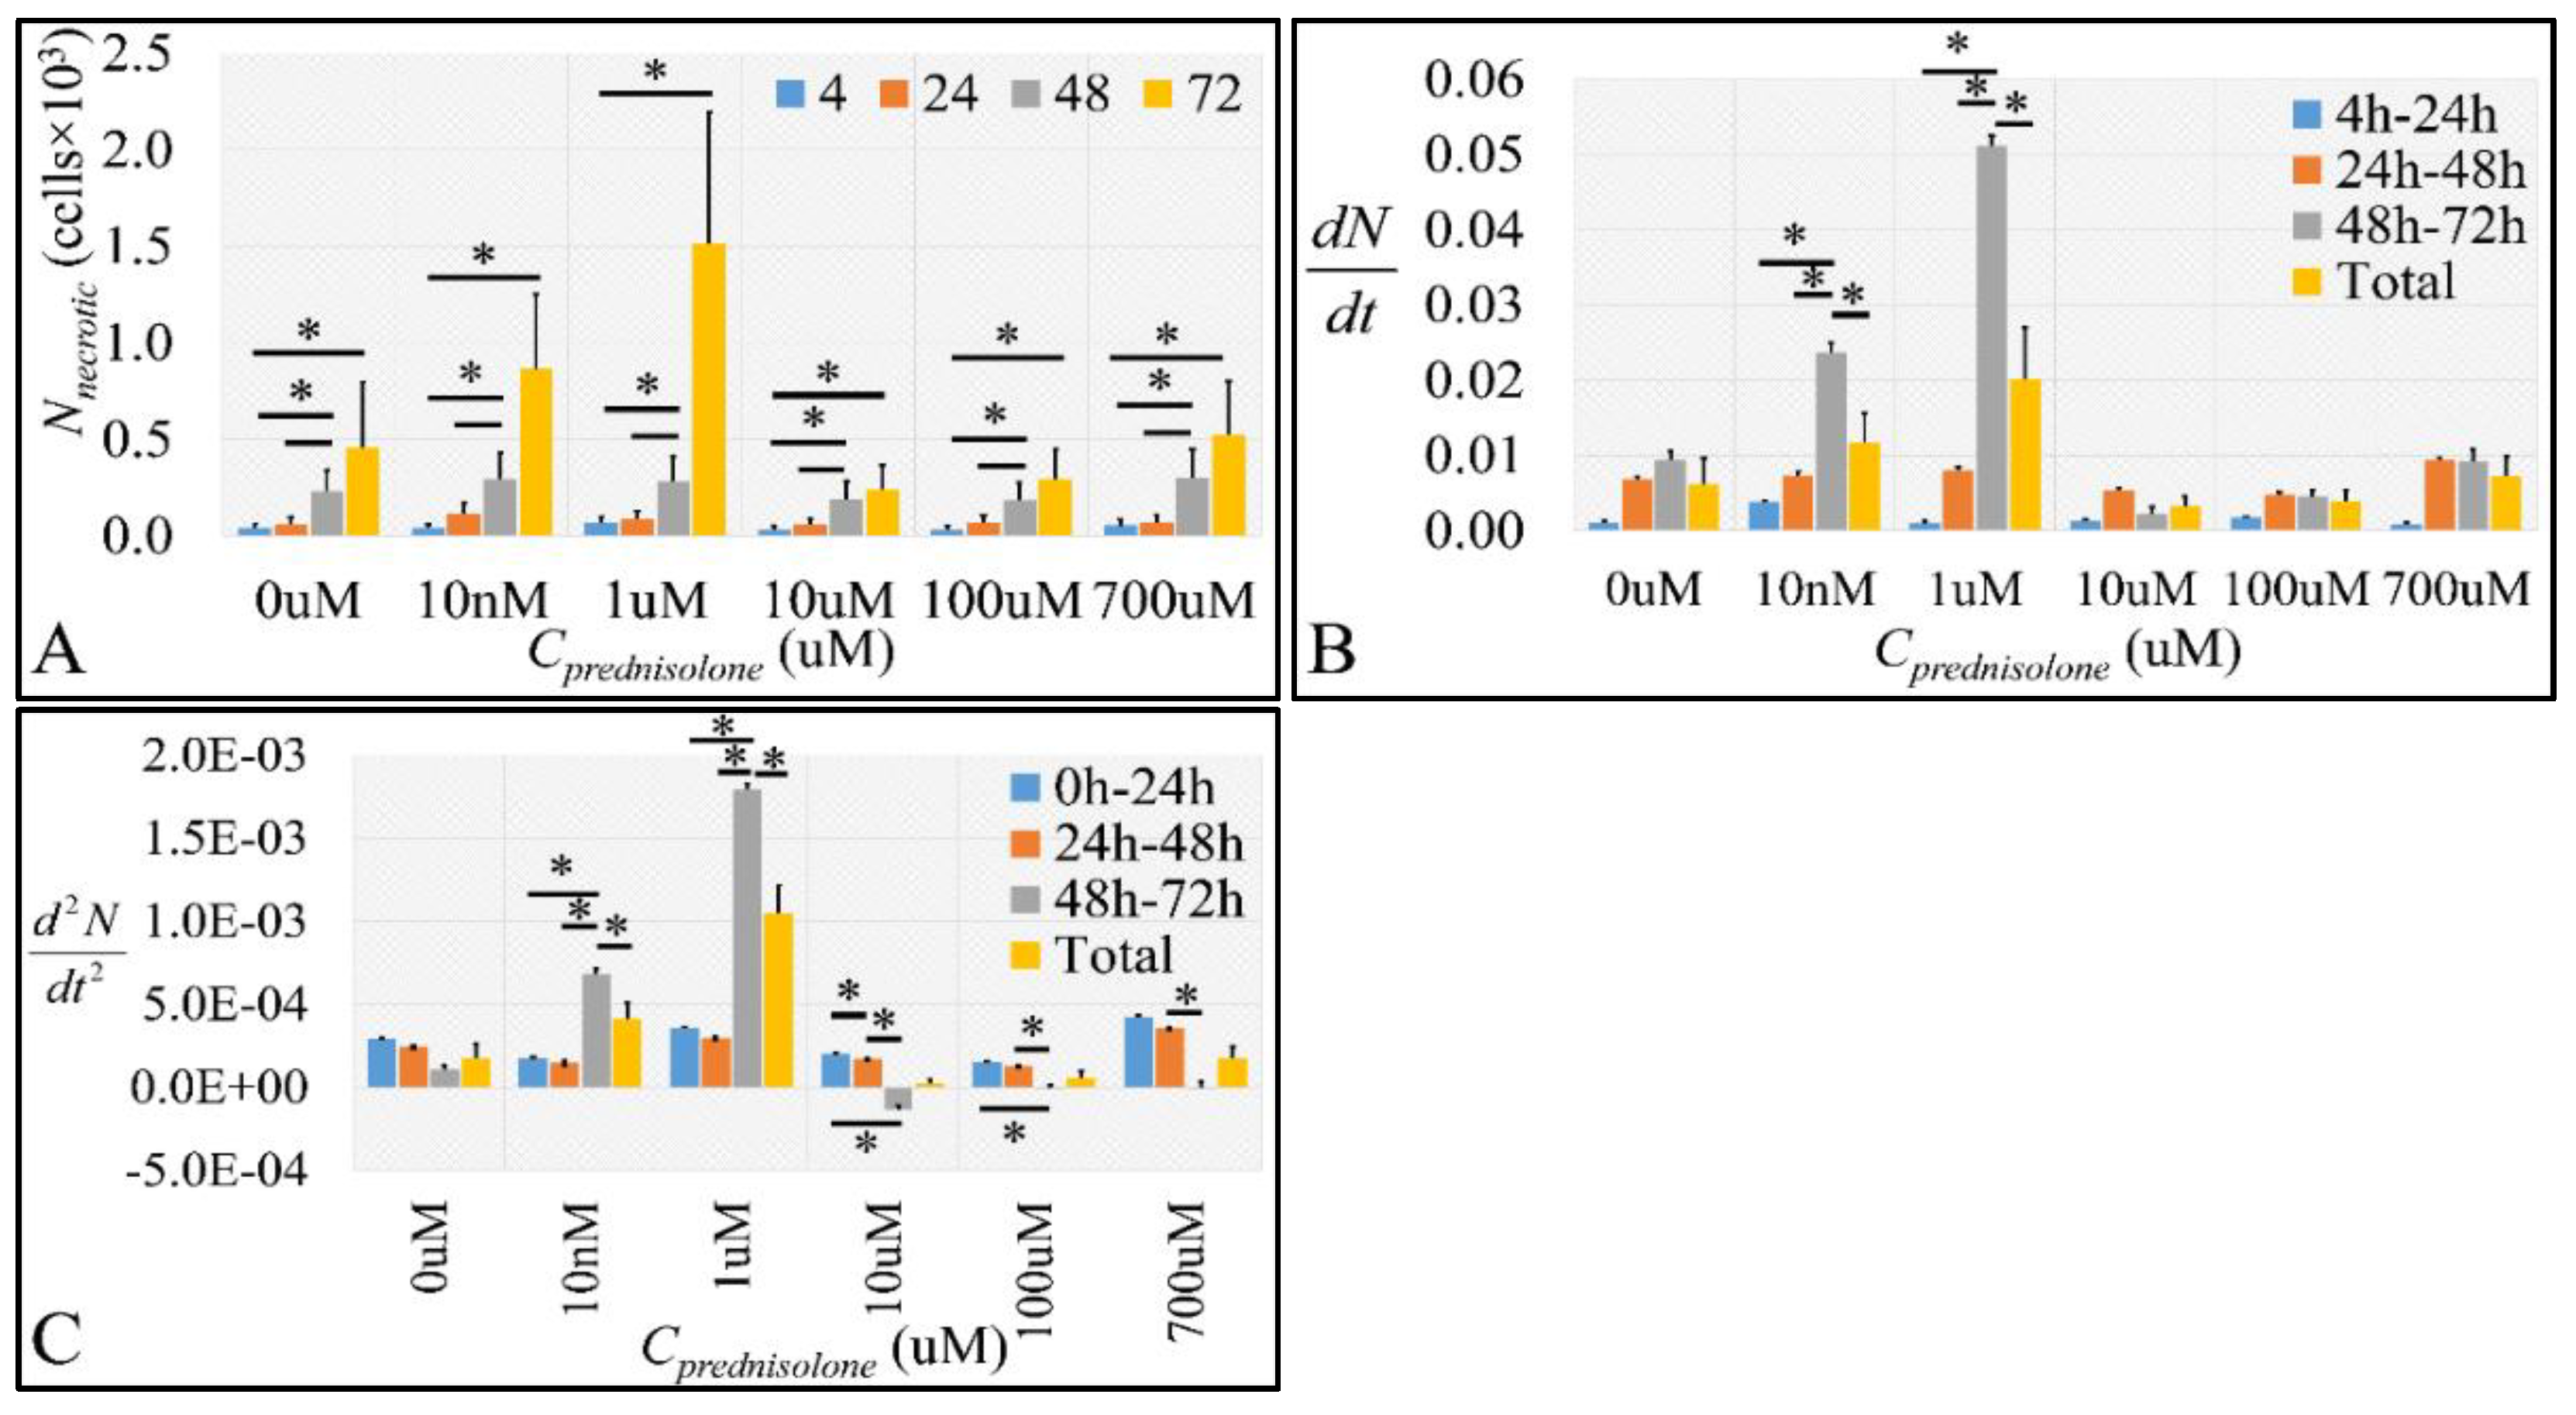
2.2.2. The Discrimination of Cell Populations Based on Prednisolone’s Cytotoxicity
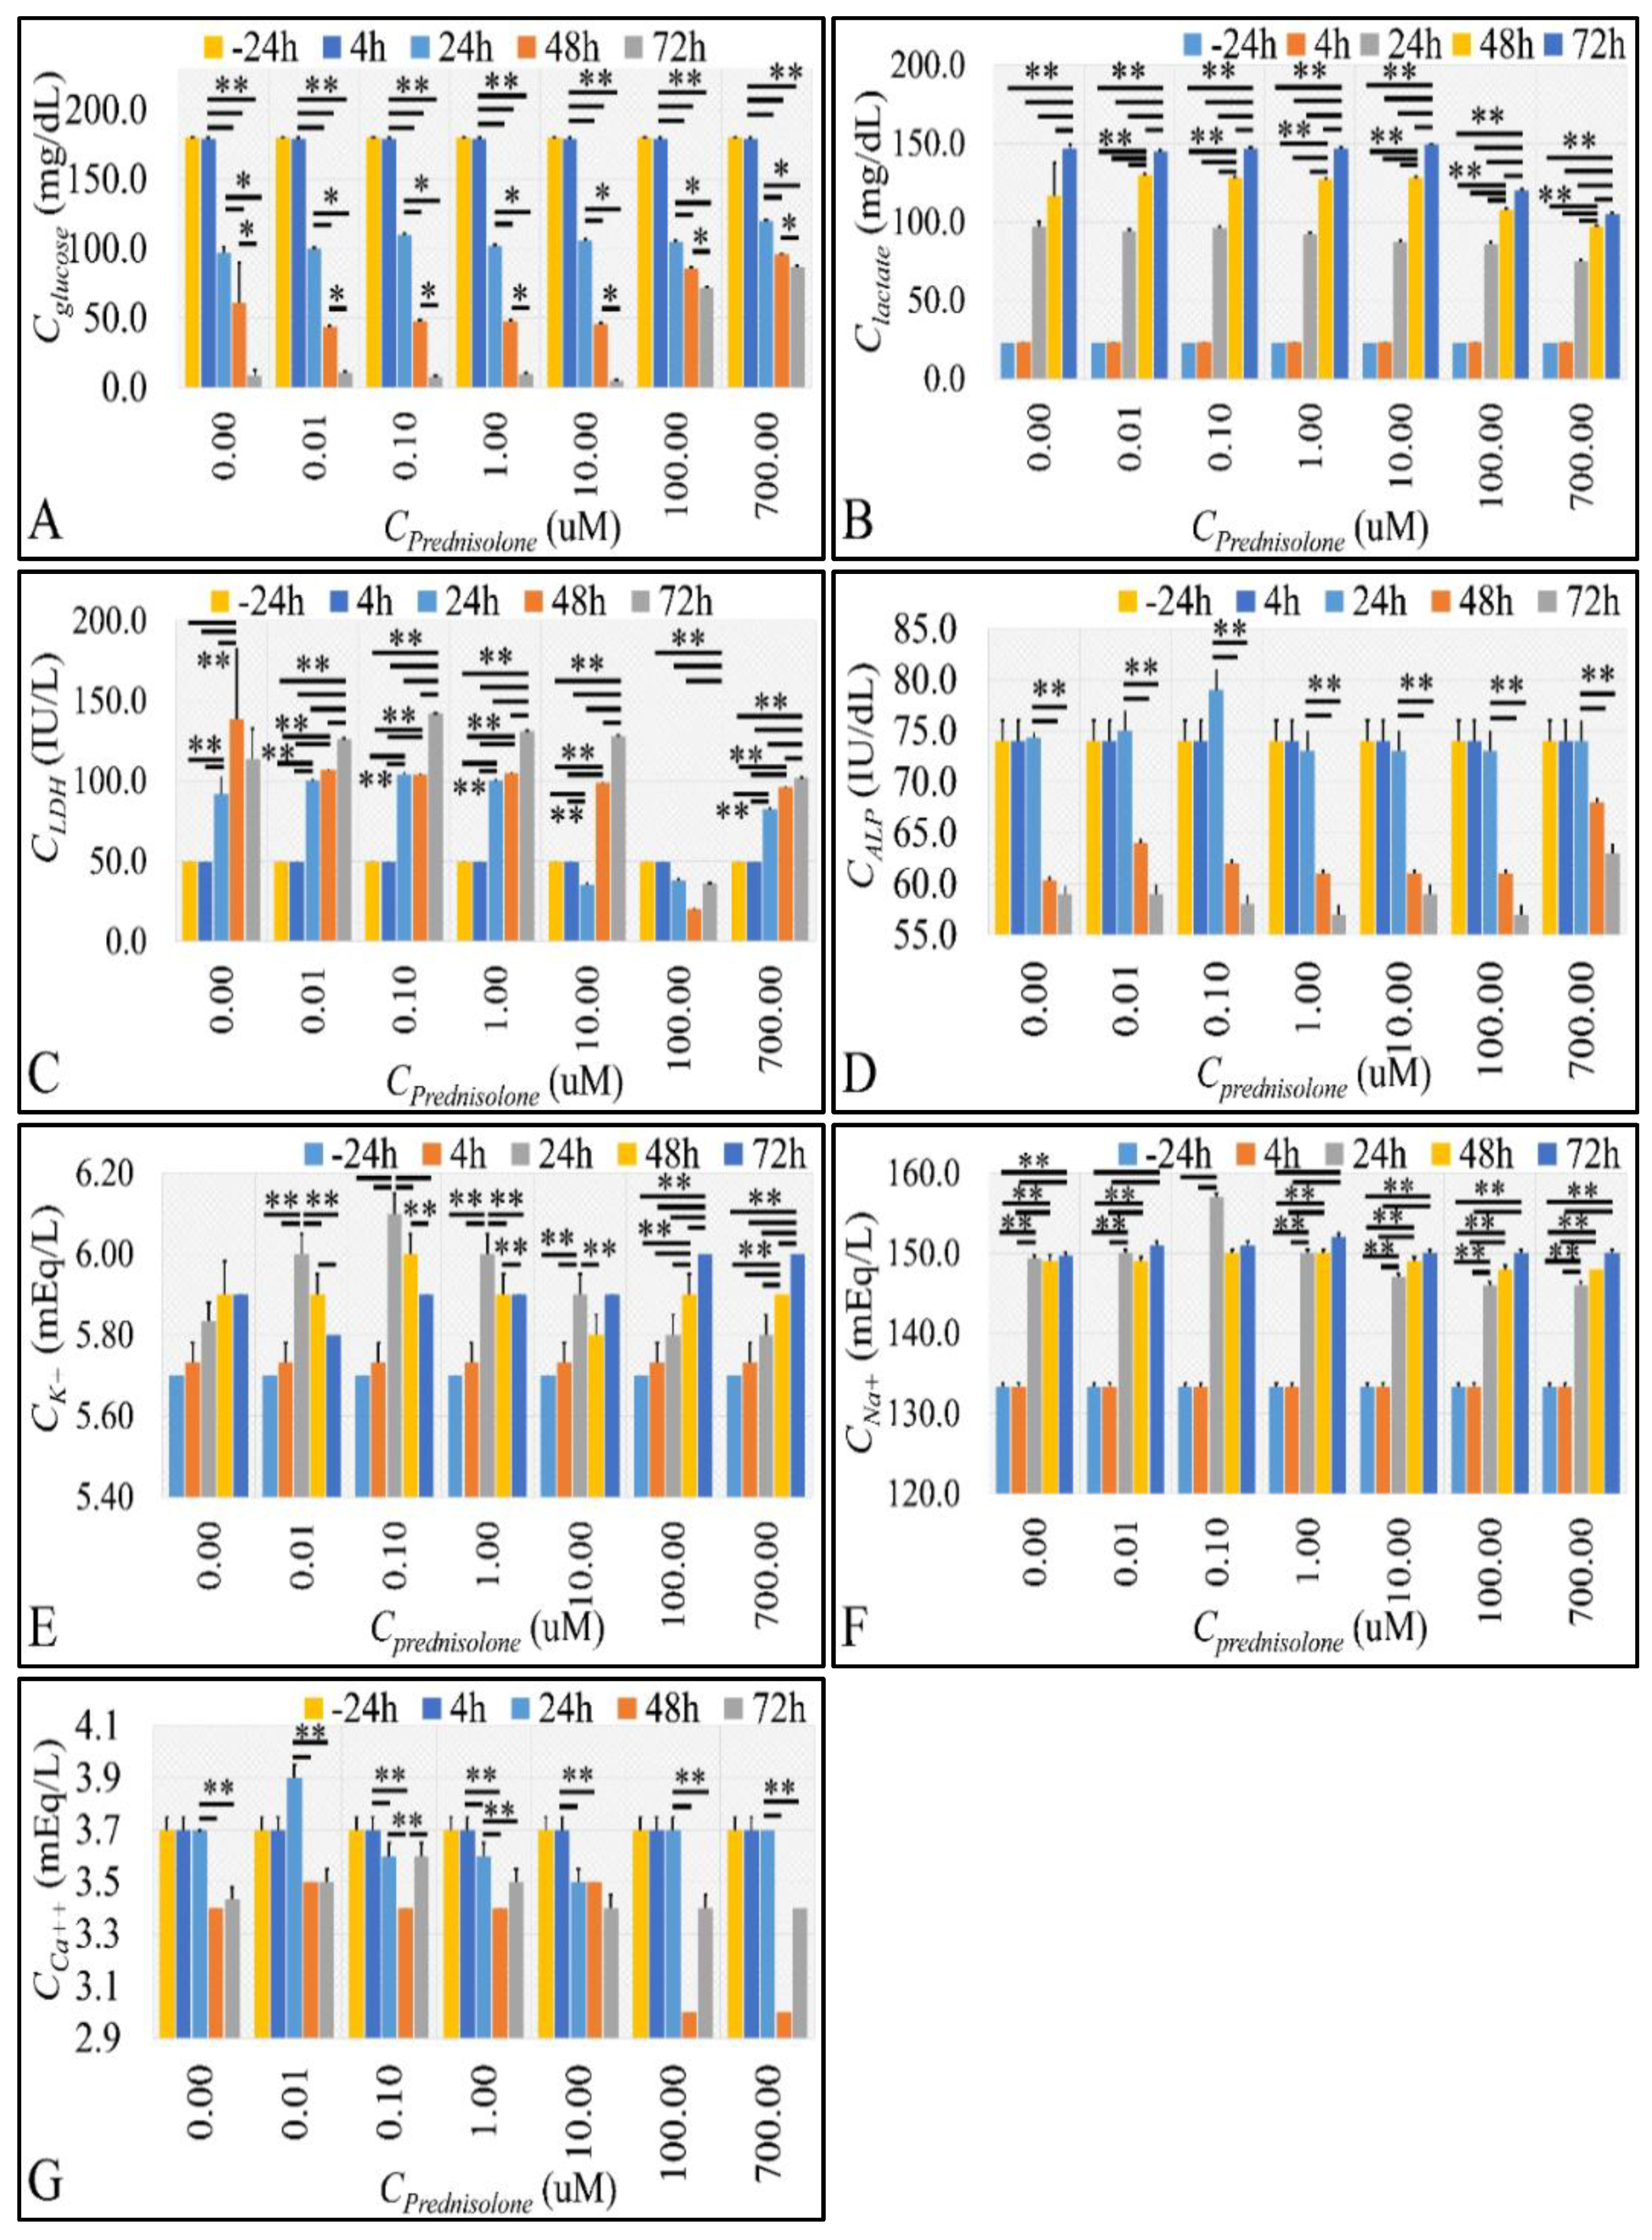
2.3. Cell Metabolic Properties
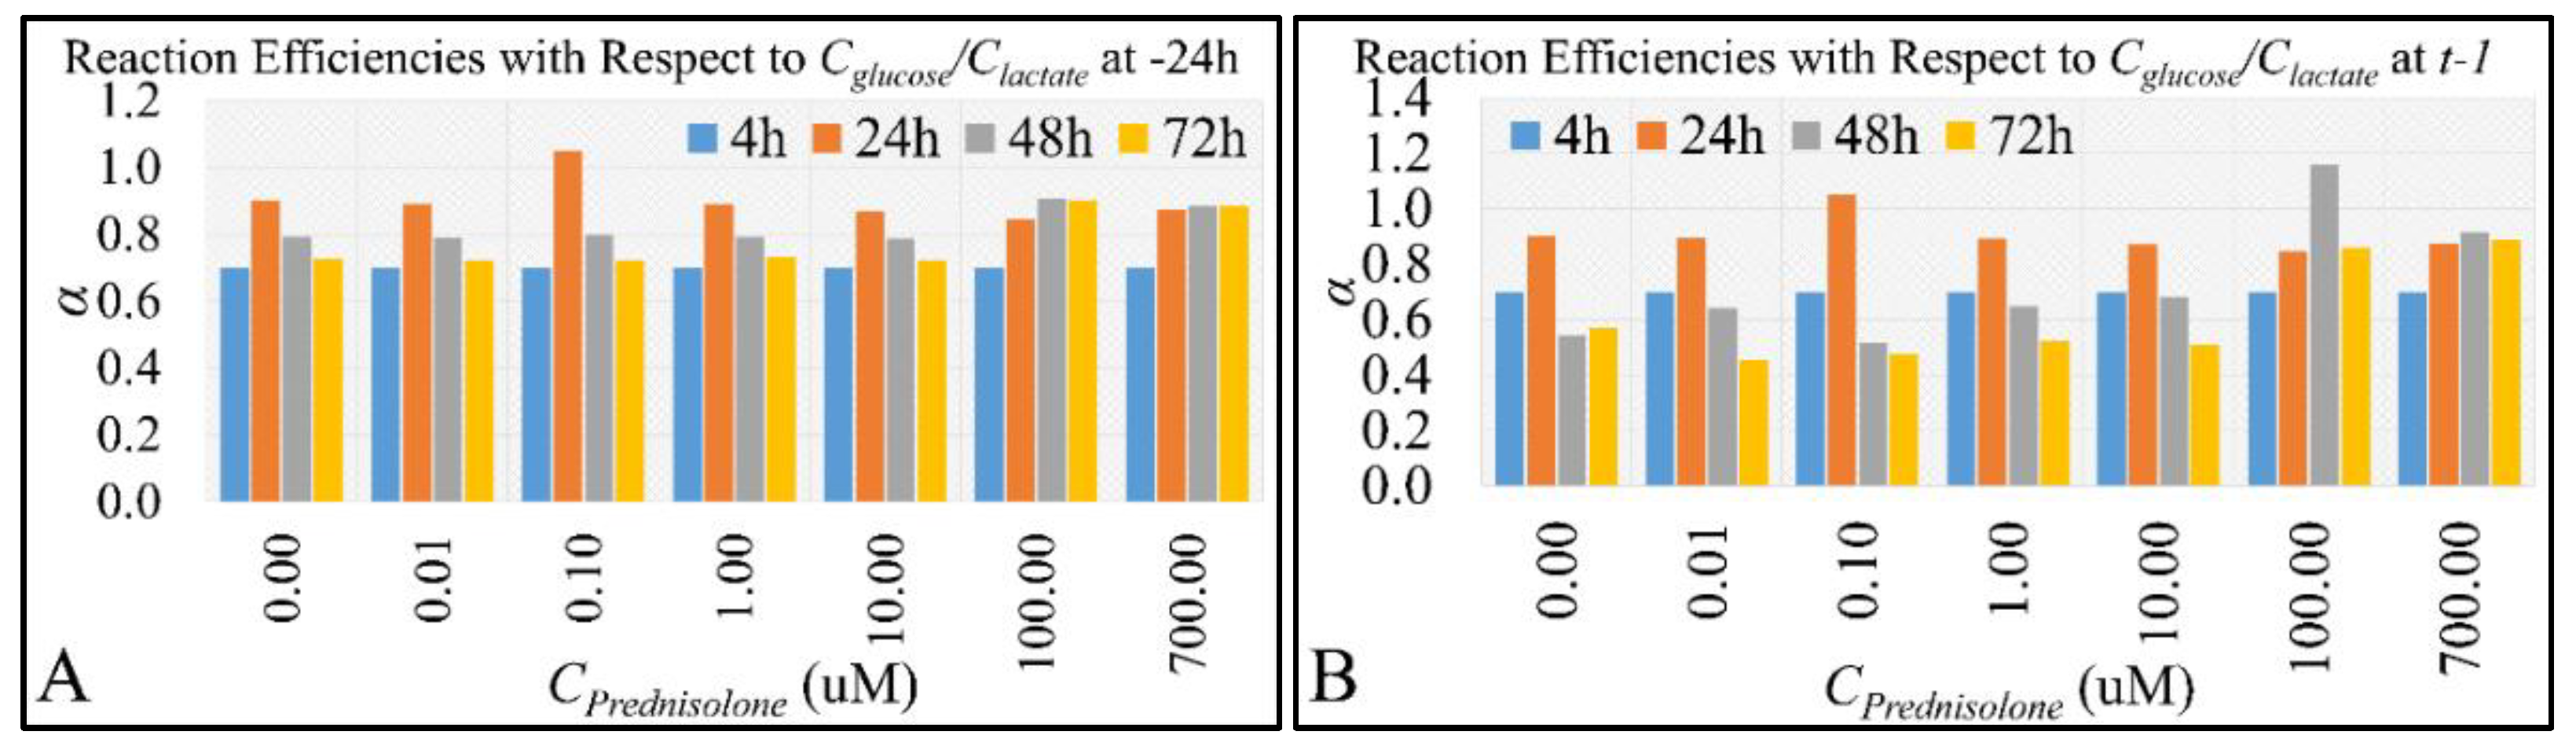
2.4. Glucose Consumption Follows the Reaction Kinetics of Anaerobic Glycolysis
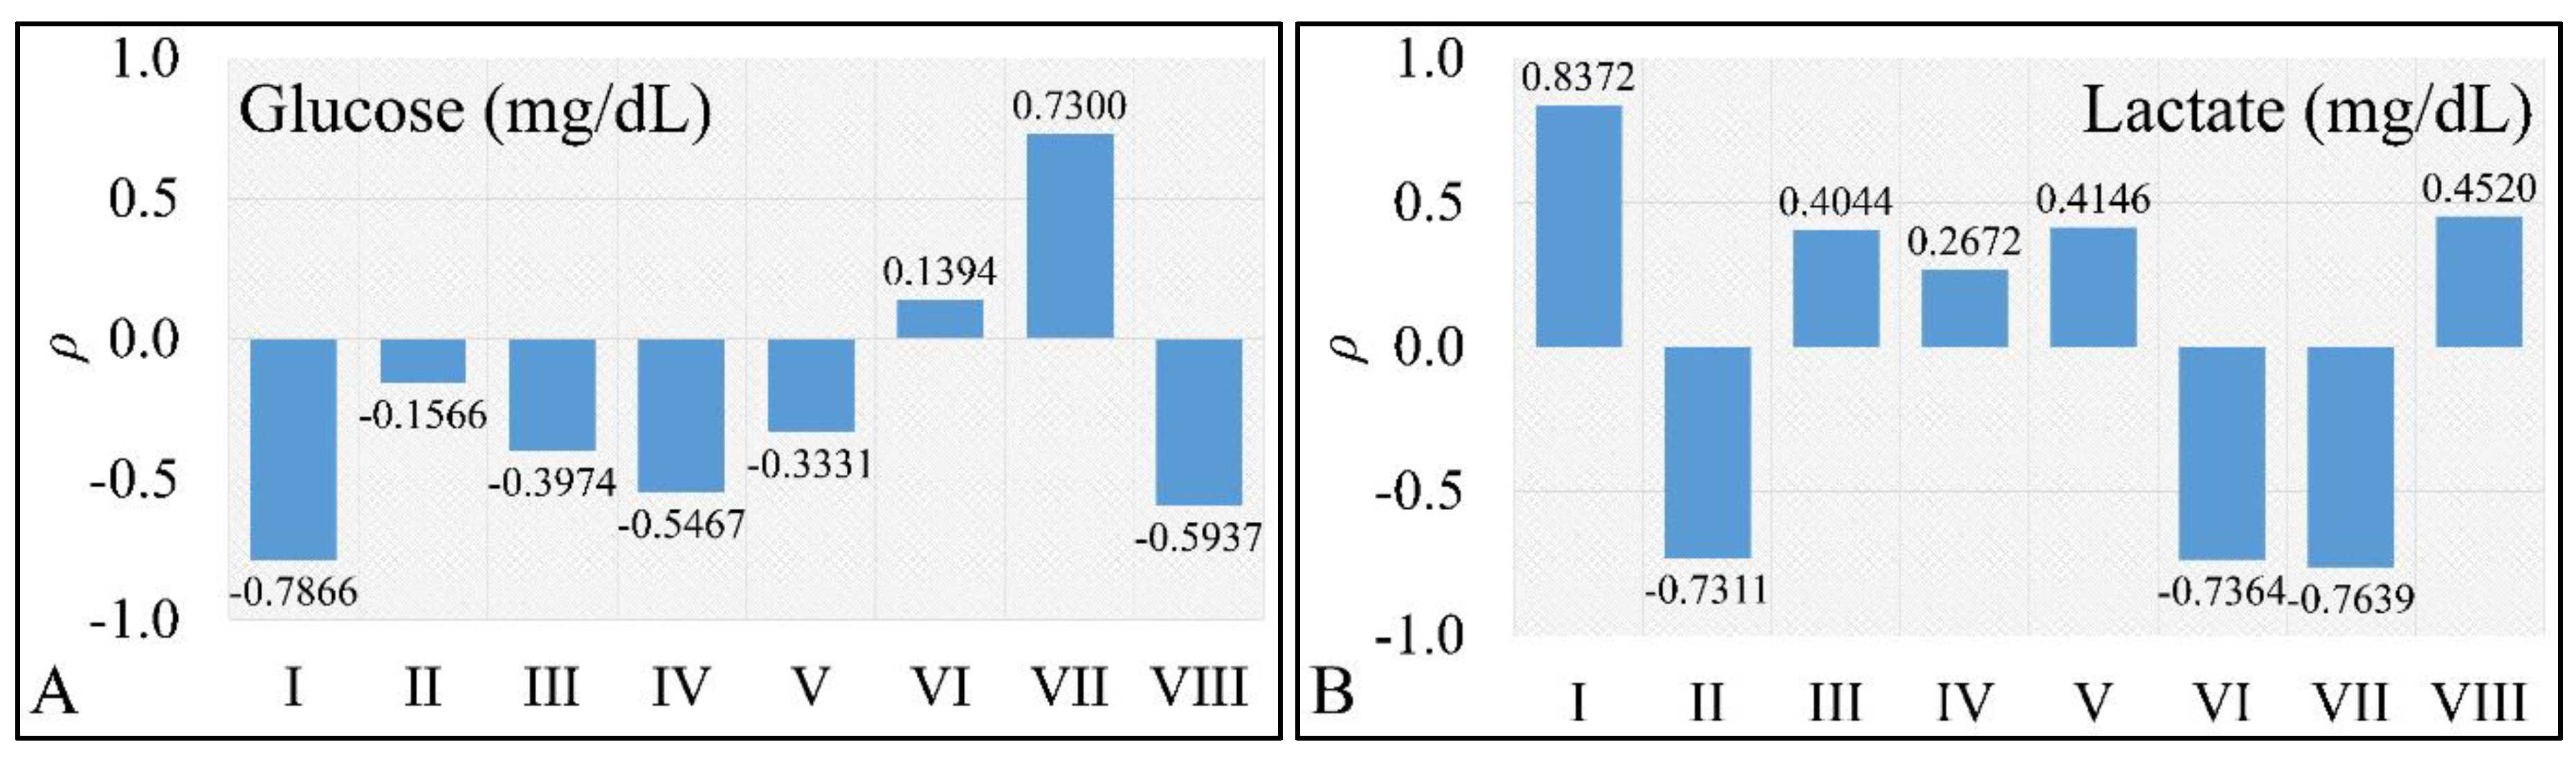
2.5. Correlations
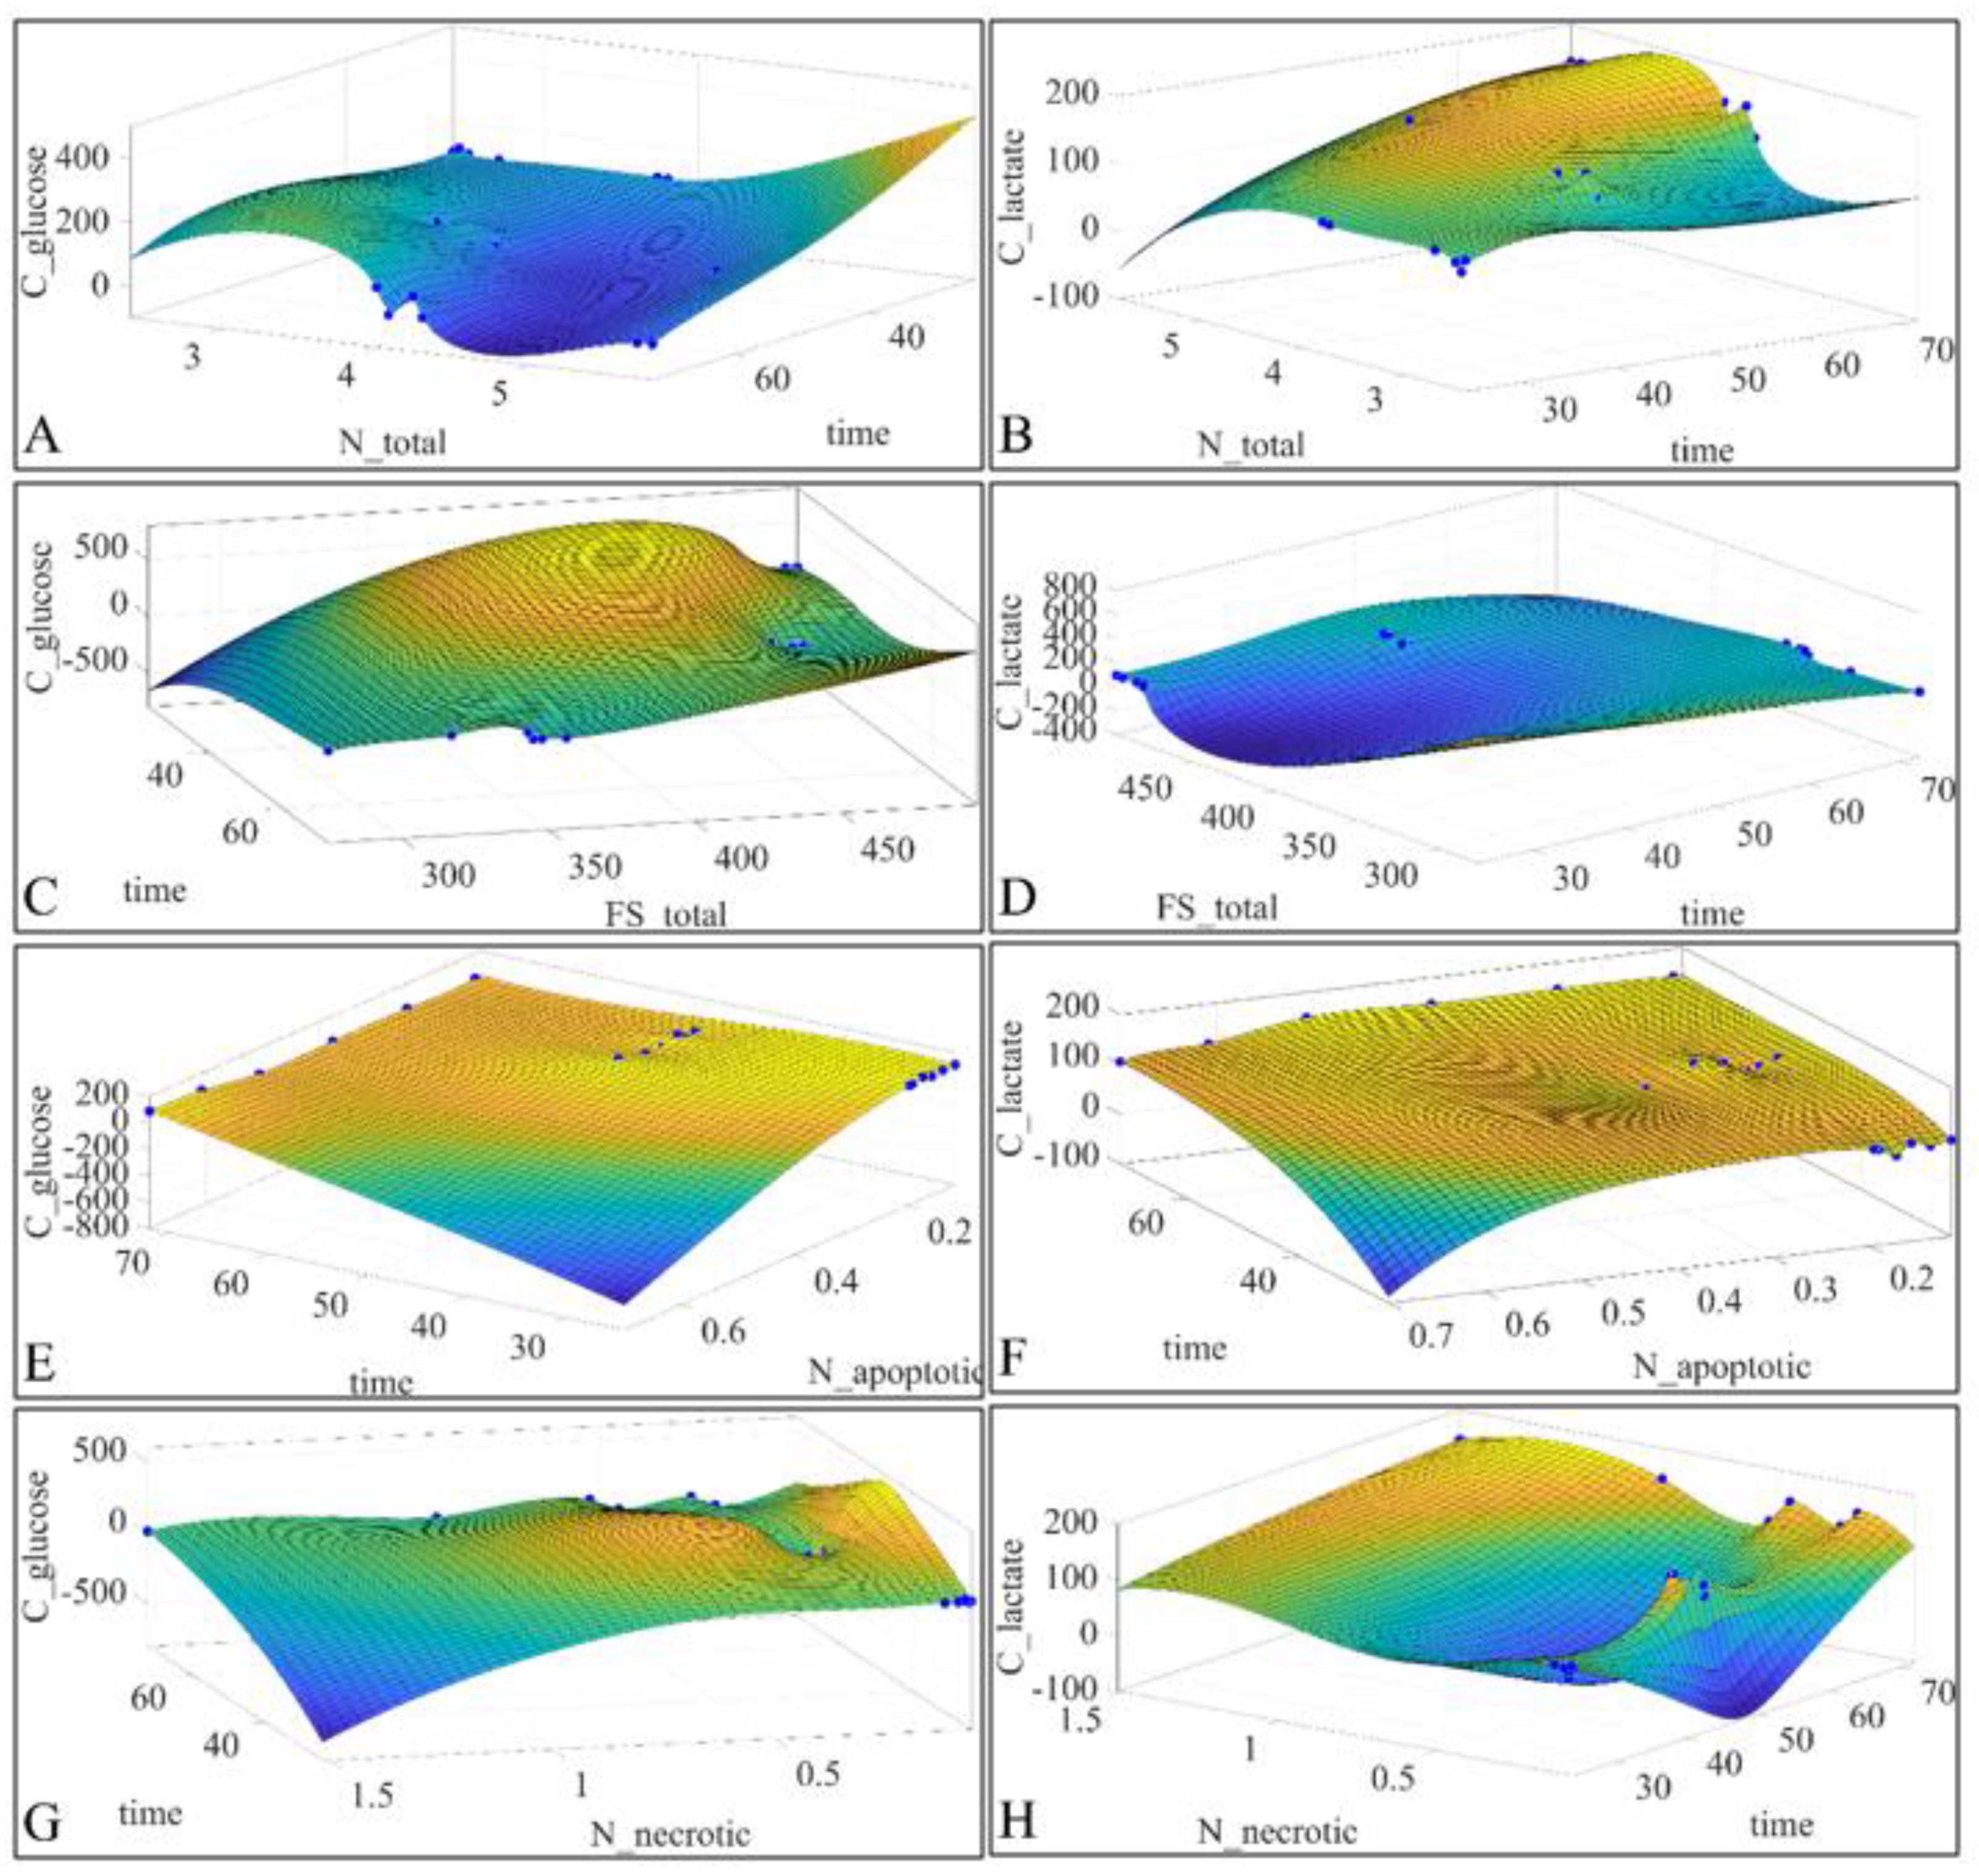
2.6. Regressions
2.7. Gene Expression
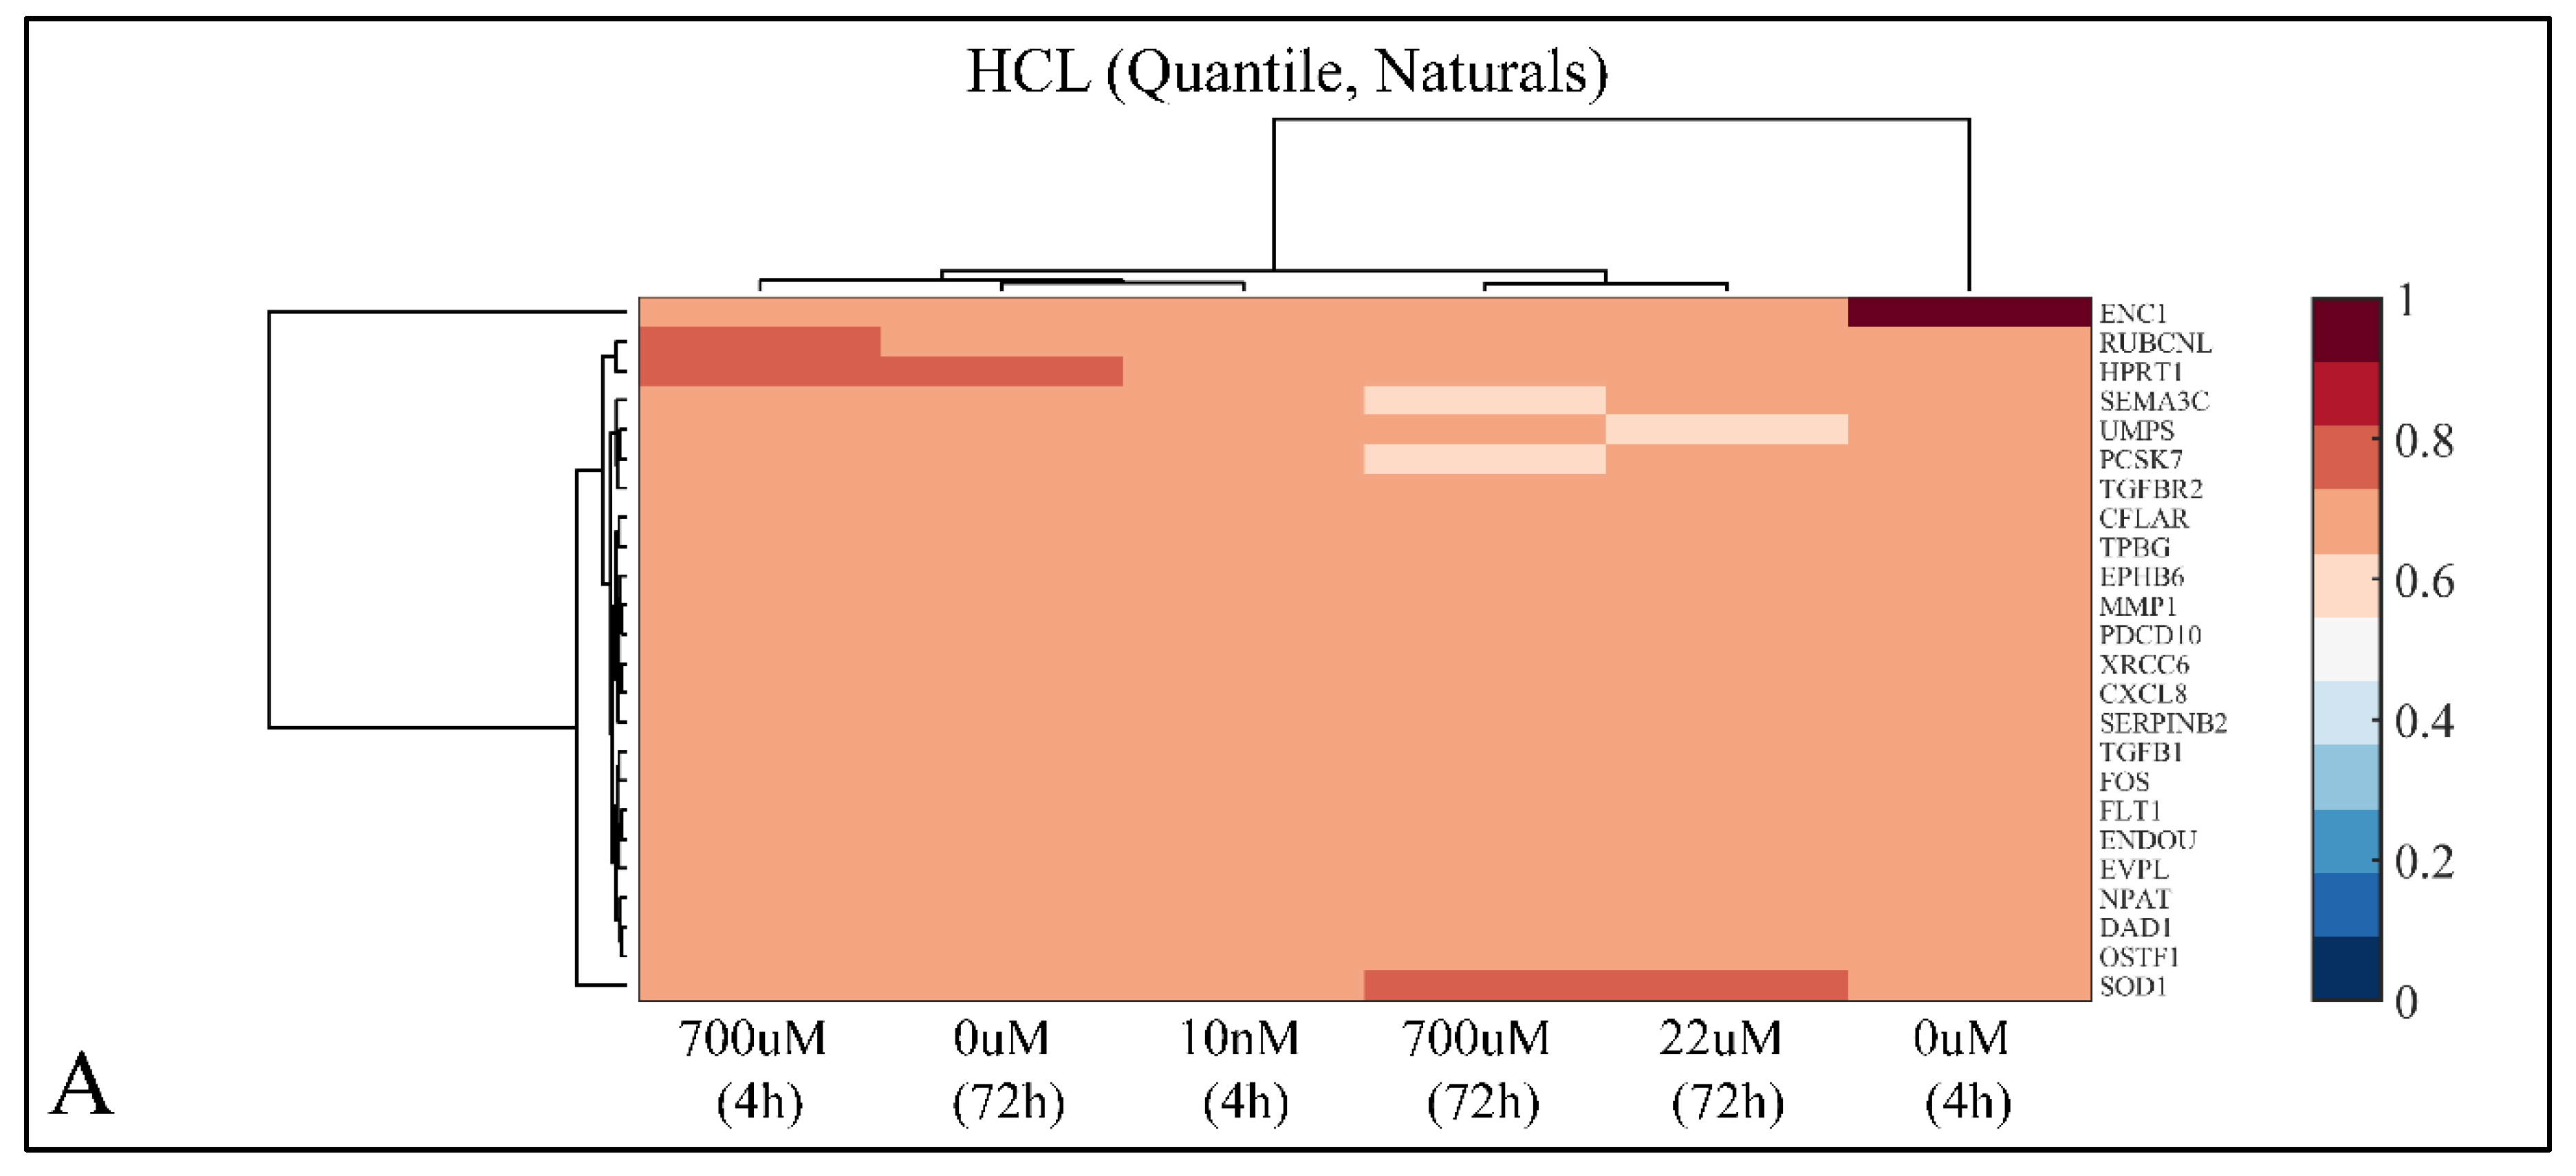
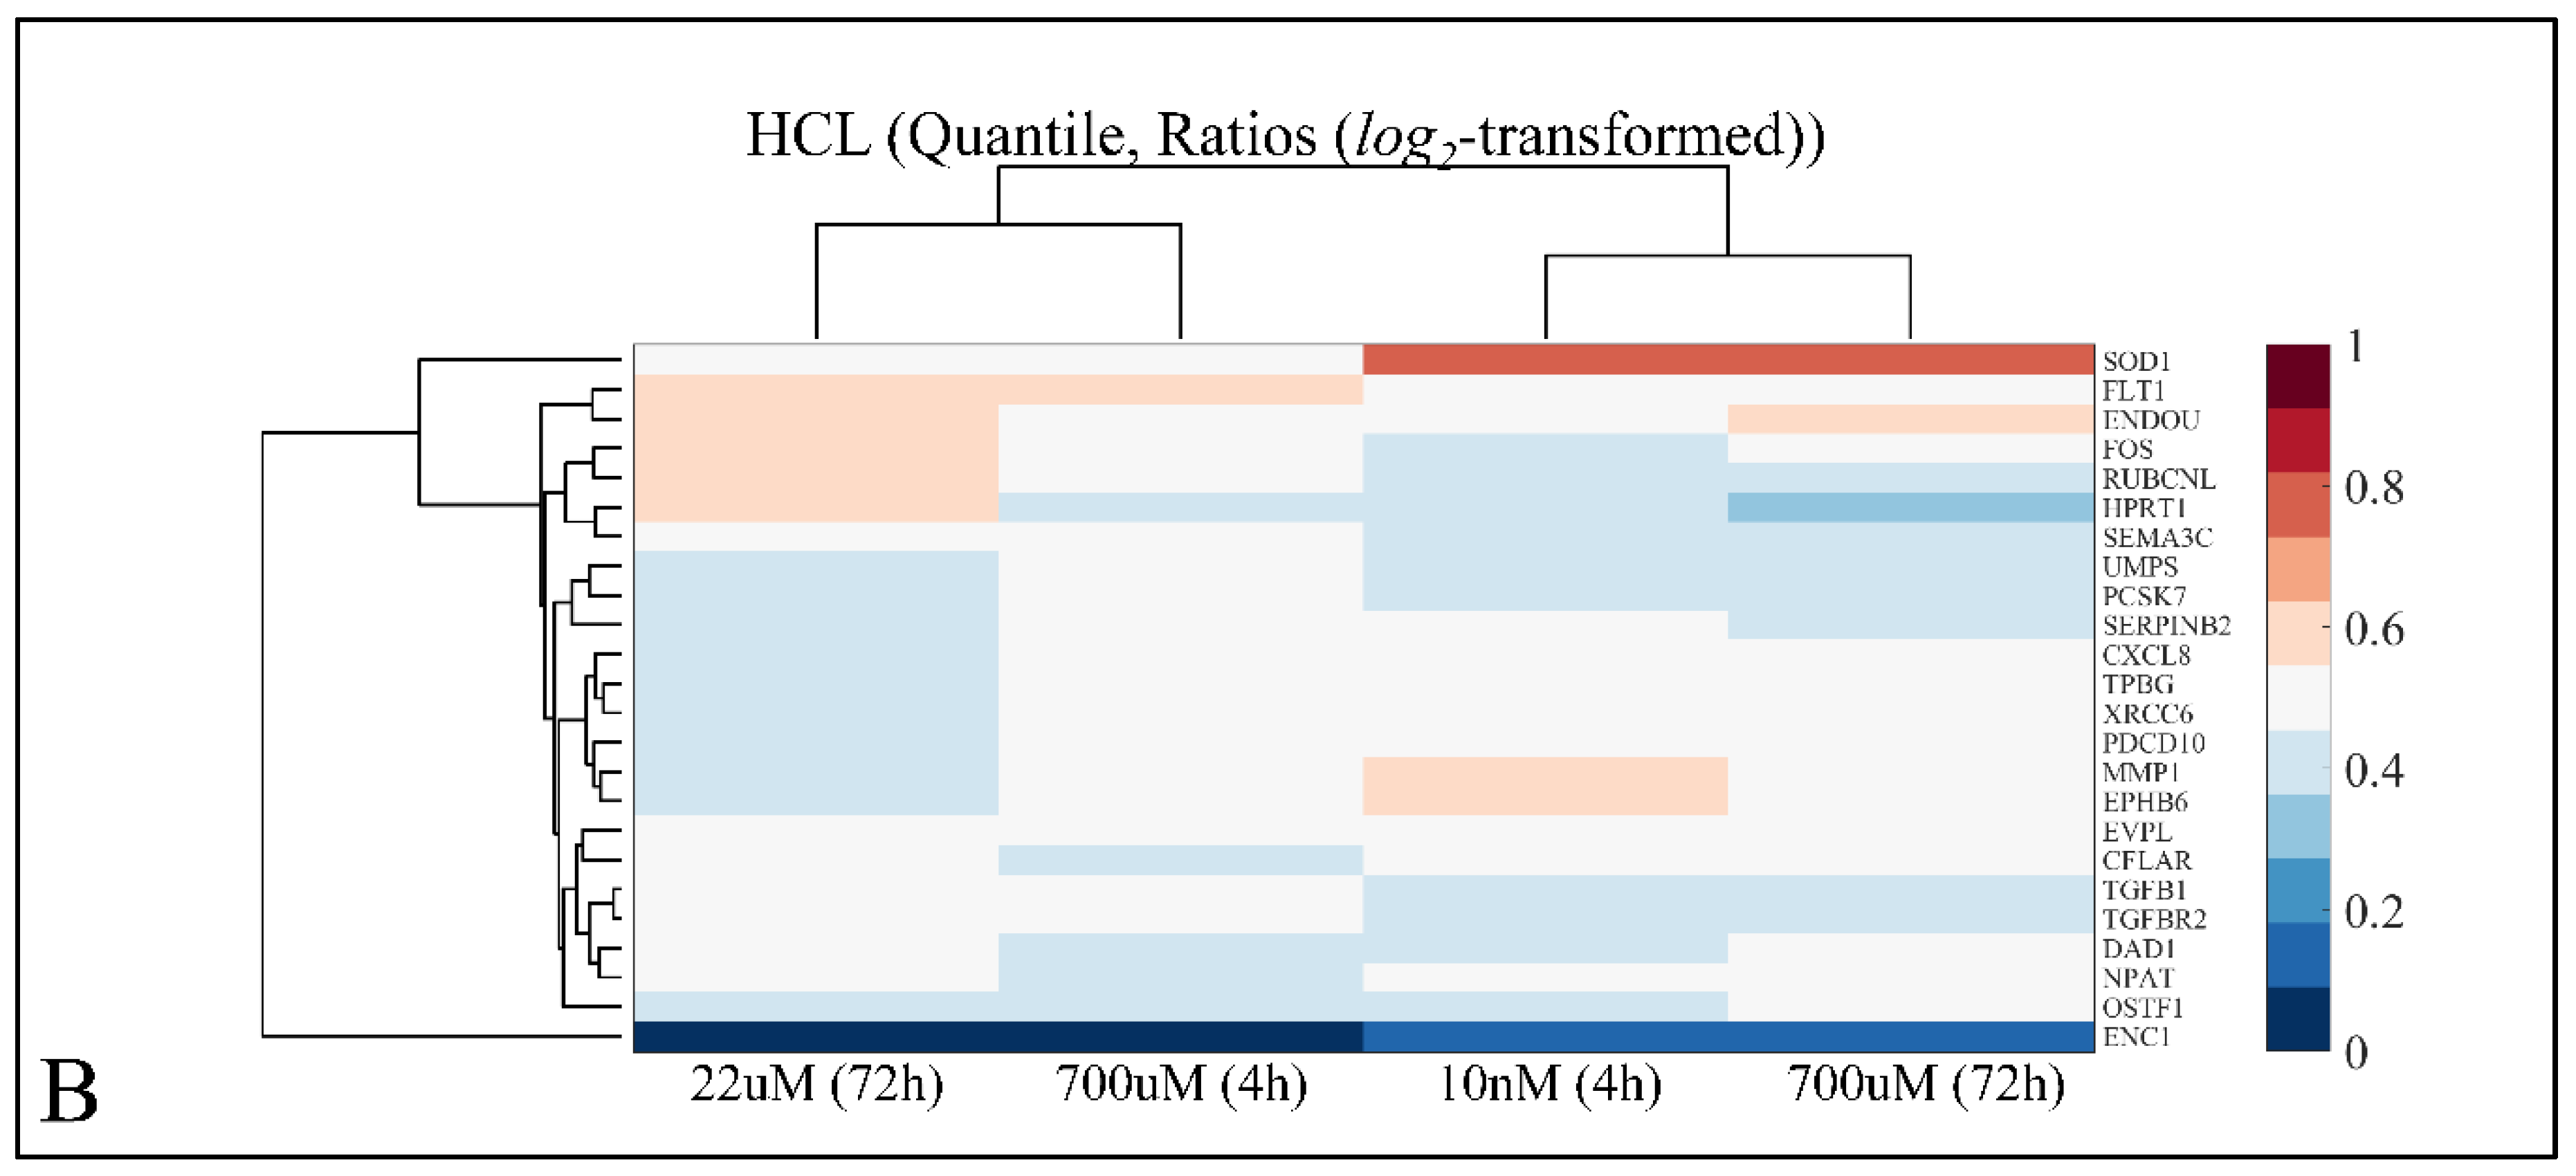
2.7.1. Hierarchical Clustering (HCL)
2.7.2. K-Means Clustering
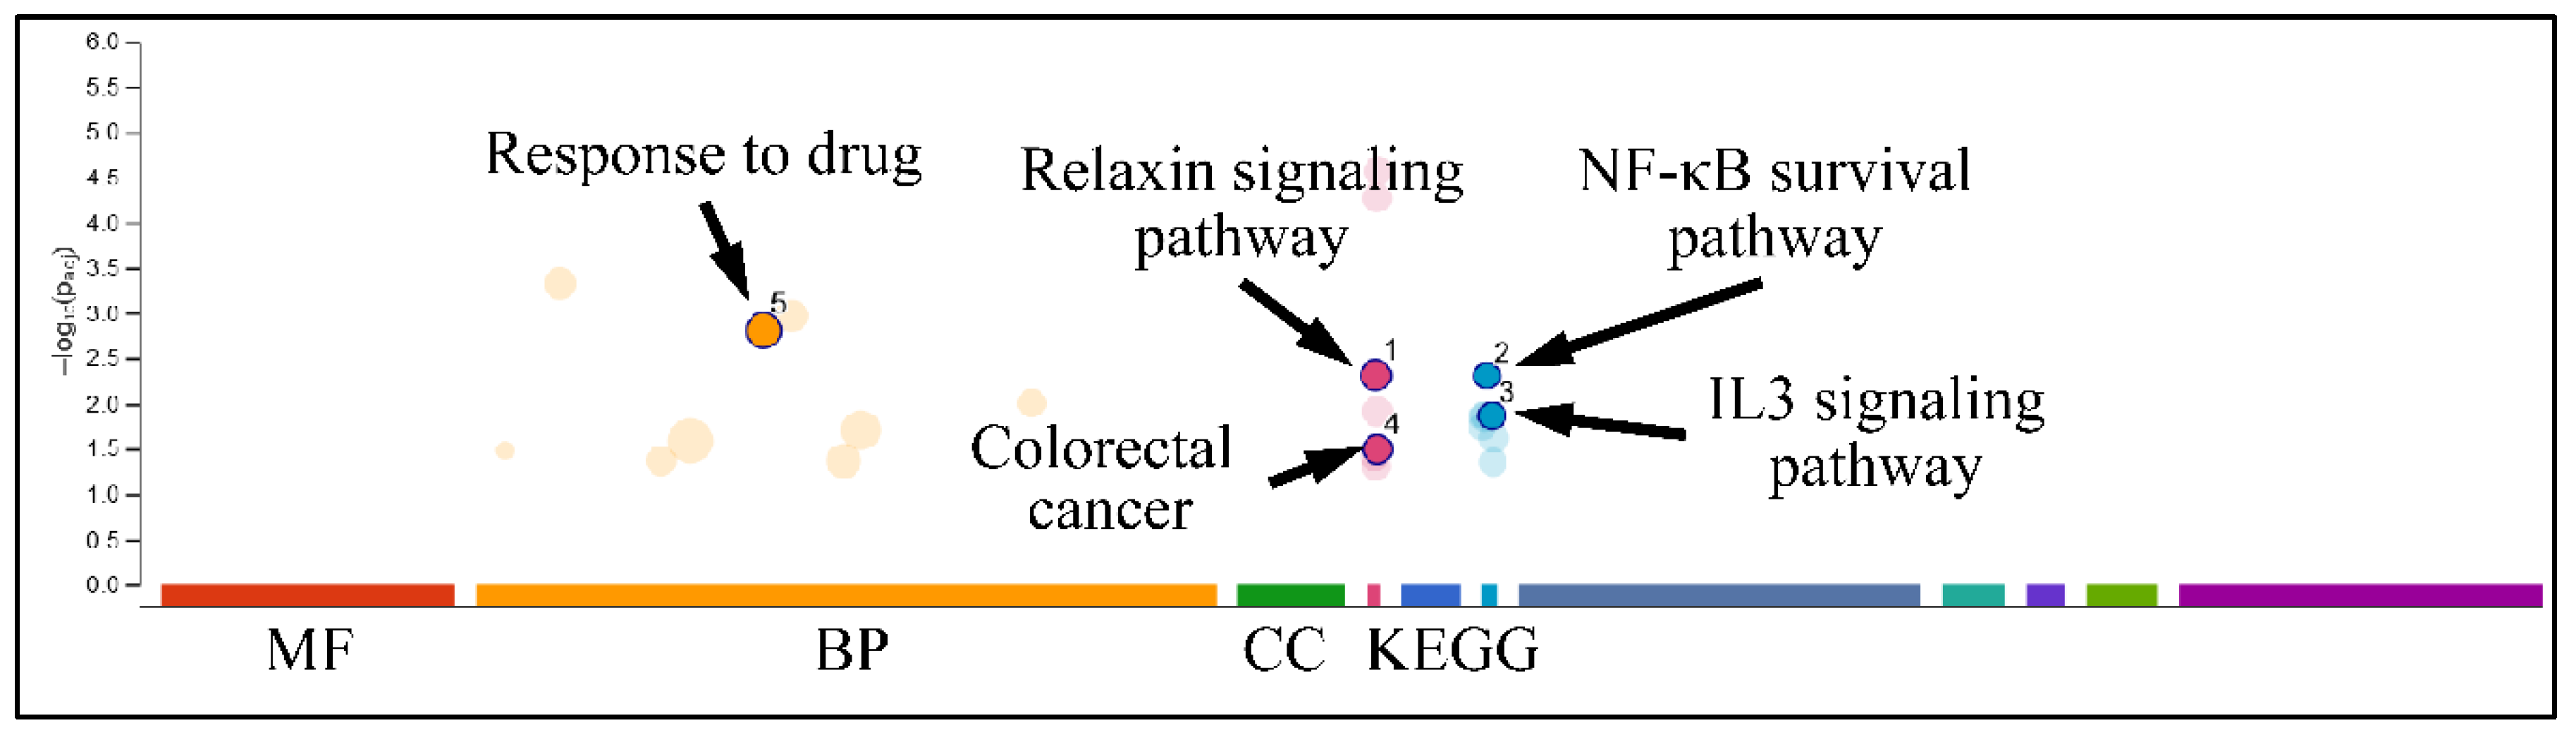
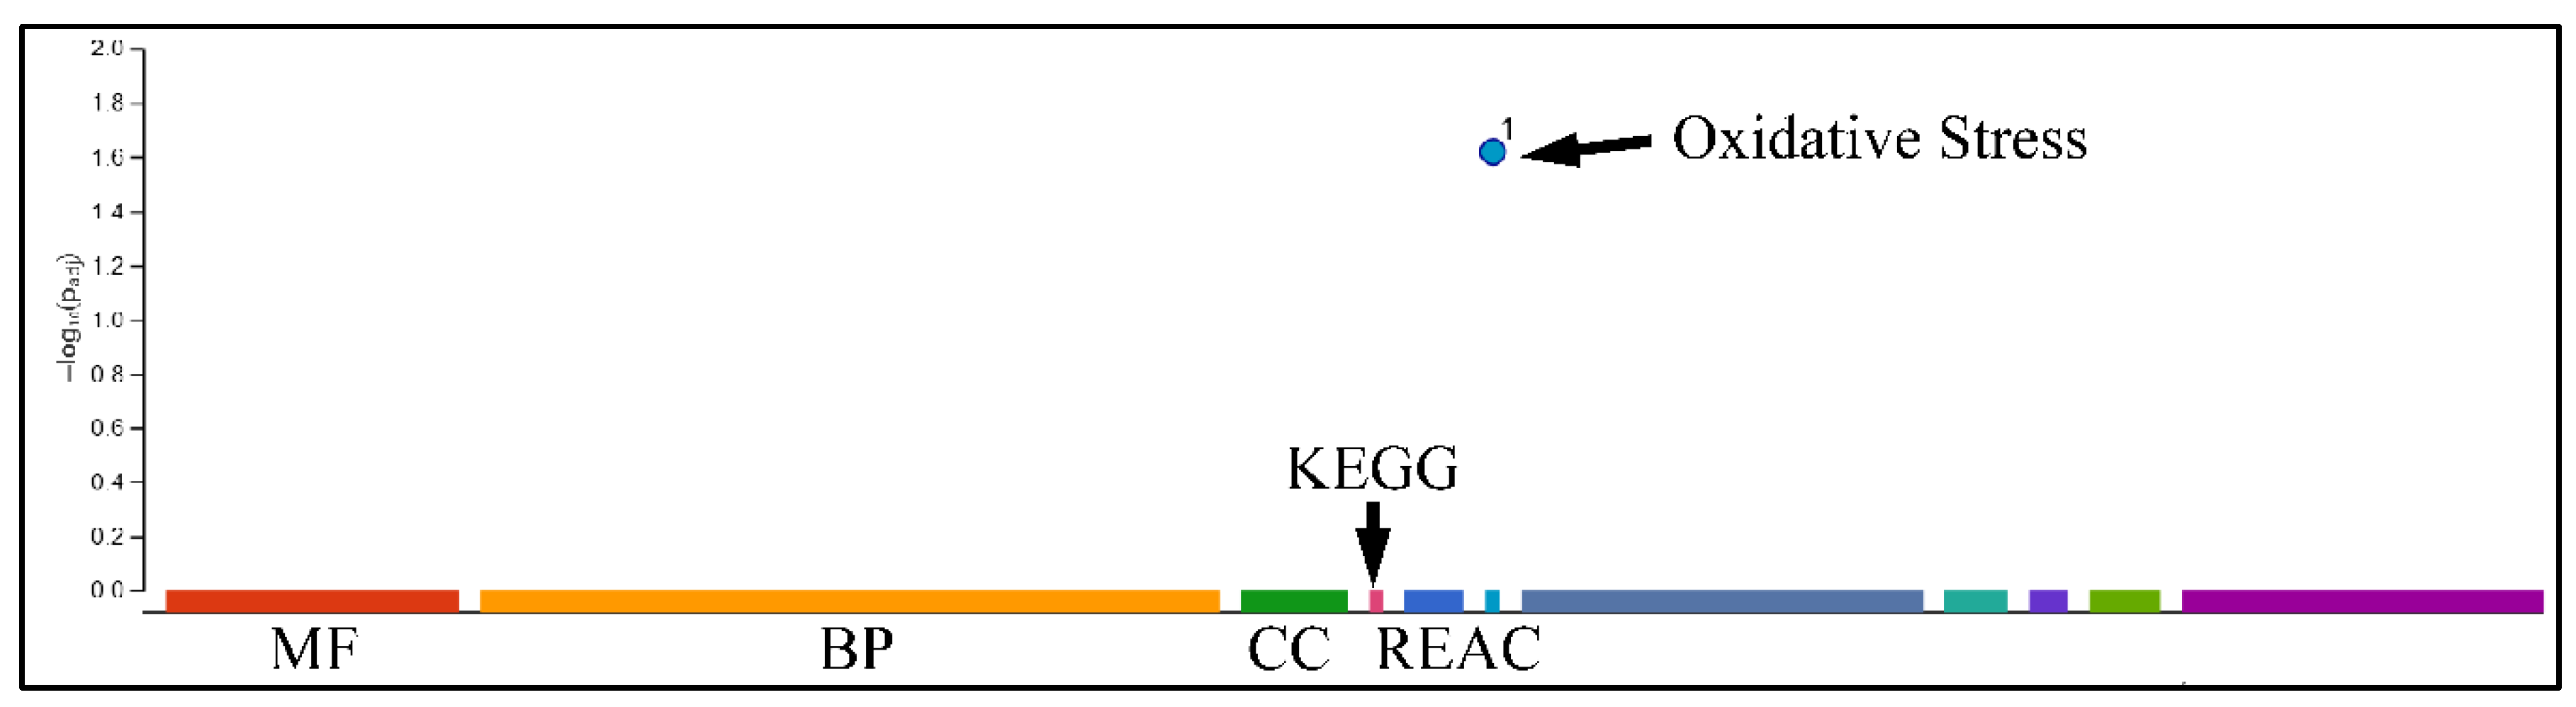
2.7.3. Gene Functional Analysis
3. Discussion
3.1. The Duality of Prednisolone Action
3.2. The Duality of DEGs
3.3. The Translation of Experimental Findigs to the Treatment of Leukemia
3.4. The Role of the Microenvironemt: In Vitro vs. In Vivo
4. Materials and Methods
4.1. Cell Culture
4.2. Prednisolone Treatment
4.3. Cell Proliferation
4.4. RNA Extraction
4.5. Flow Cytometry
4.6. Biochemical Measurements
4.7. Microarray Experimentation
4.8. Data Analysis
4.8.1. Flow Cytometry Data Analysis
4.8.2. Microarray Data Analysis
Background Correction
Calculation of Experimental Means
Normalization
Microarray Statistical Analysis
Correlation Analysis
Unsupervised Classification Analysis
Gene Ontology (GO) Analysis
Pathway Analysis
5. Conclusions
Supplementary Materials
Author Contributions
Funding
Conflicts of Interest
Abbreviations
| Abbreviation | Explanation |
| ALL | Acute Lymphoblastic Leukemia |
| AML | Acute Myeloblastic Leukemia |
| BAX | BCL-2 associated X protein |
| BCL-2 | B-cell CLL/lymphoma 2 |
| BCR/ABL | breakpoint cluster region/v-abl Abelson murine leukemia viral oncogene homolog1 |
| BFM trials | Berlin-Frankfurt-Muenster trials |
| DHFR | dihydrofolate reductase |
| DMSO | Dimethyl Sulfoxide |
| FDR | False Discovery Rate |
| FDR | False Discovery Rate |
| GC | Glucocorticoid |
| GM | Geometric Mean |
| GR | Glucocorticoid Receptor |
| GRE | Glucocorticoid Response Element |
| HCL | Hierarchical Clustering |
| IL-3 | interleukin-3 |
| LMO1 | LIM domain only 1 (rhombotin 1) |
| LMO2 | LIM domain only 2 (rhombotin-like 1) |
| LYL1 | lymphoblastic leukemia derived sequence 1 |
| MR | Mineralocorticoid Receptor |
| NF-κB | Nuclear factor of kappa in B-cells |
| Nt | is the counted number of cells at time tn |
| Nt−1 | is the counted number of cells at time tn−1 |
| PI | Propidium Iodide |
| RFC1 | reduced folate carrier 1 |
| SDS | Sodium Dodecyl Sulfate |
| SSC | Saline Sodium Citrate Buffer |
| TAL1 | T-cell acute lymphocytic leukemia 1 |
| TEL/AML1 | alias for ETV6 (ets variant gene)/alias for CBFA2 (Core-binding factor alpha subunit 2; acute myeloid leukemia 1 gene; aml1 oncogene) |
References
- Cario, G.; Fetz, A.; Bretscher, C.; Moricke, A.; Schrauder, A.; Stanulla, M.; Schrappe, M. Initial leukemic gene expression profiles of patients with poor in vivo prednisone response are similar to those of blasts persisting under prednisone treatment in childhood acute lymphoblastic leukemia. Ann. Hematol. 2008, 87, 709–716. [Google Scholar] [CrossRef] [PubMed]
- Djavaheri-Mergny, M.; Giuriato, S.; Tschan, M.P.; Humbert, M. Therapeutic Modulation of Autophagy in Leukaemia and Lymphoma. Cells 2019, 8, 103. [Google Scholar] [CrossRef] [PubMed] [Green Version]
- Lambrou, G.I.; Vlahopoulos, S.; Papathanasiou, C.; Papanikolaou, M.; Karpusas, M.; Zoumakis, E.; Tzortzatou-Stathopoulou, F. Prednisolone exerts late mitogenic and biphasic effects on resistant acute lymphoblastic leukemia cells: Relation to early gene expression. Leuk. Res. 2009, 33, 1684–1695. [Google Scholar] [CrossRef] [PubMed]
- Lambrou, G.I.; Sifakis, E.G.; Koultouki, E.; Prentza, A.; Chatziioannou, A.; Koutsouris, D.; Tzortzatou-Stathopoulou, F. Comparative computational methods to identification of inherent or acquired mechanisms of resistance to prednisolone in acute lymphoblastic leukemia cells. In Proceedings of the 9th International Conference on Information Technology and Applications in Biomedicine, ITAB 2009, Larnaca, Cyprus, 4–7 November 2009. [Google Scholar]
- Sifakis, E.G.; Lambrou, G.I.; Prentza, A.; Vlahopoulos, S.; Koutsouris, D.; Tzortzatou-Stathopoulou, F.; Chatziioannou, A.A. Elucidating the identity of resistance mechanisms to prednisolone exposure in acute lymphoblastic leukemia cells through transcriptomic analysis: A computational approach. J. Clin. Bioinform. 2011, 1, 36. [Google Scholar] [CrossRef] [PubMed] [Green Version]
- Wang, Y.; Huang, J.; Rong, L.; Wu, P.; Kang, M.; Zhang, X.; Lu, Q.; Fang, Y. Impact of age on the survival of pediatric leukemia: An analysis of 15083 children in the SEER database. Oncotarget 2016, 7, 83767–83774. [Google Scholar] [CrossRef] [PubMed] [Green Version]
- Grausenburger, R.; Bastelberger, S.; Eckert, C.; Kauer, M.; Stanulla, M.; Frech, C.; Bauer, E.; Stoiber, D.; von Stackelberg, A.; Attarbaschi, A.; et al. Genetic alterations in glucocorticoid signaling pathway components are associated with adverse prognosis in children with relapsed ETV6/RUNX1-positive acute lymphoblastic leukemia. Leuk. Lymphoma 2016, 57, 1163–1173. [Google Scholar] [CrossRef]
- Molnar, A.; Patocs, A.; Liko, I.; Nyiro, G.; Racz, K.; Toth, M.; Sarman, B. An unexpected, mild phenotype of glucocorticoid resistance associated with glucocorticoid receptor gene mutation case report and review of the literature. BMC Med. Genet. 2018, 19, 37. [Google Scholar] [CrossRef] [Green Version]
- Tissing, W.J.; Meijerink, J.P.; den Boer, M.L.; Brinkhof, B.; van Rossum, E.F.; van Wering, E.R.; Koper, J.W.; Sonneveld, P.; Pieters, R. Genetic variations in the glucocorticoid receptor gene are not related to glucocorticoid resistance in childhood acute lymphoblastic leukemia. Clin. Cancer Res. 2005, 11, 6050–6056. [Google Scholar] [CrossRef] [Green Version]
- Ramdas, J.; Harmon, J.M. Glucocorticoid-induced apoptosis and regulation of NF-kappaB activity in human leukemic T cells. Endocrinology 1998, 139, 3813–3821. [Google Scholar] [CrossRef]
- Bera, S.; Greiner, S.; Choudhury, A.; Dispenzieri, A.; Spitz, D.R.; Russell, S.J.; Goel, A. Dexamethasone-induced oxidative stress enhances myeloma cell radiosensitization while sparing normal bone marrow hematopoiesis. Neoplasia 2010, 12, 980–992. [Google Scholar] [CrossRef] [Green Version]
- Riml, S.; Schmidt, S.; Ausserlechner, M.J.; Geley, S.; Kofler, R. Glucocorticoid receptor heterozygosity combined with lack of receptor auto-induction causes glucocorticoid resistance in Jurkat acute lymphoblastic leukemia cells. Cell Death Differ. 2004, 11 (Suppl. S1), S65–S72. [Google Scholar] [CrossRef] [PubMed] [Green Version]
- Dussiau, C.; Trinquand, A.; Lhermitte, L.; Latiri, M.; Simonin, M.; Cieslak, A.; Bedjaoui, N.; Villarese, P.; Verhoeyen, E.; Dombret, H.; et al. Targeting IRAK1 in T-cell acute lymphoblastic leukemia. Oncotarget 2015, 6, 18956–18965. [Google Scholar] [CrossRef] [Green Version]
- Hall, C.P.; Reynolds, C.P.; Kang, M.H. Modulation of Glucocorticoid Resistance in Pediatric T-cell Acute Lymphoblastic Leukemia by Increasing BIM Expression with the PI3K/mTOR Inhibitor BEZ235. Clin. Cancer Res. 2016, 22, 621–632. [Google Scholar] [CrossRef] [PubMed] [Green Version]
- Webb, M.S.; Miller, A.L.; Howard, T.L.; Johnson, B.H.; Chumakov, S.; Fofanov, Y.; Nguyen-Vu, T.; Lin, C.Y.; Thompson, E.B. Sequential gene regulatory events leading to glucocorticoid-evoked apoptosis of CEM human leukemic cells:interactions of MAPK, MYC and glucocorticoid pathways. Mol. Cell. Endocrinol. 2018, 471, 118–130. [Google Scholar] [CrossRef] [PubMed]
- Rhee, K.; Bresnahan, W.; Hirai, A.; Hirai, M.; Thompson, E.A. c-Myc and cyclin D3 (CcnD3) genes are independent targets for glucocorticoid inhibition of lymphoid cell proliferation. Cancer Res. 1995, 55, 4188–4195. [Google Scholar]
- Pikman, Y.; Alexe, G.; Roti, G.; Conway, A.S.; Furman, A.; Lee, E.S.; Place, A.E.; Kim, S.; Saran, C.; Modiste, R.; et al. Synergistic Drug Combinations with a CDK4/6 Inhibitor in T-cell Acute Lymphoblastic Leukemia. Clin. Cancer Res. 2017, 23, 1012–1024. [Google Scholar] [CrossRef] [Green Version]
- Tissing, W.J.; den Boer, M.L.; Meijerink, J.P.; Menezes, R.X.; Swagemakers, S.; van der Spek, P.J.; Sallan, S.E.; Armstrong, S.A.; Pieters, R. Genomewide identification of prednisolone-responsive genes in acute lymphoblastic leukemia cells. Blood 2007, 109, 3929–3935. [Google Scholar] [CrossRef] [Green Version]
- Warburg, O.; Posener, K.; Negelein, E. Ueber den Stoffwechsel der Tumoren. Biochem. Z. 1924, 152, 319–344. [Google Scholar]
- Araujo, E.P.; Carvalheira, J.B.; Velloso, L.A. Disruption of metabolic pathways—Perspectives for the treatment of cancer. Curr. Cancer Drug Targets 2006, 6, 77–87. [Google Scholar] [CrossRef]
- Griner, E.M.; Kazanietz, M.G. Protein kinase C and other diacylglycerol effectors in cancer. Nat. Rev. Cancer 2007, 7, 281–294. [Google Scholar] [CrossRef]
- Ogretmen, B. Sphingolipids in cancer: Regulation of pathogenesis and therapy. FEBS Lett. 2006, 580, 5467–5476. [Google Scholar] [CrossRef] [PubMed] [Green Version]
- Pollak, N.; Dolle, C.; Ziegler, M. The power to reduce: Pyridine nucleotides—Small molecules with a multitude of functions. Biochem. J. 2007, 402, 205–218. [Google Scholar] [CrossRef] [PubMed]
- Medh, R.D.; Saeed, M.F.; Johnson, B.H.; Thompson, E.B. Resistance of human leukemic CEM-C1 cells is overcome by synergism between glucocorticoid and protein kinase a pathways: Correlation with c-Myc suppression. Cancer Res. 1998, 58, 3684–3693. [Google Scholar]
- Lippman, M.E.; Perry, S.; Thompson, E.B. Cytoplasmic glucocorticoid-binding proteins in glucocorticoid-unresponsive human and mouse leukemic cell lines. Cancer Res. 1974, 34, 1572–1576. [Google Scholar] [PubMed]
- Norman, M.R.; Thompson, E.B. Characterization of a glucocorticoid-sensitive human lymphoid cell line. Cancer Res. 1977, 37, 3785–3791. [Google Scholar] [PubMed]
- Laane, E.; Panaretakis, T.; Pokrovskaja, K.; Buentke, E.; Corcoran, M.; Soderhall, S.; Heyman, M.; Mazur, J.; Zhivotovsky, B.; Porwit, A.; et al. Dexamethasone-induced apoptosis in acute lymphoblastic leukemia involves differential regulation of Bcl-2 family members. Haematologica 2007, 92, 1460–1469. [Google Scholar] [CrossRef] [PubMed] [Green Version]
- Daynes, R.A.; Araneo, B.A. Contrasting effects of glucocorticoids on the capacity of T cells to produce the growth factors interleukin 2 and interleukin 4. Eur. J. Immunol. 1989, 19, 2319–2325. [Google Scholar] [CrossRef]
- Berczi, I. Pituitary hormones and immune function. Acta Paediatr. 1997, 86, 70–75. [Google Scholar] [CrossRef] [PubMed]
- Ayroldi, E.; Migliorati, G.; Cannarile, L.; Moraca, R.; Delfino, D.V.; Riccardi, C. CD2 rescues T cells from T-cell receptor/CD3 apoptosis: A role for the Fas/Fas-L system. Blood 1997, 89, 3717–3726. [Google Scholar] [CrossRef]
- Lambrou, G.I.; Adamaki, M.; Vlahopoulos, S.; Hatziagapiou, K. Gene Expression and Resistance to Glucocorticoid-Induced Apoptosis in Acute Lymphoblastic Leukemia: A Brief Review and Update. Curr. Drug Res. Rev. 2020. [Google Scholar] [CrossRef]
- Yun, J.; Rago, C.; Cheong, I.; Pagliarini, R.; Angenendt, P.; Rajagopalan, H.; Schmidt, K.; Willson, J.K.; Markowitz, S.; Zhou, S.; et al. Glucose deprivation contributes to the development of KRAS pathway mutations in tumor cells. Science 2009, 325, 1555–1559. [Google Scholar] [CrossRef] [Green Version]
- Kim, J.W.; Gao, P.; Dang, C.V. Effects of hypoxia on tumor metabolism. Cancer Metastasis Rev. 2007, 26, 291–298. [Google Scholar] [CrossRef]
- Gatenby, R.A.; Gillies, R.J. Why do cancers have high aerobic glycolysis? Nat. Rev. Cancer 2004, 4, 891–899. [Google Scholar] [CrossRef] [PubMed]
- Hulleman, E.; Kazemier, K.M.; Holleman, A.; VanderWeele, D.J.; Rudin, C.M.; Broekhuis, M.J.; Evans, W.E.; Pieters, R.; Den Boer, M.L. Inhibition of glycolysis modulates prednisolone resistance in acute lymphoblastic leukemia cells. Blood 2009, 113, 2014–2021. [Google Scholar] [CrossRef] [PubMed] [Green Version]
- Boag, J.M.; Beesley, A.H.; Firth, M.J.; Freitas, J.R.; Ford, J.; Hoffmann, K.; Cummings, A.J.; de Klerk, N.H.; Kees, U.R. Altered glucose metabolism in childhood pre-B acute lymphoblastic leukaemia. Leukemia 2006, 20, 1731–1737. [Google Scholar] [CrossRef] [PubMed]
- Mar, J.C.; Quackenbush, J. Decomposition of gene expression state space trajectories. PLoS Comput. Biol. 2009, 5, e1000626. [Google Scholar] [CrossRef] [Green Version]
- Chung, H.W.; Park, S.W.; Chung, J.B.; Kang, J.K.; Kim, J.W.; Kim, H.S.; Hyung, W.J.; Noh, S.H.; Song, S.Y. Differences in genetic expression profiles between young-age and old-age gastric adenocarcinoma using cDNA microarray for endocrine disruptor study. Oncol. Rep. 2004, 12, 33–39. [Google Scholar] [CrossRef] [PubMed]
- Brooks, D.; Wiley, E. Evolution as Entropy: Toward a Unified Theory of Biology. Am. Anthropol. 1987, 89, 499–501. [Google Scholar]
- Wiley, E.; Brooks, D. Victims of history—A non-equilibrium approach to evolution. Syst. Zool. 1988, 31, 1–24. [Google Scholar] [CrossRef]
- Su, T.T.; O’Farrell, P.H. Size control: Cell proliferation does not equal growth. Curr. Biol. 1998, 8, R687–R689. [Google Scholar] [CrossRef] [Green Version]
- Song, M.K.; Chung, J.S.; Seol, Y.M.; Kim, S.G.; Shin, H.J.; Choi, Y.J.; Cho, G.J. Mean cell volume can be an early predictor for the cytogenetic response of chronic myeloid leukemia patients treated with imatinib? Leuk. Res. 2009, 33, 1459–1462. [Google Scholar] [CrossRef]
- Verma, D.; Kantarjian, H.M.; Jones, D.; Luthra, R.; Borthakur, G.; Verstovsek, S.; Rios, M.B.; Cortes, J. Chronic myeloid leukemia (CML) with P190 BCR-ABL: Analysis of characteristics, outcomes, and prognostic significance. Blood 2009, 114, 2232–2235. [Google Scholar] [CrossRef] [PubMed] [Green Version]
- Post, J.F.; Baum, E.; Ezell, E.L. 13C NMR studies of glucose metabolism in human leukemic CEM-C7 and CEM-C1 cells. Magn. Reson. Med. 1992, 23, 356–366. [Google Scholar] [CrossRef]
- Lang, F.; Singh, Y.; Salker, M.S.; Ma, K.; Pandyra, A.A.; Lang, P.A.; Lang, K.S. Glucose transport in lymphocytes. Pflüg. Arch. Eur. J. Physiol. 2020, 472, 1401–1406. [Google Scholar] [CrossRef] [PubMed]
- Sterzer, P.; Wiegers, G.J.; Reul, J.M. Long-term in vivo administration of glucocorticoid hormones attenuates their capacity to accelerate in vitro proliferation of rat splenic T cells. Endocrinology 2004, 145, 3630–3638. [Google Scholar] [CrossRef] [Green Version]
- Thompson, E.B.; Johnson, B.H. Regulation of a distinctive set of genes in glucocorticoid-evoked apoptosis in CEM human lymphoid cells. Recent Prog. Horm. Res. 2003, 58, 175–197. [Google Scholar] [CrossRef]
- Thompson, E.B. Mechanisms of T-cell Apoptosis Induced by Glucocorticoids. Trends Endocrinol. Metab. 1999, 10, 353–358. [Google Scholar] [CrossRef]
- Tiefenthaler, M.; Amberger, A.; Bacher, N.; Hartmann, B.L.; Margreiter, R.; Kofler, R.; Konwalinka, G. Increased lactate production follows loss of mitochondrial membrane potential during apoptosis of human leukaemia cells. Br. J. Haematol. 2001, 114, 574–580. [Google Scholar] [CrossRef]
- Tonko, M.; Ausserlechner, M.J.; Bernhard, D.; Helmberg, A.; Kofler, R. Gene expression profiles of proliferating vs. G1/G0 arrested human leukemia cells suggest a mechanism for glucocorticoid-induced apoptosis. FASEB J. 2001, 15, 693–699. [Google Scholar] [CrossRef]
- Paul, M.D.; Grubb, H.N.; Hristova, K. Quantifying the strength of heterointeractions among receptor tyrosine kinases from different subfamilies: Implications for cell signaling. J. Biol. Chem. 2020, 295, 9917–9933. [Google Scholar] [CrossRef]
- Gonçalves, A.C.; Alves, R.; Baldeiras, I.; Cortesão, E.; Carda, J.P.; Branco, C.C.; Oliveiros, B.; Loureiro, L.; Pereira, A.; Nascimento Costa, J.M.; et al. Genetic variants involved in oxidative stress, base excision repair, DNA methylation, and folate metabolism pathways influence myeloid neoplasias susceptibility and prognosis. Mol. Carcinog. 2017, 56, 130–148. [Google Scholar] [CrossRef]
- Yang, J.; Chai, L.; Gao, C.; Fowles, T.C.; Alipio, Z.; Dang, H.; Xu, D.; Fink, L.M.; Ward, D.C.; Ma, Y. SALL4 is a key regulator of survival and apoptosis in human leukemic cells. Blood 2008, 112, 805–813. [Google Scholar] [CrossRef] [Green Version]
- Imbert, V.; Nebout, M.; Mary, D.; Endou, H.; Wempe, M.F.; Supuran, C.T.; Winum, J.Y.; Peyron, J.F. Co-targeting intracellular pH and essential amino acid uptake cooperates to induce cell death of T-ALL/LL cells. Leuk. Lymphoma 2018, 59, 460–468. [Google Scholar] [CrossRef]
- Rosilio, C.; Nebout, M.; Imbert, V.; Griessinger, E.; Neffati, Z.; Benadiba, J.; Hagenbeek, T.; Spits, H.; Reverso, J.; Ambrosetti, D.; et al. L-type amino-acid transporter 1 (LAT1): A therapeutic target supporting growth and survival of T-cell lymphoblastic lymphoma/T-cell acute lymphoblastic leukemia. Leukemia 2015, 29, 1253–1266. [Google Scholar] [CrossRef] [PubMed]
- Yang, F.; Fang, H.; Wang, D.; Chen, Y.; Zhai, Y.; Zhou, B.S.; Li, H. HPRT1 activity loss is associated with resistance to thiopurine in ALL. Oncotarget 2018, 9, 2268–2278. [Google Scholar] [CrossRef] [PubMed] [Green Version]
- Cheng, X.; Sun, Q. RUBCNL/Pacer and RUBCN/Rubicon in regulation of autolysosome formation and lipid metabolism. Autophagy 2019, 15, 1120–1121. [Google Scholar] [CrossRef]
- Autry, R.J.; Paugh, S.W.; Carter, R.; Shi, L.; Liu, J.; Ferguson, D.C.; Lau, C.E.; Bonten, E.J.; Yang, W.; McCorkle, J.R.; et al. Integrative genomic analyses reveal mechanisms of glucocorticoid resistance in acute lymphoblastic leukemia. Nat. Cancer 2020, 1, 329–344. [Google Scholar] [CrossRef]
- Jackson, R.K.; Liebich, M.; Berry, P.; Errington, J.; Liu, J.; Parker, C.; Moppett, J.; Samarasinghe, S.; Hough, R.; Rowntree, C.; et al. Impact of dose and duration of therapy on dexamethasone pharmacokinetics in childhood acute lymphoblastic leukaemia-a report from the UKALL 2011 trial. Eur. J. Cancer 2019, 120, 75–85. [Google Scholar] [CrossRef] [PubMed]
- Straszkowski, L.; Jovic, T.; Castillo-Tandazo, W.; Ritchie, D.S.; Purton, L.E. Effects of chemotherapy agents used to treat pediatric acute lymphoblastic leukemia patients on bone parameters and longitudinal growth of juvenile mice. Exp. Hematol. 2020, 82, 1–7. [Google Scholar] [CrossRef]
- Samuels, A.L.; Heng, J.Y.; Beesley, A.H.; Kees, U.R. Bioenergetic modulation overcomes glucocorticoid resistance in T-lineage acute lymphoblastic leukaemia. Br. J. Haematol. 2014, 165, 57–66. [Google Scholar] [CrossRef]
- Vander Heiden, M.G.; Cantley, L.C.; Thompson, C.B. Understanding the Warburg effect: The metabolic requirements of cell proliferation. Science 2009, 324, 1029–1033. [Google Scholar] [CrossRef] [Green Version]
- Ben Sahra, I.; Laurent, K.; Giuliano, S.; Larbret, F.; Ponzio, G.; Gounon, P.; Le Marchand-Brustel, Y.; Giorgetti-Peraldi, S.; Cormont, M.; Bertolotto, C.; et al. Targeting cancer cell metabolism: The combination of metformin and 2-deoxyglucose induces p53-dependent apoptosis in prostate cancer cells. Cancer Res. 2010, 70, 2465–2475. [Google Scholar] [CrossRef] [PubMed] [Green Version]
- Cheong, J.H.; Park, E.S.; Liang, J.; Dennison, J.B.; Tsavachidou, D.; Nguyen-Charles, C.; Wa Cheng, K.; Hall, H.; Zhang, D.; Lu, Y.; et al. Dual inhibition of tumor energy pathway by 2-deoxyglucose and metformin is effective against a broad spectrum of preclinical cancer models. Mol. Cancer Ther. 2011, 10, 2350–2362. [Google Scholar] [CrossRef] [Green Version]
- Cheng, G.; Zielonka, J.; Dranka, B.P.; McAllister, D.; Mackinnon, A.C., Jr.; Joseph, J.; Kalyanaraman, B. Mitochondria-targeted drugs synergize with 2-deoxyglucose to trigger breast cancer cell death. Cancer Res. 2012, 72, 2634–2644. [Google Scholar] [CrossRef] [Green Version]
- Beesley, A.H.; Firth, M.J.; Ford, J.; Weller, R.E.; Freitas, J.R.; Perera, K.U.; Kees, U.R. Glucocorticoid resistance in T-lineage acute lymphoblastic leukaemia is associated with a proliferative metabolism. Br. J. Cancer 2009, 100, 1926–1936. [Google Scholar] [CrossRef] [Green Version]
- Bhowmick, N.A.; Neilson, E.G.; Moses, H.L. Stromal fibroblasts in cancer initiation and progression. Nature 2004, 432, 332–337. [Google Scholar] [CrossRef] [PubMed]
- Burger, J.A.; Ghia, P.; Rosenwald, A.; Caligaris-Cappio, F. The microenvironment in mature B-cell malignancies: A target for new treatment strategies. Blood 2009, 114, 3367–3375. [Google Scholar] [CrossRef] [PubMed] [Green Version]
- Schulz, A.; Toedt, G.; Zenz, T.; Stilgenbauer, S.; Lichter, P.; Seiffert, M. Inflammatory cytokines and signaling pathways are associated with survival of primary chronic lymphocytic leukemia cells in vitro: A dominant role of CCL2. Haematologica 2011, 96, 408–416. [Google Scholar] [CrossRef]
- Karihtala, K.; Leivonen, S.K.; Brück, O.; Karjalainen-Lindsberg, M.L.; Mustjoki, S.; Pellinen, T.; Leppä, S. Prognostic Impact of Tumor-Associated Macrophages on Survival Is Checkpoint Dependent in Classical Hodgkin Lymphoma. Cancers 2020, 12, 877. [Google Scholar] [CrossRef] [Green Version]
- Zhou, T.; Perez, S.N.; Cheng, Z.; Kinney, M.C.; Lemieux, M.E.; Scott, L.M.; Rebel, V.I. Context Matters: Distinct Disease Outcomes as a Result of Crebbp Hemizygosity in Different Mouse Bone Marrow Compartments. PLoS ONE 2016, 11, e0158649. [Google Scholar] [CrossRef]
- Moshofsky, K.B.; Cho, H.J.; Wu, G.; Romine, K.A.; Newman, M.T.; Kosaka, Y.; McWeeney, S.K.; Lind, E.F. Acute myeloid leukemia-induced T-cell suppression can be reversed by inhibition of the MAPK pathway. Blood Adv. 2019, 3, 3038–3051. [Google Scholar] [CrossRef]
- Schiavon, V.; Duchez, S.; Branchtein, M.; How-Kit, A.; Cassius, C.; Daunay, A.; Shen, Y.; Dubanchet, S.; Colisson, R.; Vanneaux, V.; et al. Microenvironment tailors nTreg structure and function. Proc. Natl. Acad. Sci. USA 2019, 116, 6298–6307. [Google Scholar] [CrossRef] [Green Version]
- Zhang, S.; Xiong, Y.; Zhang, Y.; Zhao, H. Targeting of mTORC1/2 by dihydroevocarpine induces cytotoxicity in acute myeloid leukemia. J. Cell. Physiol. 2019, 234, 13032–13041. [Google Scholar] [CrossRef] [PubMed]
- Kiguchi, T.; Niiya, K.; Shibakura, M.; Miyazono, T.; Shinagawa, K.; Ishimaru, F.; Kiura, K.; Ikeda, K.; Nakata, Y.; Harada, M. Induction of urokinase-type plasminogen activator by the anthracycline antibiotic in human RC-K8 lymphoma and H69 lung-carcinoma cells. Int. J. Cancer 2001, 93, 792–797. [Google Scholar] [CrossRef] [PubMed]
- Miyazato, A.; Ueno, S.; Ohmine, K.; Ueda, M.; Yoshida, K.; Yamashita, Y.; Kaneko, T.; Mori, M.; Kirito, K.; Toshima, M.; et al. Identification of myelodysplastic syndrome-specific genes by DNA microarray analysis with purified hematopoietic stem cell fraction. Blood 2001, 98, 422–427. [Google Scholar] [CrossRef] [PubMed] [Green Version]
- Yang, Y.H.; Speed, T. Design issues for cDNA microarray experiments. Nat. Rev. 2002, 3, 579–588. [Google Scholar] [CrossRef]
- Watson, J.V.; Chambers, S.H.; Smith, P.J. A pragmatic approach to the analysis of DNA histograms with a definable G1 peak. Cytometry 1987, 8, 1–8. [Google Scholar] [CrossRef]
- Ormerod, M.G.; Payne, A.W.; Watson, J.V. Improved program for the analysis of DNA histograms. Cytometry 1987, 8, 637–641. [Google Scholar] [CrossRef]
- Zhang, D.; Zhang, M.; Wells, M.T. Multiplicative background correction for spotted microarrays to improve reproducibility. Genet. Res. 2006, 87, 195–206. [Google Scholar] [CrossRef] [Green Version]
- Uzman, B.G.; Foley, G.E.; Farber, S.; Lazarus, H. Morphologic variations in human leukemic lymphoblasts (CCRF-CEM cells) after long-term culture and exposure to chemotherapeutic agents. A study with the electron microscope. Cancer 1966, 19, 1725–1742. [Google Scholar] [CrossRef]
- Yang, I.V.; Chen, E.; Hasseman, J.P.; Liang, W.; Frank, B.C.; Wang, S.; Sharov, V.; Saeed, A.I.; White, J.; Li, J.; et al. Within the fold: Assessing differential expression measures and reproducibility in microarray assays. Genome Biol. 2002, 3, research0062.1. [Google Scholar]
- Storey, J.D.; Tibshirani, R. Statistical methods for identifying differentially expressed genes in DNA microarrays. Methods Mol. Biol. 2003, 224, 149–157. [Google Scholar]
- Freyhult, E.; Landfors, M.; Onskog, J.; Hvidsten, T.R.; Ryden, P. Challenges in microarray class discovery: A comprehensive examination of normalization, gene selection and clustering. BMC Bioinform. 2010, 11, 503. [Google Scholar] [CrossRef] [Green Version]
- Raudvere, U.; Kolberg, L.; Kuzmin, I.; Arak, T.; Adler, P.; Peterson, H.; Vilo, J. g:Profiler: A web server for functional enrichment analysis and conversions of gene lists (2019 update). Nucleic Acids Res. 2019, 47, W191–W198. [Google Scholar] [CrossRef] [Green Version]
- Zhang, B.; Schmoyer, D.; Kirov, S.; Snoddy, J. GOTree Machine (GOTM): A web-based platform for interpreting sets of interesting genes using Gene Ontology hierarchies. BMC Bioinform. 2004, 5, 16. [Google Scholar]


| Latin Enumeration | Parameter 1 | vs. | Parameter 2 |
|---|---|---|---|
| I | vs. | ||
| II | vs. | ||
| III | vs. | ||
| IV | vs. | ||
| V | vs. | ||
| VI | vs. | ||
| VII | vs. | ||
| VIII | vs. | ||
| VII | vs. | ||
| VIII | vs. |
Publisher’s Note: MDPI stays neutral with regard to jurisdictional claims in published maps and institutional affiliations. |
© 2021 by the authors. Licensee MDPI, Basel, Switzerland. This article is an open access article distributed under the terms and conditions of the Creative Commons Attribution (CC BY) license (http://creativecommons.org/licenses/by/4.0/).
Share and Cite
Lambrou, G.I.; Karakonstantakis, T.; Vlahopoulos, S.; Zaravinos, A. Dual Mechanisms of Metabolism and Gene Expression of the CCRF-CEM Leukemia Cells under Glucocorticoid Treatment. Int. J. Mol. Sci. 2021, 22, 5889. https://doi.org/10.3390/ijms22115889
Lambrou GI, Karakonstantakis T, Vlahopoulos S, Zaravinos A. Dual Mechanisms of Metabolism and Gene Expression of the CCRF-CEM Leukemia Cells under Glucocorticoid Treatment. International Journal of Molecular Sciences. 2021; 22(11):5889. https://doi.org/10.3390/ijms22115889
Chicago/Turabian StyleLambrou, George I., Theodoros Karakonstantakis, Spiros Vlahopoulos, and Apostolos Zaravinos. 2021. "Dual Mechanisms of Metabolism and Gene Expression of the CCRF-CEM Leukemia Cells under Glucocorticoid Treatment" International Journal of Molecular Sciences 22, no. 11: 5889. https://doi.org/10.3390/ijms22115889