Article

Human Fibroblasts In Vitro Exposed to 2.45 GHz Continuous and Pulsed Wave Signals: Evaluation of Biological Effects with a Multimethodological Approach

1
Scientific Department, Army Medical Center of Rome, 00184 Rome, Italy
2
Department of Science, University of Rome “Roma Tre”, 00146 Rome, Italy
3
Saint Camillus International University of Health and Medical Sciences, 00131 Rome, Italy
4
Department of Clinical Sciences and Translational Medicine, University of Rome “Tor Vergata”, 00133 Rome, Italy
5
Department of Experimental Medicine, University of Rome “Sapienza”, 00161 Rome, Italy
6
Department of Information Engineering, Electronics and Telecommunications (DIET), University of Rome “La Sapienza”, 00184 Rome, Italy
*
Authors to whom correspondence should be addressed.
Int. J. Mol. Sci. 2020, 21(19), 7069; https://doi.org/10.3390/ijms21197069
Submission received: 3 August 2020 / Revised: 18 September 2020 / Accepted: 23 September 2020 / Published: 25 September 2020

Abstract

:
The increasing exposure to radiofrequency electromagnetic fields (RF-EMF), especially from wireless communication devices, raises questions about their possible adverse health effects. So far, several in vitro studies evaluating RF-EMF genotoxic and cytotoxic non-thermal effects have reported contradictory results that could be mainly due to inadequate experimental design and lack of well-characterized exposure systems and conditions. Moreover, a topic poorly investigated is related to signal modulation induced by electromagnetic fields. The aim of this study was to perform an analysis of the potential non-thermal biological effects induced by 2.45 GHz exposures through a characterized exposure system and a multimethodological approach. Human fibroblasts were exposed to continuous (CW) and pulsed (PW) signals for 2 h in a wire patch cell-based exposure system at the specific absorption rate (SAR) of 0.7 W/kg. The evaluation of the potential biological effects was carried out through a multimethodological approach, including classical biological markers (genotoxic, cell cycle, and ultrastructural) and the evaluation of gene expression profile through the powerful high-throughput next generation sequencing (NGS) RNA sequencing (RNA-seq) approach. Our results suggest that 2.45 GHz radiofrequency fields did not induce significant biological effects at a cellular or molecular level for the evaluated exposure parameters and conditions.

1. Introduction

Radiofrequency electromagnetic fields (RF-EMF) include frequencies ranging from 3 kHz to 300 GHz belonging to the non-ionizing part of the electromagnetic spectrum. Different devices emitting in this range of frequency are currently used in industry, medicine, military, and telecommunication applications.
An exponential increase in the adoption of RF-EMF in wireless communication technologies, such as Wireless Fidelity (WiFi, Bluetooth, etc.), occurred in the last few decades. Therefore, the continuous human exposure to RFs within living and working environments rises concerns about their potential biological effects and possible associated health risks.
Currently, safety standards for limiting human exposures to RF-EMF are based on the well-characterized thermal effect [1]; however, since the amount of energy involved in chronic or long-term exposures to the low-level RF-EMF would not significantly increase the temperature of a cell, tissue, or organism, the understanding of potential non-thermal RF effects has been the focus of several studies.
Although some hypotheses about the non-thermal mechanism of interaction between RF and biological tissue have been proposed [2,3,4], results from the scientific literature are often contradictory and there are still more open questions available than answers.
Therefore, more research is needed, following a multiscale methodology, starting from a first transduction step at molecular scale [4].
Moreover, an interesting scientific question is related to possible different biological effects induced by continuous and modulated wave signals, which occur in a wide variety of RF applications (radar, wireless communications, broadcast communications, and industrial processes). To date, this topic is poorly investigated, and no clear results are reported [5].
Since the effect of RF radiation significantly depends on many variables (frequency, dose rate, waveform, exposure time, modulation, temperature, exposure condition, cellular type, endpoints), the controversial findings can be often related to an inadequate experimental design and a lack of well-characterized exposure systems and conditions [6,7]. In order to ensure non-thermal exposure levels and provide a correct estimate of the specific absorption rate (SAR), much care must be placed in dosimetry, which is the basic requirement for all high-quality investigations [8,9,10].
Many in vitro studies focus on a possible RF genotoxic effect exerted on DNA molecules, such as single strand breaks (SSBs) and double strand breaks (DSBs) and/or chromosomes, causing structural or numerical aberrations in cells that are crucial events in the carcinogenesis process [11]. Based on the limited evidence of the carcinogenic potential in both human and animal investigations, RF exposure is classified as a possible human carcinogen (class 2B) [12].
Most of the studies assessed DNA SSBs and DSBs through comet assay, reporting, in many cases, no DNA damage [13,14]. A more specific and sensitive method to evaluate the presence of DSBs based on the identification of the phosphorylated H2AX histone (γ-H2AX), alone or in association with p53 binding protein 1 (53BP1), was used in a few studies. Some of these researches, performed on different cellular models exposed to various RF fields, reported no induction of DSBs [15,16]. Interestingly, some studies reported a significant reduction in the number of γ-H2AX/53BP1 in human lymphocytes from both healthy and hypersensitive persons exposed to different frequencies (915 MHz, 905 MHz), suggesting that this frequency could affect cells in a manner similar to the stress factor [17,18].
The most common method used to evaluate the chromosomal damage is the micronucleus assay, in which the presence of micronuclei (MN), which may originate from chromosome fragments or whole chromosomes, are assessed in binucleated (BN) cells [19]. Most of the studies employing this endpoint have been performed on human blood cultures and showed contradictory results, reporting an increased MN induction in the cultures exposed to different frequency ranges [20,21,22,23,24,25,26] or no effect [23,27,28,29,30,31,32].
In order to identify the different MN origins, which may reflect structural as well as numerical chromosome aberrations, some authors combined the results obtained from the MN analysis and the comet assay. Among these studies, no DNA damage or MN induction was observed in several cellular models exposed with different parameters and conditions [29,30,33]. Conversely, Tice et al. observed an increased MN frequency in lymphocytes, following 24 h of exposure (835 MHz, SAR 10 W/kg), and an absence of DNA damage by comet assay, thus suggesting an aneugenic effect [24]. Another strategy, which allows the discrimination of MN arising from entire chromosomes from those arising from acentric fragments, is based on the presence or absence of centromere in MN through the evaluation of a fluorescent signal. Schwarz et al. performed fluorescence in situ hybridization (FISH) for all centromeres and reported an increased DNA damage in human fibroblast, but not in lymphocytes, exposed to 1.9 GHz (CW; SAR = from 0.05 to 2 W/kg) in a dose and time-dependent way due to increased MN frequency based on the formation of acentric fragments and an enhanced comet tail factor [34].
Some authors evaluated aneuploidy events using a FISH-based approach for a specific chromosome pair in interphase cells. Among these, Mashevich et al. observed an increased aneuploidy for chromosome 17 on human peripheral blood lymphocytes, exposed for 72 h to 830 MHz as a function of the SAR (CW; SAR = from 1.6 and 8.8 W/kg) [35]. This finding was confirmed in a later study performed on the same cellular model and exposure conditions, in which an increased rate of aneuploidy was observed for chromosome 1 and 10 (SAR = 4.1 W/kg) and for chromosome 11 and 17 (SAR = 2.9 W/kg) [36].
Only in one study, FISH was performed in metaphase human peripheral blood lymphocytes exposed to 1.9 GHz for 24 h (SAR = 0.5 and 2 W/kg) and it was reported that SAR may either influence the repair of X-ray-induced DNA breaks or alter the cell death pathways of the damage response [37].
The different MN origin can be also evaluated by using centromeric labeled antibodies (CREST analysis), whereas centromere-negative MN (MN−) reflects chromosome breakage and centromere-positive MN (MN+) indicates chromosome loss. In a recent study, Franchini et al. reported aneuploidy induction in human fibroblasts exposed to 25 GHz (SAR = 20 mW/g), due to chromosome loss highlighted by a significant increase in MN+ assessed by MN-CREST analysis on interphase cells [16].
On the contrary, Bourthoumieu et al. found no significant change in the rate of aneuploidy using interphase FISH for chromosomes 11 and 17 in human amniotic cells exposed for 24 h to 900 MHz (SAR = 0.25, 1, 2 and 4 W/kg) [38].
Other extensively evaluated endpoints are related to cell proliferation and cell cycle analysis. Few in vitro studies reported changes in cell proliferation rate [39,40] or an impaired cell cycle after RF exposure [41,42], whereas most studies reported no effect [16,31,43,44,45,46,47].
Very few investigations focused on the identification of cellular morphological changes through ultrastructural observation. Erdine et al. described different degrees of damage in mitochondria, microtubules, and microfilament of rat’s axon exposed to the pulsed RF field [48], whereas Franchini et al. reported a normal cellular structure exhibited by human fibroblast after exposure to 25 GHz [16].
In order to understand the underlying mechanism between RF and the biological matter, a new interesting field of research is related to the identification of possible sensitive genes, which change their expression profile after exposure. To date, few large-scale studies performed using microarray technology have investigated RF-EMF effects on gene expression with contradictory results, showing that it is difficult to find a marked cellular response to this radiation.
Zhao et al. reported that intermittent in vitro exposure of rat neuron cultures to 1.8 GHz increases or decreases the expression of genes involved in multiple cellular functions, including cytoskeleton, signal transduction pathways, and metabolism [49].
Some authors, who exposed different human cell types to 900 and 1800 MHz, reported a cell-dependent effect of RF exposure on gene expression [50,51].
Le Quèment et al. showed that 60 GHz had no massive effect on human keratinocytes but could change the expression levels of some genes [52]. In a subsequent study, performed on the same cellular model and frequency, whole transcriptome analysis revealed a slight but specific radiation effect on gene expression in hyperthermia conditions [53]. However, in several other studies, no effect on gene expression was reported on different cellular models exposed to various RF fields using microarrays [54,55,56,57,58,59].
Among the in vivo studies, Dasdag and co-authors reported that chronic exposure to 2.45 GHz increased the expression of some microRNAs (miRNA) in rat brains [60]. In another in vivo study, McNamee et al. evaluated gene expression changes in several rodent brain regions exposed to 1.9 GHz (CW and PW RF fields; 4 h/day for 5 consecutive days), reporting no consistent changes in gene expression [61].
The introduction of high-throughput technologies, such as next generation sequencing (NGS), which also allows whole transcriptome analysis through RNA sequencing (RNA-seq), seems to be a powerful and promising approach to identify RF-EMF specific gene expression patterns.
To the best of our knowledge, only three in vivo studies evaluated the genome-wide mRNA expression profile using the Illumina sequencing technology, reporting differentially expressed genes in Caernorhabditis elegans after prolonged exposure to 1.75 GHz (SAR = 3 W/kg) [62] and in some genes related to energy metabolism in budding yeast after exposure to 50 Hz and 2.0 GHz [63]. A more recent study performed on Escherichia coli K-12 DH5α exposed to 2.4 GHz for 5 h reported that most of the genes identified were involved in many cellular and metabolic processes [64].
In this heterogeneous context, the present in vitro study focused on the biological effects of 2.45 GHz at a SAR value of 0.7 W/kg through a well-characterized exposure system and condition. Moreover, both continuous (CW) and pulsed (PW) wave signals were evaluated, since, to date, few and controversial results are available on this topic.
The aim of this study is to provide a comprehensive insight into the potential RF biological effects at the cellular level through a multimethodological approach that includes genotoxic, cell cycle, and morphological analyses and genome-wide mRNA expression profile using a high-throughput sequencing approach (RNA-seq), attempting to elucidate the underlying mechanism.

2. Results

The overall results of this study suggest that 2.45 GHz doesn’t induce genotoxic and cytotoxic effects with both CW and PW types of signals after 2 h of exposure at the SAR of 0.7 W/kg. Interestingly, the results obtained from gene expression analysis, performed through the NGS approach (RNA-seq) at different time points after exposure (0 min, 2 and 24 h), showed a modulation of some genes involved in multiple functions. Although not all the genes selected for RT-PCR validation were confirmed as significantly differentially expressed and showed a different fold change values, a similar trend in the direction of change observed by RNA-seq was confirmed.

2.1. Cell Cycle Analysis

The FACS analysis on DNA content was performed 2 and 24 h after exposure to 2.45 GHz (CW or PW). Results obtained from the cells exposed to the two different types of signals were compared to those of the corresponding sham samples. No significant changes in the different phases of the cell cycle were observed 2 and 24 h after exposure to both CW and PW signals (Table 1).

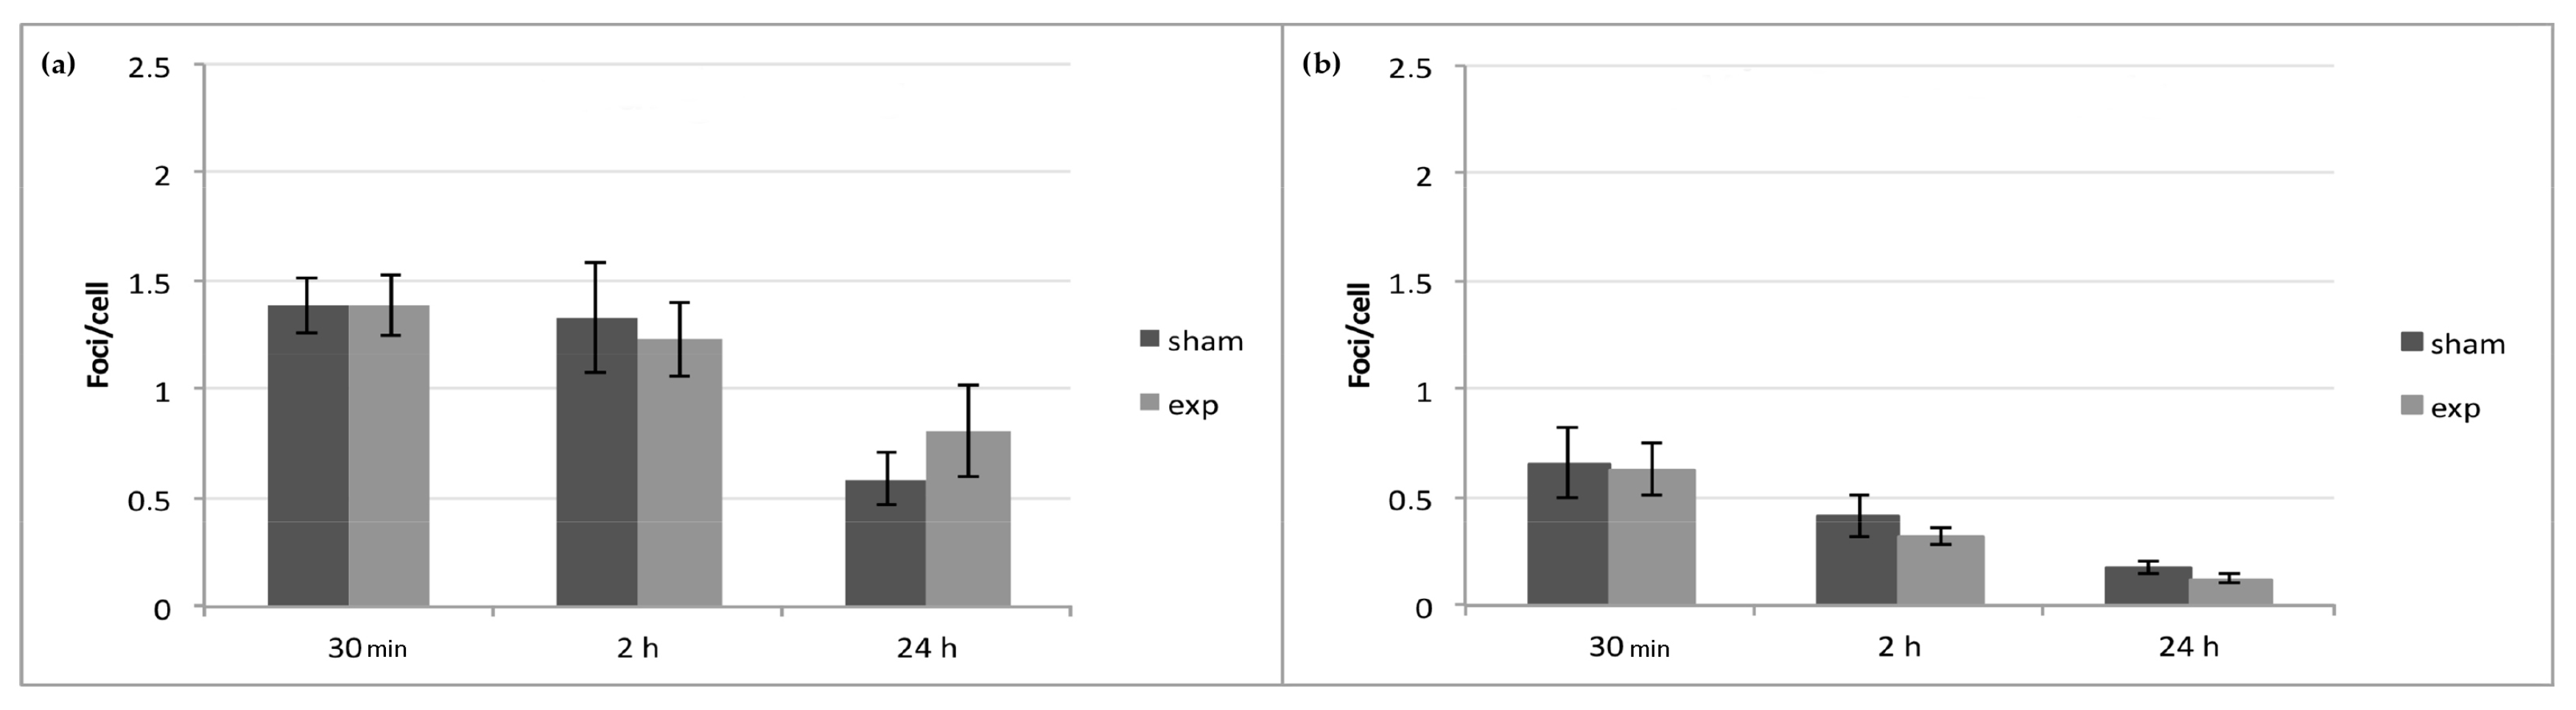
2.2. γ-H2AX/53BP1 Assay

The analysis of colocalized γ-H2AX/53BP1 foci showed no significant differences (p > 0.05) between exposed and sham samples (exposed 2 h vs. sham 2 h; exposed 24 h vs. sham 24 h) for both types of signals (CW or PW) (Figure 1).

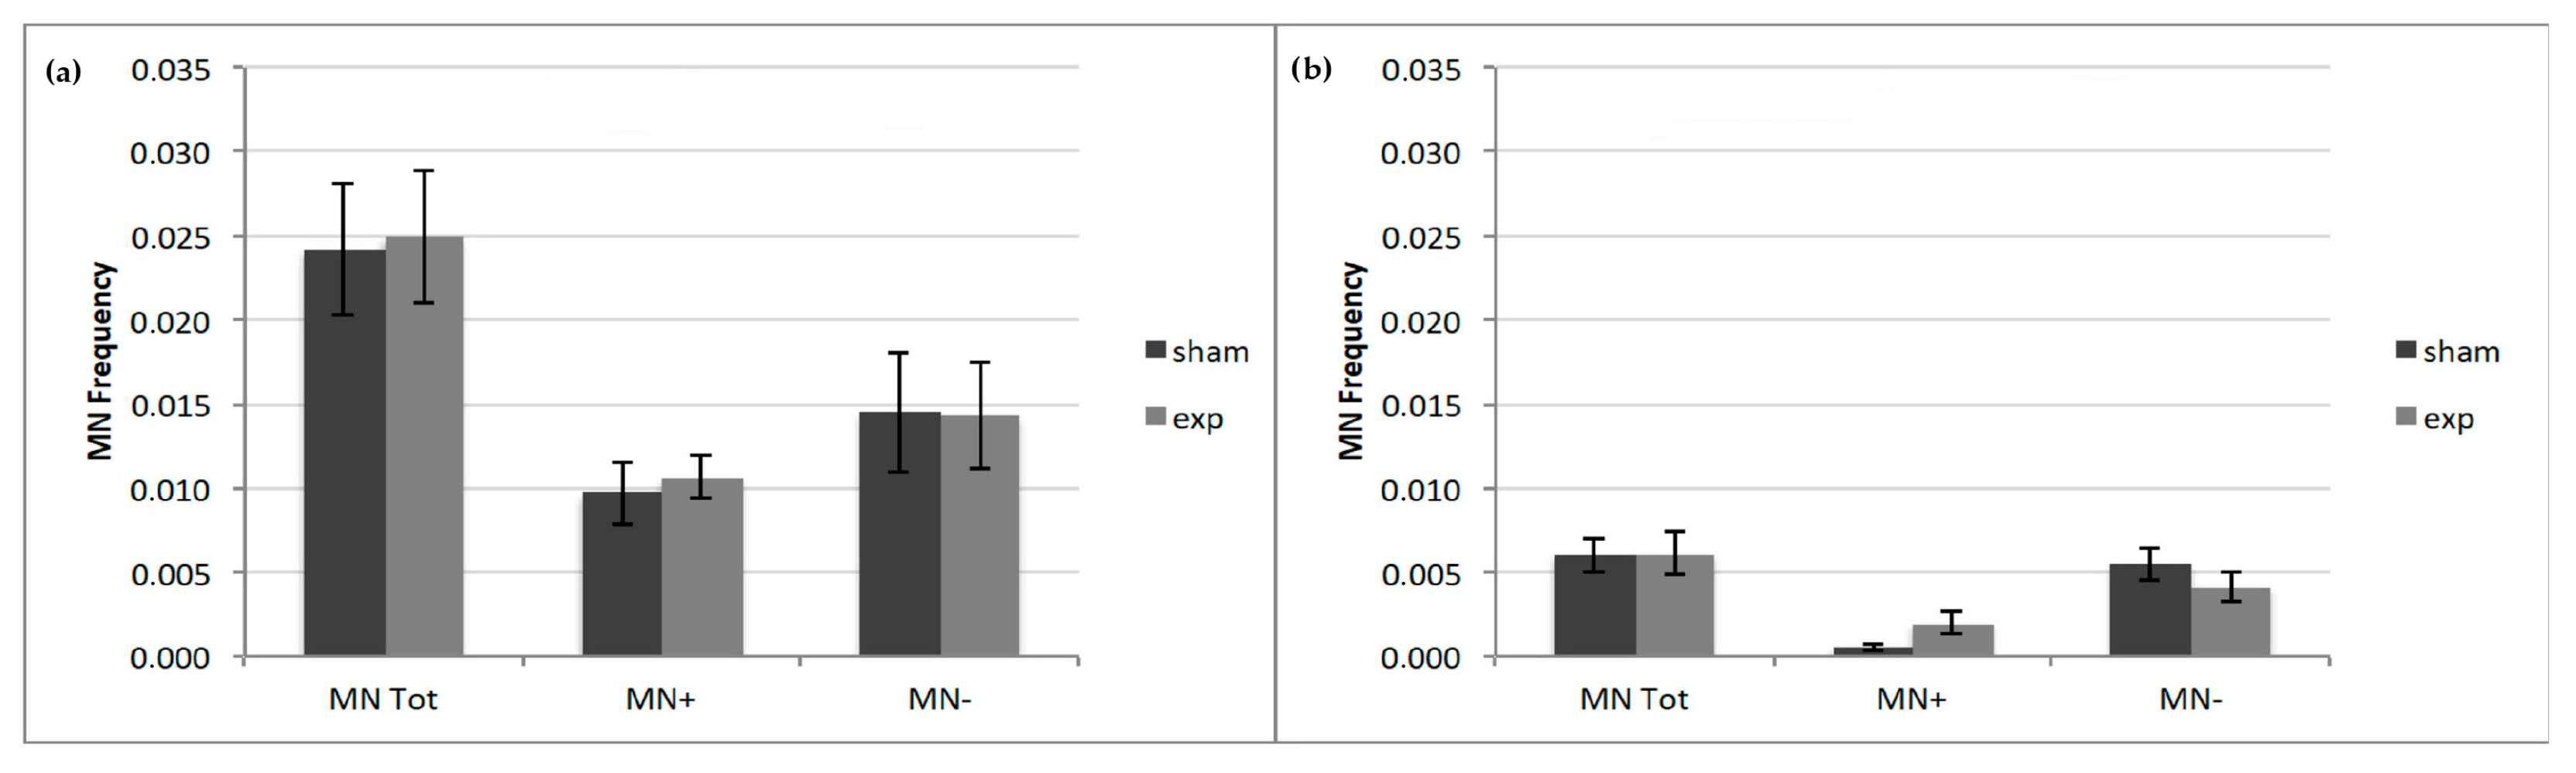
2.3. Micronuclei Anti-Kinetochore Antibody (CREST) Analysis

For both CW and PW signals, CREST analysis on exposed samples, with respect to the sham samples, showed no significant increase in the total number of MN, corresponding to the sum of CREST positive (MN+) and CREST negative (MN−) micronuclei. Similarly, no significant increase was observed in the frequency of MN+ and MN− in the exposed samples (CW or PW), with respect to the sham samples (Figure 2).

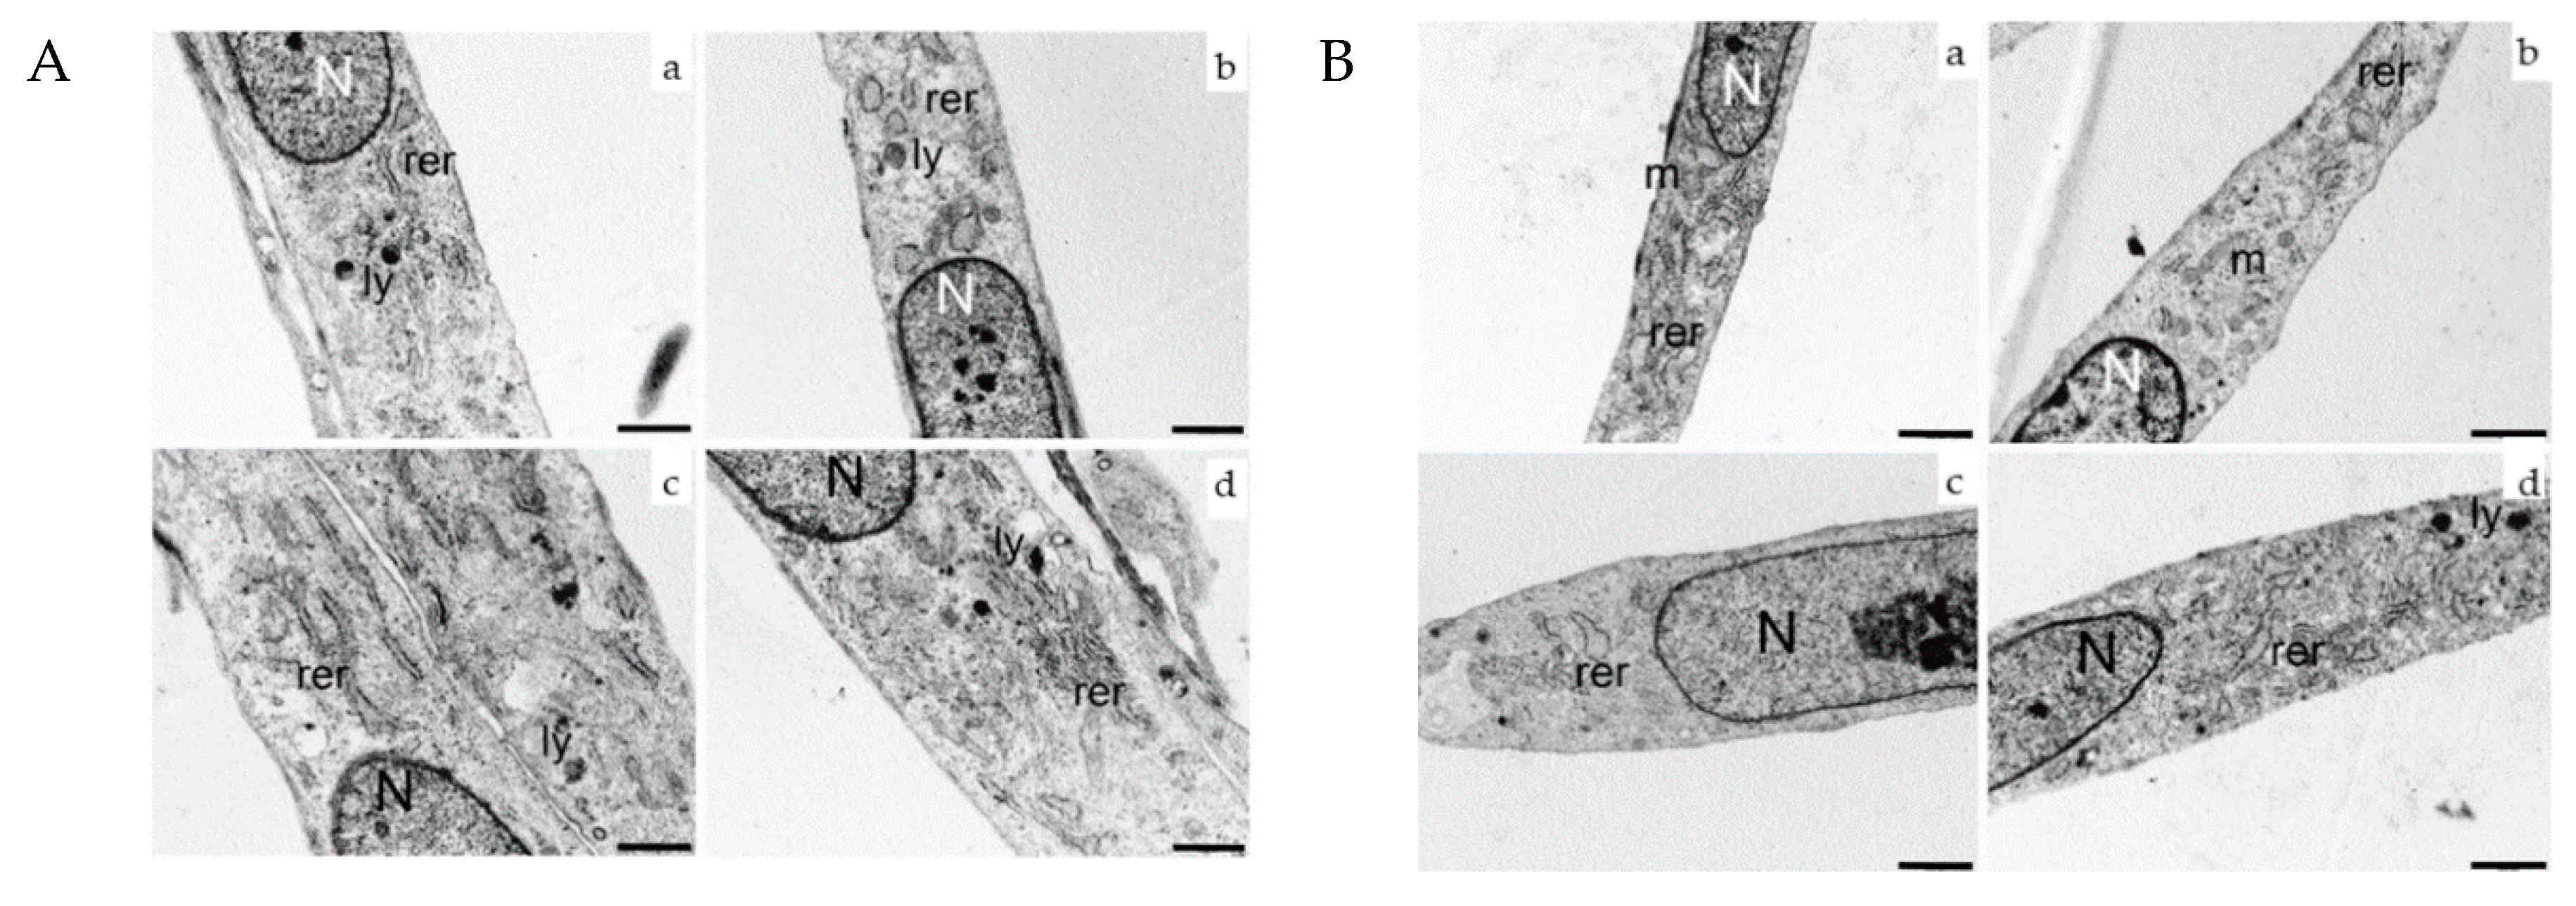
2.4. Ultrastructural Analysis

Ultrastructural analysis was performed on HDF cells exposed to 2.45 GHz (CW or PW) and, compared to sham control cells, 2 and 24 h after exposure. No morphological differences were observed between sham and CW or PW exposed cells, as shown in Figure 3. Sham and exposed samples from both signals (CW or PW) and for each time point evaluated appeared as elongated cells with elongated centrally located nuclei, essentially formed by euchromatin with poor heterochromatin and well-organized nucleoli. Abundant rough endoplasmic reticulum sometimes dilated, and few mitochondria and lysosomes were visible in the cytoplasm.

2.5. Gene Expression Profiling

Gene expression profiling was evaluated using the mRNA-seq approach on the Illumina NextSeq 500 platform. The analysis was performed on RNA samples isolated from sham and 2.45 GHz (CW or PW) exposed cells at three different time-points: immediately after and 2 and 24 h post-exposure (0 min; 2 h; 24 h). For both CW and PW signals, four experimental replicates were performed, with a total of 48 sequenced samples (24 for CW experiment and 24 for PW experiment). For each run, eight samples were sequenced, with an average of 50 million generated reads per sample and about 8% of poor-quality trimmed reads.
To identify genes presenting significant changes in expression, two different statistical tools were used (DESeq2 and EdgeR). The thresholds of false discovery rate (FDR) < 0.01 were used to determine the significantly up-regulated or down-regulated genes between different groups. Thereafter, the above statistical analysis, performed with DESeq2 and EdgeR, was repeated under lower-stringency parameters, without FDR-adjustment, considering a p-value ≤ 0.05 and a fold change of 1.5 as the minimum cut-off value.

2.5.1. Differential Gene Expression Analysis

Differential gene expression (DGE) between cells exposed to 2.45 GHz (CW and PW) and sham-control samples, following statistical analysis using an FDR-adjusted p-value cut-off, evidenced only one target gene in the samples examined 2 h after CW exposure. This probe was a long non-coding RNA (RNA Component of Mitochondrial RNA Processing Endoribonuclease (RMRP) that resulted in down-regulation.
The statistical analysis was also performed without the FDR correction, considering p ≤ 0.05 and a fold change of 1.5 as the minimum cut-off value. With this approach, a total of 53 genes, for CW exposed samples, and 33 genes, for PW exposed samples, were identified as differentially expressed in exposed samples (Table 2 and Table 3). Interestingly, 6 (5 up-regulated; 1 down-regulated) and 5 genes (3 up-regulated; 2 down-regulated) were differentially modulated in the samples processed immediately after exposure to 2.45 GHz CW and 2.45 GHz PW, respectively. In the samples analyzed 2 h after CW and PW exposure, 39 (19 up-regulated; 20 down-regulated) and 22 genes (9 up-regulated; 13 down-regulated) were identified, respectively. On the other hand, only 8 (5 up-regulated; 3 down-regulated) and 7 genes (up-regulated) were found modified, 24 h after exposure to CW and PW, respectively. For both types of signals evaluated, most of the responsive genes were identified 2 h after exposure, thus suggesting a transient and reversible cellular response. Only 3 genes (RN7L1, RNA, 7SL, cytoplasmic 1; RN7L2, RNA, 7SL, cytoplasmic 2; ANKRD36C, Ankyrin repeat domain-containing protein 36) were observed to be down-regulated (fold change > 1.5), both 2 and 24 h after exposure to 2.45 GHz CW, with respect to the sham group. Only 2 genes (RMRP, RNA Component of Mitochondrial RNA Processing Endoribonuclease; AHNAK2, Protein AHNAK2) showed an altered gene expression profile 2 h after exposure to both CW and PW exposures.

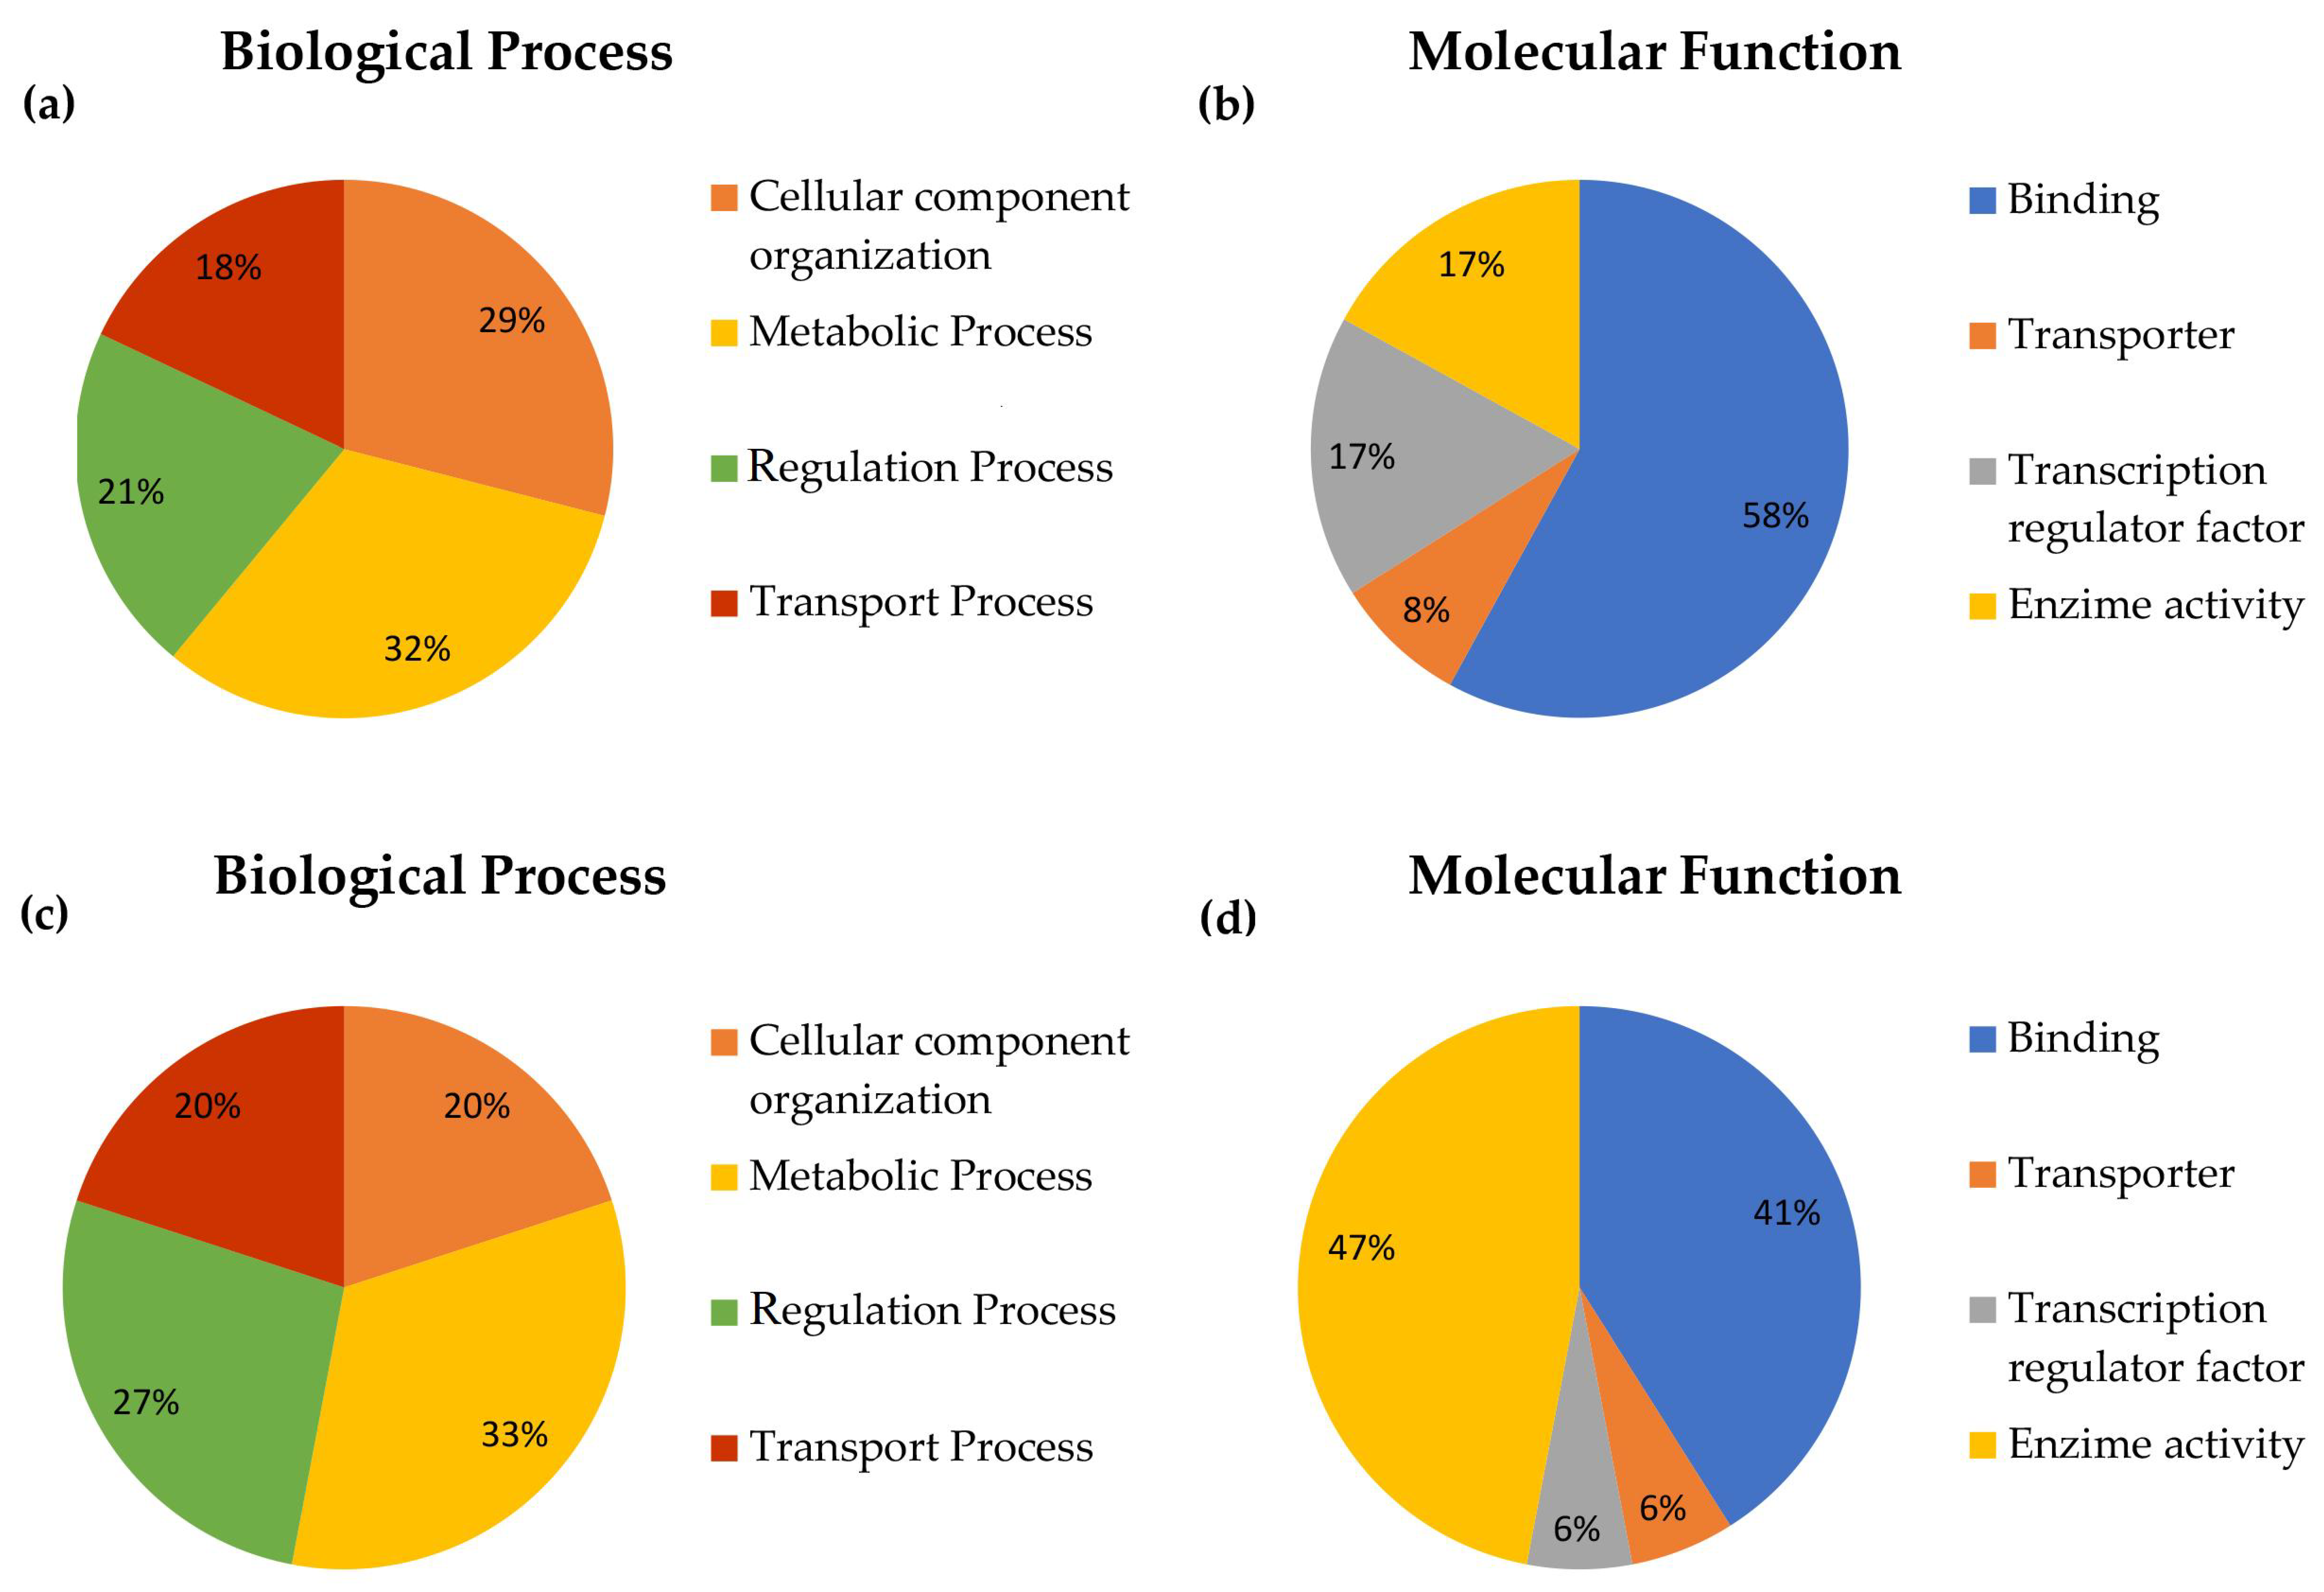
2.5.2. DGE Functional Classification

To determine whether CW or PW exposure could affect the pattern of gene expression, gene ontology (GO) terms analysis of the DGEs was performed on three ontology levels: biological processes, molecular functions, and pathways. The results are summarized in Figure 4.
For the samples exposed to 2.45 GHz CW, the modulated genes results, mainly involved in metabolic and cellular component organization (Figure 4a) and their most relevant molecular function, were related to binding activities (Figure 4b). No significantly-affected signaling transduction pathways were identified. The results obtained for the genes differentially expressed after exposure to 2.45 GHz PW indicated that the most relevant biological processes in which they were involved were related to metabolic or regulation processes (Figure 4c), with many of them having binding or catalytic activity (Figure 4d). Even for this type of exposure, no significantly-affected signaling transduction pathways were identified. Additional information about the up- and down-regulated genes within each functional network for the two type of signals are reported in Figure 5.

2.5.3. Quantitative RT-PCR Validation

In order to ensure the reproducibility of the results, RT-PCR validation was performed on five genes (RMRP, RNA Component Of Mitochondrial RNA Processing Endoribonuclease; Alms1, Alstrom syndrome protein 1; BSN, Protein bassoon; SYNE2, Nesprin-2; AHNAK2, Protein AHNAK2), selected on the basis of their fold change and p-value. The RT-PCR validation step was performed on the same RNA used for the RNA-seq, derived from four independent exposures.
RT-PCR analysis showed that only one gene, among the five selected, could be confirmed as a differentially expressed gene (Table 4). This gene was BSN (t-test, p = 0.0097), which encodes for a scaffolding protein that appears to be involved in the organization of the presynaptic cytoskeleton. Although the fold change of the selected genes detected by RT-PCR were not the same as those detected by RNA-seq, the results agreed in terms of direction of change, as reported in Table 4.

3. Discussion

The goal of the current study was to provide a complete insight into the potential RF biological effects at the cellular and molecular level, in human fibroblasts in vitro exposed to 2.45 GHz through a multimethodological approach and well-characterized exposure systems and conditions.
The selected frequency was 2.45 GHz, because the widespread use of Wi-Fi technologies in everyday life is leading to concerns about possible health consequences. Moreover, because of the growing interest in possible different biological effects related to signal modulation, this research focused on the study of both CW and PW signals, with a SAR value of 0.7 W/kg, below the maximum limit of 2 W/kg recommended by the European guidelines for limiting the exposures to RF-EMF [1]. The used dose is considered the worst case, since, in actual everyday exposure to Wi-Fi signals, this level is hardly achievable due to the low radiated power (100 mW EIRP) imposed by the international standards [65] for this kind of technology.
Many investigations assessed the non-thermal biological effects, especially the genotoxic potential, of these radiations through in vitro and in vivo studies [13,66]. Although some hypothesis about the possible non-thermal mechanism of interactions have been proposed, very few of them can explain these controversial outcomes [2,3,4]. The difficulties in the interpretation of the results could be related, in some cases, to temperature increase during the experiment, inadequate experimental procedure, or inexhaustive information provided. In the light of these observations, in the present study, much emphasis has been placed on the exposure system and a well-considered experimental design. In order to exclude that any biological alterations associated with the exposures could be related to thermal effects, during the experiments cell culture temperature was monitored through a Fluoroptic Thermometer. The temperature inside the Petri dishes remained at 37 ± 0.25 °C during the 2 h of exposure. Accordingly, the reported results are of a non-thermal nature. Moreover, in order to minimize the individual biases, all experiments for each endpoint assessed were performed at least in triplicate and the analyses were carried out in a blind manner [10,67].
The analysis of possible non-thermal genotoxic and cytotoxic effects suggests that 2.45 GHz did not induce neither aneugenic or clastogenic effects within the exposure conditions evaluated and there were no significant differences between the two types of signals tested. Our findings regarding flow cytometry analysis are in accordance with previous studies investigating the effects of different RF radiation on various cellular types [16,68,69,70], showing no effects on the cell cycle. The evaluation of chromosomal damage and its origin, assessed by indirect immunofluorescence CREST-MN analysis, showed no aneugenic or clastogenic effects for both types of signals. These observations are in agreement with other studies evaluating chromosomal damage by the conventional MN assay on different cellular types exposed to 2.45 GHz [71,72] or to other RF ranges [30,73,74]. Moreover, the absence of a clastogenic effect was confirmed by the γ-H2AX/53BP1 foci assay, which showed no significant induction of DSBs. This finding was in agreement with a previous study, in which γ-H2AX/53BP1 was assessed on the same cellular type exposed to a different RF radiation [16]. Additionally, other investigations confirm this result by using comet assay on human lymphocytes [73] or on different cellular types exposed to Wi-Fi frequencies with both continuous and modulated signals [75].
No morphological changes related to 2.45 GHz exposures for both signals and time-points evaluated were observed by transmission electron microscopy, according to previous in vitro studies on human dermal fibroblasts [16] or on other cellular models [76] exposed to different types of RF radiation.
The current study is relevant, with regard to gene expression analysis. To the best of our knowledge, this is the first study assessing gene expression alterations in human cells in vitro exposed to RF using the high-throughput RNA-seq approach.
The mRNA sequencing was performed at three different time points (0 min, 2 h, and 24 h) after exposure to both CW and PW 2.45 GHz, and, in order to give consistency and robustness to the results, four experimental replicates were performed. The identification of differentially expressed genes, performed under rigorous statistical analysis (FDR), showed only one down-regulated long non-coding RNA (RMRP, RNA Component of Mitochondrial RNA Processing Endoribonuclease) 2 h after 2.45 GHz CW exposure.
Since the application of FDR analysis may have determined the exclusion of some true positive events (type 2 error), a second statistical analysis was performed without FDR-corrected approach [61,77], by which only those genes with p-values less than 0.05 and a fold-change of 1.5 were selected. Using this method, as expected, some genes showed differential expression profiles for both types of exposures and for each time point evaluated. After gene ontology terms analysis, these genes resulted involved in multiple biological processes related to metabolism, signal transduction, and cellular component organization. Most of the transcripts, belonging to the same functional class, were either up- or down-regulated, making it difficult to establish a common trend. Overall, the results indicated that, for both types of signals, there is a minimal induction of genes with altered expression profile immediately after exposure and the number increased 2 h post-exposure, while few genes were detected 24 h after exposures. Furthermore, the genes appear to follow a time-dependent modulation profile, since they showed distinct temporal response. There were no differentially expressed genes in common between the two types of signals, other than RMRP, which showed a down-regulated expression profile 2 h after both CW and PW exposures, and AHNAK2 (Protein AHNAK2), for which the pattern of expression was the opposite with the different types of exposure (up-regulated 2 h after CW exposure and down-regulated 2 h after PW exposure).
Since differences detected by mRNA-seq technology after RF-EMF exposure may result in very small changes, in order to exclude false positive results, five genes were selected for RT-PCR validation, based on fold change, low p-value, and biological function. These include the long non-coding RNA RMRP, which showed a down-regulated expression profile 2 h after exposure to both CW and PW signal and was also the only expression profile detected under FDR statistical analysis (after CW exposure). Although RMRP functions are not fully understood, it has been reported that it may play a role in mitochondrial DNA replication, where it cleaves the RNA primer, consisting of an RNA/DNA hybrid, which initiates the mitochondrial DNA replication [78]. Moreover, RMRP seems to form, together with the catalytic subunit of the telomerase (hTERT), an RNA-dependent RNA polymerase that converts single-stranded RMRP RNA into double-stranded RMRP [79]. Another selected gene was AHNAK2, differentially expressed 2 h after both CW and PW exposure, with an opposite direction of change. This gene encodes for a secreted protein that appears to be implicated in metabolic processes that are involved in signal transduction mechanisms [80]. Finally, some up-regulated cytoskeleton-related genes, identified 2 h after exposure to CW, including ALMS1 (Alstrom syndrome protein 1), BSN (Protein bassoon), and SYNE2 (Nesprin-2), were selected for the validation. These genes seem to be interesting, since previous investigations speculated that RF might cause perturbation on the cytoskeleton and spindle assembly through microtubules vibration [81] and some studies suggested aneuploidy induction after exposure to RF [16,35,36], which could be related to problems in spindle microtubule formation, resulting in defects in the attachment to kinetochores.
RT-PCR validation analysis showed that, among the selected genes, only BSN could be confirmed as differentially expressed (t-test, p = 0.0097). This gene, primarily expressed in neurons in the brain, encodes for a scaffolding protein that seems to be involved in the organization of the cytoskeleton in a specific site in the axon terminal, which regulates neurotransmitter release (https://www.ncbi.nlm.nih.gov/gene/8927#gene-expression). It also participates in the formation of vesicles that are transported along axons to sites of synaptic contacts. In addition, BSN was also found to regulate Wnt signaling pathway (involved in signal transduction pathway) [82]. Even if transient, the overexpression of this cytoskeleton-related gene in dermal fibroblasts after RF exposure is of interest, since some previous studies suggested the ability of RF to influence cytoskeleton structure [16,35,36,81]. The role of this gene in regulating Wnt is noteworthy because this signaling pathway is involved in skin development, cell migration, and cell polarity [83], and an alteration of this has been reported to be a causative factor for a number of pathologies, including breast, colon, and skin cancer [84,85]. Additional studies in dermal cells should be carried out to understand biological function of BSN in this tissue and its possible involvement in the biological response to RF exposure.
In the present study, despite the fold change detected by mRNA-seq, which was not the same and was generally larger than that obtained by RT-PCR, as reported in a previous study [63], it was possible to observe, for all the genes analyzed, a similar trend between the results obtained from the two methodologies, in terms of direction of change. The discrepancies between the fold changes observed with the two methods can be related to the differences in the normalization process of data analysis between the two techniques, since the unit of measure is different. For this reason, we can suppose that the missing confirmation through validation for most of the genes can be related to the subtle nature of changes and to the methodological differences between mRNA-seq and RT-PCR. This suggests the usefulness of using both techniques in order to obtain an unambiguous result.
Considering previous studies evaluating the effect of Wi-Fi radiation on gene expression, some in vivo studies reported that long-term exposure to 2.4 GHz altered the expression of miRNA and gene expression in rat brains [60,86]. A recent study, investigating the alterations in the bacterial transcriptome profiling, reported an influence on genes responsible for metabolic and cellular processes, localization, stress response, transposition, motility, chemotaxis, and cell adhesion after exposure to Wi-Fi radiofrequency radiation [64].
Among the in vitro studies, Sakuraj et al. reported no significant gene expression modulation in human glial cells at different SAR values (1, 5, and 10 W/kg) and times of exposure (1 h, 2 h, and 24 h) using DNA microarray [56]. Another research, performed on HL-60 cells exposed for 2 or 6 h (SAR 10 W/kg), reported several genes differentially expressed, but these results originate from a single experiment and were not confirmed by RT-PCR [87].
The comparison between our results and previous studies evaluating the RF-induced gene modulation is difficult because they are still very heterogeneous. This variability could be related to different frequencies, biological models, and methodological approaches used. Some of the studies reporting positive findings are based on an insufficient number of experimental replicates and suffer methodological limitation, due to the lack of validation through RT-PCR [50,87,88]. The strength of our study is related to the use of a very rigorous multimethodological approach, due to the high number of replicates, the controlled experimental conditions, especially for the exposure system, and the use of the high-throughput RNA-seq analysis in combination with the RT-PCR validation.
In summary, the present work suggests that, within the exposure conditions evaluated, 2.45 GHz did not induce non-thermal genotoxic effects. With regard to gene expression analysis, the present study provides the most comprehensive analysis of potential gene expression changes in human fibroblasts exposed to Wi-Fi. No evidence of altered gene expression was observed under FDR-corrected analysis, whereas some genes differentially expressed were identified using a non-FDR statistical analysis. Most of these genes were involved in biological processes, such as the metabolism, signal transduction, and cellular component organization. Interestingly, for both types of signals evaluated, most of the responsive genes were identified 2 h after exposure, thus suggesting a transient and reversible cellular response.
Concluding, the approach proposed in this study may open the door to additional high-quality investigations, since the improvement of experimental quality, through appropriate procedural protocols, is crucial in this research field in order to address more clearly the often-ambiguous results on the potential adverse effects of RF-EMF exposure on human health. Moreover, further studies employing RNA-seq analysis on different cellular models and for longer times of exposure are recommended in order to provide additional insight regarding the mechanism of possible Wi-Fi effects on biological systems and also to give a contribution to ensure the validity of the results in terms of robustness, accuracy, and reproducibility.

4. Materials and Methods

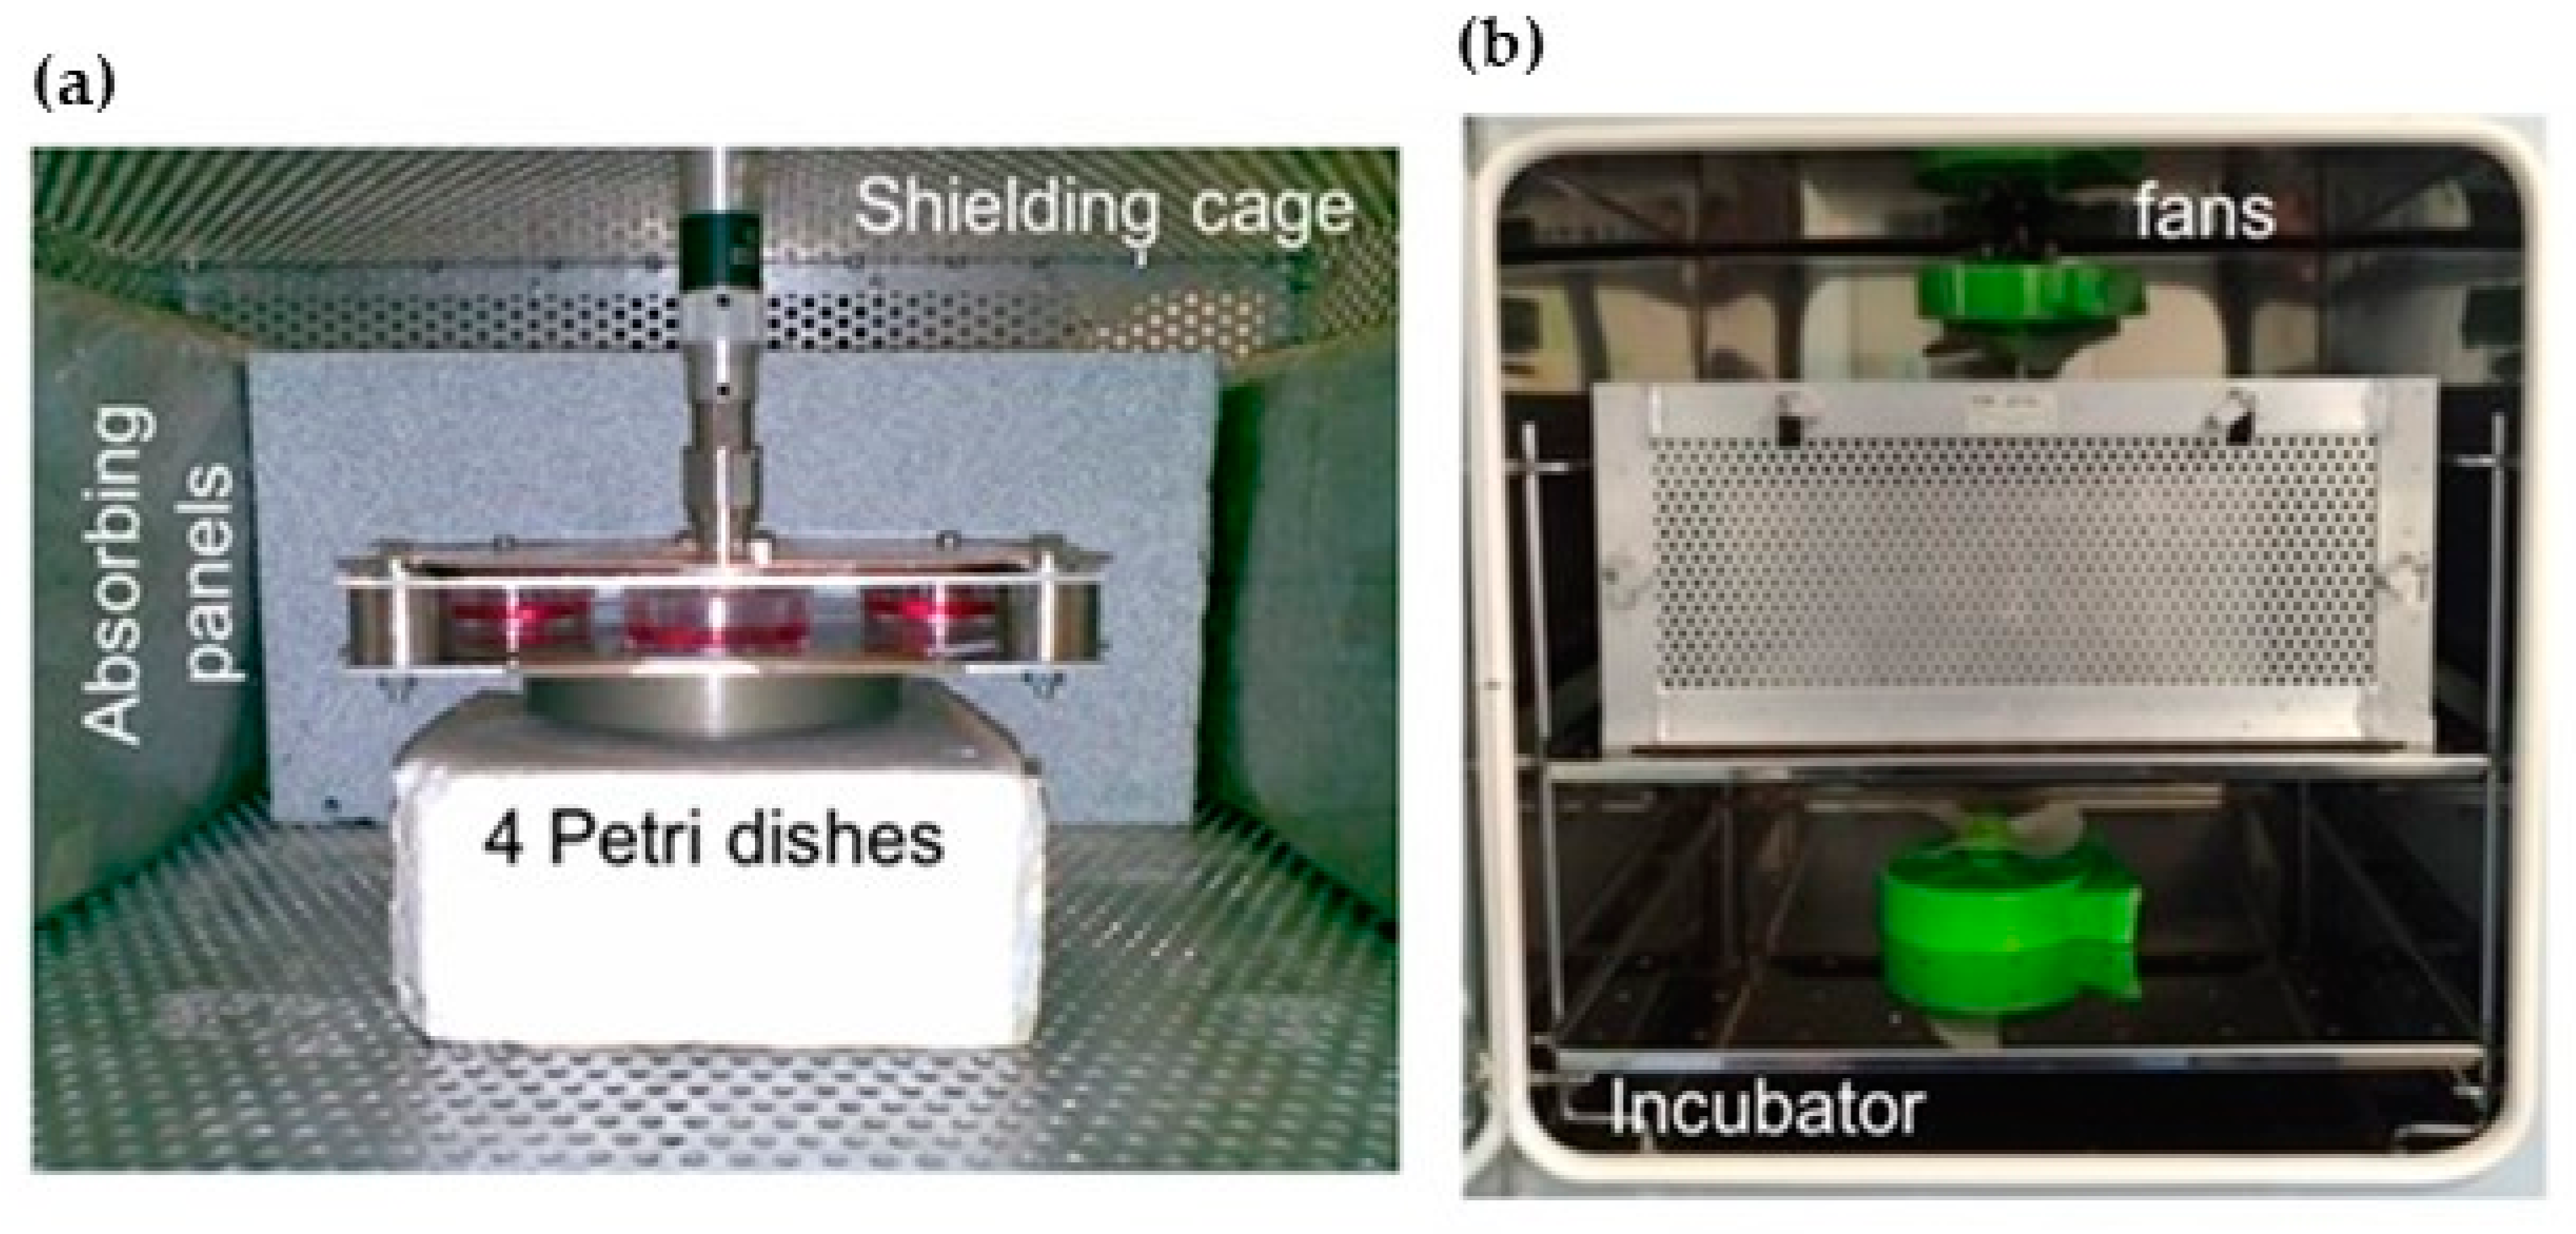
4.1. Exposure System and Dosimetry

To carry out the investigation, the exposure system published in [89] was used. It is based on a WPC suitably designed to operate at the Wi-Fi frequencies (2.40–2.48 GHz). As discussed in [89], a WPC is a special kind of resonant EM structure, where the biological samples are placed between two squared metallic plates short-circuited at each corner. This kind of system is generally compact and presents quite good efficiency values in terms of induced SAR in the sample per unitary input power. Being an open structure, it guarantees an easy accessibility to the sample but needs an EM-compatible arrangement. Due to the small space around the samples, generally, a mechanism for the local temperature control is also needed. The WPC used in this work can allocate four 35 mm Petri dishes, filled with 2 mL of biological samples in correspondence of each side, and is small enough (250 mm side, 15 mm height) to fit inside a commercial incubator, as shown in Figure 6. The efficiency, calculated by means of numerical simulations and experimentally validated in [89], is equal to 1.1 (W/kg)/W in cell monolayers, with a homogeneity of 70%.
To avoid EM interference with the incubator, the WPC was placed inside a perforated metal cage and internally covered with foam absorbing panels (Figure 6a).
The samples were exposed for 2 h either to a CW at 2.45 GHz or to the same carrier modulated in amplitude with a square pulse 1 ms period and 50% duty cycle (PW), representative of a Wi-Fi burst. The signal was delivered to the WPC by a generation system and remotely controlled by a LabVIEW™ program, which can generate both CW and differently modulated signals [90,91].
The chosen dose was 0.7 W/kg, which was below the limit of 2 W/kg set by the international regulations (ICNIRP). In actual everyday human exposure to Wi-Fi signals, this level is hardly achievable due to the low radiated power (100 mW EIRP) imposed by the international standards for this kind of technology [64]. Therefore, the used dose is considered as the worst case. In the meantime, this dose guarantees the avoidance of possible confounding thermal effects when a simple setup for temperature control, based on two fans (see Figure 6b), is used. Details on temperature measurements are given in Section 4.2.
Considering the WPC efficiency, to obtain a SAR of 0.7 W/kg, averaged over time, inside the cell monolayer, the incident power was set to 0.6 W and 1.2 W for the CW and the PW, respectively.
During the experiments, the incident power was continuously monitored using a bi-directional coupler and an Agilent E4419B Power Meter.

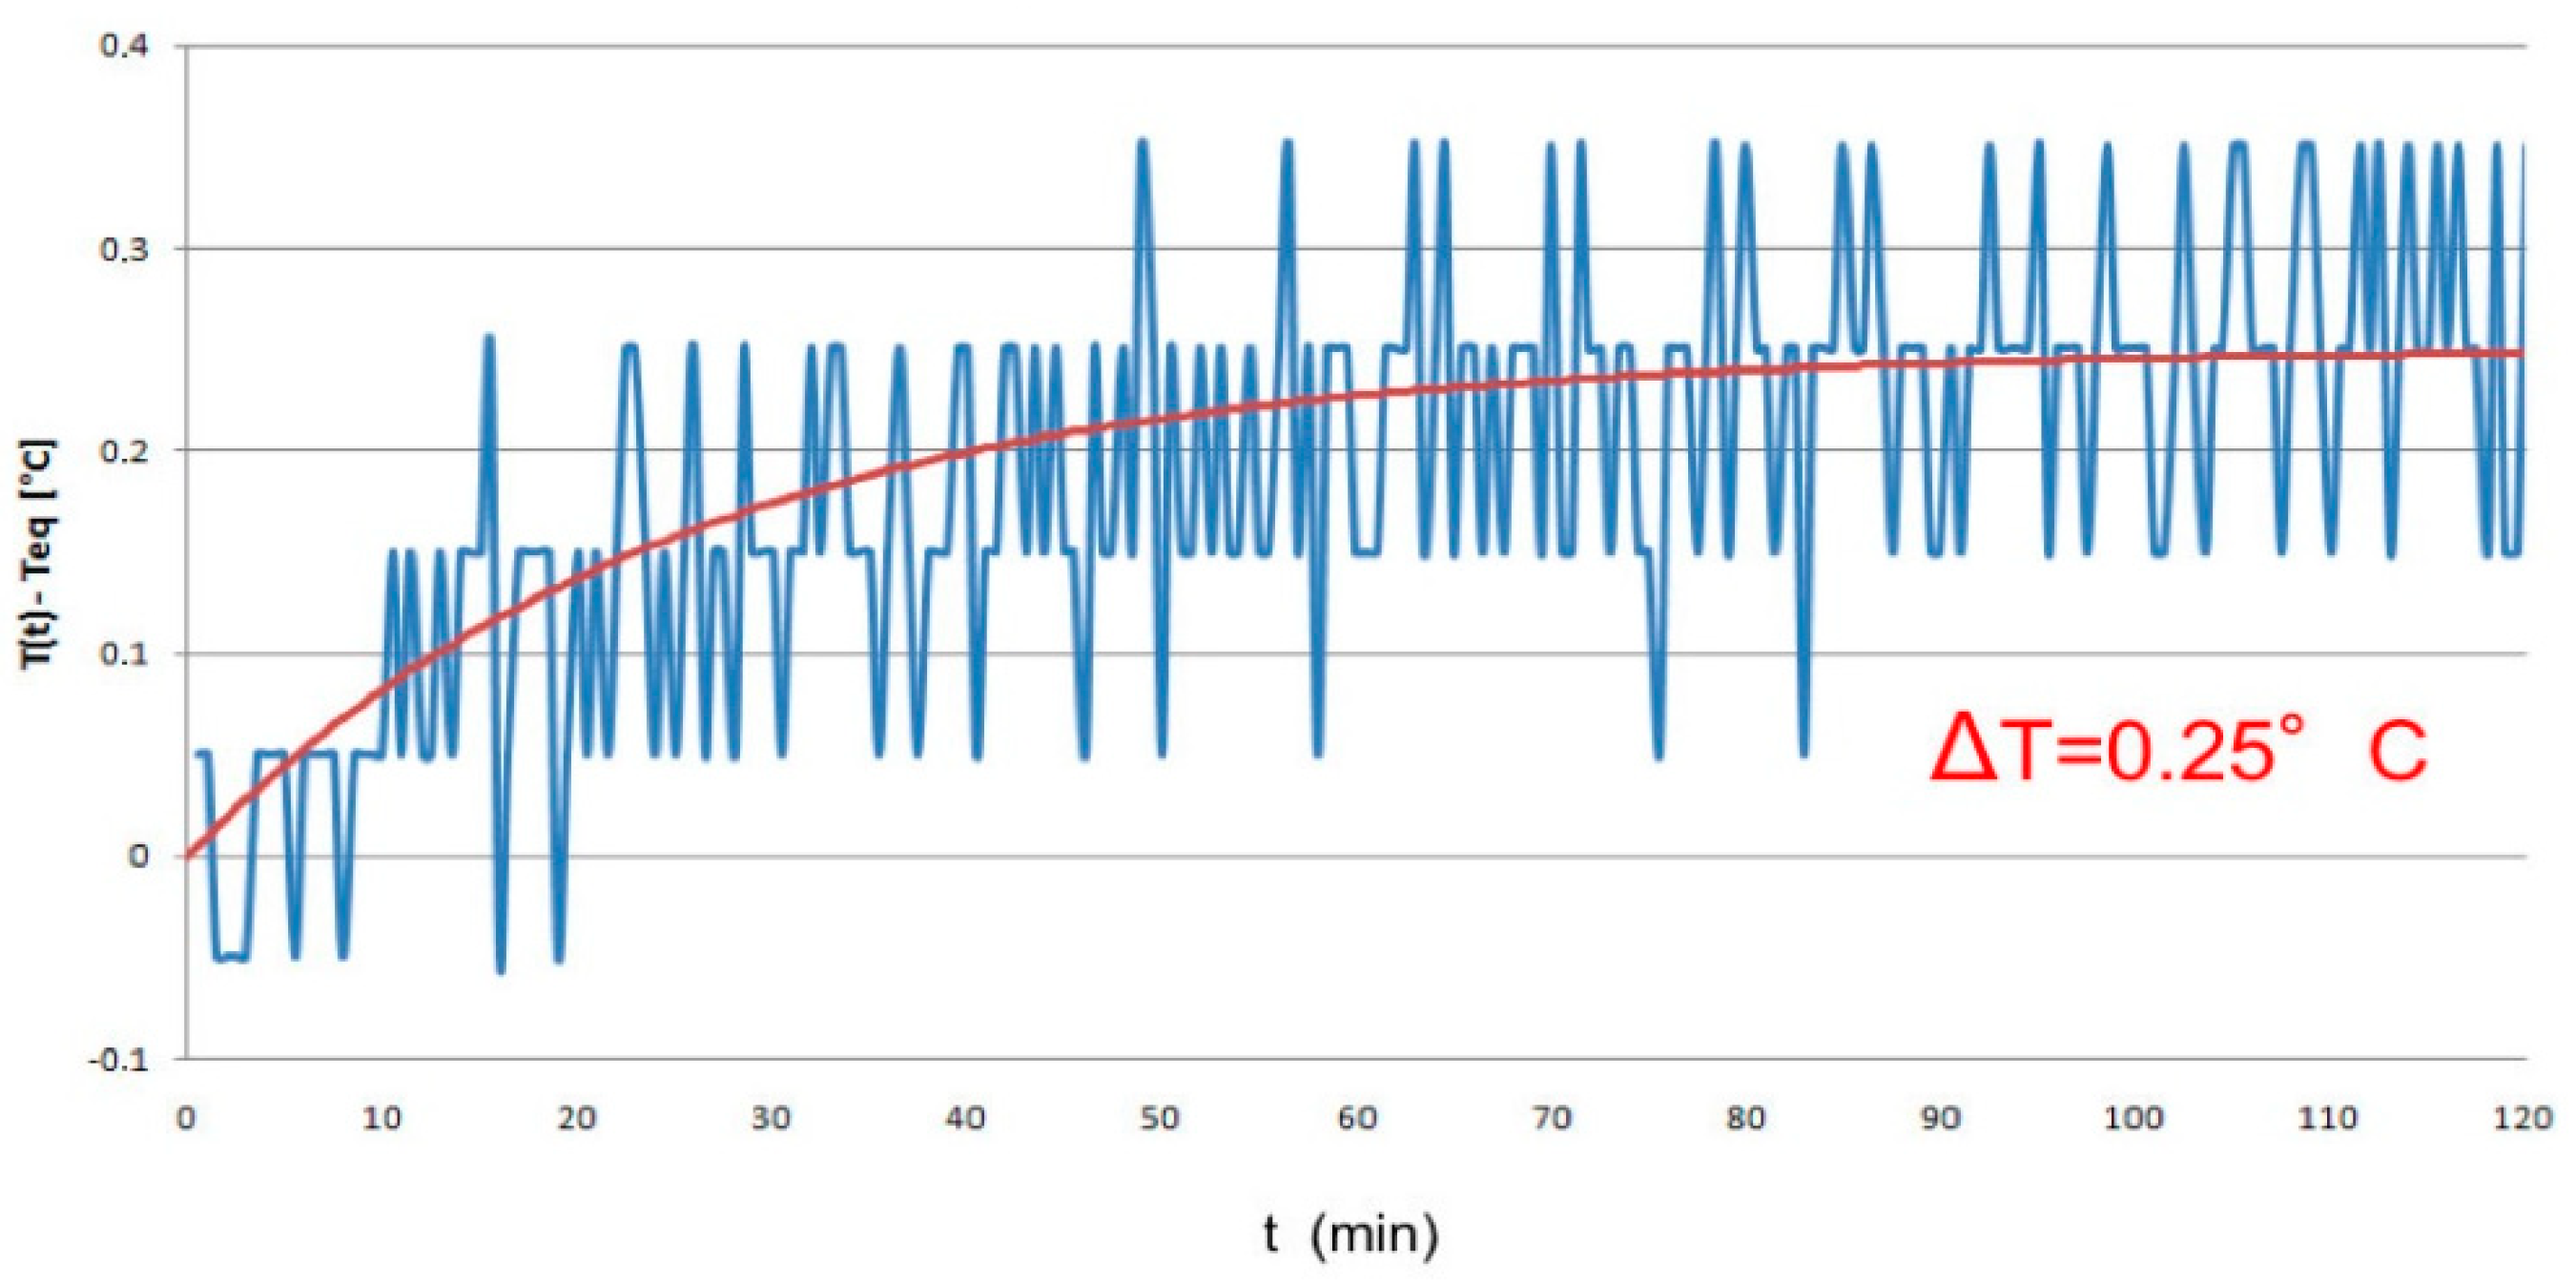
4.2. Temperature Monitoring

One of the aspects that must be accurately monitored and controlled during the exposure to EM fields is the temperature increase, in order to prevent thermal effects to mask possible non-thermal effects [67].
Temperature was measured inside one of the Petri dishes filled with 2 mL of culture medium using a Luxtron 712 Fluoroptic probe during the exposure to the CW at 2.45 GHz and 0.7 W/kg of SAR. Figure 6 shows the measured temperature increase during 2 h exposure time. As evident from the temperature trend shown in Figure 7, the arrangement with two fans placed on the top and bottom of the shielding cage (see Figure 6b) guarantees that the temperature increase at the steady state is equal to 0.25 °C, which is well below the threshold for the onset of thermal effects [67].

4.3. Cell Cultures and Exposure Protocol

Human adult fibroblasts (HDF) (Cell Applications, Inc, San Diego, CA, USA) primary cells derived from normal human dermis were used in these experiments. Two lots of different donors were used, one derived from the normal facial skin of a 75 year-old Caucasian man (lot A) and the other one from the normal breast skin from a 54 year-old Caucasian female (lot B). Cells were cultured in Dulbecco’s Modified Eagle Medium (DMEM) (Euroclone, Pero, Italy), supplemented with 10% foetal bovine serum (Euroclone), 1% 2 mM Lglutamine, 1% penicillin/streptomycin (Thermo Fisher Scientific, Monza, Italy), and 1% non-essential amino acids (Euroclone). Cell cultures were grown incubated at 37 °C at 5% CO2. In order to prevent any problem of senescence or drift of the cellular population and to ensure the reproducibility of the results, all the experiments were performed on primary fibroblasts at the same passage (number 6). Cells from lot A were used for CW exposures and from lot B for PW exposures.
About 24 h before exposure, cells were seeded into 3.5 cm diameter polystyrene Petri dishes (Corning Incorporated, Corning, NY, USA) in 2 mL of medium at the density of 2 × 10⁵ cells, and the medium was changed just before exposure. The considered exposure duration was a short-term 2 h exposure. To maintain cells under appropriate conditions (37 °C, 5% CO2), all the exposures were performed in the incubator for cell culture. For each exposed sample, a corresponding sham-exposed control sample, kept in the same incubator without RF transmission, was included. Cells were harvested at different time points after exposure, depending on the endpoint evaluated. An independent RF exposure experiment consisted of four exposed and four sham-exposed Petri dishes. At least three independent biological replicates for each endpoint and condition and a blind evaluation of the different time-points were performed in order to minimize the individual biases.

4.4. Cell Cycle Analysis

The exposure effect on the cell cycle was determined by flow cytometric analysis. At and 24 h after irradiation, adherent and suspended cells were harvested, centrifuged at 1500 rpm for 10 min, and washed twice with cold phosphate buffered saline (PBS). The assay was then performed, as previously described in Benvenuto et al. [92]. Cells were analyzed with flow cytometry using a FACS Calibur cytometer, running CellQuest Pro 5.2 software (BD Biosciences, San Jose, CA, USA).

4.5. γ-H2AX/53BP1 Immunofluorescence Staining

Analysis of γ-H2AX/53BP1 colocalized foci was performed by immunofluorescence staining 30 min, 2 h, and 24 h after exposure. After irradiation, cells were spotted on coverslips and fixed using 2% formaldehyde/PBS for 5 min, permeabilized using 0.5% Triton-X/PBS for 5 min, and blocked using 1% bovine serum albumin (BSA) (Sigma-Aldrich, Italy) in PBS for 10 min. Cells were then incubated with a combination of 1:500 mouse monoclonal anti-γH2AX antibody (Merk Millipore Sigma-Aldrich,) and 1:1000 rabbit polyclonal anti-53BP1 antibody (Calbiochem, Sigma-Aldrich) in 1% BSA/PBS for 45 min at room temperature in a wet chamber. Subsequently, cells were washed in 1% BSA/PBS three times for 3 min and incubated in 1:500 anti-mouse Alexa Fluor 488 conjugated antibody (Molecular Probes, Life technologies, Thermo Fisher Scientific) and 1:500 anti-rabbit Alexa Fluor 555 Goat anti Rabbit IgG (Molecular Probes, Life technologies, Thermo Fisher Scientific) for 30 min at room temperature in a wet chamber in the dark. The cells were extensively washed with PBS and dried, and finally slides were mounted with 4,6-diamidino-2 phenylindole (DAPI) in Vectashield (Vector Laboratories, DBA Italia s.r.l., Italy) solution and turned upside down on the slide, and the edges were sealed using nail polish.
Slides were viewed with an epifluorescence microscope (Imager Z1, Carl Zeiss, Germany), equipped with a charge-coupled device (CCD) camera. The automated image acquisition was performed using Metafer 4 software (version 3.6.9, from MetaSystems, MA, USA). A total of 100–250 fields of each spot were selected and acquired by the Metafer Autocapt module, using an immersion plan Apochromat oil 63X objective (Carl Zeiss). To compile all of the three-dimensionally distributed gamma-H2AX foci throughout the nuclei in one image, 26 2D-images for each field were acquired with a 0.3 µm z-axis step between two slides. The resulting fields of view (FOV) were transformed into training images (TNR) with the “Create TRN from FOV” to allow each color channel to be exported as an individual greyscale tiff file.
The foci scoring was performed in uncompressed high-quality images using the free cell image analysis software CellProfiler version 2.0, (Broad Institute, Cambridge, MA, USA), as described by Carpenter et al. [93].

4.6. Micronuclei Anti-Kinetochore Antibody (CREST) Analysis

Cytokinesis-blocked binucleated (BN) cell preparations were obtained according to the Cytokinesis Block MicroNucleus (CBMN) technique. After exposure, cytochalasin B (3 µg/mL final) (Sigma-Aldrich), was added to irradiated and sham cultures to block cytokinesis. After 24 h incubation at 37 °C, cells were harvested, treated with hypotonic solution (KCl 0.075 M), fixed in absolute ice-cold methanol, and processed for anti-kinetochore staining. Cells were washed for 3 min in PBS-Tween20 (0.01%) and in PMN solution (20% phosphate buffer pH 8, 0.5% Nonidet, 0.02% sodium azite, 5% fat-free milk powder and H2O). CREST anti-kinetochore antibody (Antibody Inc. Davis, CA, USA) 1:1 in PBS-Tween20 (0.1%) was put on slides that were incubated overnight in a wet chamber at 37 °C. Three wash steps were then performed in PBS/BSA 1% (5 min) and one in PMN. The Rabbit anti-human IgA, IgG, IgM (H + L), FITC-conjugated secondary antibody (Sigma Immunochemicals, St. Louise, MO, USA) was then added on the slides in a 1:80 dilution in PBS/BSA 1%. Slides were let dry for 45 min in a wet chamber at 37 °C. Three washing steps in PBS/BSA 1% were performed, followed by one wash in cold PBS 1X. Slides were then counterstained with DAPI (2 µg/mL) 1:1 with Vechashield antifade. MN were classified for the presence (CREST-positive, MN+) or absence (CREST-negative, MN-) of kinetochore reaction under appropriate filters for DAPI and FITC, using an 40× objective. The scoring was performed using a fluorescence microscope Axio Imager A1 (Carl Zeiss, Berlin, Germany), following the scoring criteria described for MN in Fenech and Morley [19].

4.7. Statistical Analysis

Statistical analyses have been performed using different tests, according to the assay. A t-test was used for γH2AX/53BP1 and FACS analyses. The chi-squared test was carried out for MN-CREST analyses. Statistical significance was considered for the value p < 0.05.

4.8. Transmission Electron Microscopy

Ultrastructural analysis was performed on samples 2 h and 24 h after exposure by cell observation with transmission electron microscopy. Cells were fixed in 2.5% glutaraldehyde in PBS (pH 7.4) at 4 °C and post-fixed with 1.33% osmium tetroxide, dehydrated in graded alcohols, and then embedded in Epon 812 resin (Fisher Chemical Co., Dallas, TX, USA). The resin was allowed to polymerize in a dry oven at 60 °C, and specimens were cut on a Reichert-Jung ultra-microtome (Leica Microsystems GmbH, Wetzlar, Germany), stained with uranyl acetate and lead citrate, and observed under a Philips Morgagni 268D transmission electron microscope (Thermo Fisher Scientific, Waltham, MA, USA) [94].

4.9. Gene Expression Profiling

4.9.1. RNA Extraction

Total RNA from exposed samples and the respective control sham samples, was isolated using QIAamp RNA Blood Mini Kit (Qiagen) immediately after, 2 h after, and 24 h after 2.45 GHz (CW or PW) exposure, according to the manufacturer’s instructions. RNA concentration was measured using QuantiFluor RNA system (Promega, Madison, WI, USA) and the samples were stored at −80 °C.

4.9.2. mRNA Sequencing

For the sample preparation, TruSeq Stranded mRNA (Illumina, San Diego, CA, USA) was used and the starting amount of total RNA was of 500 ng/µL. From the total RNA, poly-A mRNA was purified using poly-T oligo attached magnetic beads. First and second strand cDNA was synthesized obtaining blunt-ended cDNA and a single ‘A’ nucleotide was added to the 3′ ends of the blunt fragments. The adapter oligonucleotides were ligated to the cDNA and amplified by a PCR, performed with a PCR Primer Cocktail (Illumina) that anneals to the ends of the adapters. Prior to sequencing, the libraries were validated, checking the size (approximately 260 bp) and purity using a DNA-specific chip (Agilent DNA 1000) on an Agilent Technologies 2100 Bioanalyzer (Santa Clara, CA, USA). After validation, the libraries were normalized and pooled. The pool to be sequenced was then denatured and diluted in the resulted optimal concentration (1.2 pM). High-throughput next generation sequencing was performed using the Illumina sequencing technology platform (NexSeq500). The output of the sequencing consists of generating raw reads (FASTQ format) as starting material for the analysis of the mRNA-seq data.

4.9.3. Data Analysis and Statistical Methodology

Reads generated during the Illumina sequencing process were quality checked using FastQC (v.0.11.7) (Babraham Institute, Cambridge, UK). Trimming of the poor-quality bases (qscore < 20) was performed using the Sickle software (v.1.33) (UC Davis Bioinformatics Core, Davis, CA, USA) (https://github.com/najoshi/sickle). The trimmed reads were mapped to the human reference genome (UCSC hg19 version) using the Subread software (v.1.6.1) (Walter and Eliza Hall Institute of Medical Research, Parkville, Victoria, Australia) with default parameters. The number of reads, trimmed reads, and aligned reads for each sample are reported in Supplementary Table S1. At gene level, the reads quantification was performed with the featureCounts tool (v.1.6.1), with the human genome annotation file in GTF format. In order to identify the differentially expressed genes (DEGs), the DESeq2 (v.1.28.1) and EdgeR (v.3.30.3) R packages were applied. A false discovery rate (FDR) with p-adjusted ≤ 0.01, was used as parameter to identify differentially expressed genes. Results of the statistical analysis without FDR adjustment, considering a p-value of ≤ 0.05 and fold change of 1.5 as the minimum cut-off value, were also considered. Heat maps were used to display the expression profile of genes differentially expressed at different time points in CW and PW conditions (Supplementary Figure S1).

4.9.4. Functional Analysis of Differentially Expressed Genes

To perform the characterization of molecular functions or pathways, in which DGEs are involved, the Protein Analysis Through Evolutionary Relationships (PANTHER) classification system was used [95]. This classification system is part of the Gene Ontology (GO) Phylogenetic Annotation Project, and the analysis of the screened DGEs was performed on the three ontology levels, biological processes, molecular functions, and pathways.

4.9.5. Validation Experiments Using Real-Time Quantitative PCR (qRT-PCR)

Based on mRNA-seq results, five candidate transcripts were selected based on the higher expression values in comparison to sham control samples, for validation by qRT-PCR.
Aliquots of total RNA (1 µg) were reverse-transcribed (1×/25 °C/10 min, 1×/37°C/ 120 min, 1 × 85 °C/5 min, 1 × 8 °C/10 min) with the High-Capacity cDNA Reverse Transcription Kit (Applied Biosystem, CA, USA).
The PCR reaction was performed in duplex and contained TaqMan Universal PCR Master Mix (Applied Biosystem), 18S rRNA as the endogenous control (Applied Biosystem), and one of five inventoried TaqMan minor groove binder assays for detection of candidate transcripts, using commercially available inventoried primer probe designs, listed in Table 5. The qRT-PCR run was performed on the StepOne (AB) platform (1×/50 °C/2 min 1×/95 °C/10 min 40×/95 °C/1 min 60 °C/1 min).
The cycle threshold (Ct) values of the genes of interest were normalized, relative to 18S rRNA. On each plate, we added a no template control, and PCRs were performed in triplicate on four cDNA preparations, corresponding to four independent exposures. The 18S rRNA-Ct values were used as quality control markers for the cDNA synthesis. The relative expression of each mRNA was calculated by the ΔCt method, and data were expressed as fold of induction, which correspond to the ratio of exposed mRNA to sham mRNA.

Supplementary Materials

The following are available online at https://www.mdpi.com/1422-0067/21/19/7069/s1.

Author Contributions

Conceptualization, E.R., A.S., S.D.S., and F.L.; formal analysis, A.A., M.B., L.M., R.B., G.D., A.P., and E.T.; investigation, E.R. and V.F.; resources, A.S. and F.L.; supervision, S.D.S., A.S., and F.L.; software, G.D. and A.P.; writing—original draft preparation, E.R.; writing—review and editing, A.S., A.A., S.D.S.,V.F., R.B., L.M., M.B., A.P., and G.D.; supervision, A.S. and F.L. All authors have read and agreed to the published version of the manuscript.

Funding

This research was supported by the Italian Ministry of Defense, SEGREDIFESA/DNA—5th Department of Technological Innovation (GREAM 2 Project).

Acknowledgments

We thank Giovanni Faggioni (Scientific Department, Army Medical Center of Rome) for his help with gene expression validation experiments, Anna Maria Palozzi and Antonella Fortunato (Scientific Department, Army Medical Center of Rome) for their technical support in mRNA sequencing, and Elisa Coluzzi (Department of Science, University of Rome “Roma Tre”) for her advice with CREST immunostaining. Authors would like to thank Francesca Apollonio and Micaela Liberti for the use of the exposure setup, Giovanni Calcagnini and Federica Censi for the use of the temperature probe, and Rosanna Pinto for her support in setting up the shielding cage.

Conflicts of Interest

The authors declare no conflict of interest.

References

  1. ICNIRP. Guidelines for limiting exposure to electromagnetic fields (100 kHz to 300 GHz). Health Phys. 2020. pre-print. [Google Scholar] [CrossRef]
  2. Repacholi, M.H. Low-level exposure to radiofrequency electromagnetic fields: Health effects and research needs. Bioelectromagnetics 1998, 19, 1–19. [Google Scholar] [CrossRef]
  3. Sheppard, A.R.; Swicord, M.L.; Balzano, Q. Quantitative evaluations of mechanisms of radiofrequency interactions with biological molecules and processes. Health Phys. 2008, 95, 364–397. [Google Scholar] [CrossRef] [PubMed] [Green Version]
  4. Apollonio, F.; Liberti, M.; Paffi, A.; Merla, C.; Marracino, P.; Denzi, A.; Marino, C.; D’Inzeo, G. Feasibility for Microwaves Energy to Affect Biological Systems via Non-Thermal Mechanisms: A Systematic Approach. IEEE Trans. Microw. Theory Tech. 2013, 61, 5. [Google Scholar] [CrossRef]
  5. Juutilainen, J.; Hoyto, A.; Kumlin, T.; Naarala, J. Review of possible modulation-dependent biological effects of radiofrequency fields. Bioelectromagnetics 2011, 32, 511–534. [Google Scholar] [CrossRef]
  6. Guy, A.W.; Chou, C.K.; McDougall, J.A. A quarter century of in vitro research: A new look at exposure methods. Bioelectromagnetics 1999, 20, 21–39. [Google Scholar] [CrossRef]
  7. WHO International EMF Project. 2010 WHO Research Agenda for Radiofrequency Fields; WHO International EMF Project: Geneva, Switzerland, 2010; Available online: https://apps.who.int/iris/bitstream/handle/10665/44396/9789241599948_eng.pdf (accessed on 24 May 2020).
  8. Paffi, A.; Apollonio, F.; Lovisolo, G.A.; Marino, C.; Pinto, R.; Repacholi, M.; Liberti, M. Considerations for Developing a Radiofrequency Exposure System: A Review for in vitro Biological Experiments. IEEE Trans. Microw. Theory Tech. 2010, 58, 2702–2714. [Google Scholar] [CrossRef]
  9. Kuster, N.; Schönborn, F. Recommended minimal requirements and development guidelines for exposure setups of bio-experiments addressing the health risk concern of wireless communications. Bioelectromagnetics 2000, 21, 508–514. [Google Scholar] [CrossRef]
  10. Vijayalaxmi. Biological and health effects of radiofrequency fields: Good study design and quality publications. Mutat. Res. Toxicol. Environ. Mutagen. 2016, 810, 6–12. [Google Scholar] [CrossRef]
  11. Pikor, L.; Thu, K.; Vucic, E.; Lam, W. The detection and implication of genome instability in cancer. Cancer Metastasis Rev. 2013, 32, 341–352. [Google Scholar] [CrossRef] [Green Version]
  12. Non-Ionizing Radiation, Part 2: Radiofrequency Electromagnetic Fields; IARC (International Agency for Research on Cancer) Monograph on the evaluation of carcinogenic risks to humans; IARC: Lyon, France, 2013; Volume 102.
  13. Ruediger, H.W. Genotoxic effects of radiofrequency electromagnetic fields. Pathophysiol. 2009, 16, 89–102. [Google Scholar] [CrossRef] [PubMed]
  14. Vershaeve, L.; Juutilainen, J.; Lagroye, I.; Miyakoshi, J.; Saunders, R.; de Seze, R.; Tenforde, T.; van Rongen, E.; Veyret, B.; Xu, Z. In vitro and in vivo genotoxicity of radiofrequency fields. Mutat. Res. 2010, 705, 252–268. [Google Scholar] [CrossRef] [PubMed]
  15. Danese, E.; Lippi, G.; Buonocore, R.; Benati, M.; Bovo, C.; Bonaguri, C.; Salvagno, G.L.; Brocco, G.; Roggenbuck, D.; Montagnana, M. Mobile phone radiofrequency exposure has no effect on DNA double strand breaks (DSB) in human lymphocytes. Ann. Transl. Med. 2017, 5, 272. [Google Scholar] [CrossRef] [PubMed] [Green Version]
  16. Franchini, V.; Regalbuto, E.; De Amicis, A.; De Sanctis, S.; Di Cristofaro, S.; Coluzzi, E.; Marinaccio, J.; Sgura, A.; Ceccuzzi, S.; Doria, A.; et al. Genotoxic Effects In Human Fibroblasts Exposed To Microwave Radiation. Health Phys. 2018, 115, 126–139. [Google Scholar] [CrossRef] [PubMed]
  17. Markovà, E.; Hillert, L.; Malmgren, L.; Persson, B.R.R.; Belyaev, I.Y. Microwaves from GSM mobile phones affect 53BP1 and γ-H2AX foci in human lymphocytes from hypersensitive and healthy persons. Environ. Health Perspect. 2005, 113, 1172–1177. [Google Scholar] [CrossRef] [PubMed] [Green Version]
  18. Belyaev, I.Y.; Markovà, E.; Hillert, L.; Malmgren, L.O.; Persson, B.R. Microwaves from UMTS/GSM mobile phones induce long-lasting inhibition of 53BP1/gamma-H2AX DNA repair foci in human lymphocytes. Bioelectromagnetics 2009, 30, 129–141. [Google Scholar] [CrossRef] [PubMed]
  19. Fenech, M.; Morley, A.A. Measurement of micronuclei in lymphocytes. Mutat. Res. 1985, 247, 29–36. [Google Scholar]
  20. Maes, A.; Verschaeve, L.; Arroyo, A.; De Wagter, C.; Vercruyssen, L. In vitro cytogenetic effects of 2450 MHz waves on human peripheral blood lymphocytes. Bioelectromagnetics 1993, 14, 495–501. [Google Scholar] [CrossRef]
  21. D’Ambrosio, G.; Lioi, M.B.; Massa, R.; Scarfì, M.R.; Zeni, O. Genotoxic Effects of Amplitude-Modulated Microwaves on Human Lymphocytes Exposed in Vitro under Controlled Conditions. Electro Magn. 1995, 14, 157–164. [Google Scholar] [CrossRef]
  22. Garaj-Vrhovac, V.; Fucić, A.; Horvat, D. The correlation between the frequency of micronuclei and specific chromosome aberrations in human lymphocytes exposed to microwave radiation in vitro. Mutat. Res. 1992, 281, 181–186. [Google Scholar] [CrossRef]
  23. D’Ambrosio, G.; Massa, R.; Scarfì, M.R.; Zeni, O. Cytogenetic damage in human lymphocytes following GMSK phase modulated microwave exposure. Bioelectromagnetics 2002, 23, 7–13. [Google Scholar] [CrossRef] [PubMed]
  24. Tice, R.R.; Hook, G.G.; Donner, M.; McRee, D.I.; Guy, A.W. Genotoxicity of radiofrequency signals. I. Investigation of DNA damage and micronuclei induction in cultured human blood cells. Bioelectromagnetics 2002, 23, 113–126. [Google Scholar] [CrossRef]
  25. Zotti-Martelli, L.; Peccatori, M.; Scarpato, R.; Migliore, L. Induction of micronuclei in human lymphocytes exposed in vitro to microwave radiation. Mutat. Res. 2000, 472, 51–58. [Google Scholar] [CrossRef]
  26. Zotti-Martelli, L.; Peccatori, M.; Maggini, V.; Ballardin, M.; Barale, R. Individual responsiveness to induction of micronuclei in human lymphocytes after exposure in vitro to 1800-MHz microwave radiation. Mutat Res. 2005, 582, 42–52. [Google Scholar] [CrossRef] [PubMed]
  27. Vijayalaxmi; Frei, M.R.; Dusch, S.J.; Guel, V.; Meltz, M.L.; Jauchem, J.R. Frequency of micronuclei in the peripheral blood and bone marrow of cancer-prone mice chronically exposed to 2450 MHz radiofrequency radiation. Radiat. Res. 1998, 149, 308. [Google Scholar] [CrossRef]
  28. Vijayalaxmi; Pickard, W.F.; Bisht, K.S.; Prihoda, T.J.; Meltz, M.L.; LaRegina, M.C.; Roti Roti, J.L.; Straube, W.L.; Moros, E.G. Micronuclei in the peripheral blood and bone marrow cells of rats exposed to 2450 MHz radiofrequency radiation. Int. J. Radiat. Biol. 2001, 77, 1109–1115. [Google Scholar] [CrossRef]
  29. McNamee, J.P.; Bellier, P.V.; Gajda, G.B.; Miller, S.M.; Lemay, E.P.; Lavallée, B.F.; Marro, L.; Thansandote, A. DNA damage and micronucleus induction in human leukocytes after acute in vitro exposure to a 1.9 GHz continuous-wave radiofrequency field. Radiat. Res. 2002, 158, 523–533. [Google Scholar] [CrossRef]
  30. McNamee, J.P.; Bellier, P.V.; Gajda, G.B.; Lavalleè, B.E.; Lemay, E.P.; Marro, L.; Thansandotea, A. DNA Damage in Human Leukocytes after Acute In Vitro Exposure to a 1.9 GHz Pulse-Modulated Radiofrequency Field. Radiat. Res. 2003, 158, 534–537. [Google Scholar] [CrossRef]
  31. Zeni, O.; Schiavoni, A.S.; Sannino, A.; Antolini, A.; Forigo, D.; Bersani, F.; Scarfi, M.R. Lack of genotoxic effects (micronucleus induction) in human lymphocytes exposed in vitro to 900 MHz electromagnetic fields. Radiat. Res. 2003, 160, 152–158. [Google Scholar] [CrossRef]
  32. Scarfì, M.R.; Fresegna, A.M.; Villani, P.; Pinto, R.; Marino, C.; Sarti, M.; Altavista, P.; Sannino, A.; Lovisolo, G.A. Exposure to radiofrequency radiation (900 MHz, GSM signal) does not affect micronucleus frequency and cell proliferation in human peripheral blood lymphocytes: An interlaboratory study. Radiat. Res. 2006, 165, 655–663. [Google Scholar] [CrossRef]
  33. Speit, G.; Schutz, P.; Hoffmann, H. Genotoxic effects of exposure to radiofrequency electromagnetic fields (RFEMF) in cultured mammalian cells are not independently reproducible. Mutat. Res. 2007, 626, 42–47. [Google Scholar] [CrossRef] [PubMed]
  34. Schwarz, C.; Kratochvil, E.; Pilger, A.; Kuster, N.; Adlkofer, F.; Rudiger, H.W. Radiofrequency electromagnetic fields (UMTS, 1,950 MHz) induce genotoxic effects in vitro in human fibroblasts but not in lymphocytes. Int. Arch. Occup. Environ. Health 2008, 81, 755–767. [Google Scholar] [CrossRef]
  35. Mashevich, M.; Folkman, D.; Kesar, A.; Barbul, A.; Korenstein, R.; Jerby, E.; Avivi, L. Exposure of Human Peripheral Blood Lymphocytes to Electromagnetic Fields Associated with Cellular Phones Leads to Chromosomal Instability. Bioelectromagnetics 2003, 24, 82–90. [Google Scholar] [CrossRef] [PubMed]
  36. Mazor, R.; Korenstein-Ilan, A.; Barbul, A.; Eshet, Y.; Shahadi, A.; Jerbyb, E.; Korenstein, R. Increased Levels of Numerical Chromosome Aberrations after In Vitro Exposure of Human Peripheral Blood Lymphocytes to Radiofrequency Electromagnetic Fields for 72 Hours. Radiat. Res. 2008, 169, 28–37. [Google Scholar] [CrossRef] [PubMed]
  37. Manti, L.; Braselmann, H.; Calabrese, M.L.; Massa, R.; Pugliese, M.; Scampoli, P.; Sicignano, G.; Grossia, G. Effects of Modulated Microwave Radiation at Cellular Telephone Frequency (1.95 GHz) on X-Ray-Induced Chromosome Aberrations in Human Lymphocytes In Vitro. Radiat. Res. 2008, 169, 575–583. [Google Scholar] [CrossRef] [PubMed]
  38. Bourthoumieu, S.; Terro, F.; Leveque, P.; Collin, A.; Joubert, V.; Yardin, C. Aneuploidy studies in human cells exposed in vitro to GSM-900 MHz radiofrequency radiation using FISH. Int. J. Radiat. Biol. 2011, 87, 400–408. [Google Scholar] [CrossRef] [PubMed]
  39. Velizarov, S.; Raskmark, P.; Kwee, S. The effects of radiofrequency fields on cell proliferation are non-thermal. Bioelectrochem. Bioenerg. 1999, 48, 177–180. [Google Scholar] [CrossRef]
  40. Esmekaya, M.A.; Seyhan, N.; Kayhan, H.; Tuysuz, M.Z.; Kurşun, A.C.; Yağcı, M. Investigation of the effects of 2.1 GHz microwave radiation on mitochondrial membrane potential (ΔΨm), apoptotic activity and cell viability in human breast fibroblast cells. Cell Biochem. Biophys. 2013, 67, 1371–1378. [Google Scholar] [CrossRef]
  41. Buttiglione, M.; Roca, L.; Montemurno, E.; Vitiello, F.; Capozzi, V.; Cibelli, G. Radiofrequency radiation (900 MHz) induces Egr-1 gene expression and affects cell-cycle control in human neuroblastoma cells. J. Cell. Physiol. 2007, 213, 759–767. [Google Scholar] [CrossRef]
  42. Ballardin, M.; Tusa, I.; Fontana, N.; Monorchio, A.; Pelletti, C.; Rogovich, A.; Barale, R.; Scarpato, R. Non-thermal effects of 2.45 GHz microwaves on spindle assembly, mitotic cells and viability of Chinese hamster V-79 cells. Mutat. Res. 2011, 716, 1–9. [Google Scholar] [CrossRef]
  43. Miyakoshi, J.; Takemasa, K.; Takashima, Y.; Ding, G.R.; Hirose, H.; Koyama, S. Effects of exposure to a 1950 MHz radio frequency field on expression of Hsp70 and Hsp27 in human glioma cells. Bioelectromagnetics 2005, 26, 251–257. [Google Scholar] [CrossRef] [PubMed]
  44. Merola, P.; Marino, C.; Lovisolo, G.A.; Pinto, R.; Laconi, C.; Negroni, A. Proliferation and apoptosis in a neuroblastoma cell line exposed to 900 MHz modulated radiofrequency field. Bioelectromagnetics 2006, 27, 164–171. [Google Scholar] [CrossRef] [PubMed]
  45. Sanchez, S.; Milochau, A.; Ruffie, G.; Poulletier de Gannes, F.; Lagroye, I.; Haro, E.; Surleve-Bazeille, J.E.; Billaudel, B.; Lassegues, M.; Veyret, B. Human skin cell stress response to GSM-900 mobile phone signals. FEBS J. 2006, 273, 5491–5507. [Google Scholar] [CrossRef]
  46. Gurisik, E.; Warton, K.; Martin, D.K.; Velenzuela, S.M. An in vitro study of the effects of exposure to a GSM signal in two human cell lines: Monocytic U937 and neuroblastoma SK-N-SH. Cell Biol. Int. 2006, 30, 793–799. [Google Scholar] [CrossRef] [PubMed]
  47. Lee, K.Y.; Kim, B.C.; Han, N.K.; Lee, Y.S.; Kim, T.; Yun, J.H.; Kim, N.; Pack, J.K.; Lee, J.S. Effects of combined radiofrequency radiation exposure on the cell cycle and its regulatory proteins. Bioelectromagnetics 2011, 32, 169–178. [Google Scholar] [CrossRef] [PubMed]
  48. Erdine, S.; Bilir, A.; Cosman, E.R.; Cosman, E.R., Jr. Ultrastructural changes in axons following exposure to pulsed radiofrequency fields. Pain Pract. 2009, 9, 407–417. [Google Scholar] [CrossRef]
  49. Zhao, R.; Zhang, S.; Xu, Z.; Ju, L.; Lu, D.; Yao, G. Studying gene expression profile of rat neuron exposed to 1800 MHz radiofrequency electromagnetic fields with cDNA microassay. Toxicology 2007, 235, 167–175. [Google Scholar] [CrossRef]
  50. Remondini, D.; Nylund, R.; Reivinen, J.; Poulletier de Gannes, F.; Veyret, B.; Lagroye, I.; Haro, E.; Trillo, A.M.; Capri, M.; Maercker, C. Gene expression changes in human cells after exposure to mobile phone microwaves. Proteomics 2006, 6, 4745–4754. [Google Scholar] [CrossRef]
  51. Nylund, R.; Leszczynski, D. Mobile phone radiation causes changes in gene and protein expression in human endothelial cell lines and the response seems to be genome and proteome dependent. Proteomics 2006, 6, 4769–4780. [Google Scholar] [CrossRef]
  52. Le Quement, C.; Nicolas Nicolaz, C.; Zhadobov, M.; Desmots, F.; Sauleau, R.; Aubry, M.; Michel, D.; Le Dréan, Y. Whole-genome expression analysis in primary human keratinocyte cell cultures exposed to 60 GHz radiation. Bioelectromagnetics 2012, 33, 147–158. [Google Scholar] [CrossRef]
  53. Habauzit, D.; Le Quement, C.; Zhadobov, M.; Martin, C.; Aubry, M.; Sauleau, R.; Le Drean, Y. Transcriptome Analysis Reveals the Contribution of Thermal and the Specific Effects in Cellular Response to Millimeter Wave Exposure. PLoS ONE 2014, 9, e109435. [Google Scholar] [CrossRef] [Green Version]
  54. Chauhan, V.; Mariampillai, A.; Bellier, P.V.; Qutob, S.S.; Gajda, G.B.; Lemay, E.; Thansandote, A.; McNamee, J.P. Gene Expression Analysis of a Human Lymphoblastoma Cell Line Exposed In Vitro to an Intermittent 1.9 GHz Pulse-Modulated Radiofrequency Field. Radiat. Res. 2006, 165, 424–429. [Google Scholar] [CrossRef] [PubMed]
  55. Qutob, S.S.; Chauhan, V.; Bellier, P.V.; Yauk, C.L.; Douglas, G.R.; Williams, A.; Berndt, L.; Gajda, G.; Thansondote, A.; McNamee, J.P. Microarray gene expression profiling of a human glioblastoma cell line exposed in vitro to 1.9 GHz pulse modulated radiofrequency fields. Radiat. Res. 2006, 165, 636–644. [Google Scholar] [CrossRef] [PubMed]
  56. Sakurai, T.; Kiyokawa, T.; Narita, E.; Suzuki, Y.; Taki, M.; Miyakoshi, J. Analysis of gene expression in a human-derived glial cell line exposed to 2.45 GHz continuous radiofrequency electromagnetic fields. J. Radiat. Res. 2011, 52, 185–192. [Google Scholar] [CrossRef]
  57. Whitehead, T.D.; Moros, E.G.; Brownstein, B.H.; Roti Roti, J.L. Gene expression does not change significantly in C3H 10TK cells after exposure to 847.74 CDMA or 835.62 FDMA radiofrequency radiation. Radiat. Res. 2006, 165, 626–635. [Google Scholar] [CrossRef] [PubMed]
  58. Hirose, H.; Sakuma, N.; Kaji, N.; Nakayama, K.; Inoue, K.; Sekijima, M.; Nojima, T.; Miyakoshi, J. Mobile phone base station-emitted radiation does not induce phosphorylation of hsp27. Bioelectromagnetics 2007, 28, 99–108. [Google Scholar] [CrossRef] [PubMed]
  59. Zeng, Q.; Chen, G.; Weng, Y.; Wang, L.; Chiang, H.; Lu, D.; Xu, Z. Effects of global system for mobile communications 1800 MHz radiofrequency electromagnetic fields on gene and protein expression in MCF-7 cells. Proteomics 2006, 6, 4732–4738. [Google Scholar] [CrossRef] [PubMed]
  60. Dasdag, S.; Akdag, M.Z.; Erdal, M.E.; Erdal, N.; Ay, O.I.; Ay, M.E.; Yilmaz, S.G.; Tasdelen, B.; Yegin, K. Effects of 2.4 GHz Radiofrequency Radiation emitted from WI-FI equipment on microRNA expression in brain tissue. Int. J. Radiat. Biol. 2015, 91, 555–561. [Google Scholar] [CrossRef]
  61. McNamee, J.P.; Bellier, P.V.; Konkle, A.T.M.; Thomas, R.; Siiwat Wasoontarajaroen, S.; Lemay, E.; Gajda, G.B. Analysis of gene expression in mouse brain regions after exposure to 1.9 GHz radiofrequency fields. Int. J. Radiat. Biol. 2016, 92, 338–350. [Google Scholar] [CrossRef] [PubMed]
  62. Gao, Y.; Lu, Y.; Yi, J.; Li, Z.; Gao, D.; Yu, Z.; Wu, T.; Zhang, C. A Genome-Wide mRNA Expression Profile in Caenorhabditis elegans under Prolonged Exposure to 1750 MHz Radiofrequency Fields. PLoS ONE 2016, 11, e0147273. [Google Scholar] [CrossRef] [Green Version]
  63. Lin, K.W.; Yang, C.J.; Lian, H.Y.; Cai, P. Exposure of ELF-EMF and RF-EMF Increase the Rate of Glucose Transport and TCA Cycle in Budding Yeast. Front. Microbiol. 2016, 7, 1378. [Google Scholar] [CrossRef] [PubMed] [Green Version]
  64. Said-Salman, I.H.; Jebaii, F.A.; Yusef, H.H.; Moustafa, M.E. Global gene expression analysis of Escherichia coli K-12 DH5α after exposure to 2.4 GHz wireless fidelity radiation. Sci. Rep. 2019, 9, 14425. [Google Scholar] [CrossRef] [PubMed]
  65. Wireless LAN Medium Access Control (MAC) and Physical Layer (PHY) Specification: Higher-Speed Physical Layer Extension to 54 Mbps; IEEE Std. 802.11g; ISEE: Washington, DC, USA, 2003.
  66. Vijayalaxmi; Obe, G. Controversial cytogenetic observations in mammalian somatic cells exposed to radiofrequency radiation. Radiat. Res. 2004, 162, 481–496. [Google Scholar] [CrossRef] [PubMed]
  67. Simkó, M.; Remondini, D.; Zeni, O.; Scarfi, M.R. Quality Matters: Systematic Analysis of Endpoints Related to “Cellular Life” in Vitro Data of Radiofrequency Electromagnetic Field Exposure. Int. J. Environ. Res. Public Health 2016, 13, 701. [Google Scholar] [CrossRef] [PubMed]
  68. Hansteen, I.L.; Clausen, K.O.; Haugan, V.; Svendsen, M.; Svendsen, M.V.; Eriksen, J.G.; Skiaker, R.; Hauger, E.; Lågeide, L.; Vistnes, A.I.; et al. Cytogenetic Effects of Exposure to 2.3 GHz Radiofrequency Radiation on Human Lymphocytes In Vitro. Anticancer Res. 2009, 29, 4323–4330. [Google Scholar]
  69. Takashima, Y.; Hirose, H.; Koyama, S.; Suzuki, Y.; Taki, M.; Miyakoshi, J. Effects of continuous and intermittent exposure to RF fields with a wide range of SARs on cell growth, survival, and cell cycle distribution. Bioelectromagnetics 2006, 27, 392–400. [Google Scholar] [CrossRef]
  70. Sekijima, M.; Takeda, H.; Yasunaga, K.; Sakuma, N.; Hirose, H.; Nojima, T.; Miyakoshi, J. 2-GHz band CW and W-CDMA modulated radiofrequency fields have no significant effect on cell proliferation and gene expression profile in human cells. J. Radiat. Res. 2010, 51, 277–284. [Google Scholar] [CrossRef] [Green Version]
  71. Koyama, S.; Isozumi, Y.; Suzuki, Y.; Taki, M.; Miyakoshi, J. Effects of 2.45-GHz Electromagnetic Fields with a Wide Range of SARs on Micronucleus Formation in CHO-K1 Cells. Sci. World J. 2004, 4, 29–40. [Google Scholar] [CrossRef] [Green Version]
  72. Figueiredo, A.; Alves, R.; Ramalho, A. Cytogenetic analysis of the effects of 2.5 and 10.5 GHz microwaves on human lymphocytes. Genet. Mol. Biol. 2004, 27, 460–466. [Google Scholar] [CrossRef] [Green Version]
  73. Vijayalaxmi. Cytogenetic Studies in Human Blood Lymphocytes Exposed In Vitro to 2.45 GHz or 8.2 GHz Radiofrequency Radiation. Radiat. Res. 2006, 166, 532–538. [Google Scholar] [CrossRef]
  74. Zeni, O.; Schiavoni, A.; Perrotta, A.; Forigo, D.; Deplano, M.; Scarfi, M.R. Evaluation of genotoxic effects in human leukocytes after in vitro exposure to 1950 MHz UMTS radiofrequency field. Bioelectromagnetics 2008, 29, 177–184. [Google Scholar] [CrossRef] [PubMed]
  75. Sakuma, N.; Komatsubara, Y.; Takeda, H. DNA strand breaks are not induced in human cells exposed to 2.1425 GHz band CW and W-CDMA modulated radiofrequency fields allocated to mobile radio base stations. Bioelectromagnetics 2006, 27, 51–57. [Google Scholar] [CrossRef] [PubMed]
  76. Liu, Y.; Li, G.; Fu, X.; Xue, J.; Ji, S.; Zhang, Z.; Zhang, Y.; Li, A. Exposure to 3G mobile phone signals does not affect the biological features of brain tumor cells. BMC Public Health 2015, 15, 764. [Google Scholar] [CrossRef] [PubMed] [Green Version]
  77. Lamkowski, A.; Kreitlow, M.; Radunz, J.; Willenbockel, M.; Sabath, F.; Schuhn, W.; Stiemer, M.; Fichte, L.O.; Dudzinski, M.; Böhmelt, S.; et al. Gene Expression Analysis in Human Peripheral Blood Cells after 900 MHz RF-EMF Short-Term Exposure. Radiat. Res. 2018, 189, 529–540. [Google Scholar] [CrossRef] [PubMed]
  78. Hermanns, P.; Reicherter, K.; Lee, B. RMRP (RNA component of mitochondrial RNA processing endoribonuclease). Atlas Genet. Cytogenet. Oncol. Haematol. 2008, 12, 328–333. [Google Scholar] [CrossRef]
  79. Maida, Y.; Mami, Y.; Furuuchi, M.; Lassmann, T.; Possemato, R.; Okamoto, N.; Kasim, V.; Hayashizaki, Y.; Hahn, W.C.; Masutomi, K. An RNA dependent RNA polymerase formed by hTERT and the RNase MRP RNA. Nature 2009, 461, 230–235. [Google Scholar] [CrossRef]
  80. Davis, T.A.; Loos, B.; Engelbrecht, A.M. AHNAK: The giant jack of all trades. Cell. Signal. 2014, 26, 2683–2693. [Google Scholar] [CrossRef]
  81. Marjanović, A.M.; Pavičić, I.; Trošić, I. Biological Indicators in Response to Radiofrequency/Microwave Exposure. Arh. Hig. Rada. Toksikol. 2012, 63, 407–416. [Google Scholar] [CrossRef] [Green Version]
  82. Qiao, Z.; Jiang, Y.; Wang, L.; Wang, L.; Jiang, J.; Zhang, J. Mutations in KIAA1109, CACNA1C, BSN, AKAP13, CELSR2, and HELZ2 Are Associated with the Prognosis in Endometrial Cancer. Front. Genet. 2019, 10, 909. [Google Scholar] [CrossRef]
  83. Veltri, A.; Lang, C.; Lien, W.H. Concise Review: Wnt Signaling Pathways in Skin Development and Epidermal Stem Cells. Stem Cells 2018, 36, 22–35. [Google Scholar] [CrossRef] [Green Version]
  84. Klaus, A.; Birchmeier, W. Wnt signalling and its impact on development and cancer. Nat. Rev. Cancer 2008, 8, 387–398. [Google Scholar] [CrossRef] [PubMed]
  85. Komiya, Y.; Habas, R. Wnt signal transduction pathways. Organogenesis 2008, 4, 68–75. [Google Scholar] [CrossRef] [PubMed] [Green Version]
  86. Durna Dastan, S.; Soylu, S.; Pence, H.H.; Uyanik, B.; Duman, M.; Kurt, V.; Dastan, T.; Zilan, V.; Turan, V. Hazardous Genomic Bioeffects of Home Wi-Fi Systems. NeuroQuantology 2018, 16. [Google Scholar] [CrossRef] [Green Version]
  87. Lee, S.; Johnson, D.; Dunbar, K.; Dong, H.; Ge, X.; Kim, Y.C.; Wing, C.; Jayathilaka, N.; Emmanuel, N.; Zhou, C.Q. 2.45 GHz radiofrequency fields alter gene expression in cultured human cells. FEBS Lett. 2005, 579, 4829–4836. [Google Scholar] [CrossRef] [Green Version]
  88. Pacini, S.; Ruggiero, M.; Sardi, I.; Aterini, S.; Gulisano, F.; Gulisano, M. Exposure to global system for mobile communication (GSM) cellular phone radiofrequency alters gene expression, proliferation, and morphology of human skin fibroblasts. Oncol. Res. 2002, 13, 19–24. [Google Scholar] [CrossRef] [PubMed]
  89. Paffi, A.; Liberti, M.; Lopresto, V.; Merla, C.; Lodato, R.; Lovisolo, G.A.; Apollonio, F. A Wire Patch Cell Exposure System for in vitro Experiments at Wi-Fi Frequencies. IEEE Trans. MTT 2010, 58, 4086–4093. [Google Scholar] [CrossRef]
  90. Molfetta, S.; Apollonio, F.; Liberti, M.; D’Inzeo, G. Low cost exposure set-up for RF biological experiments. In Abstract Book 6th EBEA; EBEA: Budapest, Hungary, 2003. [Google Scholar]
  91. Platano, D.; Mesirca, P.; Paffi, A.; Pellegrino, M.; Liberti, M.; Apollonio, F.; Bersani, F.; Aicardi, V. Acute exposure to 900 MHz CW and GSM-modulated radiofrequencies does not affect Ba2+ currents through voltage-gated calcium channels in rat cortical neurons. Bioelectromagnetics 2007, 28, 598–606. [Google Scholar] [CrossRef]
  92. Benvenuto, M.; Mattera, R.; Sticca, J.I.; Rossi, P.; Cipriani, C.; Giganti, M.G.; Volpi, A.; Modesti, A.; Masuelli, L.; Bei, R. Effect of the BH3 Mimetic Polyphenol (−)-Gossypol (AT-101) on the in vitro and in vivo Growth of Malignant Mesothelioma. Front. Pharmacol. 2018, 9, 1269. [Google Scholar] [CrossRef] [Green Version]
  93. Carpenter, A.E.; Jones, T.R.; Lamprecht, M.R.; Clarke, C.; Kang, I.H.; Friman, O.; Guertin, D.A.; Chang, J.H.; Lindquist, R.A.; Moffat, J.; et al. Cellprofiler: Image analysis software for identifying and quantifying cell phenotypes. Genome Biol. 2006, 7, R100. [Google Scholar] [CrossRef] [Green Version]
  94. Masuelli, L.; Granato, M.; Benvenuto, M.; Mattera, R.; Bernardini, R.; Mattei, M.; d’Amati, G.; D’Orazi, G.; Faggioni, A.; Bei, R.; et al. Chloroquine supplementation increases the cytotoxic effect of curcumin against Her2/neu overexpressing breast cancer cells in vitro and in vivo in nude mice while counteracts it in immune competent mice. Oncoimmunology 2017, 6, e1356151. [Google Scholar] [CrossRef] [Green Version]
  95. Thomas, P.D.; Campbell, M.J.; Kejariwal, A.; Mi, H.; Karlak, B.; Daverman, R.; Diemer, K.; Muruganujan, A.; Narechania, A. PANTHER: A library of protein families and subfamilies indexed by function. Genome Res. 2003, 13, 2129–2141. [Google Scholar] [CrossRef] [PubMed] [Green Version]
Figure 1. H2AX histone/p53 binding protein 1 (γ-H2AX/53BP1) foci analysis on HDF exposed to 2.45 GHz. No significant differences were observed 30 min, 2 h, or 24 h after exposure to 2.45 GHz CW (a) and PW (b), with respect to sham samples. Results obtained with the cells exposed to CW or PW signals were compared to those obtained with the corresponding sham cells (exposed 30 min vs. sham 30 min; exposed 2 h vs. sham 2 h; exposed 24 h vs. sham 24 h; 2-tailed t-test). Data are representative of four experiments, and bars denote the standard error.
Ijms 21 07069 g001
Figure 2. CREST analysis on HDF exposed to 2.45 GHz. No significant increase in MN tot or in the frequency of MN+ and MN− in 2.45 GHz CW (a) and PW (b) exposed, with respect to sham samples were observed. Data are representative of four experiments, and bars denote the standard error.
Ijms 21 07069 g002
Figure 3. Ultrastructural analysis of HDF cells exposed to 2.45 GHz. (Panel A): sham (a,c) and 2.45 GHz CW- (b,d) exposed HDF. Exposed cells were examined 2 h (b) and 24 h (d) after exposure. Nucleus (N), rough endoplasmic reticulum (rer), lysosome (ly), mitochondria (m) (bars correspond to 1 µm). No morphological differences were found between sham or exposed cells. (Panel B): sham (a,c) and 2.45 GHz PW- (b,d) exposed HDF. Exposed cells were examined 2 h (b) and 24 h (d) after exposure. (Bars correspond to 1 µm). No morphological differences were found between sham and exposed cells.
Ijms 21 07069 g003
Figure 4. Percentage of differential gene expressions (DGEs) involved in the different biological processes and molecular functions, as reported in gene ontology (GO) term analysis, for both types of signals evaluated. (a) Percentage of genes involved in each biological process after exposure to 2.45 GHz CW. (b) Percentage of genes involved in each molecular function after exposure to 2.45 GHz CW. (c) Percentage of genes involved in each biological process after exposure to 2.45 GHz PW. (d) Percentage of genes involved in each molecular function after exposure to 2.45 GHz PW.
Ijms 21 07069 g004
Figure 5. GO functional networks for down-regulated and up-regulated genes for 2.45 CW exposed samples (a) and 2.45 PW exposed samples (b). The down- and up-regulated genes are shown in red and blue, respectively.
Ijms 21 07069 g005
Figure 6. Picture of the WPC with the four Petri dishes inside. (a) WPC placed into the shielding cage with the lateral walls covered with absorbing panels. (b) Shielding cage inside the incubator with the two fans used to induce a forced air flow for temperature control.
Ijms 21 07069 g006
Figure 7. Temperature increase as a function of time. Measurement inside the biological sample during 2 h exposure to a CW at 2.45 GHz and 0.7 W/kg of SAR.
Ijms 21 07069 g007
Table 1. Cell cycle analysis on HDF cells exposed to 2.45 GHz CW and PW. No differences were observed 2 and 24 h after irradiation with both continuous wave (CW) and pulsed wave (PW) signals. Results are representative of three experiments. Results obtained with the cells exposed to CW or PW signals were compared to those obtained with the corresponding sham cells (exposed 2 h vs. sham 2 h; exposed 24 h vs. sham 24 h; 2-tailed t-test). Not significant (NS).
2.45 GHzTime PointSampleSub-G1 1G0/G1SG2/M
MeanpMeanpMeanpMeanP
CW2 hSham1.92 ± 0.42 50.92 ± 12.97 6.85 ± 1.77 40.61 ± 11.66
Exposed1.44 ± 0.76NS50.12 ± 12.95NS7.97 ± 2.18NS40.81 ± 10.13NS
24 hSham0.80 ± 0.66 86.03 ± 2.33 3.46 ± 0.49 9.85 ± 2.35
Exposed0.82 ± 0.70NS86.31 ± 2.61NS3.53 ± 0.59NS9.50 ± 2.81NS
PW2 hSham0.71 ± 0.13 72.84 ± 1.12 4.06 ± 0.61 22.62 ± 1.58
Exposed0.84 ± 0.13NS75.00 ± 0.97NS4.17 ± 0.51NS20.23 ± 1.43NS
24 hSham0.49 ± 0.16 84.10 ± 0.54 2.00 ± 0.17 13.53 ± 0.41
Exposed0.44 ± 0.18NS82.43 ± 1.47NS2.24 ± 0.34NS15.03 ± 1.02NS
1 Percentage of cells in the sub-G1, G0/G1, S and G2/M phase were calculated using Cell Quest software.
Table 2. List of genes differentially expressed between exposed and sham samples after exposure to 2.45 GHz CW. The table includes gene name, gene function, fold change (FC), and regulation.
2.45 GHz CWGene IDGene NameDescriptionFCRegulation
0 min after exposureACOT4Acyl-coenzyme A thioesterase 4Signaling receptor binding and palmitoyl-CoA hydrolase activity1.6up
DLX5Homeobox protein DLX-5 Transcriptional factor involved in bone development2up
FAM72DProtein FAM72DUnknown function2up
LRP2BPLRP2-binding proteinProtein binding2.5down
NIPSNAP3BProtein NipSnap homolog 3BRutative roles in vesicular trafficking2.2up
SUN3SUN domain-containing protein 3Protein binding2.3up
2 h after exposureHES4Transcription factor HES-4Basic helix-loop-helix transcription factor1.6down
HMCN1Hemicentin-1Receptor binding1.8up
ALMS1Alstrom syndrome protein 1Cytoskeletal protein binding1.5up
ANKRD36CAnkyrin repeat domain-containing protein 36Protein Coding gene involved in ion channel inhibitor activity1.6down
GRIP2Glutamate receptor-interacting protein 2Multi-PDZ domain scaffolding proteins required for dendrite development1.5down
BSNProtein bassoonScaffolding protein involved in organizing the presynaptic cytoskeleton1.6up
FAM53AProtein FAM53AEncodes a secreted peptide hormone and member of the EGF family of proteins1.5down
EREGEpiregulinaTransient receptor potential cation channel1.5down
SLC9B1Sodium/hydrogen exchanger 9B1Transmembrane transporter activity1.7down
LUCAT1lung cancer associated transcript 1Non-coding RNA1.6down
EGR1Early growth response protein 1Transcriptional regulator 1.7up
AC005618.6Protocadherin gamma-B3Cell adhesion, cell-cell signaling1.8up
HIST1H2ADHistone H2A type 1-DHistone 2down
HIST1H2BGHistone H2B type 1-C/E/F/G/IHistone1.8down
IER3Radiation-inducible immediate-early gene IEX-1Cell proliferation and survival 2.2down
PRSS35Inactive serine protease 35Serin protease activity1.7down
SAMD3Sterile alpha motif domain-containing protein 3Protein binding1.8up
GPER1G-protein coupled estrogen receptor 1Protein binding1.5down
RIMS2Regulating synaptic membrane exocytosis protein 2Protein binding1.6up
ZNF462Zinc finger protein 462Protein binding1.7up
SYNPO2LSynaptopodin 2-like proteinProtein binding1.8up
CNNM1Metal transporter CNNM1Protein binding1.5down
C11orf96Uncharacterized protein C11orf96 1.7down
BEST1Bestrophin-1Ion binding 1.6up
STYK1Tyrosine-protein kinase STYK1Receptor binding1.5up
RPPH1Ribonuclease P RNA Component H1long non-coding RNA3.9down
RN7SL1RNA, 7SL, cytoplasmic 1small cytoplasmic RNA2.7down
RN7SL2RN7SL2small cytoplasmic RNA4.1down
RHOJRho-related GTP-binding protein RhoJsmall GTPase 1.5down
SYNE2Nesprin-2Actin binding2up
AHNAK2Protein AHNAK2RNA binding1.5up
FBXL22F-box and leucine-rich protein 22Protein ubiquitination1.6up
SLC43A2Large neutral amino acids transporter small subunit 4Transmembrane transporter activity1.7up
MYCBPAPMYCBP-associated proteinCell differenziation2up
ZNF433Zinc finger protein 433DNA-binding (transcription)1.3up
ZNF233Zinc finger protein 233Nucleic acid binding, regulation of transcription1.8up
RP1-198K11.5Non-coding RNA1.5down
MXRA5Matrix-remodeling-associated protein 5Receptor binding1.8up
RMRPRNA Component Of Mitochondrial RNA Processing EndoribonucleaseNon-coding RNA8.8down
24 h after exposureANKRD36CAnkyrin repeat domain-containing protein 36Protein Coding gene, ion channel inhibitor activity1.6down
MIR145microRNA 145Non-coding RNA1.4up
KIAA0895Uncharacterized protein KIAA0895 1.8up
LCNL1Lipocalin-like 1 proteinBinding, isomerase activity2.3up
RASGEF1ARas-GEF domain-containing family member 1Aprotein binding, small GTPase regulator activity1.5up
RN7SL1RNA, 7SL, cytoplasmic 1small cytoplasmic RNA1.8down
RN7SL2RNA, 7SL, cytoplasmic 2small cytoplasmic RNA1.8down
RGS11Regulator of G-protein signaling 11Regulator of G protein signaling1.7up
Table 3. List of genes differentially expressed between exposed and sham samples after exposure to 2.45 GHz PW. The table includes gene name, gene function, fold change (FC), and regulation.
2.45 GHz PWGene IDGene NameDescriptionFCRegulation
0 min after exposureKIAA1324UPF0577 protein KIAA1324RNA binding1.6up
KIAA1211Uncharacterized protein KIAA1211Unknown function2.3up
CXCL3C-X-C motif chemokine 3Chemokine1.6down
EGR3Early growth response protein 3Transcriptional regulator1.5down
SLC16A13Monocarboxylate transporter 13Transmembrane transporter 1.5up
2 h after exposureTMEM240Transmembrane protein 240Transmembrane-domain containing protein 1.54up
TNFRSF25Tumor necrosis factor receptor superfamily member 25Signaling receptor activity1.7up
BEST4Bestrophin-4Anion channel1.8up
RNF175RING finger protein 175Ubiquitin- protein ligase1.7up
KLKB1Plasma kallikreinSerin-protease1.5down
PTGER4Prostaglandin E2 receptor EP4 subtypeG-protein coupled receptor2down
MDFIMyoD family inhibitorTranscription factor binding2up
PPP1R9ANeurabin-1Actin binding1.9down
RMRPRNA Component Of Mitochondrial RNA Processing EndoribonucleaseNon-coding RNA5.7down
PRUNE2Protein prune homolog 2Pyrophosphatase activity1.6down
ENO4Enolase 4Lyase activity1.9down
KCNQ1OT1KCNQ1 opposite strand/antisense transcript 1non-coding RNA1.7down
OLR1Oxidized low-density lipoprotein receptor 1Lipoprotein receptor 2.1down
HOXC11Homeobox protein Hox-C11Transcription factor1.7up
PTPRQReceptor-type tyrosine-protein phosphatase RProtein phosphatase1.8down
PAPLNPapilinPeptidase activity1.7down
TMEM121Transmembrane protein 121 2up
ATF7IP2Activating transcription factor 7-interacting protein 2ATPase activity2.4down
CNBD2Cyclic nucleotide-binding domain-containing protein 2cAMP binding1.7up
AHNAK2Protein AHNAK2RNA binding1.8down
LIFLeukemia inhibitory factorCytokine activity1.8down
PDZD4PDZ domain-containing protein 4Ubiquitin protein ligase activity2.1up
24 h after exposurePPP1R1CProtein phosphatase 1 regulatory subunit 1CSignaling molecule, phosphatase inhibitor2.6up
ADAMTS13A disintegrin and metalloproteinase with thrombospondin motifs 13Metallopeptidase activity1.5up
PANOProapoptotic Nucleolar Protein 1Apoptosis-inducing protein1.9up
NEAT1nuclear paraspeckle assembly transcript 1Non-coding RNA1.5up
VAMP1Vesicle-associated membrane protein 1Transport1.5up
GOLGA8BGolgin subfamily A member 8BMembrane traffic protein1.5up
GUSBP11Putative inactive beta-glucuronidase protein GUSBP11Hydrolase activity1.5up
Table 4. In the table, the results obtained from the RT-PCR validation on the selected genes, compared to the results obtained from RNA-seq analysis are reported. The validation was performed on the same RNA used for RNA-seq, and the results are representative of four independent experiments. These genes were differentially expressed 2 h after exposure after CW or PW signals, and results obtained with the exposed cells were compared to the corresponding sham cells (exposed 2 h vs. sham 2 h; t-test). The table includes type of signal, gene name, fold change (FC), direction of change as up-regulation (↑), down-regulation (↓) or no changes (-) and p-value. Not significant (NS).
2.45 GHzGeneRNA-seqRT-PCR
FCRegulationp-ValueFCRegulationp-Value
CWRMRP8.8≤0.050.73NS
ALMS12.06≤0.051.14NS
BSN2.37≤0.051.52≤0.001
SYNE22.06≤0.052.1NS
AHNAK22.18≤0.051.0-NS
PWRMRP5.7≤0.050.96NS
AHNAK21.5≤0.051.99NS
Table 5. Candidate transcripts selected for the validation by qRT-PCR. Inventoried primer probe designs were used.
Gene NameDescriptionAssay ID
RMRPRNA Component of Mitochondrial RNA Processing EndoribonucleaseHs03298751_s1
ALMS1Cytoskeletal protein bindingHs00367316_m1
BSNScaffolding protein involved in organizing the presynaptic cytoskeletonHs01109152_m1
SYNE2Actin bindingHs00794881_m1
AHNAK2RNA bindingHs00292832_m1

