Splicing Enhancers at Intron–Exon Borders Participate in Acceptor Splice Sites Recognition

 , , , and
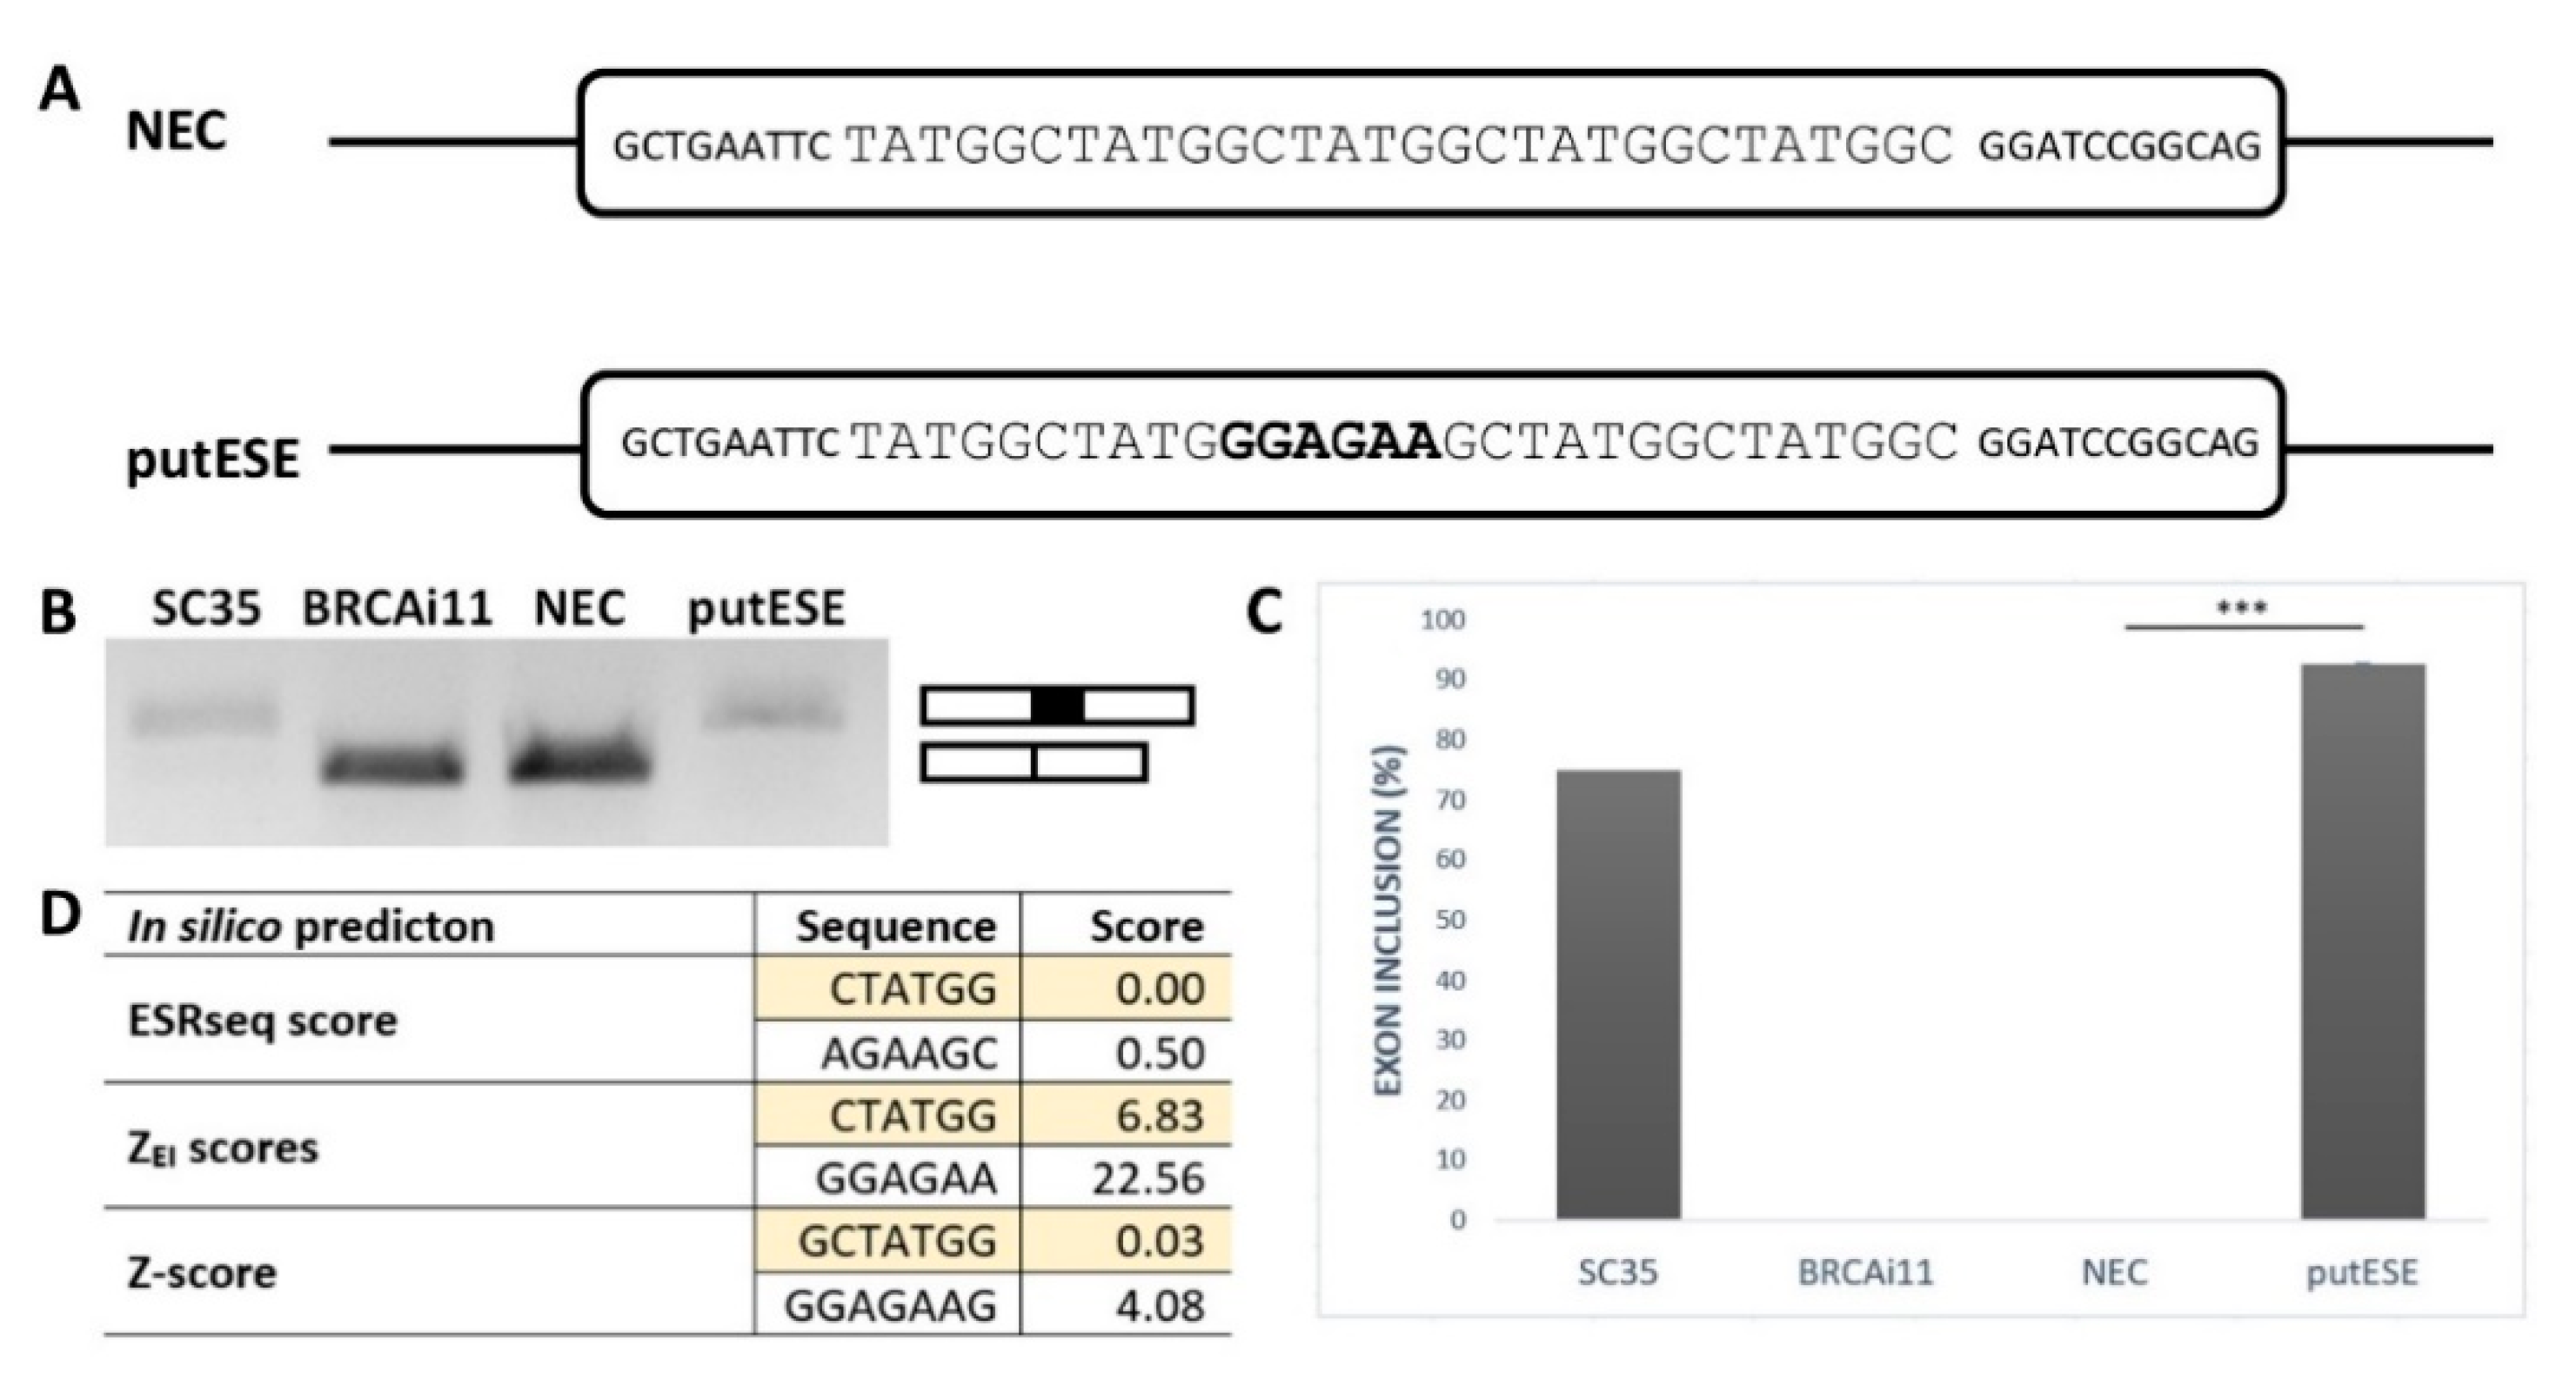
Abstract
:1. Introduction
2. Results
2.1. GGAGAA Sequence Acts as a Splicing Enhancer
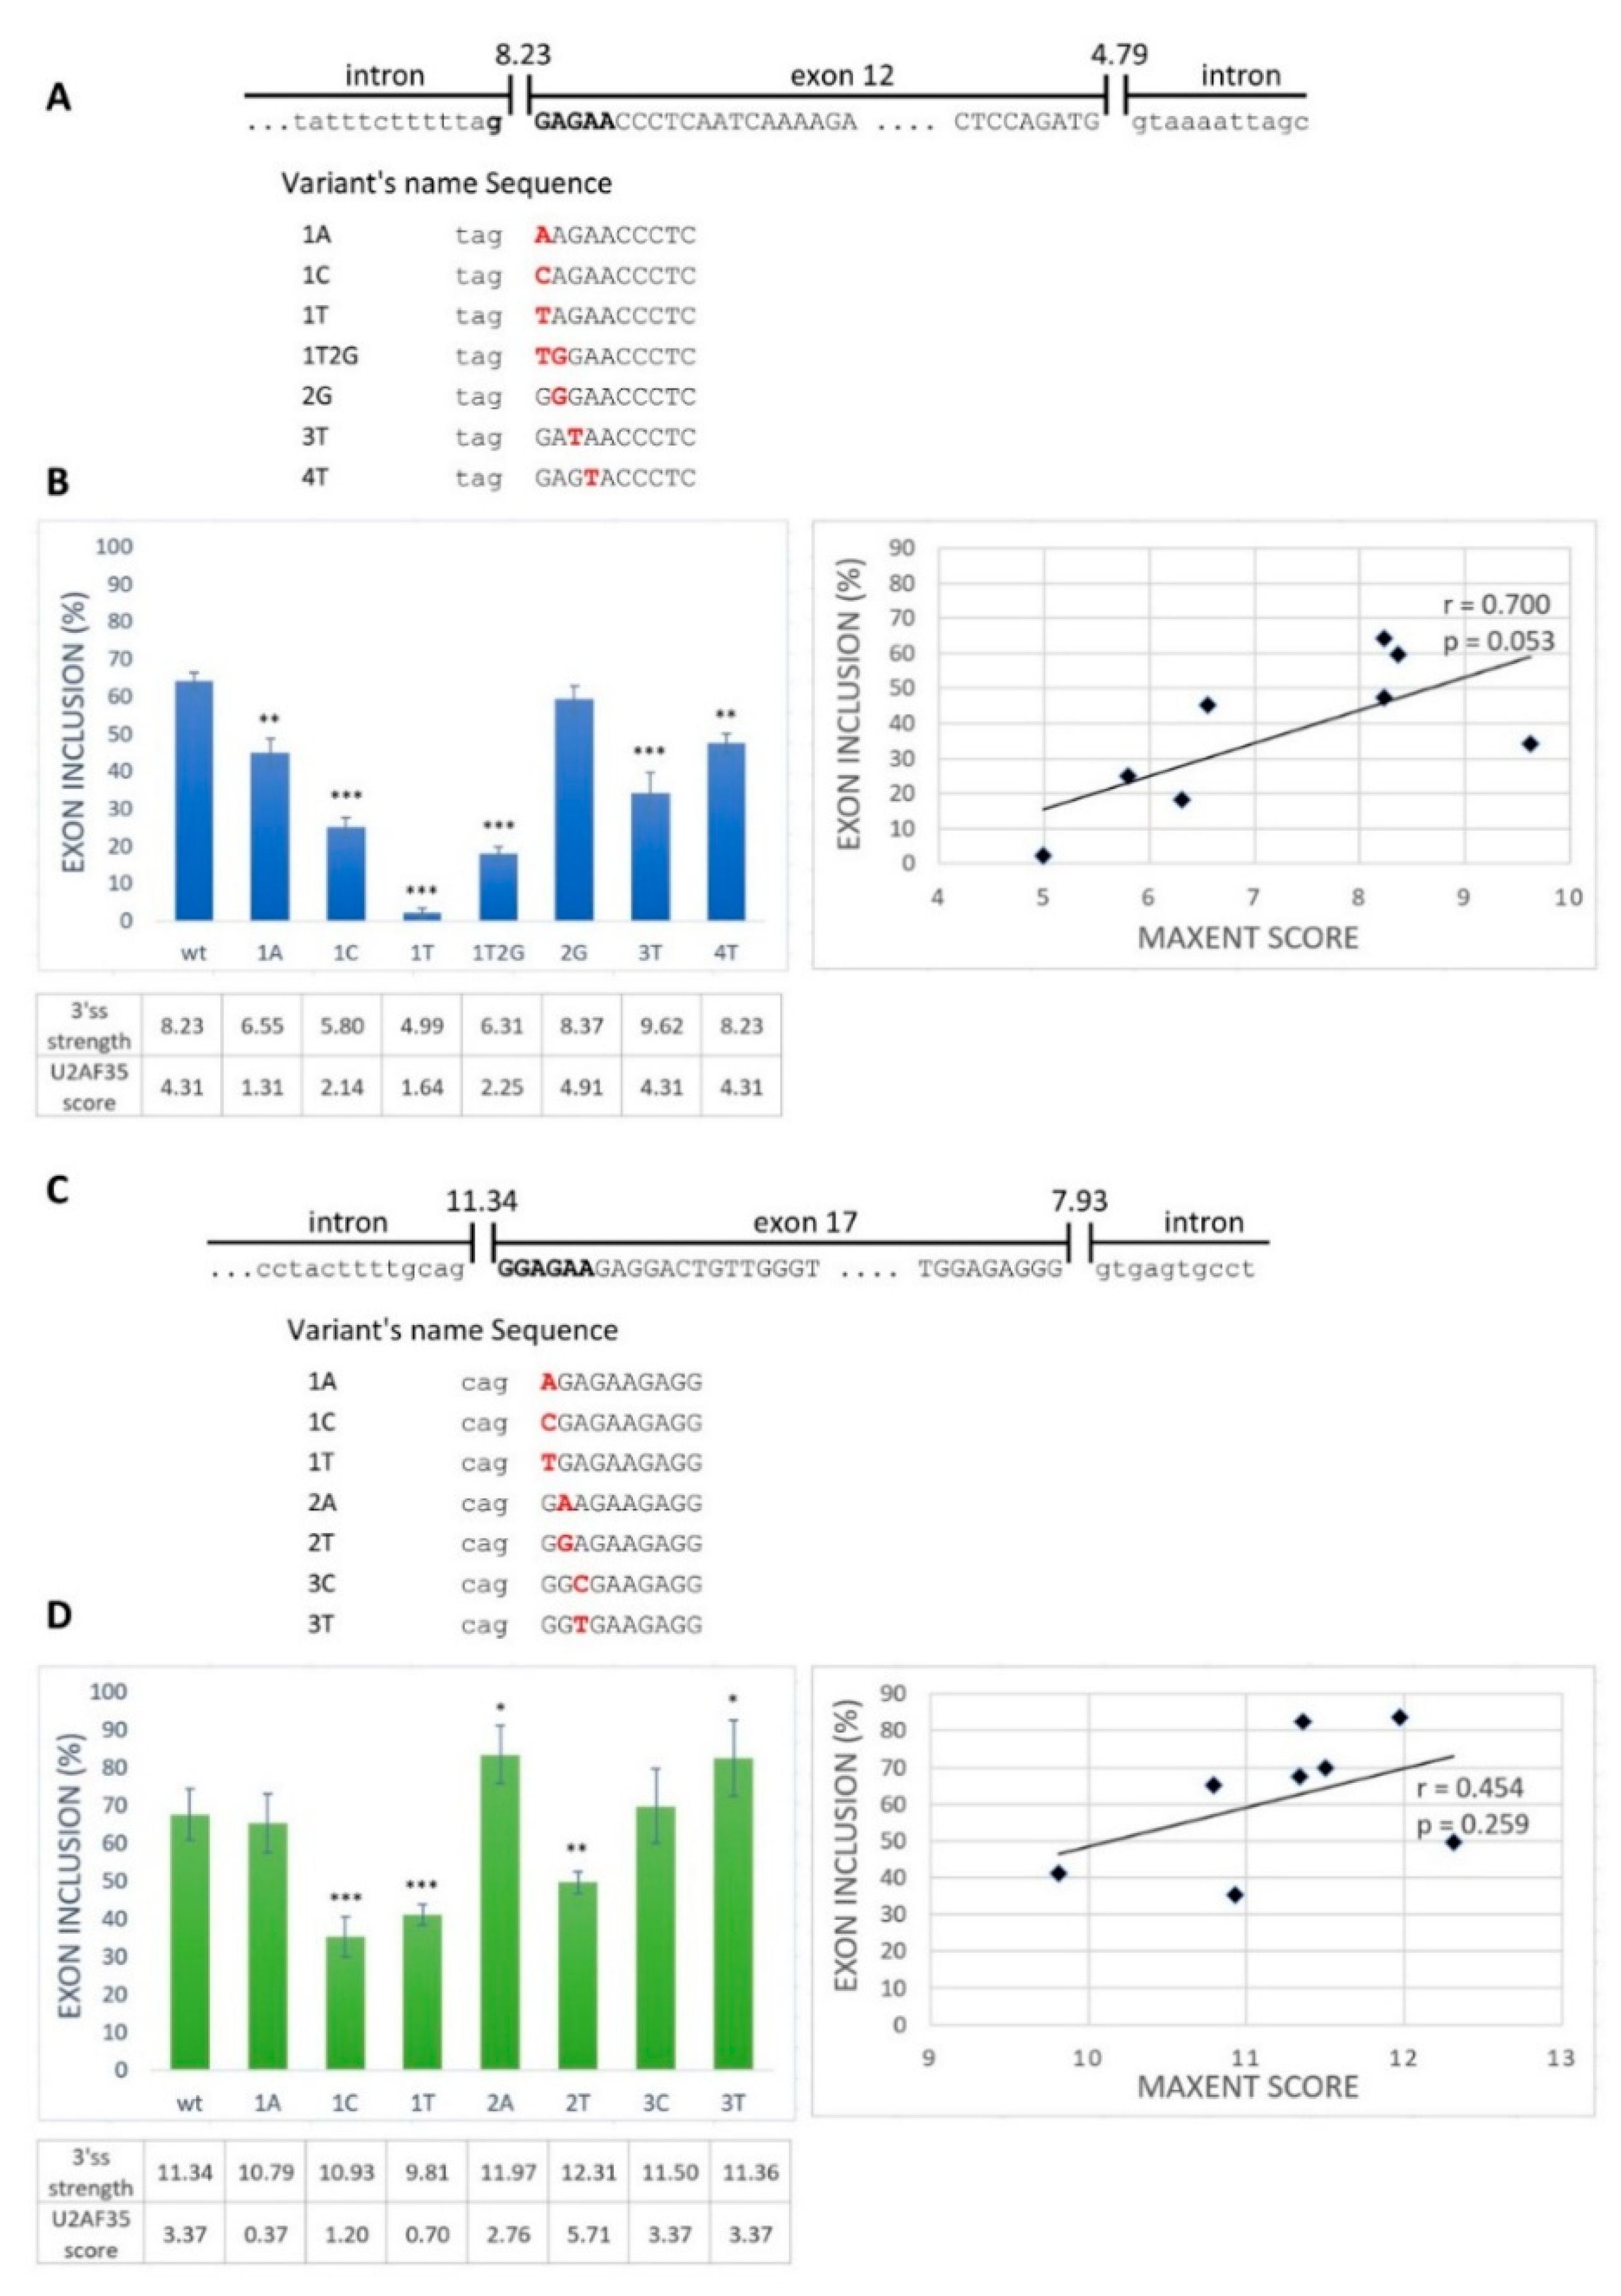
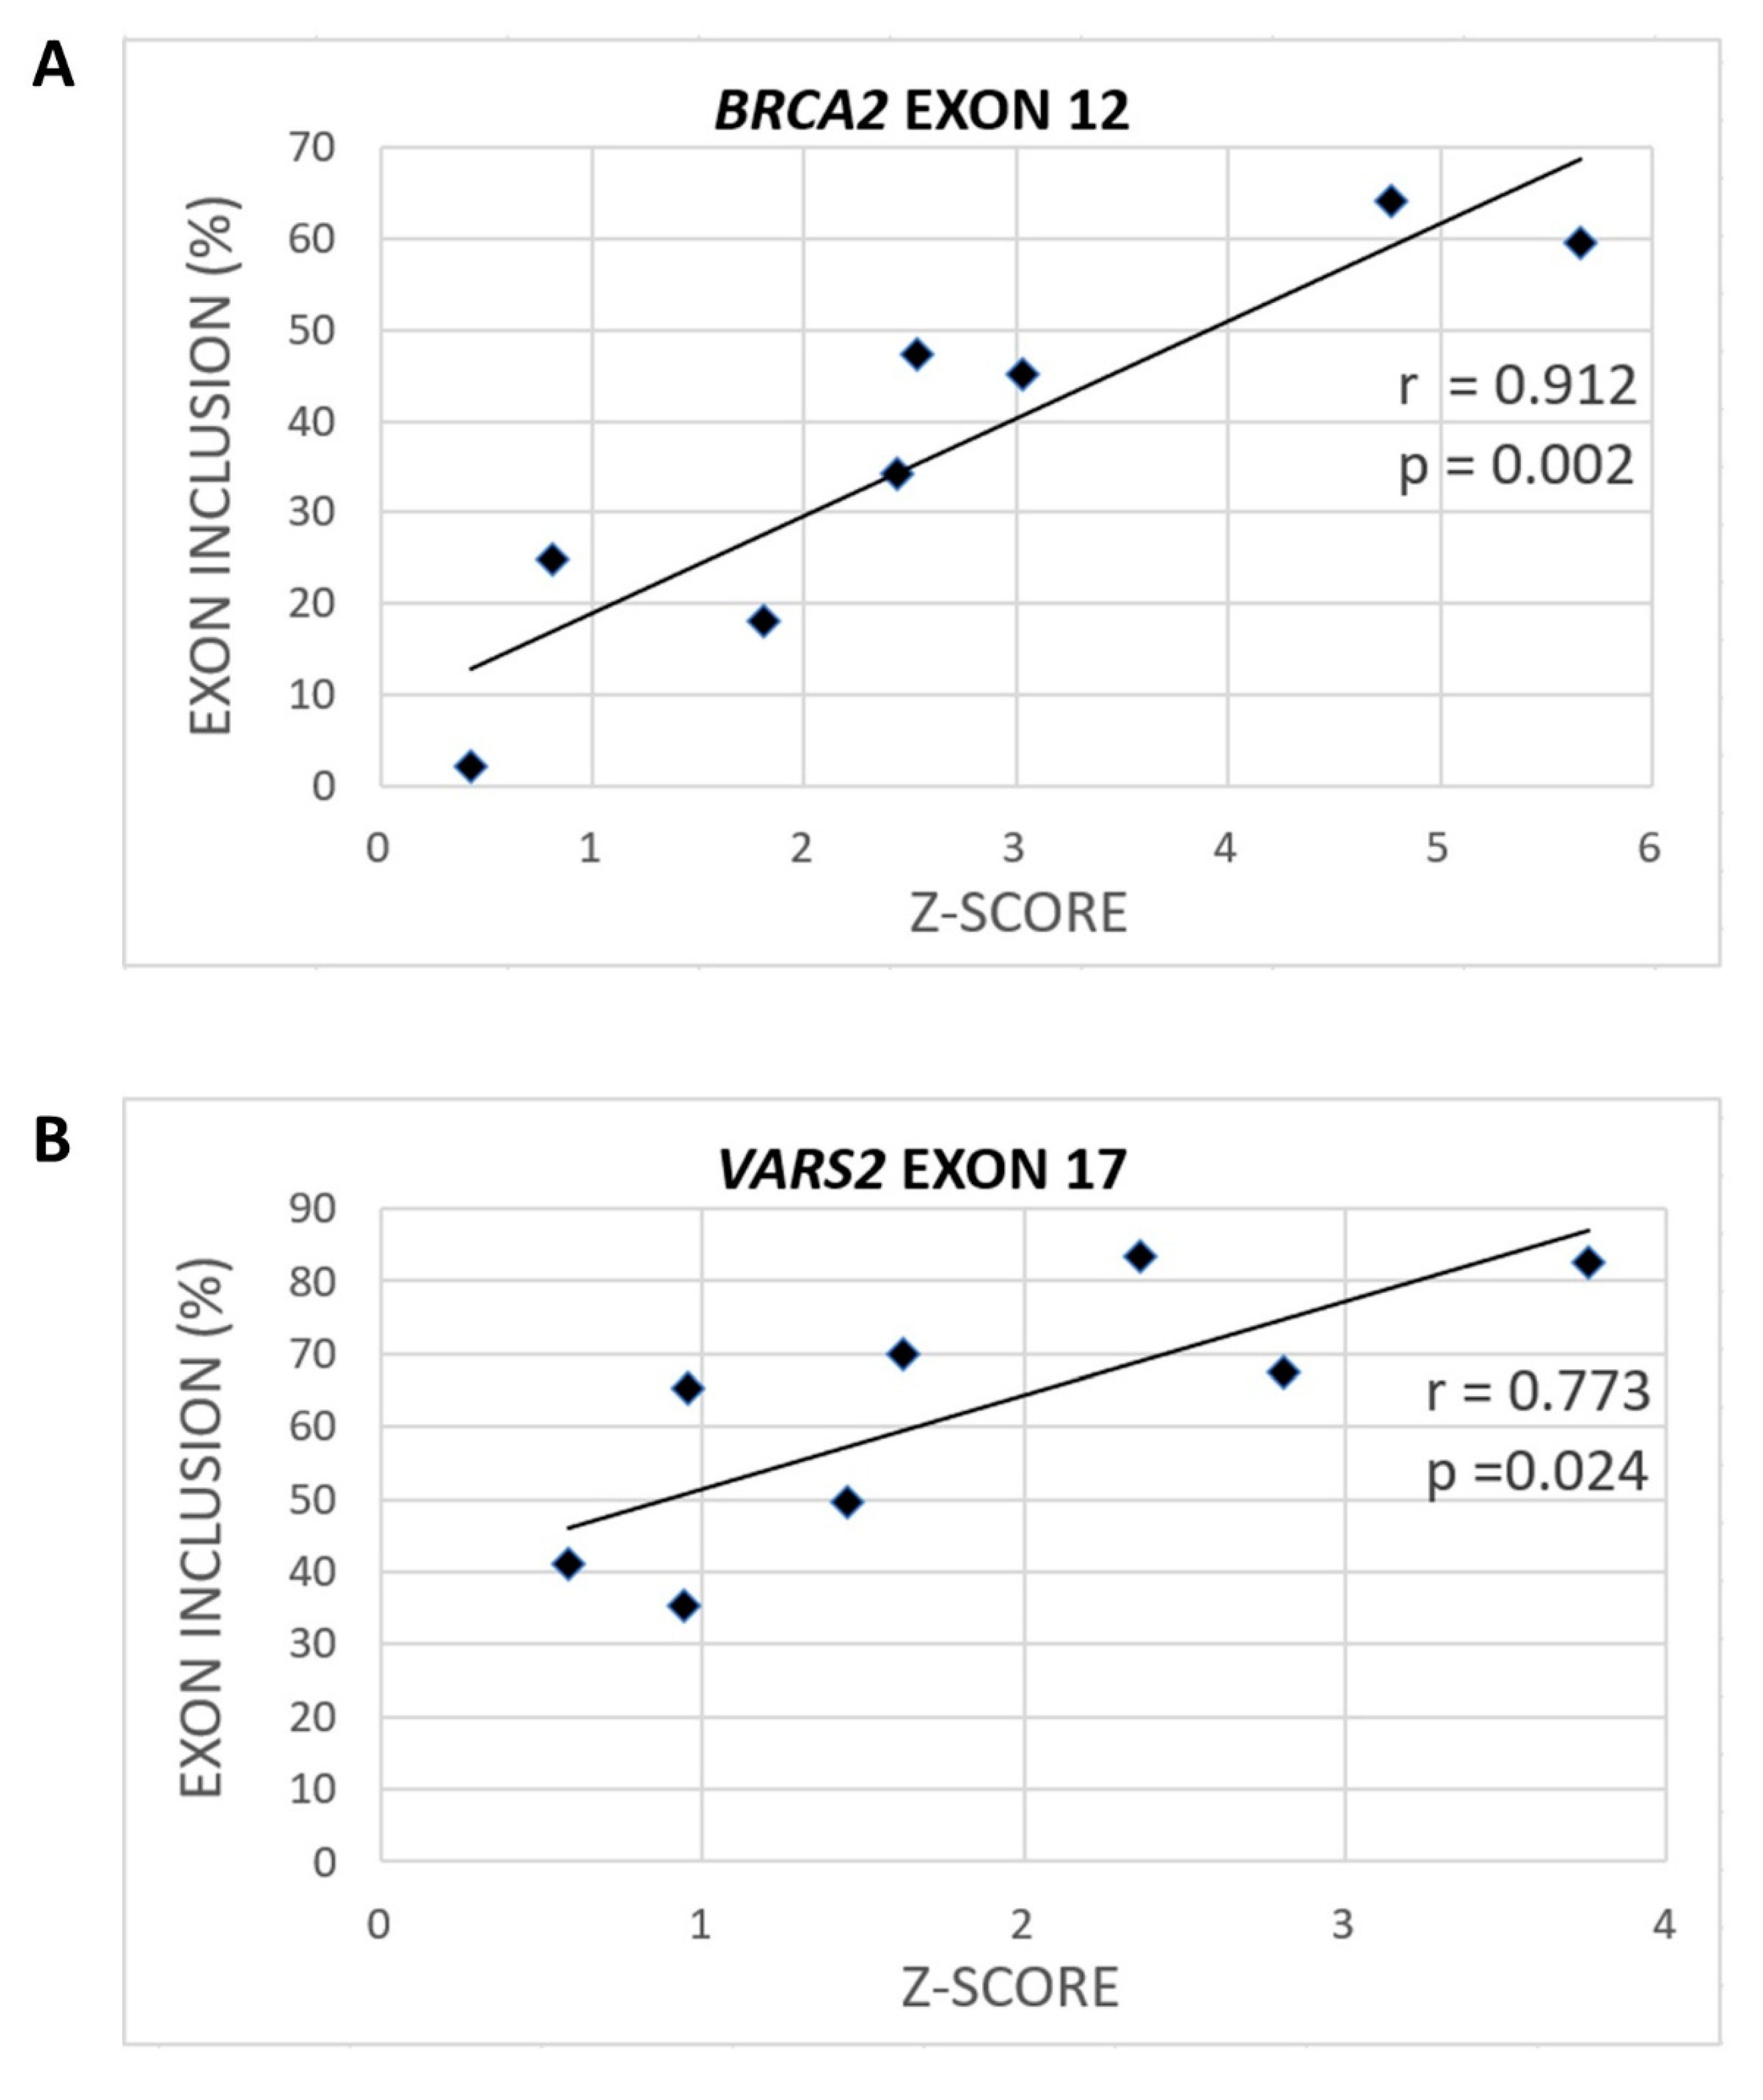
2.2. GGAGAA Mutations at the Intron–Exon Border Affect Splicing in a Way That Does not Unambiguously Correlate with the Predicted 3′ss Strength
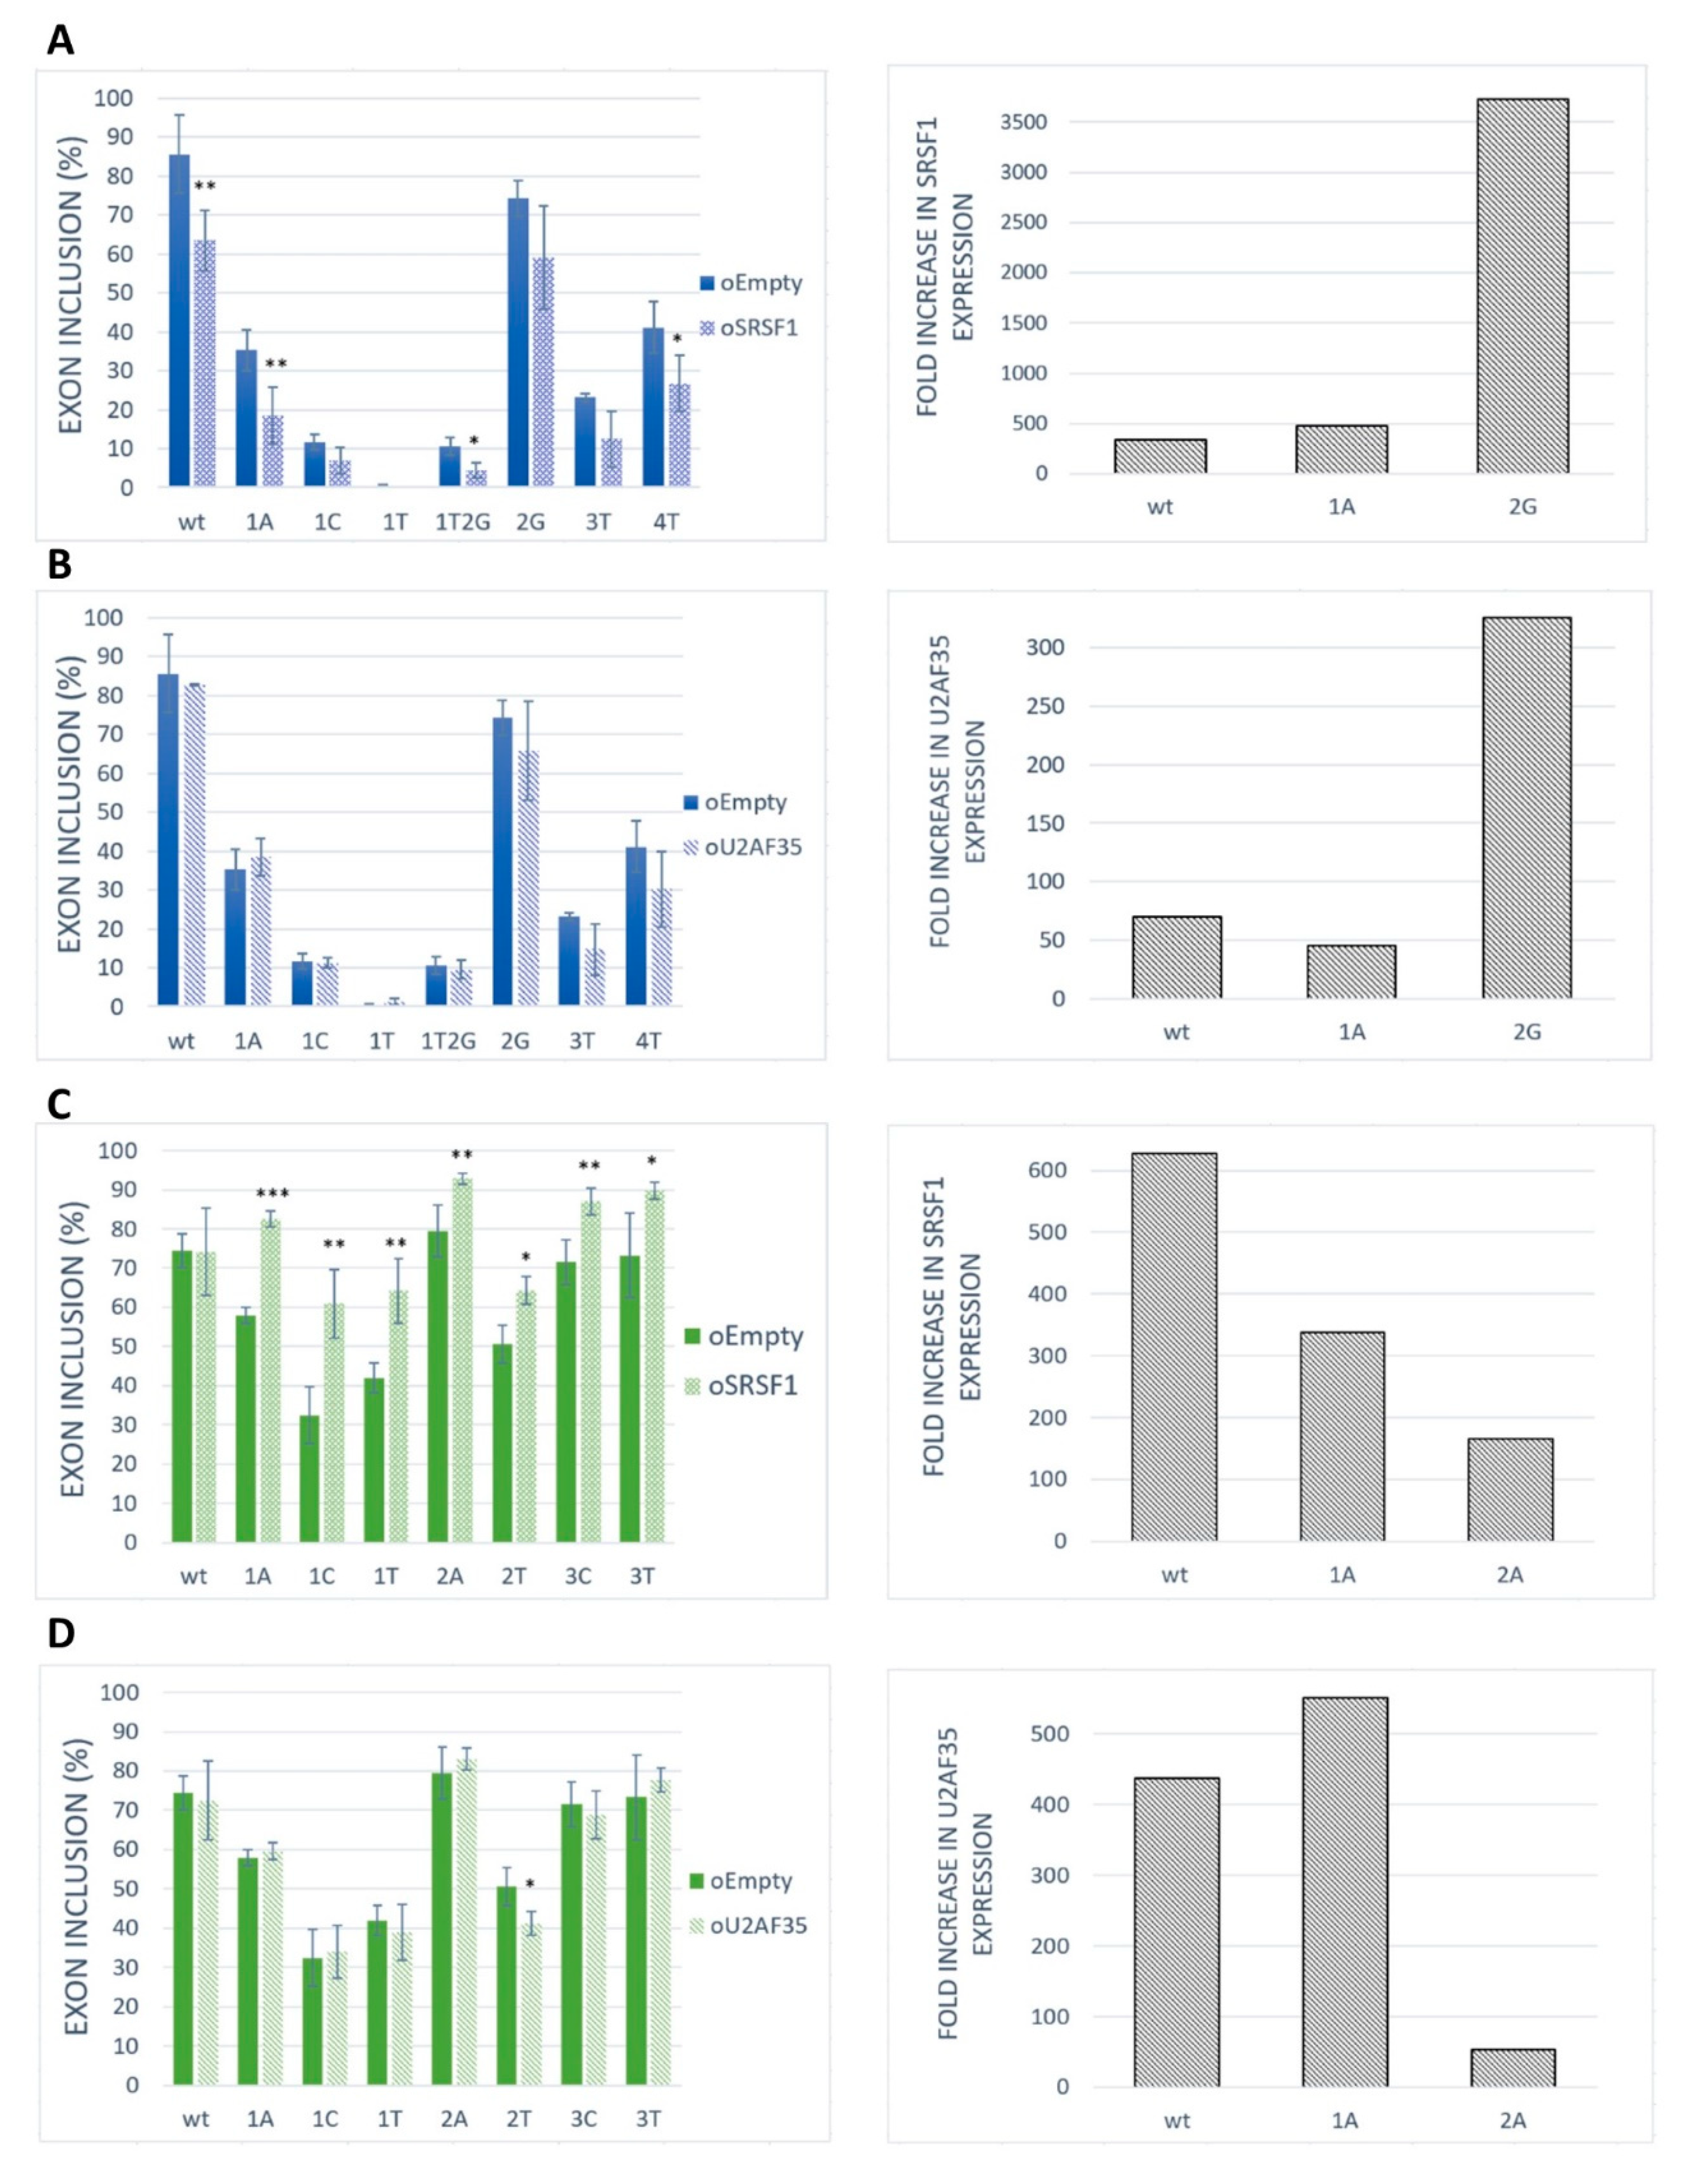
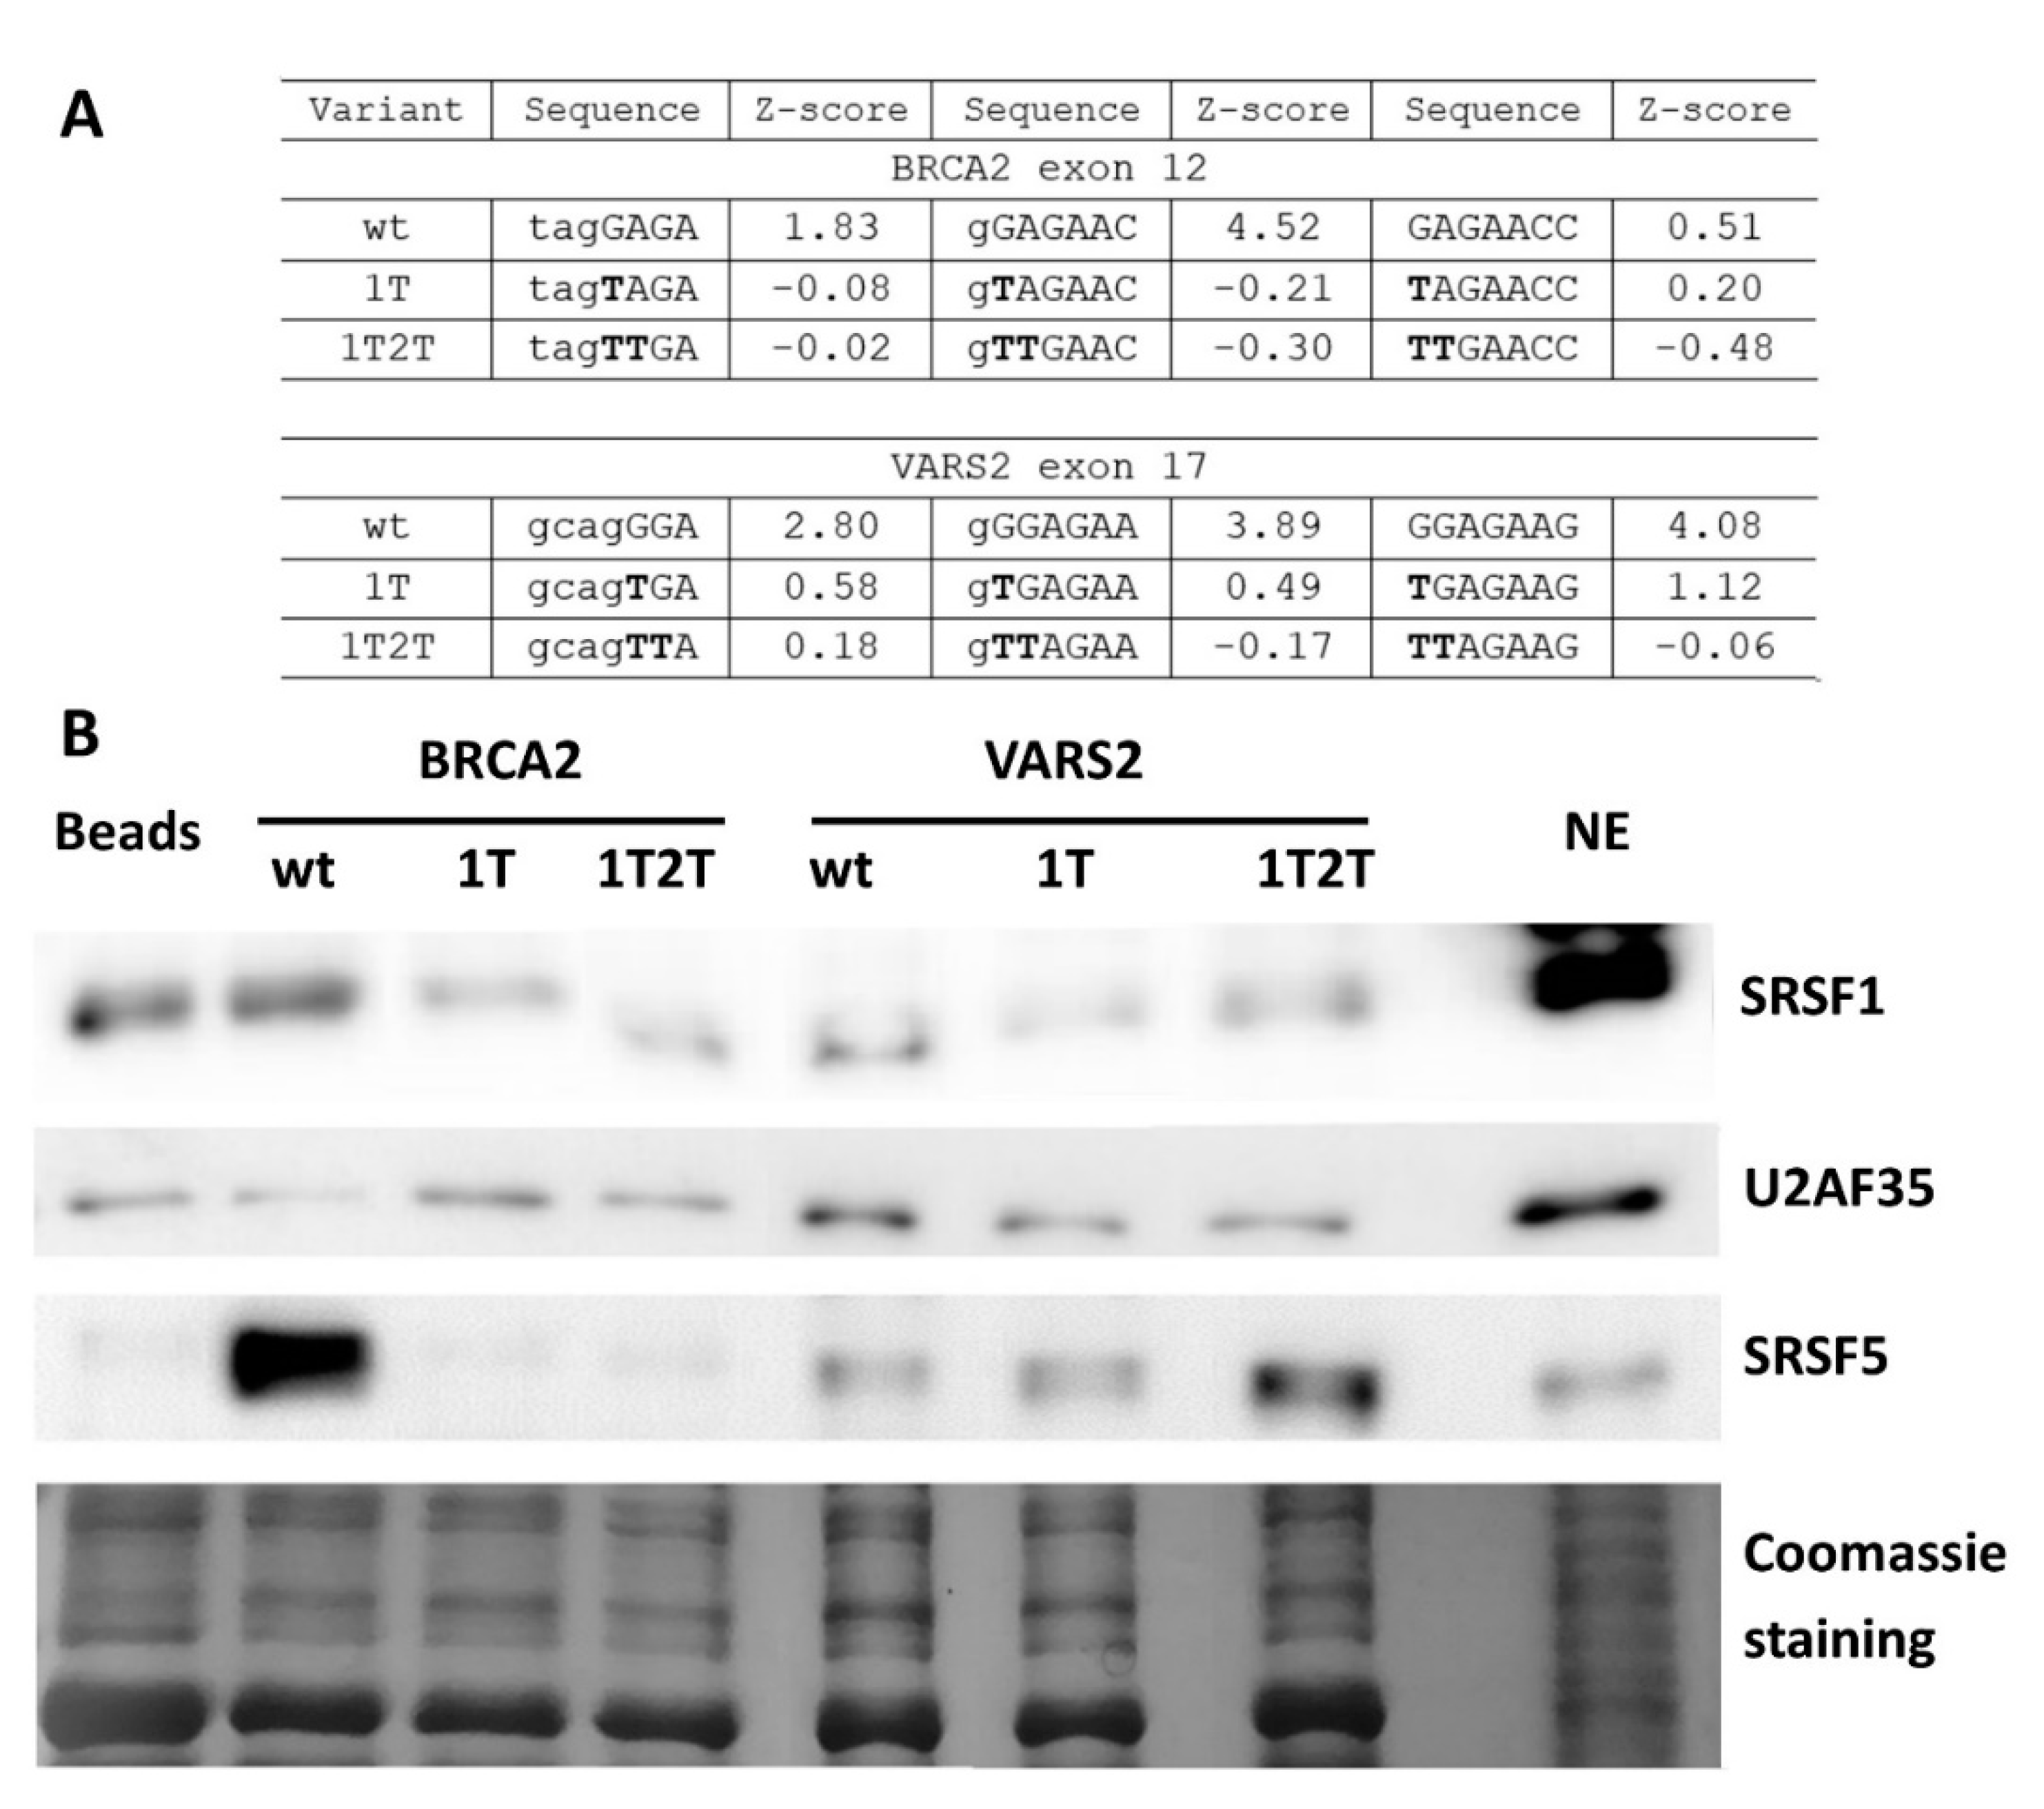
2.3. SRSF1 and U2AF1 Are Included in Recognition of Both Exons
2.4. GGAGAA Motif Can Be Recognized by SRSF1 in Our Models
3. Discussion
4. Materials and Methods
4.1. In Silico Prediction/Bioinformatic Analysis
4.2. Splicing Minigene Assay
4.2.1. Plasmid Construction and Mutagenesis
4.2.2. Cell Culture and Transfection
4.2.3. RNA Extraction and RT-PCR
4.2.4. Capillary Electrophoresis Analysis
4.3. Quantitative PCR
4.4. ESE-Dependent Splicing Minigene Assay
4.5. Affinity Purification of RNA-Binding Protein (Pull-Down Assay)
4.6. SDS-PAGE and Western Blot Analysis
Supplementary Materials
Author Contributions
Funding
Acknowledgments
Conflicts of Interest
Abbreviations
| BPS | Branch point sequence |
| CISBP-RNA database | Catalog of Inferred Sequence Binding Preferences of RNA binding proteins |
| ESE | Exonic splicing enhancer |
| ESS | Exonic splicing silencer |
| ISE | Intronic splicing enhancer |
| ISS | Intronic splicing silencer |
| MaxEnt | Maximum Entropy |
| NEC | No ESE control |
| PPT | Polypyrimidine tract |
| pre-mRNA | Precursor messenger RNA |
| putESE | Putative ESE |
| RBP | RNA-binding protein |
| SF1 | Splicing factor 1 |
| snRNP | Small nuclear ribonucleoprotein |
| U2AF | U2 snRNP auxiliary factor |
| WT | Wild-type |
References
- Newman, A. RNA splicing. Curr. Biol. 1998, 8, R903–R905. [Google Scholar] [CrossRef] [Green Version]
- Burge, C.B.; Tuschl, T.; Sharp, P.A. 20 Splicing of Precursors to mRNAs by the Spliceosomes. Cold Spring Harb. Monogr. Arch. 1999, 37, 525–560. [Google Scholar] [CrossRef]
- Zhang, C.; Li, W.-H.; Krainer, A.R.; Zhang, M.Q. RNA landscape of evolution for optimal exon and intron discrimination. Proc. Natl. Acad. Sci. USA 2008, 105, 5797–5802. [Google Scholar] [CrossRef] [Green Version]
- Dreyfuss, G.; Kim, V.N.; Kataoka, N. Messenger-RNA-binding proteins and the messages they carry. Nat. Rev. Mol. Cell Biol. 2002, 3, 195–205. [Google Scholar] [CrossRef] [PubMed]
- Long, J.C.; Caceres, J.F. The SR protein family of splicing factors: Master regulators of gene expression. Biochem. J. 2009, 417, 15–27. [Google Scholar] [CrossRef] [PubMed] [Green Version]
- Graveley, B.R. Sorting out the complexity of SR protein functions. RNA 2000, 6, 1197–1211. [Google Scholar] [CrossRef] [Green Version]
- Wu, S.; Romfo, C.M.; Nilsen, T.W.; Green, M.R. Functional recognition of the 3′ splice site AG by the splicing factor U2AF 35. Nature 1999, 402, 832–835. [Google Scholar] [CrossRef]
- Will, C.L.; Lührmann, R. Spliceosome structure and function. Cold Spring Harb. Perspect. Biol. 2011, 3. [Google Scholar] [CrossRef] [Green Version]
- Wu, J.Y.; Maniatis, T. Specific interactions between proteins implicated in splice site selection and regulated alternative splicing. Cell 1993, 75, 1061–1070. [Google Scholar] [CrossRef]
- Zuo, P.; Maniatis, T. The splicing factor U2AF35 mediates critical protein-protein interactions in constitutive and enhancer-dependent splicing. Genes Dev. 1996, 10, 1356–1368. [Google Scholar] [CrossRef] [Green Version]
- Manley, J.L.; Krainer, A.R. A rational nomenclature for serine/arginine-rich protein splicing factors (SR proteins). Genes Dev. 2010, 24, 1073–1074. [Google Scholar] [CrossRef] [PubMed] [Green Version]
- Jeong, S. SR Proteins: Binders, Regulators, and Connectors of RNA. Mol. Cells 2017, 40, 1–9. [Google Scholar] [CrossRef] [PubMed] [Green Version]
- Kanopka, A.; Mühlemann, O.; Akusjärvi, G. Inhibition by SR proteins of splicing of a regulated adenovirus pre-mRNA. Nature 1996, 381, 535–538. [Google Scholar] [CrossRef] [PubMed]
- Shin, C.; Feng, Y.; Manley, J.L. Dephosphorylated SRp38 acts as a splicing repressor in response to heat shock. Nature 2004, 427, 553–558. [Google Scholar] [CrossRef]
- Das, S.; Krainer, A.R. Emerging functions of SRSF1, splicing factor and oncoprotein, in RNA metabolism and cancer. Mol. Cancer Res. MCR 2014, 12, 1195–1204. [Google Scholar] [CrossRef] [Green Version]
- Gonçalves, V.; Jordan, P. Posttranscriptional Regulation of Splicing Factor SRSF1 and Its Role in Cancer Cell Biology. BioMed Res. Int. 2015, 2015, 287048. [Google Scholar] [CrossRef] [Green Version]
- Pandit, S.; Zhou, Y.; Shiue, L.; Coutinho-Mansfield, G.; Li, H.; Qiu, J.; Huang, J.; Yeo, G.W.; Ares, M.; Fu, X.-D. Genome-wide Analysis Reveals SR Protein Cooperation and Competition in Regulated Splicing. Mol. Cell 2013, 50, 223–235. [Google Scholar] [CrossRef]
- Krainer, A.R.; Conway, G.C.; Kozak, D. The essential pre-mRNA splicing factor SF2 influences 5′ splice site selection by activating proximal sites. Cell 1990, 62, 35–42. [Google Scholar] [CrossRef]
- Sanford, J.R.; Wang, X.; Mort, M.; Vanduyn, N.; Cooper, D.N.; Mooney, S.D.; Edenberg, H.J.; Liu, Y. Splicing factor SFRS1 recognizes a functionally diverse landscape of RNA transcripts. Genome Res. 2009, 19, 381–394. [Google Scholar] [CrossRef] [Green Version]
- Graveley, B.R.; Hertel, K.J.; Maniatis, T. The role of U2AF35 and U2AF65 in enhancer-dependent splicing. RNA 2001, 7, 806–818. [Google Scholar] [CrossRef] [Green Version]
- Kralovicova, J.; Knut, M.; Cross, N.C.P.; Vorechovsky, I. Identification of U2AF(35)-dependent exons by RNA-Seq reveals a link between 3′ splice-site organization and activity of U2AF-related proteins. Nucleic Acids Res. 2015, 43, 3747–3763. [Google Scholar] [CrossRef] [PubMed] [Green Version]
- Fu, Y.; Masuda, A.; Ito, M.; Shinmi, J.; Ohno, K. AG-dependent 3′-splice sites are predisposed to aberrant splicing due to a mutation at the first nucleotide of an exon. Nucleic Acids Res. 2011, 39, 4396–4404. [Google Scholar] [CrossRef] [PubMed] [Green Version]
- Grodecká, L.; Lockerová, P.; Ravčuková, B.; Buratti, E.; Baralle, F.E.; Dušek, L.; Freiberger, T. Exon First Nucleotide Mutations in Splicing: Evaluation of In Silico Prediction Tools. PLoS ONE 2014, 9. [Google Scholar] [CrossRef] [PubMed] [Green Version]
- Mollet, I.; Barbosa-Morais, N.L.; Andrade, J.; Carmo-Fonseca, M. Diversity of human U2AF splicing factors. FEBS J. 2006, 273, 4807–4816. [Google Scholar] [CrossRef] [PubMed]
- Shao, C.; Yang, B.; Wu, T.; Huang, J.; Tang, P.; Zhou, Y.; Zhou, J.; Qiu, J.; Jiang, L.; Li, H.; et al. Mechanisms for U2AF to define 3′ splice sites and regulate alternative splicing in the human genome. Nat. Struct. Mol. Biol. 2014, 21, 997–1005. [Google Scholar] [CrossRef]
- Sohail, M.; Xie, J. Diverse regulation of 3′ splice site usage. Cell. Mol. Life Sci. 2015, 72, 4771–4793. [Google Scholar] [CrossRef]
- Wu, T.; Fu, X.-D. Genomic functions of U2AF in constitutive and regulated splicing. RNA Biol. 2015, 12, 479–485. [Google Scholar] [CrossRef] [Green Version]
- Shariat, N.; Holladay, C.; Cleary, R.; Patton, J., III. Isolated growth hormone deficiency type II caused by a point mutation that alters both splice site strength and splicing enhancer function. Clin. Genet. 2008, 74, 539–545. [Google Scholar] [CrossRef]
- Rooke, N.; Markovtsov, V.; Cagavi, E.; Black, D.L. Roles for SR Proteins and hnRNP A1 in the Regulation of c-src Exon N1. Mol. Cell. Biol. 2003, 23, 1874–1884. [Google Scholar] [CrossRef] [Green Version]
- Wang, X.; Juan, L.; Lv, J.; Wang, K.; Sanford, J.R.; Liu, Y. Predicting sequence and structural specificities of RNA binding regions recognized by splicing factor SRSF1. BMC Genom. 2011, 12, S8. [Google Scholar] [CrossRef] [Green Version]
- Ray, D.; Kazan, H.; Cook, K.B.; Weirauch, M.T.; Najafabadi, H.S.; Li, X.; Gueroussov, S.; Albu, M.; Zheng, H.; Yang, A.; et al. A compendium of RNA-binding motifs for decoding gene regulation. Nature 2013, 499, 172–177. [Google Scholar] [CrossRef] [PubMed] [Green Version]
- Tournier, I.; Vezain, M.; Martins, A.; Charbonnier, F.; Baert-Desurmont, S.; Olschwang, S.; Wang, Q.; Buisine, M.P.; Soret, J.; Tazi, J.; et al. A large fraction of unclassified variants of the mismatch repair genes MLH1 and MSH2 is associated with splicing defects. Hum. Mutat. 2008, 29, 1412–1424. [Google Scholar] [CrossRef] [PubMed]
- Gaildrat, P.; Krieger, S.; Théry, J.-C.; Killian, A.; Rousselin, A.; Berthet, P.; Frébourg, T.; Hardouin, A.; Martins, A.; Tosi, M. The BRCA1 c.5434C→G (p.Pro1812Ala) variant induces a deleterious exon 23 skipping by affecting exonic splicing regulatory elements. J. Med. Genet. 2010, 47, 398–403. [Google Scholar] [CrossRef] [PubMed] [Green Version]
- Ke, S.; Shang, S.; Kalachikov, S.M.; Morozova, I.; Yu, L.; Russo, J.J.; Ju, J.; Chasin, L.A. Quantitative evaluation of all hexamers as exonic splicing elements. Genome Res. 2011, 21, 1360–1374. [Google Scholar] [CrossRef] [PubMed] [Green Version]
- Piva, F.; Giulietti, M.; Burini, A.B.; Principato, G. SpliceAid 2: A database of human splicing factors expression data and RNA target motifs. Hum. Mutat. 2012, 33, 81–85. [Google Scholar] [CrossRef]
- Yeo, G.; Burge, C.B. Maximum entropy modeling of short sequence motifs with applications to RNA splicing signals. J. Comput. Biol. J. Comput. Mol. Cell Biol. 2004, 11, 377–394. [Google Scholar] [CrossRef]
- Doktor, T.K.; Schroeder, L.D.; Vested, A.; Palmfeldt, J.; Andersen, H.S.; Gregersen, N.; Andresen, B.S. SMN2 exon 7 splicing is inhibited by binding of hnRNP A1 to a common ESS motif that spans the 3′ splice site. Hum. Mutat. 2011, 32, 220–230. [Google Scholar] [CrossRef] [Green Version]
- Saltzman, A.L.; Pan, Q.; Blencowe, B.J. Regulation of alternative splicing by the core spliceosomal machinery. Genes Dev. 2011, 25, 373–384. [Google Scholar] [CrossRef] [Green Version]
- Huang, X.; Zheng, M.; Wang, P.; Mok, B.W.-Y.; Liu, S.; Lau, S.-Y.; Chen, P.; Liu, Y.-C.; Liu, H.; Chen, Y.; et al. An NS-segment exonic splicing enhancer regulates influenza A virus replication in mammalian cells. Nat. Commun. 2017, 8, 14751. [Google Scholar] [CrossRef] [Green Version]
- Ilagan, J.O.; Ramakrishnan, A.; Hayes, B.; Murphy, M.E.; Zebari, A.S.; Bradley, P.; Bradley, R.K. U2AF1 mutations alter splice site recognition in hematological malignancies. Genome Res. 2015, 25, 14–26. [Google Scholar] [CrossRef]
- Moseley, C.T.; Mullis, P.E.; Prince, M.A.; Phillips, J.A. An exon splice enhancer mutation causes autosomal dominant GH deficiency. J. Clin. Endocrinol. Metab. 2002, 87, 847–852. [Google Scholar] [CrossRef] [PubMed]
- McVety, S.; Li, L.; Gordon, P.H.; Chong, G.; Foulkes, W.D. Disruption of an exon splicing enhancer in exon 3 of MLH1 is the cause of HNPCC in a Quebec family. J. Med. Genet. 2006, 43, 153–156. [Google Scholar] [CrossRef] [PubMed]
- Julien, P.; Miñana, B.; Baeza-Centurion, P.; Valcárcel, J.; Lehner, B. The complete local genotype–phenotype landscape for the alternative splicing of a human exon. Nat. Commun. 2016, 7, 11558. [Google Scholar] [CrossRef] [Green Version]
- Ke, S.; Anquetil, V.; Zamalloa, J.R.; Maity, A.; Yang, A.; Arias, M.A.; Kalachikov, S.; Russo, J.J.; Ju, J.; Chasin, L.A. Saturation mutagenesis reveals manifold determinants of exon definition. Genome Res. 2018, 28, 11–24. [Google Scholar] [CrossRef] [Green Version]
- Singh, R.N.; Singh, N.N. Mechanism of Splicing Regulation of Spinal Muscular Atrophy Genes. Adv. Neurobiol. 2018, 20, 31–61. [Google Scholar] [CrossRef]
- Dauksaite, V.; Akusjärvi, G. Human splicing factor ASF/SF2 encodes for a repressor domain required for its inhibitory activity on pre-mRNA splicing. J. Biol. Chem. 2002, 277, 12579–12586. [Google Scholar] [CrossRef] [Green Version]
- Han, J.; Ding, J.-H.; Byeon, C.W.; Kim, J.H.; Hertel, K.J.; Jeong, S.; Fu, X.-D. SR proteins induce alternative exon skipping through their activities on the flanking constitutive exons. Mol. Cell. Biol. 2011, 31, 793–802. [Google Scholar] [CrossRef] [PubMed] [Green Version]
- Rual, J.-F.; Venkatesan, K.; Hao, T.; Hirozane-Kishikawa, T.; Dricot, A.; Li, N.; Berriz, G.F.; Gibbons, F.D.; Dreze, M.; Ayivi-Guedehoussou, N.; et al. Towards a proteome-scale map of the human protein-protein interaction network. Nature 2005, 437, 1173–1178. [Google Scholar] [CrossRef] [PubMed]
- Huttlin, E.L.; Bruckner, R.J.; Paulo, J.A.; Cannon, J.R.; Ting, L.; Baltier, K.; Colby, G.; Gebreab, F.; Gygi, M.P.; Parzen, H.; et al. Architecture of the human interactome defines protein communities and disease networks. Nature 2017, 545, 505–509. [Google Scholar] [CrossRef]
- Goren, A.; Kim, E.; Amit, M.; Vaknin, K.; Kfir, N.; Ram, O.; Ast, G. Overlapping splicing regulatory motifs—combinatorial effects on splicing. Nucleic Acids Res. 2010, 38, 3318–3327. [Google Scholar] [CrossRef] [Green Version]
- Benoit Bouvrette, L.P.; Bovaird, S.; Blanchette, M.; Lécuyer, E. oRNAment: A database of putative RNA binding protein target sites in the transcriptomes of model species. Nucleic Acids Res. 2020, 48, D166–D173. [Google Scholar] [CrossRef] [PubMed] [Green Version]
- Cléry, A.; Jayne, S.; Benderska, N.; Dominguez, C.; Stamm, S.; Allain, F.H.-T. Molecular basis of purine-rich RNA recognition by the human SR-like protein Tra2-β1. Nat. Struct. Mol. Biol. 2011, 18, 443–450. [Google Scholar] [CrossRef] [PubMed]
- Desmet, F.-O.; Hamroun, D.; Lalande, M.; Collod-Béroud, G.; Claustres, M.; Béroud, C. Human Splicing Finder: An online bioinformatics tool to predict splicing signals. Nucleic Acids Res. 2009, 37, e67. [Google Scholar] [CrossRef] [PubMed] [Green Version]
- Cerasuolo, A.; Buonaguro, L.; Buonaguro, F.M.; Tornesello, M.L. The Role of RNA Splicing Factors in Cancer: Regulation of Viral and Human Gene Expression in Human Papillomavirus-Related Cervical Cancer. Front. Cell Dev. Biol. 2020, 8. [Google Scholar] [CrossRef]
- Anczuków, O.; Akerman, M.; Cléry, A.; Wu, J.; Shen, C.; Shirole, N.H.; Raimer, A.; Sun, S.; Jensen, M.A.; Hua, Y.; et al. SRSF1-Regulated Alternative Splicing in Breast Cancer. Mol. Cell 2015, 60, 105–117. [Google Scholar] [CrossRef]
- Brooks, A.N.; Choi, P.S.; de Waal, L.; Sharifnia, T.; Imielinski, M.; Saksena, G.; Pedamallu, C.S.; Sivachenko, A.; Rosenberg, M.; Chmielecki, J.; et al. A pan-cancer analysis of transcriptome changes associated with somatic mutations in U2AF1 reveals commonly altered splicing events. PLoS ONE 2014, 9, e87361. [Google Scholar] [CrossRef] [Green Version]
- Hernández-Imaz, E.; Martín, Y.; de Conti, L.; Melean, G.; Valero, A.; Baralle, M.; Hernández-Chico, C. Functional Analysis of Mutations in Exon 9 of NF1 Reveals the Presence of Several Elements Regulating Splicing. PLoS ONE 2015, 10. [Google Scholar] [CrossRef] [Green Version]
- Pacheco, T.R.; Moita, L.F.; Gomes, A.Q.; Hacohen, N.; Carmo-Fonseca, M. RNA interference knockdown of hU2AF35 impairs cell cycle progression and modulates alternative splicing of Cdc25 transcripts. Mol. Biol. Cell 2006, 17, 4187–4199. [Google Scholar] [CrossRef] [Green Version]
- Rahman, M.A.; Azuma, Y.; Nasrin, F.; Takeda, J.; Nazim, M.; Ahsan, K.B.; Masuda, A.; Engel, A.G.; Ohno, K. SRSF1 and hnRNP H antagonistically regulate splicing of COLQ exon 16 in a congenital myasthenic syndrome. Sci. Rep. 2015, 5, 13208. [Google Scholar] [CrossRef] [Green Version]
- Jobbins, A.M.; Reichenbach, L.F.; Lucas, C.M.; Hudson, A.J.; Burley, G.A.; Eperon, I.C. The mechanisms of a mammalian splicing enhancer. Nucleic Acids Res. 2018, 46, 2145–2158. [Google Scholar] [CrossRef] [Green Version]
- Erkelenz, S.; Theiss, S.; Otte, M.; Widera, M.; Peter, J.O.; Schaal, H. Genomic HEXploring allows landscaping of novel potential splicing regulatory elements. Nucleic Acids Res. 2014, 42, 10681–10697. [Google Scholar] [CrossRef] [PubMed] [Green Version]
- Spena, S.; Tenchini, M.L.; Buratti, E. Cryptic splice site usage in exon 7 of the human fibrinogen Bβ-chain gene is regulated by a naturally silent SF2/ASF binding site within this exon. RNA 2006, 12, 948–958. [Google Scholar] [CrossRef] [PubMed] [Green Version]


© 2020 by the authors. Licensee MDPI, Basel, Switzerland. This article is an open access article distributed under the terms and conditions of the Creative Commons Attribution (CC BY) license (http://creativecommons.org/licenses/by/4.0/).
Share and Cite
Kováčová, T.; Souček, P.; Hujová, P.; Freiberger, T.; Grodecká, L. Splicing Enhancers at Intron–Exon Borders Participate in Acceptor Splice Sites Recognition. Int. J. Mol. Sci. 2020, 21, 6553. https://doi.org/10.3390/ijms21186553
Kováčová T, Souček P, Hujová P, Freiberger T, Grodecká L. Splicing Enhancers at Intron–Exon Borders Participate in Acceptor Splice Sites Recognition. International Journal of Molecular Sciences. 2020; 21(18):6553. https://doi.org/10.3390/ijms21186553
Chicago/Turabian StyleKováčová, Tatiana, Přemysl Souček, Pavla Hujová, Tomáš Freiberger, and Lucie Grodecká. 2020. "Splicing Enhancers at Intron–Exon Borders Participate in Acceptor Splice Sites Recognition" International Journal of Molecular Sciences 21, no. 18: 6553. https://doi.org/10.3390/ijms21186553