Transcriptional Changes Involved in Atrophying Muscles during Prolonged Fasting in Rats

 , ,
, ,
Abstract
: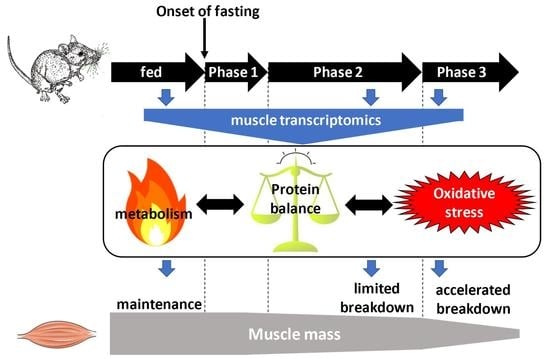
1. Introduction
2. Results
2.1. Animal Metabolic Status
2.2. Changes in Plasma Levels of Hormones and Growth Factors in Response to Prolonged Fasting
2.3. Overall Changes in TIB Muscle Transcriptome in Response to Prolonged Fasting
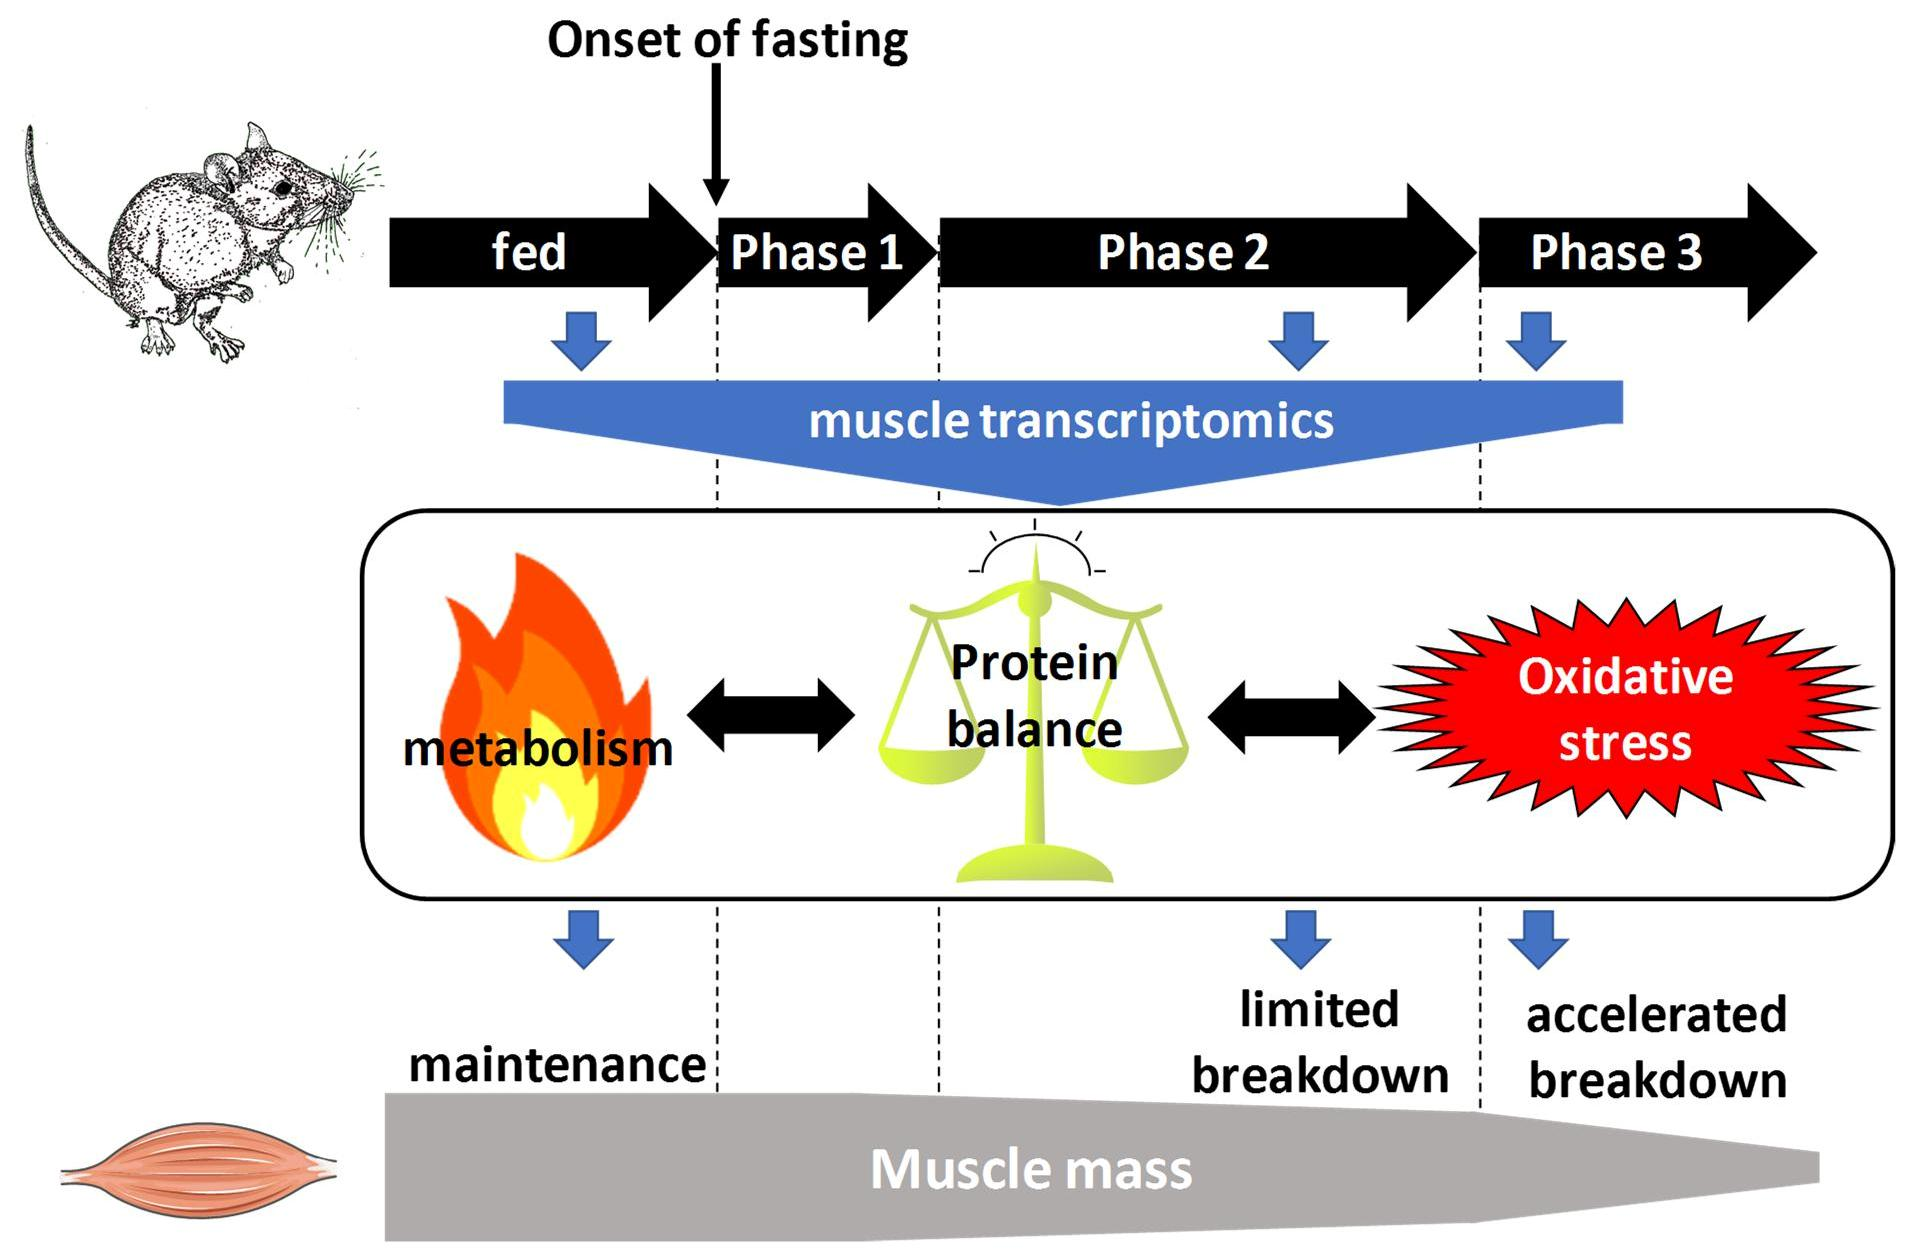
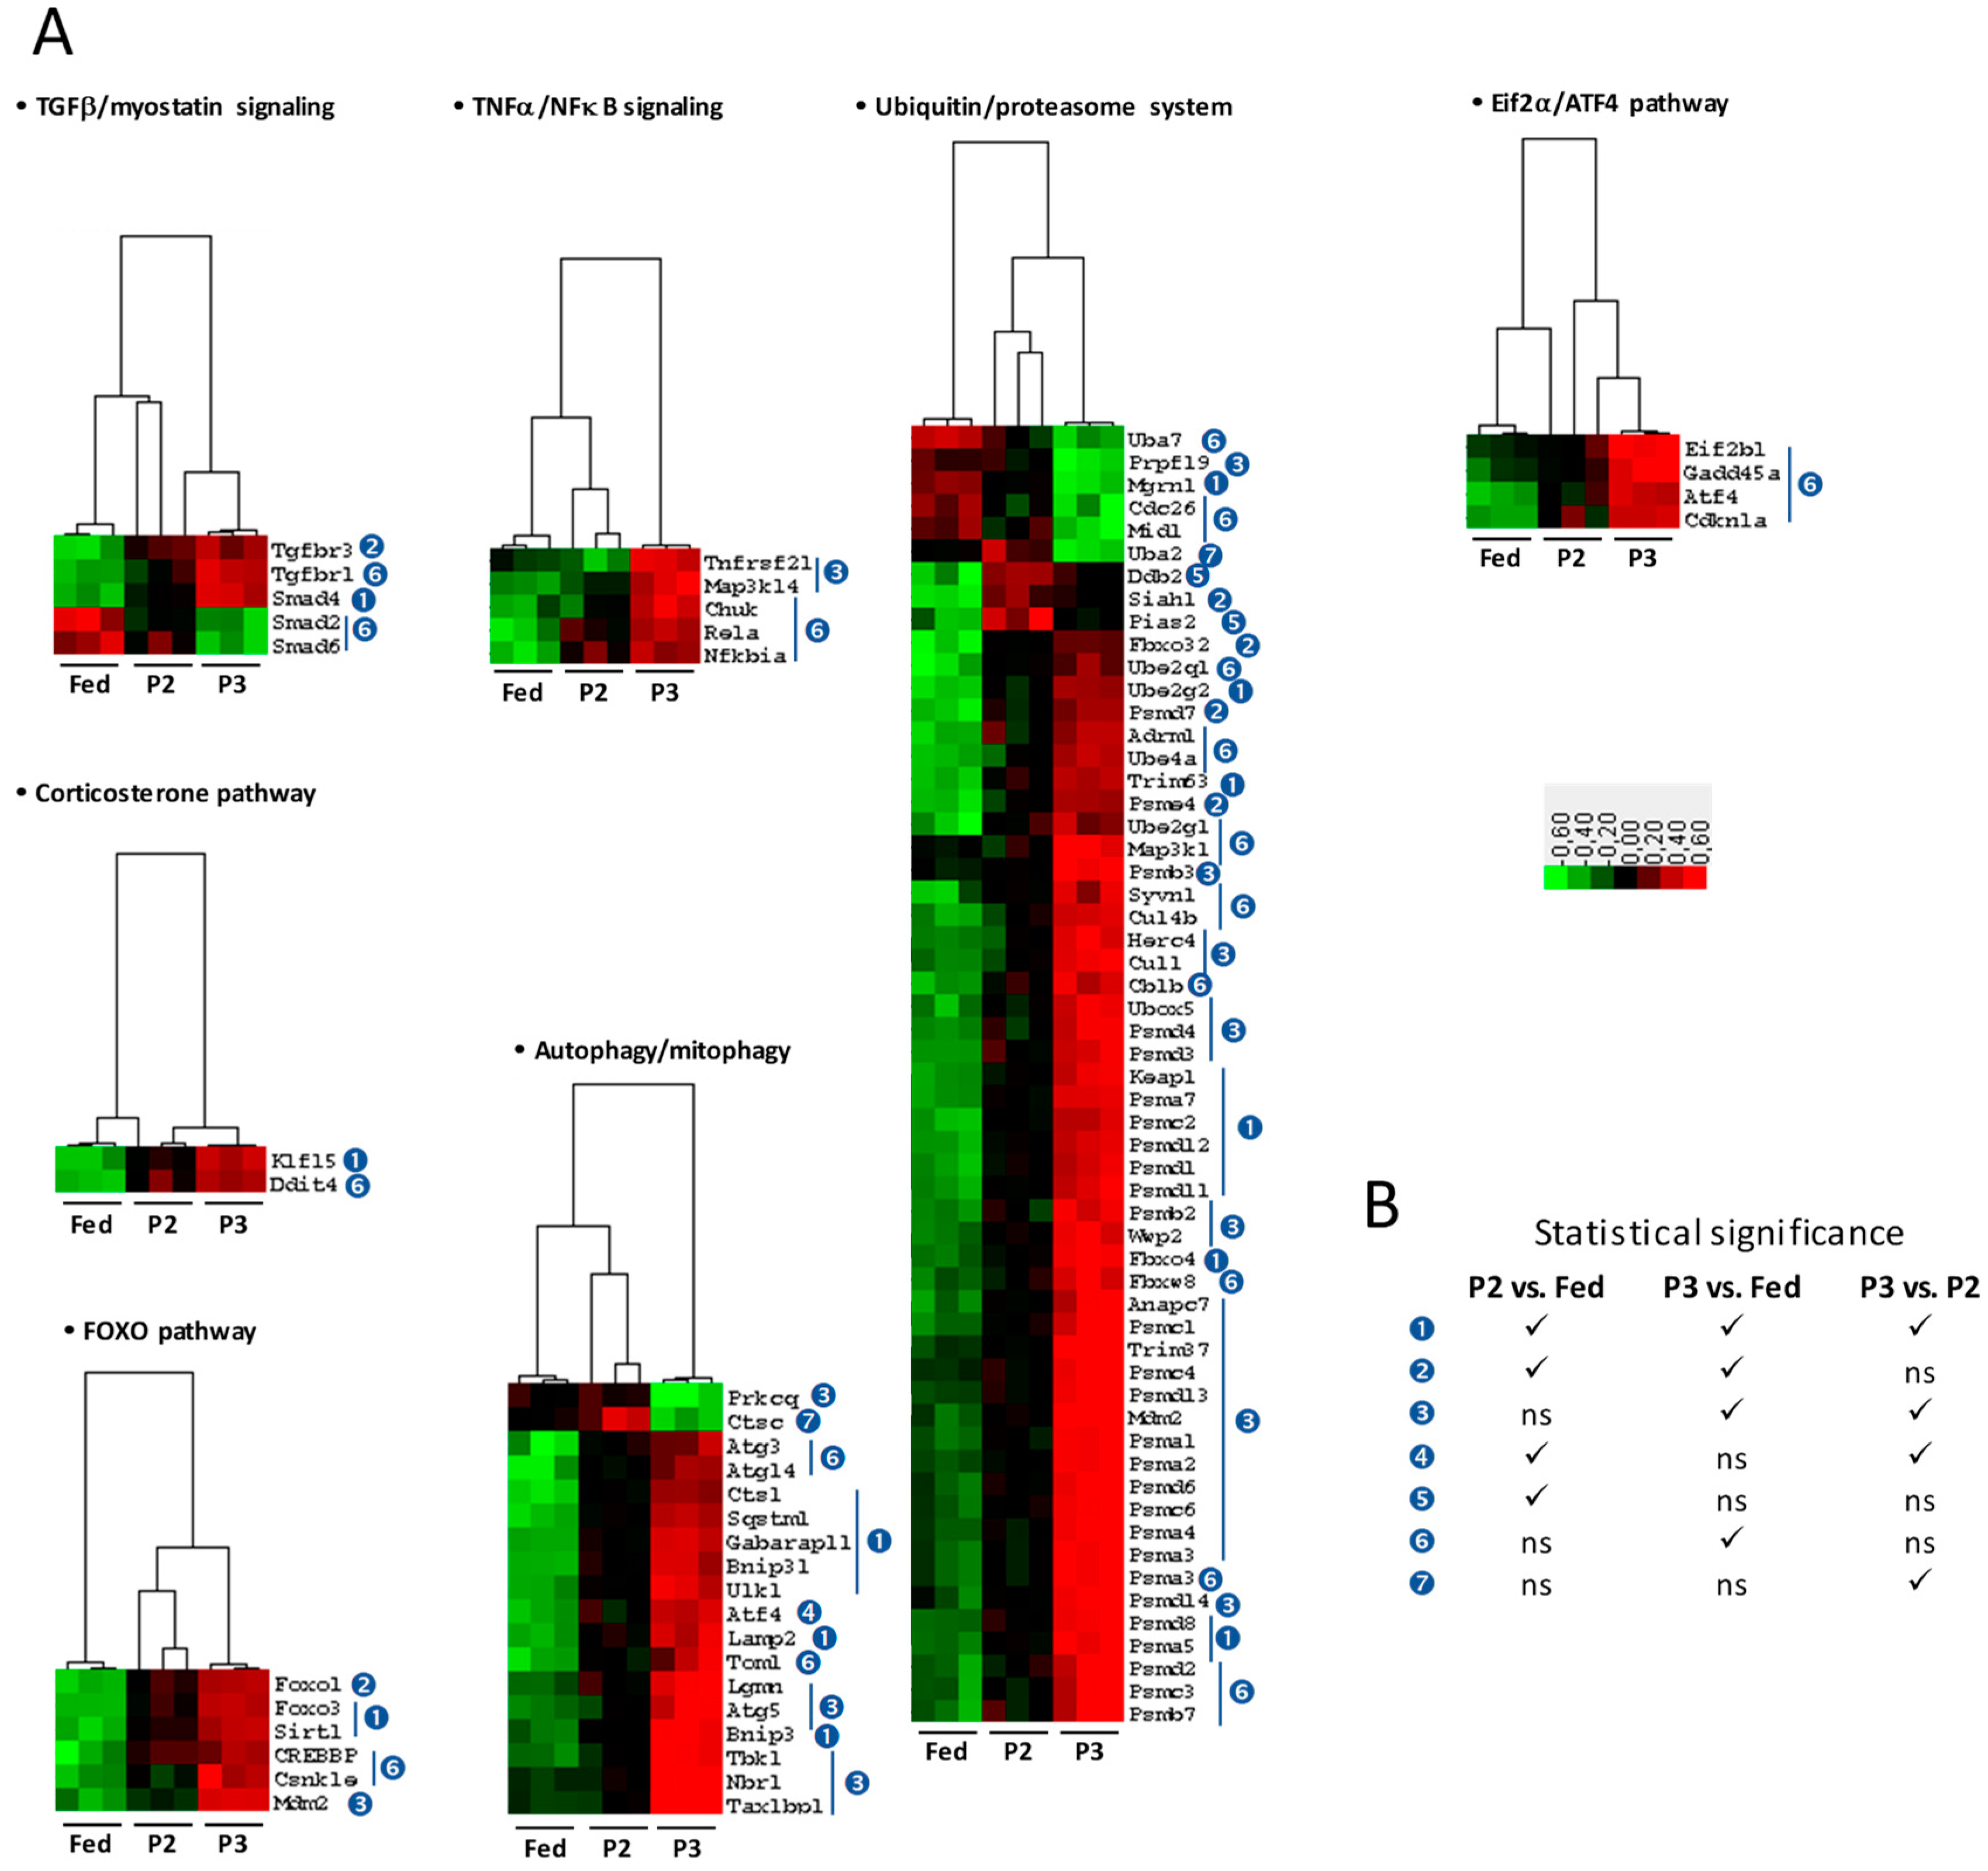
2.4. Changes in the TIB Transcriptome Related to Regulation of Muscle Protein Balance
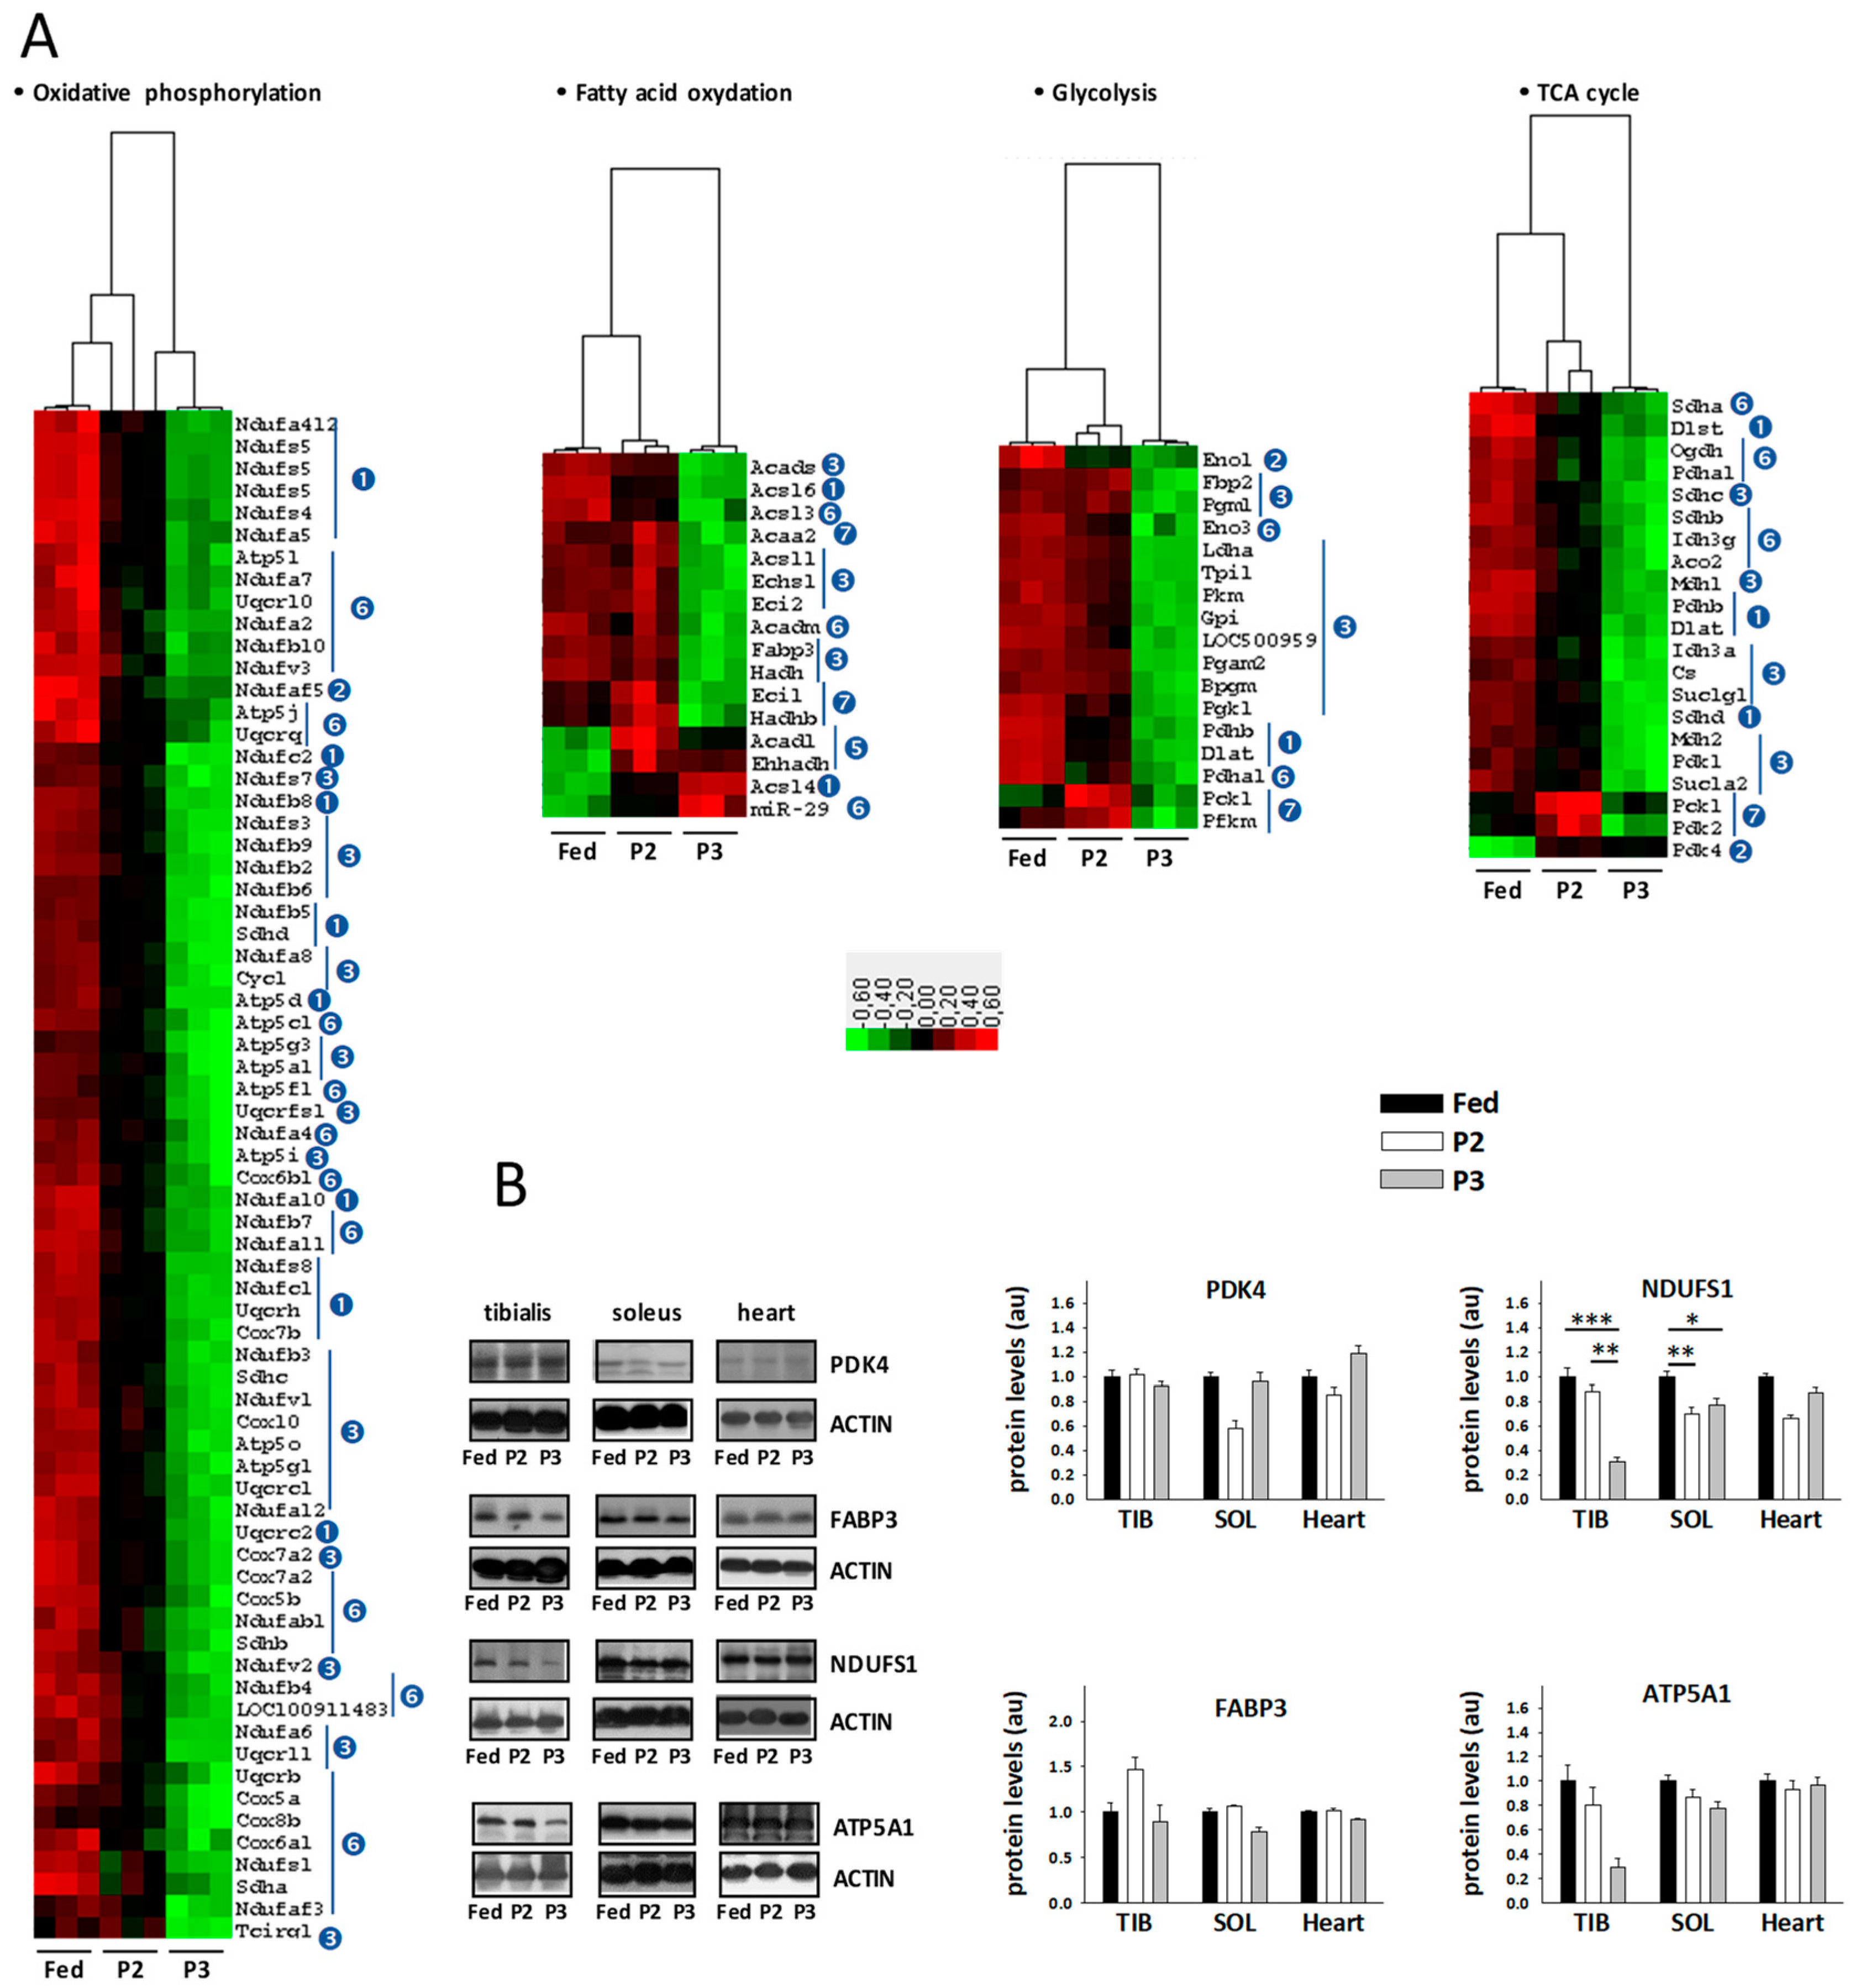
2.5. Changes in the TIB Muscle Transcriptome Related to Intermediary and Energy Metabolism
2.6. Changes in Sleletal Muscle Protein Levels in Response to Prolonged Fasting
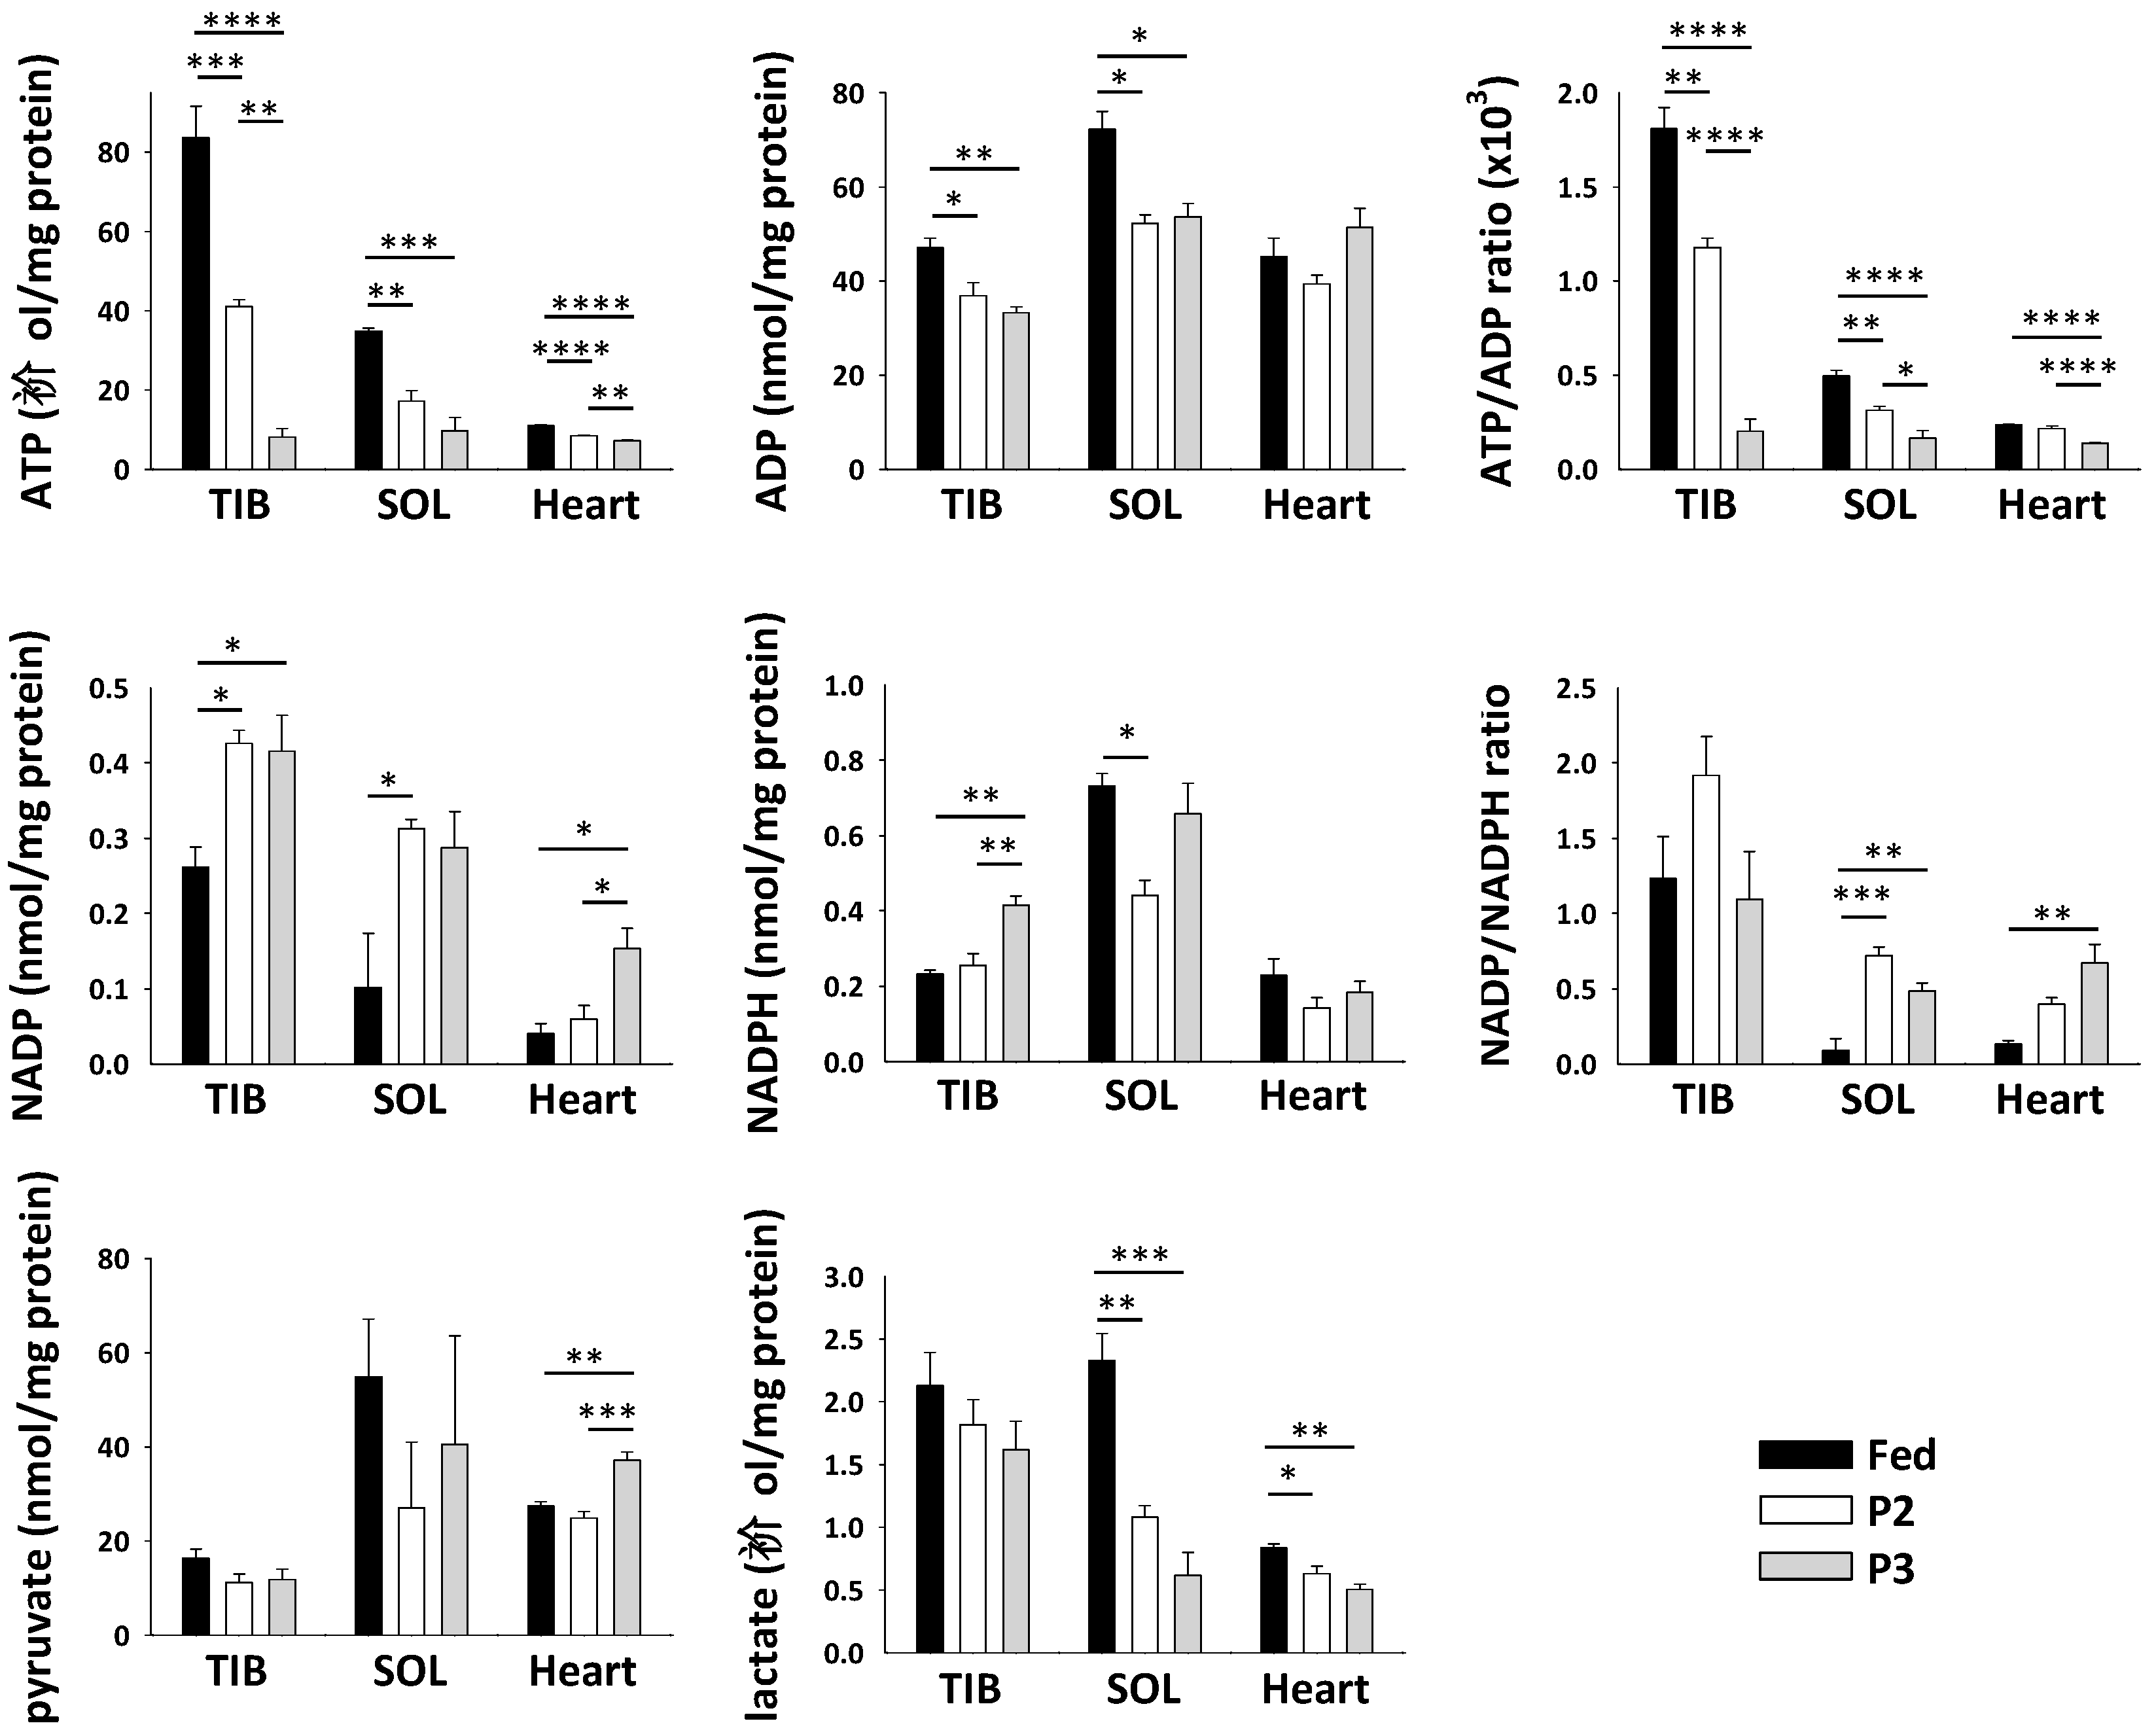
2.7. Changes in Skeletal Muscle Metabolite and Cofactor Levels in Response to Prolonged Fasting
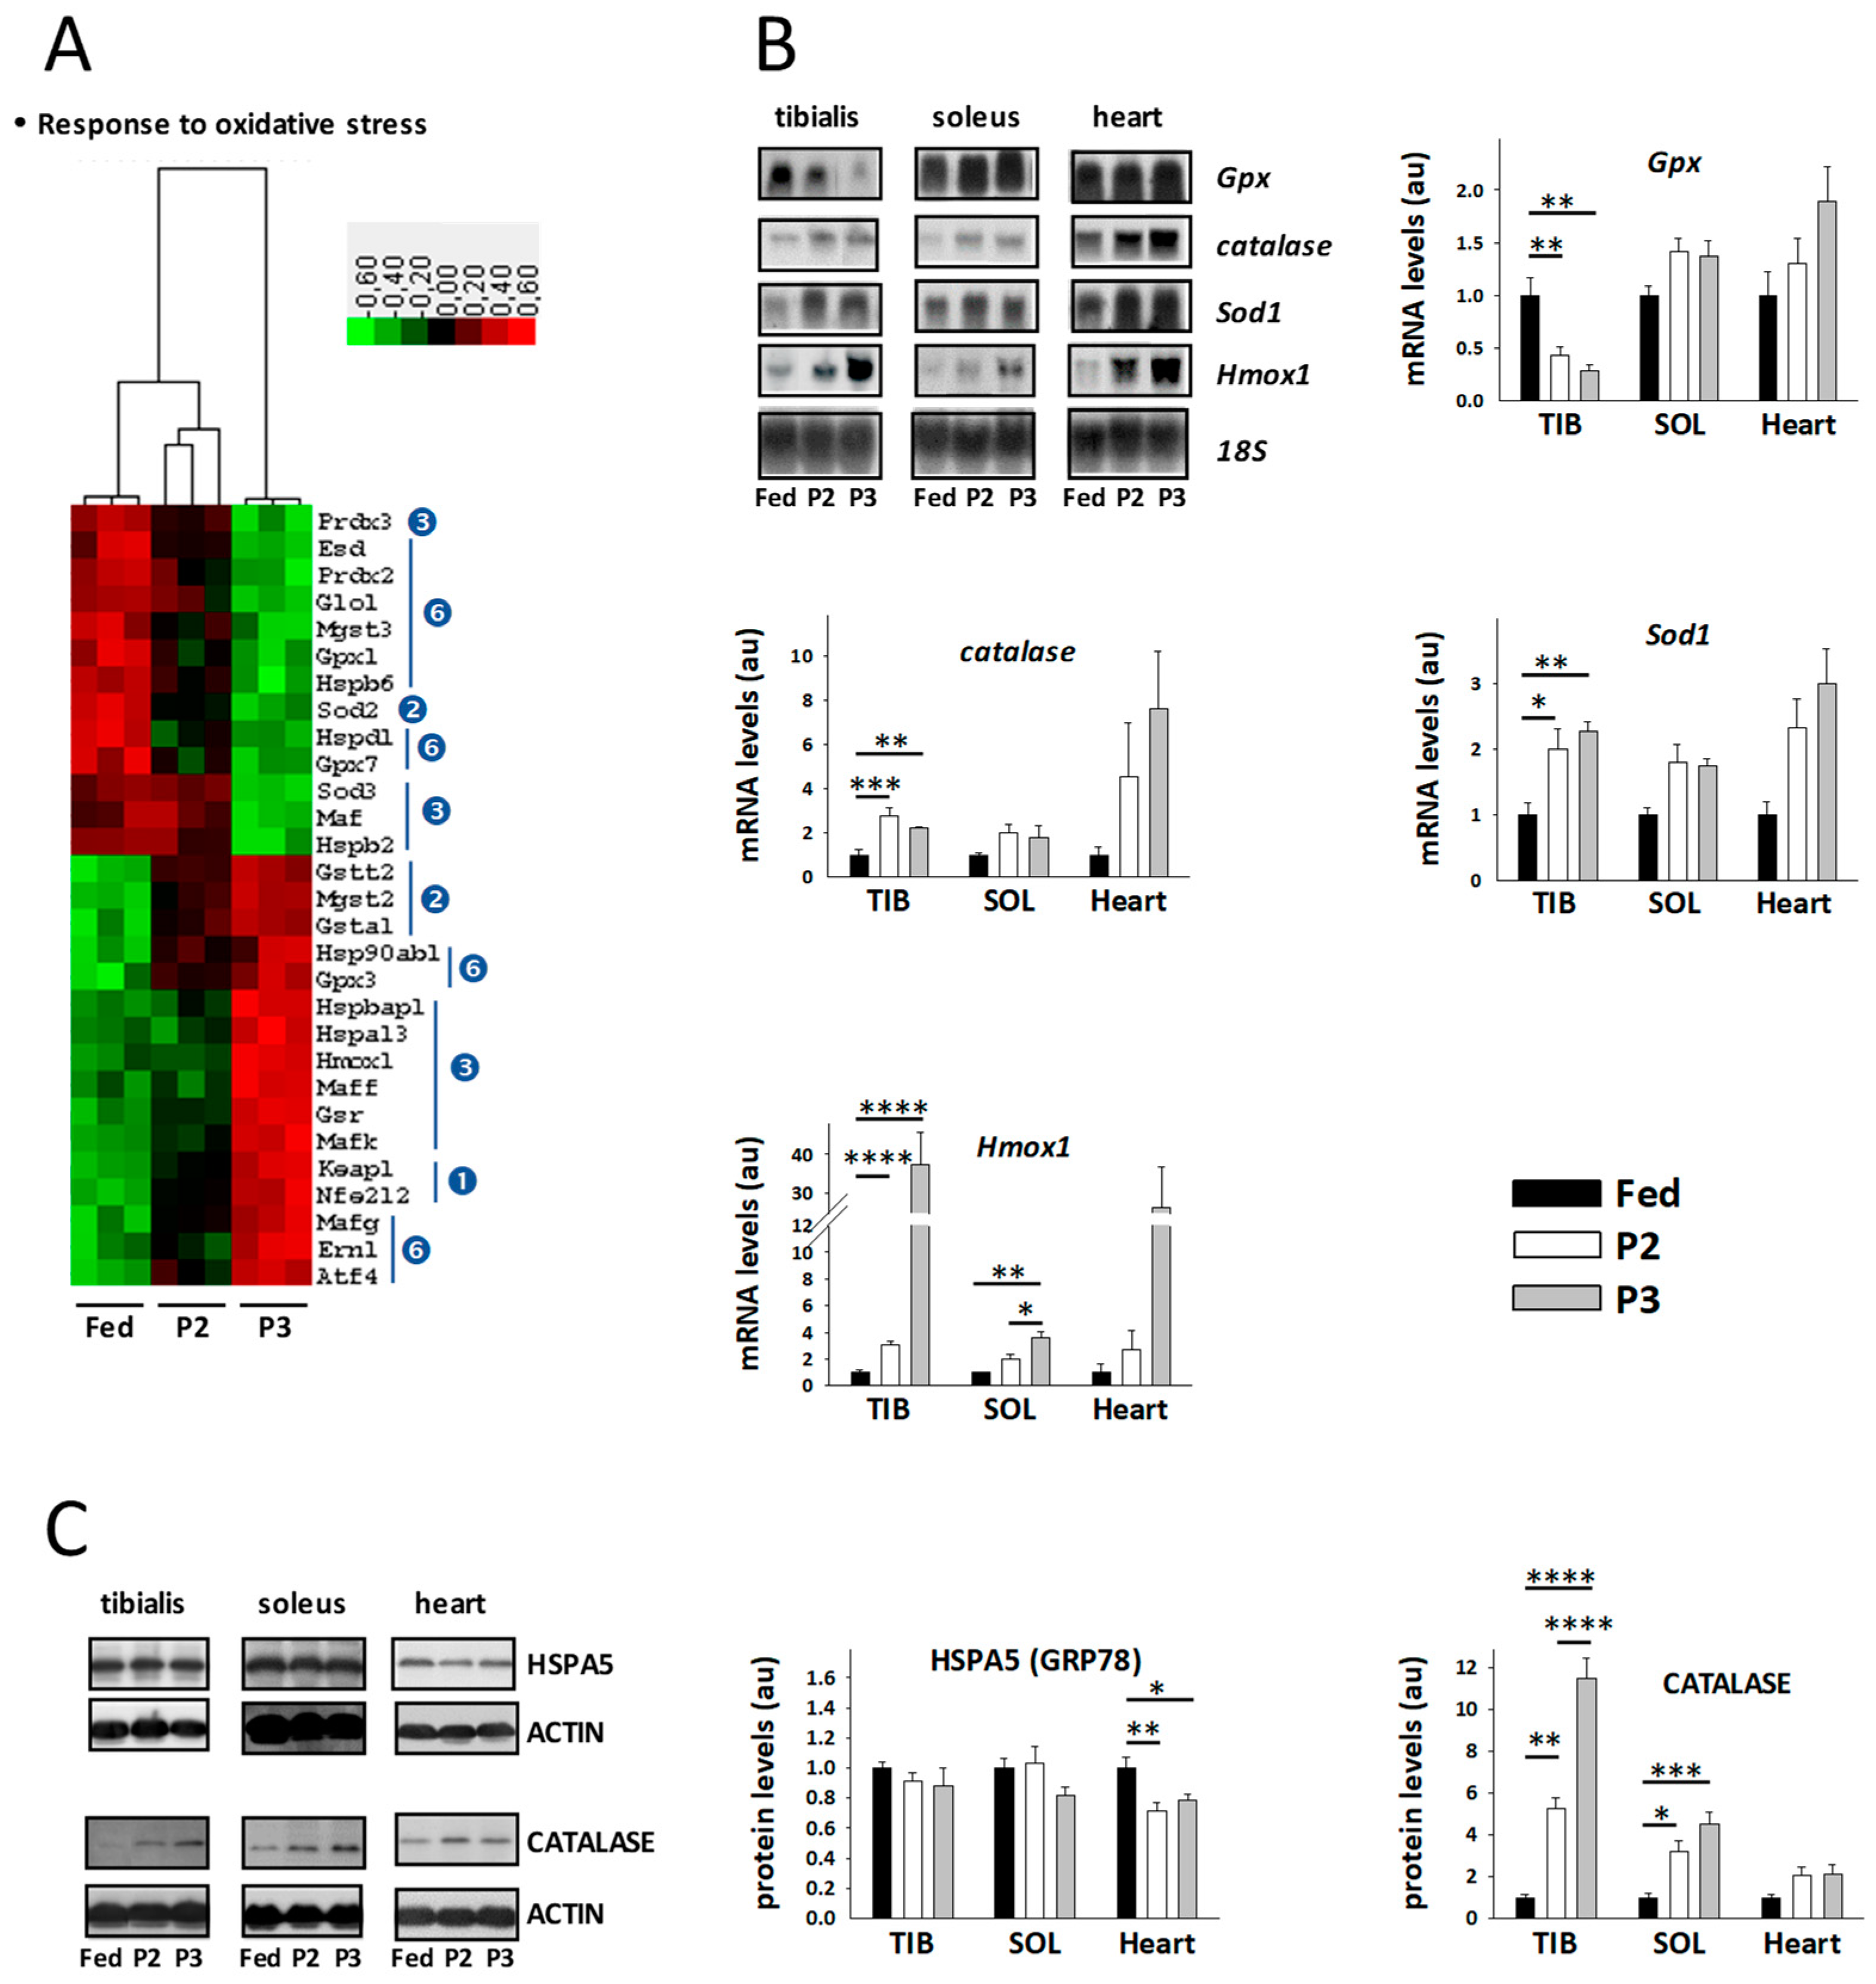
2.8. Changes in the TIB Muscle Transcriptome Related to Oxidative Stress
2.9. Changes in the TIB Muscle Transcriptome Related to Muscle Secretory Function
3. Discussion
3.1. Changes Related to Muscle Protein Degradation
3.2. Changes Related to Muscle Protein Synthesis
3.3. Changes Related to Muscle Energy Metabolism
3.4. Changes Related to Muscle Response to Oxidative Stress
3.5. Changes Related to Muscle Secretory Function
4. Materials and Methods
4.1. Ethical Statement
4.2. Animals and Study Design
4.3. Indirect Calorimetry Measurements
4.4. Plasma Metabolite and Hormone Assays
4.5. Muscle Metabolite and Cofactor Assays
4.6. Muscle Transcriptome Analysis
4.7. Muscle Western Blot Analyses
4.8. Bioinformatic Analysis
4.9. Statistical Analysis
5. Conclusions
Supplementary Materials
Author Contributions
Funding
Acknowledgments
Conflicts of Interest
Abbreviations
| ER | Endoplasmic reticulum |
| GO | Gene Ontology |
| miRNA | microRNA |
| NEFA | Non-esterified fatty acids |
| OXPHOS | Mitochondrial oxidative phosphorylation |
| P2 | Phase 2 of prolonged fasting |
| P3 | Phase 3 of prolonged fasting |
| ROS | Reactive oxygen species |
| RQ | Respiratory quotient |
| SOL | Soleus muscle |
| TCA | Tricarboxylic acid cycle |
| TIB | Tibialis anterior muscle |
References
- Wolfe, R.R. The underappreciated role of muscle in health and disease. Am. J. Clin. Nutr. 2006, 84, 475–482. [Google Scholar] [CrossRef] [PubMed]
- Deutz, N.E.P.; Ashurst, I.; Ballesteros, M.D.; Bear, D.E.; Cruz-Jentoft, A.J.; Genton, L.; Landi, F.; Laviano, A.; Norman, K.; Prado, C.M. The Underappreciated role of low muscle mass in the management of malnutrition. J. Am. Med. Dir. Assoc. 2019, 20, 22–27. [Google Scholar] [CrossRef] [PubMed] [Green Version]
- Hunt, A. Musculoskeletal fitness: The keystone in overall well-being and injury prevention. Clin. Orthop. Relat. Res. 2003, 409, 96–105. [Google Scholar] [CrossRef]
- McLeod, M.; Breen, L.; Hamilton, D.L.; Philp, A. Live strong and prosper: The importance of skeletal muscle strength for healthy ageing. Biogerontology 2016, 17, 497–510. [Google Scholar] [CrossRef] [PubMed] [Green Version]
- Janssen, I.; Heymsfield, S.B.; Wang, Z.M.; Ross, R. Skeletal muscle mass and distribution in 468 men and women aged 18–88 yr. J. Appl. Physiol. 2000, 89, 81–88. [Google Scholar] [CrossRef] [PubMed] [Green Version]
- Frontera, W.R.; Ochala, J. Skeletal muscle: A brief review of structure and function. Calcif. Tissue Int. 2015, 96, 183–195. [Google Scholar] [CrossRef] [PubMed]
- Ruderman, N.B. Muscle amino acid metabolism and gluconeogenesis. Ann. Rev. Med. 1975, 26, 245–258. [Google Scholar] [CrossRef] [PubMed]
- Fuller-Jackson, J.P.; Henry, B.A. Adipose and skeletal muscle thermogenesis: Studies from large animals. J. Endocrinol. 2018, 237, R99–R115. [Google Scholar] [CrossRef] [Green Version]
- Giudice, J.; Taylor, J.M. Muscle as a paracrine and endocrine organ. Curr. Opin. Pharmacol. 2017, 34, 49–55. [Google Scholar] [CrossRef]
- McCormick, R.; Vasilaki, A. Age-Related changes in skeletal muscle: Changes to life-style as a therapy. Biogerontology 2018, 19, 519–536. [Google Scholar] [CrossRef] [Green Version]
- Dodson, S.; Baracos, V.E.; Jatoi, A.; Evans, W.J.; Cella, D.; Dalton, J.T.; Steiner, M.S. Muscle wasting in cancer cachexia: Clinical implications, diagnosis, and emerging treatment strategies. Ann. Rev. Med. 2011, 62, 265–279. [Google Scholar] [CrossRef] [PubMed]
- Gao, Y.; Arfat, Y.; Wang, H.; Goswami, N. Muscle atrophy induced by mechanical unloading: Mechanisms and potential countermeasures. Front. Physiol. 2018, 9, 235. [Google Scholar] [CrossRef] [PubMed]
- Cherel, Y.; Attaix, D.; Rosolowska-Huszcz, D.; Belkhou, R.; Robin, J.P.; Arnal, M.; Le Maho, Y. Whole-Body and tissue protein synthesis during brief and prolonged fasting in the rat. Clin. Sci. (Lond.) 1991, 81, 611–619. [Google Scholar] [CrossRef] [PubMed] [Green Version]
- Lee, D.; Goldberg, A.L. Muscle wasting in fasting requires activation of NF-kappaB and inhibition of AKT/Mechanistic Target of Rapamycin (mTOR) by the protein acetylase, GCN5. J. Biol. Chem. 2015, 290, 30269–30279. [Google Scholar] [CrossRef] [PubMed] [Green Version]
- Bergouignan, A.; Rudwill, F.; Simon, C.; Blanc, S. Physical inactivity as the culprit of metabolic inflexibility: Evidence from bed-rest studies. J. Appl. Physiol. 2011, 111, 1201–1210. [Google Scholar] [CrossRef] [PubMed]
- Owen, O.E.; Smalley, K.J.; D’Alessio, D.A.; Mozzoli, M.A.; Dawson, E.K. Protein, fat, and carbohydrate requirements during starvation: Anaplerosis and cataplerosis. Am. J. Clin. Nutr. 1998, 68, 12–34. [Google Scholar] [CrossRef]
- Bertile, F.; Raclot, T. Proteomics can help to gain insights into metabolic disorders according to body reserve availability. Curr. Med. Chem. 2008, 15, 2545–2558. [Google Scholar] [CrossRef]
- Groscolas, R.; Robin, J.P. Long-term fasting and re-feeding in penguins. Comp. Biochem. Physiol. A Mol. Integr. Physiol. 2001, 128, 645–655. [Google Scholar] [CrossRef]
- Bertile, F.; Le Maho, Y.; Raclot, T. Coordinate upregulation of proteolytic-related genes in rat muscle during late fasting. Biochem. Biophys. Res. Commun. 2003, 311, 929–934. [Google Scholar] [CrossRef]
- Bertile, F.; Zahn, S.; Raclot, T. Phase- and tissue-specific heterogeneity in the expression of genes encoding components of proteolytic systems during fasting, refeeding, and after leptin treatment. In Messenger RNA Research Perspectives; Takeyama, T., Ed.; Nova Science Publishers: New York, NY, USA, 2007; pp. 95–113. ISBN 978-1600218149. [Google Scholar]
- Lowell, B.B.; Ruderman, N.B.; Goodman, M.N. Regulation of myofibrillar protein degradation in rat skeletal muscle during brief and prolonged starvation. Metabolism 1986, 35, 1121–1127. [Google Scholar] [CrossRef]
- Goodman, M.N.; McElaney, M.A.; Ruderman, N.B. Adaptation to prolonged starvation in the rat: Curtailment of skeletal muscle proteolysis. Am. J. Physiol. 1981, 241, E321–E327. [Google Scholar] [CrossRef] [PubMed]
- Belkhou, R.; Bechet, D.; Cherel, Y.; Galluser, M.; Ferrara, M.; le Maho, Y. Effect of fasting and thyroidectomy on cysteine proteinase activities in liver and muscle. Biochim. Biophys. Acta 1994, 1199, 195–201. [Google Scholar] [CrossRef]
- Bonaldo, P.; Sandri, M. Cellular and molecular mechanisms of muscle atrophy. Dis. Model. Mech. 2013, 6, 25–39. [Google Scholar] [CrossRef] [PubMed] [Green Version]
- Egerman, M.A.; Glass, D.J. Signaling pathways controlling skeletal muscle mass. Crit. Rev. Biochem. Mol. Biol. 2014, 49, 59–68. [Google Scholar] [CrossRef] [PubMed] [Green Version]
- Polge, C.; Heng, A.E.; Combaret, L.; Bechet, D.; Taillandier, D.; Attaix, D. Recent progress in elucidating signalling proteolytic pathways in muscle wasting: Potential clinical implications. Nutr. Metab. Cardiovasc. Dis. 2013, 23 (Suppl. 1), S1–S5. [Google Scholar] [CrossRef]
- McCarthy, J.J. The MyomiR network in skeletal muscle plasticity. Exerc. Sport Sci. Rev. 2011, 39, 150–154. [Google Scholar] [CrossRef]
- Koopman, R.; Ly, C.H.; Ryall, J.G. A metabolic link to skeletal muscle wasting and regeneration. Front. Physiol. 2014, 5, 32. [Google Scholar] [CrossRef]
- Gordon, B.S.; Kelleher, A.R.; Kimball, S.R. Regulation of muscle protein synthesis and the effects of catabolic states. Int. J. Biochem. Cell Biol. 2013, 45, 2147–2157. [Google Scholar] [CrossRef] [Green Version]
- Baghdadi, M.B.; Tajbakhsh, S. Regulation and phylogeny of skeletal muscle regeneration. Dev. Biol. 2018, 433, 200–209. [Google Scholar] [CrossRef]
- Cherel, Y.; Le Maho, Y. Refeeding after the late increase in nitrogen excretion during prolonged fasting in the rat. Physiol. Behav. 1991, 50, 345–349. [Google Scholar] [CrossRef]
- Wasselin, T.; Zahn, S.; Maho, Y.L.; Dorsselaer, A.V.; Raclot, T.; Bertile, F. Exacerbated oxidative stress in the fasting liver according to fuel partitioning. Proteomics 2014, 14, 1905–1921. [Google Scholar] [CrossRef] [PubMed]
- Ibrahim, M.; Ayoub, D.; Wasselin, T.; Van Dorsselaer, A.; Le Maho, Y.; Raclot, T.; Bertile, F. Alterations in rat adipose tissue transcriptome and proteome in response to prolonged fasting. Biol. Chem. 2020, 401, 389–405. [Google Scholar] [CrossRef] [PubMed] [Green Version]
- Cherel, Y.; Robin, J.P.; Heitz, A.; Calgari, C.; Le Maho, Y. Relationships between lipid availability and protein utilization during prolonged fasting. J. Comp. Physiol. B 1992, 162, 305–313. [Google Scholar] [CrossRef] [PubMed]
- Lowell, B.B.; Goodman, M.N. Protein sparing in skeletal muscle during prolonged starvation. Dependence on lipid fuel availability. Diabetes 1987, 36, 14–19. [Google Scholar] [CrossRef]
- Norrelund, H.; Nair, K.S.; Nielsen, S.; Frystyk, J.; Ivarsen, P.; Jorgensen, J.O.; Christiansen, J.S.; Moller, N. The decisive role of free fatty acids for protein conservation during fasting in humans with and without growth hormone. J. Clin. Endocrinol. Metab. 2003, 88, 4371–4378. [Google Scholar] [CrossRef] [Green Version]
- Lipina, C.; Hundal, H.S. Lipid modulation of skeletal muscle mass and function. J. Cachexia Sarcopenia Muscle 2017, 8, 190–201. [Google Scholar] [CrossRef] [Green Version]
- Duan, Y.; Li, F.; Li, Y.; Tang, Y.; Kong, X.; Feng, Z.; Anthony, T.G.; Watford, M.; Hou, Y.; Wu, G.; et al. The role of leucine and its metabolites in protein and energy metabolism. Amino Acids 2016, 48, 41–51. [Google Scholar] [CrossRef]
- Abrigo, J.; Simon, F.; Cabrera, D.; Cordova, G.; Trollet, C.; Cabello-Verrugio, C. Central role of transforming growth factor type Beta 1 in skeletal muscle dysfunctions: An update on therapeutic strategies. Curr. Protein Pept. Sci. 2018, 19, 1189–1200. [Google Scholar] [CrossRef]
- Paul, P.K.; Gupta, S.K.; Bhatnagar, S.; Panguluri, S.K.; Darnay, B.G.; Choi, Y.; Kumar, A. Targeted ablation of TRAF6 inhibits skeletal muscle wasting in mice. J. Cell Biol. 2010, 191, 1395–1411. [Google Scholar] [CrossRef] [Green Version]
- Elkina, Y.; von Haehling, S.; Anker, S.D.; Springer, J. The role of myostatin in muscle wasting: An overview. J. Cachexia Sarcopenia Muscle 2011, 2, 143–151. [Google Scholar] [CrossRef] [Green Version]
- Rodriguez, J.; Vernus, B.; Chelh, I.; Cassar-Malek, I.; Gabillard, J.C.; Hadj Sassi, A.; Seiliez, I.; Picard, B.; Bonnieu, A. Myostatin and the skeletal muscle atrophy and hypertrophy signaling pathways. Cell. Mol. Life Sci. 2014, 71, 4361–4371. [Google Scholar] [CrossRef] [PubMed]
- Bloise, E.; Ciarmela, P.; Dela Cruz, C.; Luisi, S.; Petraglia, F.; Reis, F.M. Activin A in mammalian physiology. Physiol. Rev. 2019, 99, 739–780. [Google Scholar] [CrossRef] [PubMed]
- Thoma, A.; Lightfoot, A.P. NF-kB and inflammatory Cytokine signalling: Role in skeletal muscle atrophy. Adv. Exp. Med. Biol. 2018, 1088, 267–279. [Google Scholar] [CrossRef] [PubMed]
- Salminen, A.; Hyttinen, J.M.; Kauppinen, A.; Kaarniranta, K. Context-Dependent regulation of autophagy by IKK-NF-kappaB signaling: Impact on the aging process. Int. J. Cell Biol. 2012, 2012, 849541. [Google Scholar] [CrossRef] [PubMed] [Green Version]
- Schiaffino, S.; Dyar, K.A.; Ciciliot, S.; Blaauw, B.; Sandri, M. Mechanisms regulating skeletal muscle growth and atrophy. FEBS J. 2013, 280, 4294–4314. [Google Scholar] [CrossRef]
- Sanchez, A.M.; Candau, R.B.; Bernardi, H. FoxO transcription factors: Their roles in the maintenance of skeletal muscle homeostasis. Cell. Mol. Life Sci. 2014, 71, 1657–1671. [Google Scholar] [CrossRef]
- Milan, G.; Romanello, V.; Pescatore, F.; Armani, A.; Paik, J.H.; Frasson, L.; Seydel, A.; Zhao, J.; Abraham, R.; Goldberg, A.L.; et al. Regulation of autophagy and the ubiquitin-proteasome system by the FoxO transcriptional network during muscle atrophy. Nat. Commun. 2015, 6, 6670. [Google Scholar] [CrossRef] [Green Version]
- Zhao, J.; Brault, J.J.; Schild, A.; Goldberg, A.L. Coordinate activation of autophagy and the proteasome pathway by FoxO transcription factor. Autophagy 2008, 4, 378–380. [Google Scholar] [CrossRef] [Green Version]
- Caron, A.Z.; Haroun, S.; Leblanc, E.; Trensz, F.; Guindi, C.; Amrani, A.; Grenier, G. The proteasome inhibitor MG132 reduces immobilization-induced skeletal muscle atrophy in mice. BMC Musculoskelet. Disord. 2011, 12, 185. [Google Scholar] [CrossRef] [Green Version]
- Lee, D.; Takayama, S.; Goldberg, A.L. ZFAND5/ZNF216 is an activator of the 26S proteasome that stimulates overall protein degradation. Proc. Natl. Acad. Sci. USA 2018, 115, E9550–E9559. [Google Scholar] [CrossRef] [Green Version]
- Adams, C.M.; Ebert, S.M.; Dyle, M.C. Role of ATF4 in skeletal muscle atrophy. Curr. Opin. Clin. Nutr. Metab. Care 2017, 20, 164–168. [Google Scholar] [CrossRef]
- Luhr, M.; Torgersen, M.L.; Szalai, P.; Hashim, A.; Brech, A.; Staerk, J.; Engedal, N. The kinase PERK and the transcription factor ATF4 play distinct and essential roles in autophagy resulting from tunicamycin-induced ER stress. J. Biol. Chem. 2019, 294, 8197–8217. [Google Scholar] [CrossRef] [PubMed]
- Hu, S.; Guo, Y.; Wang, Y.; Li, Y.; Fu, T.; Zhou, Z.; Wang, Y.; Liu, J.; Pan, L. Structure of Myosin VI/Tom1 complex reveals a cargo recognition mode of Myosin VI for tethering. Nat. Commun. 2019, 10, 3459. [Google Scholar] [CrossRef] [PubMed] [Green Version]
- Li, J.B.; Higgins, J.E.; Jefferson, L.S. Changes in protein turnover in skeletal muscle in response to fasting. Am. J. Physiol. 1979, 236, E222–E228. [Google Scholar] [CrossRef] [PubMed]
- Rahmani, J.; Kord Varkaneh, H.; Clark, C.; Zand, H.; Bawadi, H.; Ryan, P.M.; Fatahi, S.; Zhang, Y. The influence of fasting and energy restricting diets on IGF-1 levels in humans: A systematic review and meta-analysis. Ageing Res. Rev. 2019, 53, 100910. [Google Scholar] [CrossRef] [PubMed]
- Kirby, T.J.; Chaillou, T.; McCarthy, J.J. The role of microRNAs in skeletal muscle health and disease. Front. Biosci. (Landmark Ed.) 2015, 20, 37–77. [Google Scholar] [CrossRef] [Green Version]
- Pawlikowski, B.; Vogler, T.O.; Gadek, K.; Olwin, B.B. Regulation of skeletal muscle stem cells by fibroblast growth factors. Dev. Dyn. 2017, 246, 359–367. [Google Scholar] [CrossRef] [Green Version]
- Li, J.; Chan, M.C.; Yu, Y.; Bei, Y.; Chen, P.; Zhou, Q.; Cheng, L.; Chen, L.; Ziegler, O.; Rowe, G.C.; et al. miR-29b contributes to multiple types of muscle atrophy. Nat. Commun. 2017, 8, 15201. [Google Scholar] [CrossRef] [Green Version]
- Aoyama, S.; Shibata, S. The role of circadian rhythms in muscular and osseous physiology and their regulation by nutrition and exercise. Front. Neurosci. 2017, 11, 63. [Google Scholar] [CrossRef] [Green Version]
- Vitale, J.A.; Bonato, M.; La Torre, A.; Banfi, G. The role of the molecular clock in promoting skeletal muscle growth and protecting against sarcopenia. Int. J. Mol. Sci. 2019, 20, 4318. [Google Scholar] [CrossRef] [Green Version]
- Kawamoto, T.; Noshiro, M.; Sato, F.; Maemura, K.; Takeda, N.; Nagai, R.; Iwata, T.; Fujimoto, K.; Furukawa, M.; Miyazaki, K.; et al. A novel autofeedback loop of Dec1 transcription involved in circadian rhythm regulation. Biochem. Biophys. Res. Commun. 2004, 313, 117–124. [Google Scholar] [CrossRef] [PubMed]
- Kawamoto, T.; Noshiro, M.; Furukawa, M.; Honda, K.K.; Nakashima, A.; Ueshima, T.; Usui, E.; Katsura, Y.; Fujimoto, K.; Honma, S.; et al. Effects of fasting and re-feeding on the expression of Dec1, Per1, and other clock-related genes. J. Biochem. 2006, 140, 401–408. [Google Scholar] [CrossRef] [PubMed]
- Huang, Y.; Lai, X.; Hu, L.; Lei, C.; Lan, X.; Zhang, C.; Ma, Y.; Zheng, L.; Bai, Y.Y.; Lin, F.; et al. Over-Expression of DEC1 inhibits myogenic differentiation by modulating MyoG activity in bovine satellite cell. J. Cell. Physiol. 2018, 233, 9365–9374. [Google Scholar] [CrossRef]
- Ramanathan, C.; Kathale, N.D.; Liu, D.; Lee, C.; Freeman, D.A.; Hogenesch, J.B.; Cao, R.; Liu, A.C. mTOR signaling regulates central and peripheral circadian clock function. PLoS Genet. 2018, 14, e1007369. [Google Scholar] [CrossRef] [PubMed]
- Wu, R.; Dang, F.; Li, P.; Wang, P.; Xu, Q.; Liu, Z.; Li, Y.; Wu, Y.; Chen, Y.; Liu, Y. The circadian protein Period2 suppresses mTORC1 activity via recruiting Tsc1 to mTORC1 complex. Cell Metab. 2019, 29, 653–667. [Google Scholar] [CrossRef] [Green Version]
- Dubois, V.; Laurent, M.; Boonen, S.; Vanderschueren, D.; Claessens, F. Androgens and skeletal muscle: Cellular and molecular action mechanisms underlying the anabolic actions. Cell. Mol. Life Sci. 2012, 69, 1651–1667. [Google Scholar] [CrossRef]
- Carriere, A.; Ray, H.; Blenis, J.; Roux, P.P. The RSK factors of activating the Ras/MAPK signaling cascade. Front. Biosci. 2008, 13, 4258–4275. [Google Scholar] [CrossRef]
- Bayascas, J.R. PDK1: The major transducer of PI 3-kinase actions. Curr. Top. Microbiol. Immunol. 2010, 346, 9–29. [Google Scholar] [CrossRef]
- Priesnitz, C.; Becker, T. Pathways to balance mitochondrial translation and protein import. Genes Dev. 2018, 32, 1285–1296. [Google Scholar] [CrossRef]
- Dennerlein, S.; Wang, C.; Rehling, P. Plasticity of mitochondrial translation. Trends Cell Biol. 2017, 27, 712–721. [Google Scholar] [CrossRef]
- Bertile, F.; Fouillen, L.; Wasselin, T.; Maes, P.; Le Maho, Y.; Van Dorsselaer, A.; Raclot, T. The safety limits of an extended fast: Lessons from a non-model organism. Sci. Rep. 2016, 6, 39008. [Google Scholar] [CrossRef] [PubMed] [Green Version]
- Habold, C.; Chevalier, C.; Dunel-Erb, S.; Foltzer-Jourdainne, C.; LeMaho, Y.; Lignot, J.H. Effects of fasting and refeeding on jejunal morphology and cellular activity in rats in relation to depletion of body stores. Scand. J. Gastroenterol. 2004, 39, 531–539. [Google Scholar] [CrossRef] [PubMed]
- Koubi, H.E.; Robin, J.P.; Dewasmes, G.; Le Maho, Y.; Frutoso, J.; Minaire, Y. Fasting-Induced rise in locomotor activity in rats coincides with increased protein utilization. Physiol. Behav. 1991, 50, 337–343. [Google Scholar] [CrossRef]
- Bertile, F.; Raclot, T. ATGL and HSL are not coordinately regulated in response to fuel partitioning in fasted rats. J. Nutr. Biochem. 2011, 22, 372–379. [Google Scholar] [CrossRef] [PubMed]
- Camera, D.M.; Smiles, W.J.; Hawley, J.A. Exercise-Induced skeletal muscle signaling pathways and human athletic performance. Free Radic. Biol. Med. 2016, 98, 131–143. [Google Scholar] [CrossRef]
- Lee, M.N.; Ha, S.H.; Kim, J.; Koh, A.; Lee, C.S.; Kim, J.H.; Jeon, H.; Kim, D.H.; Suh, P.G.; Ryu, S.H. Glycolytic flux signals to mTOR through glyceraldehyde-3-phosphate dehydrogenase-mediated regulation of Rheb. Mol. Cell. Biol. 2009, 29, 3991–4001. [Google Scholar] [CrossRef] [Green Version]
- Wu, P.; Wang, Q.; Jiang, C.; Chen, C.H.; Liu, Y.; Chen, Y.; Zeng, Y. MicroRNA-29a is involved in lipid metabolism dysfunction and insulin resistance in C2C12 myotubes by targeting PPARδ. Mol. Med. Rep. 2018, 17, 8493–8501. [Google Scholar] [CrossRef]
- Ying, W. NAD+/NADH and NADP+/NADPH in cellular functions and cell death: Regulation and biological consequences. Antioxid. Redox Signal. 2008, 10, 179–206. [Google Scholar] [CrossRef] [Green Version]
- Zurlo, F.; Nemeth, P.M.; Choksi, R.M.; Sesodia, S.; Ravussin, E. Whole-Body energy metabolism and skeletal muscle biochemical characteristics. Metabolism 1994, 43, 481–486. [Google Scholar] [CrossRef]
- Canto, C.; Jiang, L.Q.; Deshmukh, A.S.; Mataki, C.; Coste, A.; Lagouge, M.; Zierath, J.R.; Auwerx, J. Interdependence of AMPK and SIRT1 for metabolic adaptation to fasting and exercise in skeletal muscle. Cell Metab. 2010, 11, 213–219. [Google Scholar] [CrossRef] [Green Version]
- Herzig, S.; Shaw, R.J. AMPK: Guardian of metabolism and mitochondrial homeostasis. Nat. Rev. Mol. Cell Biol. 2018, 19, 121–135. [Google Scholar] [CrossRef] [PubMed] [Green Version]
- Thomson, D.M. The role of AMPK in the regulation of skeletal muscle size, hypertrophy, and regeneration. Int. J. Mol. Sci. 2018, 19, 3125. [Google Scholar] [CrossRef] [PubMed] [Green Version]
- Powers, S.K.; Morton, A.B.; Ahn, B.; Smuder, A.J. Redox control of skeletal muscle atrophy. Free Radic. Biol. Med. 2016, 98, 208–217. [Google Scholar] [CrossRef] [PubMed] [Green Version]
- Sies, H.; Berndt, C.; Jones, D.P. Oxidative stress. Ann. Rev. Biochem. 2017, 86, 715–748. [Google Scholar] [CrossRef] [PubMed]
- Qiu, J.; Fang, Q.; Xu, T.; Wu, C.; Xu, L.; Wang, L.; Yang, X.; Yu, S.; Zhang, Q.; Ding, F.; et al. Mechanistic role of reactive oxygen species and therapeutic potential of antioxidants in denervation-or fasting-induced skeletal muscle atrophy. Front. Physiol. 2018, 9, 215. [Google Scholar] [CrossRef] [Green Version]
- Brand, M.D. Mitochondrial generation of superoxide and hydrogen peroxide as the source of mitochondrial redox signaling. Free Radic. Biol. Med. 2016, 100, 14–31. [Google Scholar] [CrossRef]
- Lushchak, V.I. Glutathione homeostasis and functions: Potential targets for medical interventions. J. Amino Acids 2012, 2012, 736837. [Google Scholar] [CrossRef] [Green Version]
- Kalmar, B.; Greensmith, L. Induction of heat shock proteins for protection against oxidative stress. Adv. Drug Deliv. Rev. 2009, 61, 310–318. [Google Scholar] [CrossRef]
- Tonelli, C.; Chio, I.I.C.; Tuveson, D.A. Transcriptional regulation by Nrf2. Antioxid. Redox Signal. 2018, 29, 1727–1745. [Google Scholar] [CrossRef] [Green Version]
- Dhakshinamoorthy, S.; Jaiswal, A.K. c-Maf negatively regulates ARE-mediated detoxifying enzyme genes expression and anti-oxidant induction. Oncogene 2002, 21, 5301–5312. [Google Scholar] [CrossRef] [Green Version]
- Sarcinelli, C.; Dragic, H.; Piecyk, M.; Barbet, V.; Duret, C.; Barthelaix, A.; Ferraro-Peyret, C.; Fauvre, J.; Renno, T.; Chaveroux, C.; et al. ATF4-Dependent NRF2 transcriptional regulation promotes antioxidant protection during endoplasmic reticulum stress. Cancers 2020, 12, 569. [Google Scholar] [CrossRef] [PubMed] [Green Version]
- Xu, C.; Bailly-Maitre, B.; Reed, J.C. Endoplasmic reticulum stress: Cell life and death decisions. J. Clin. Investig. 2005, 115, 2656–2664. [Google Scholar] [CrossRef] [PubMed] [Green Version]
- Lee, J.H.; Jun, H.-S. Role of Myokines in regulating skeletal mass and function. Front. Physiol. 2019, 10, 42. [Google Scholar] [CrossRef] [PubMed]
- Laurens, C.; Bergouignan, A.; Moro, C. Exercise-Released myokines in the control of energy metabolism. Front. Physiol. 2020, 11, 91. [Google Scholar] [CrossRef]
- Nishizawa, H.; Matsuda, M.; Yamada, Y.; Kawai, K.; Suzuki, E.; Makishima, M.; Kitamura, T.; Shimomura, I. Musclin, a novel skeletal muscle-derived secretory factor. J. Biol. Chem. 2004, 279, 19391–19395. [Google Scholar] [CrossRef] [Green Version]
- Walsh, J.J.; Edgett, B.A.; Tschakovsky, M.E.; Gurd, B.J. Fasting and exercise differentially regulate BDNF mRNA expression in human skeletal muscle. Appl. Physiol. Nutr. Metab. 2015, 40, 96–98. [Google Scholar] [CrossRef]
- Jia, W.-H.; Wang, N.-Q.; Yin, L.; Chen, X.; Hou, B.-Y.; Qiang, G.-F.; Chan, C.B.; Yang, X.-Y.; Du, G.-H. Effect of skeletal muscle phenotype and gender on fasting-induced myokines expression in mice. Biochem. Biophys. Res. Commun. 2019, 514, 407–414. [Google Scholar] [CrossRef]
- Bertile, F.; Schaeffer, C.; Le Maho, Y.; Raclot, T.; Van Dorsselaer, A. A proteomic approach to identify differentially expressed plasma proteins between the fed and prolonged fasted states. Proteomics 2009, 9, 148–158. [Google Scholar] [CrossRef]
- de Hoon, M.J.; Imoto, S.; Nolan, J.; Miyano, S. Open source clustering software. Bioinformatics 2004, 20, 1453–1454. [Google Scholar] [CrossRef] [Green Version]
- R Core Team. R: A Language and Environment for Statistical Computing; R Foundation for Statistical Computing: Vienna, Austria, 2017. [Google Scholar]
- Giordani, L.; He, G.J.; Negroni, E.; Sakai, H.; Law, J.Y.C.; Siu, M.M.; Wan, R.; Comeau, A.; Tajbakhsh, S.; Cheung, T.H.; et al. High-Dimensional single-cell cartography reveals novel skeletal muscle-resident cell populations. Mol. Cell 2019, 74, 609–621. [Google Scholar] [CrossRef]


| State | Fed | P2 | P3 |
|---|---|---|---|
| Main Fuels | Mix * | Lipids | Proteins |
| Rat profiles | |||
| Duration of fasting (days) | - | 5.6 ± 0.4 | 7.8 ± 0.5 ◊ |
| Initial body mass (g) | 344.5 ± 1.6 | 347.7 ± 2.2 | 346.4 ± 2.4 |
| Final body mass (g) | 344.5 ± 1.6 | 268.5 ± 1.7 # | 225.0 ± 2.0 # ◊ |
| Body mass loss (%) | - | 22.7 ± 0.4 | 35.0 ± 0.3 ◊ |
| dm/m.dt (g.100−1.d−1) | - | 3.7 ± 0.3 | 7.6 ± 0.3 ◊ |
| VO2 (mL O2.min−1.(kg0.67)−1) | 18.95 ± 0.02 | 14.82 ± 0.7 # | 14.44 ± 0.8 # |
| Respiratory quotient (RQ) | 0.92 ± 0.01 | 0.69 ± 0.01 | 0.75 ± 0.01 |
| Plasma | |||
| NEFA (mM) | 0.57 ± 0.04 | 0.78 ± 0.03 # | 0.19 ± 0.02 # ◊ |
| Urea (mg.dL−1) | 21.4 ± 1.1 | 16.0 ± 1.1 | 44.4 ± 3.1 # ◊ |
| Glucose (mM) | 8.0 ± 0.3 | 6.2 ± 0.1 # | 5.5 ± 0.3 # |
| Muscles | |||
| TIB mass (mg) | 1220.0 ± 47.3 | 1100.0 ± 20.7 | 962.0 ± 35.4 # ◊ |
| SOL mass (mg) | 330.0 ± 24.5 | 282.0 ± 13.6 | 280.0 ± 12.2 |
| Heart mass (mg) | 1479.3 ± 70.7 | 1405.7 ± 41.6 | 1025.1 ± 47.5 # ◊ |
© 2020 by the authors. Licensee MDPI, Basel, Switzerland. This article is an open access article distributed under the terms and conditions of the Creative Commons Attribution (CC BY) license (http://creativecommons.org/licenses/by/4.0/).
Share and Cite
Ibrahim, M.; Wasselin, T.; Challet, E.; Van Dorsselaer, A.; Le Maho, Y.; Raclot, T.; Bertile, F. Transcriptional Changes Involved in Atrophying Muscles during Prolonged Fasting in Rats. Int. J. Mol. Sci. 2020, 21, 5984. https://doi.org/10.3390/ijms21175984
Ibrahim M, Wasselin T, Challet E, Van Dorsselaer A, Le Maho Y, Raclot T, Bertile F. Transcriptional Changes Involved in Atrophying Muscles during Prolonged Fasting in Rats. International Journal of Molecular Sciences. 2020; 21(17):5984. https://doi.org/10.3390/ijms21175984
Chicago/Turabian StyleIbrahim, Marianne, Thierry Wasselin, Etienne Challet, Alain Van Dorsselaer, Yvon Le Maho, Thierry Raclot, and Fabrice Bertile. 2020. "Transcriptional Changes Involved in Atrophying Muscles during Prolonged Fasting in Rats" International Journal of Molecular Sciences 21, no. 17: 5984. https://doi.org/10.3390/ijms21175984