The Impact of Composition and Morphology on Ionic Conductivity of Silk/Cellulose Bio-Composites Fabricated from Ionic Liquid and Varying Percentages of Coagulation Agents

 ,
,  and
and
Abstract
:1. Introduction
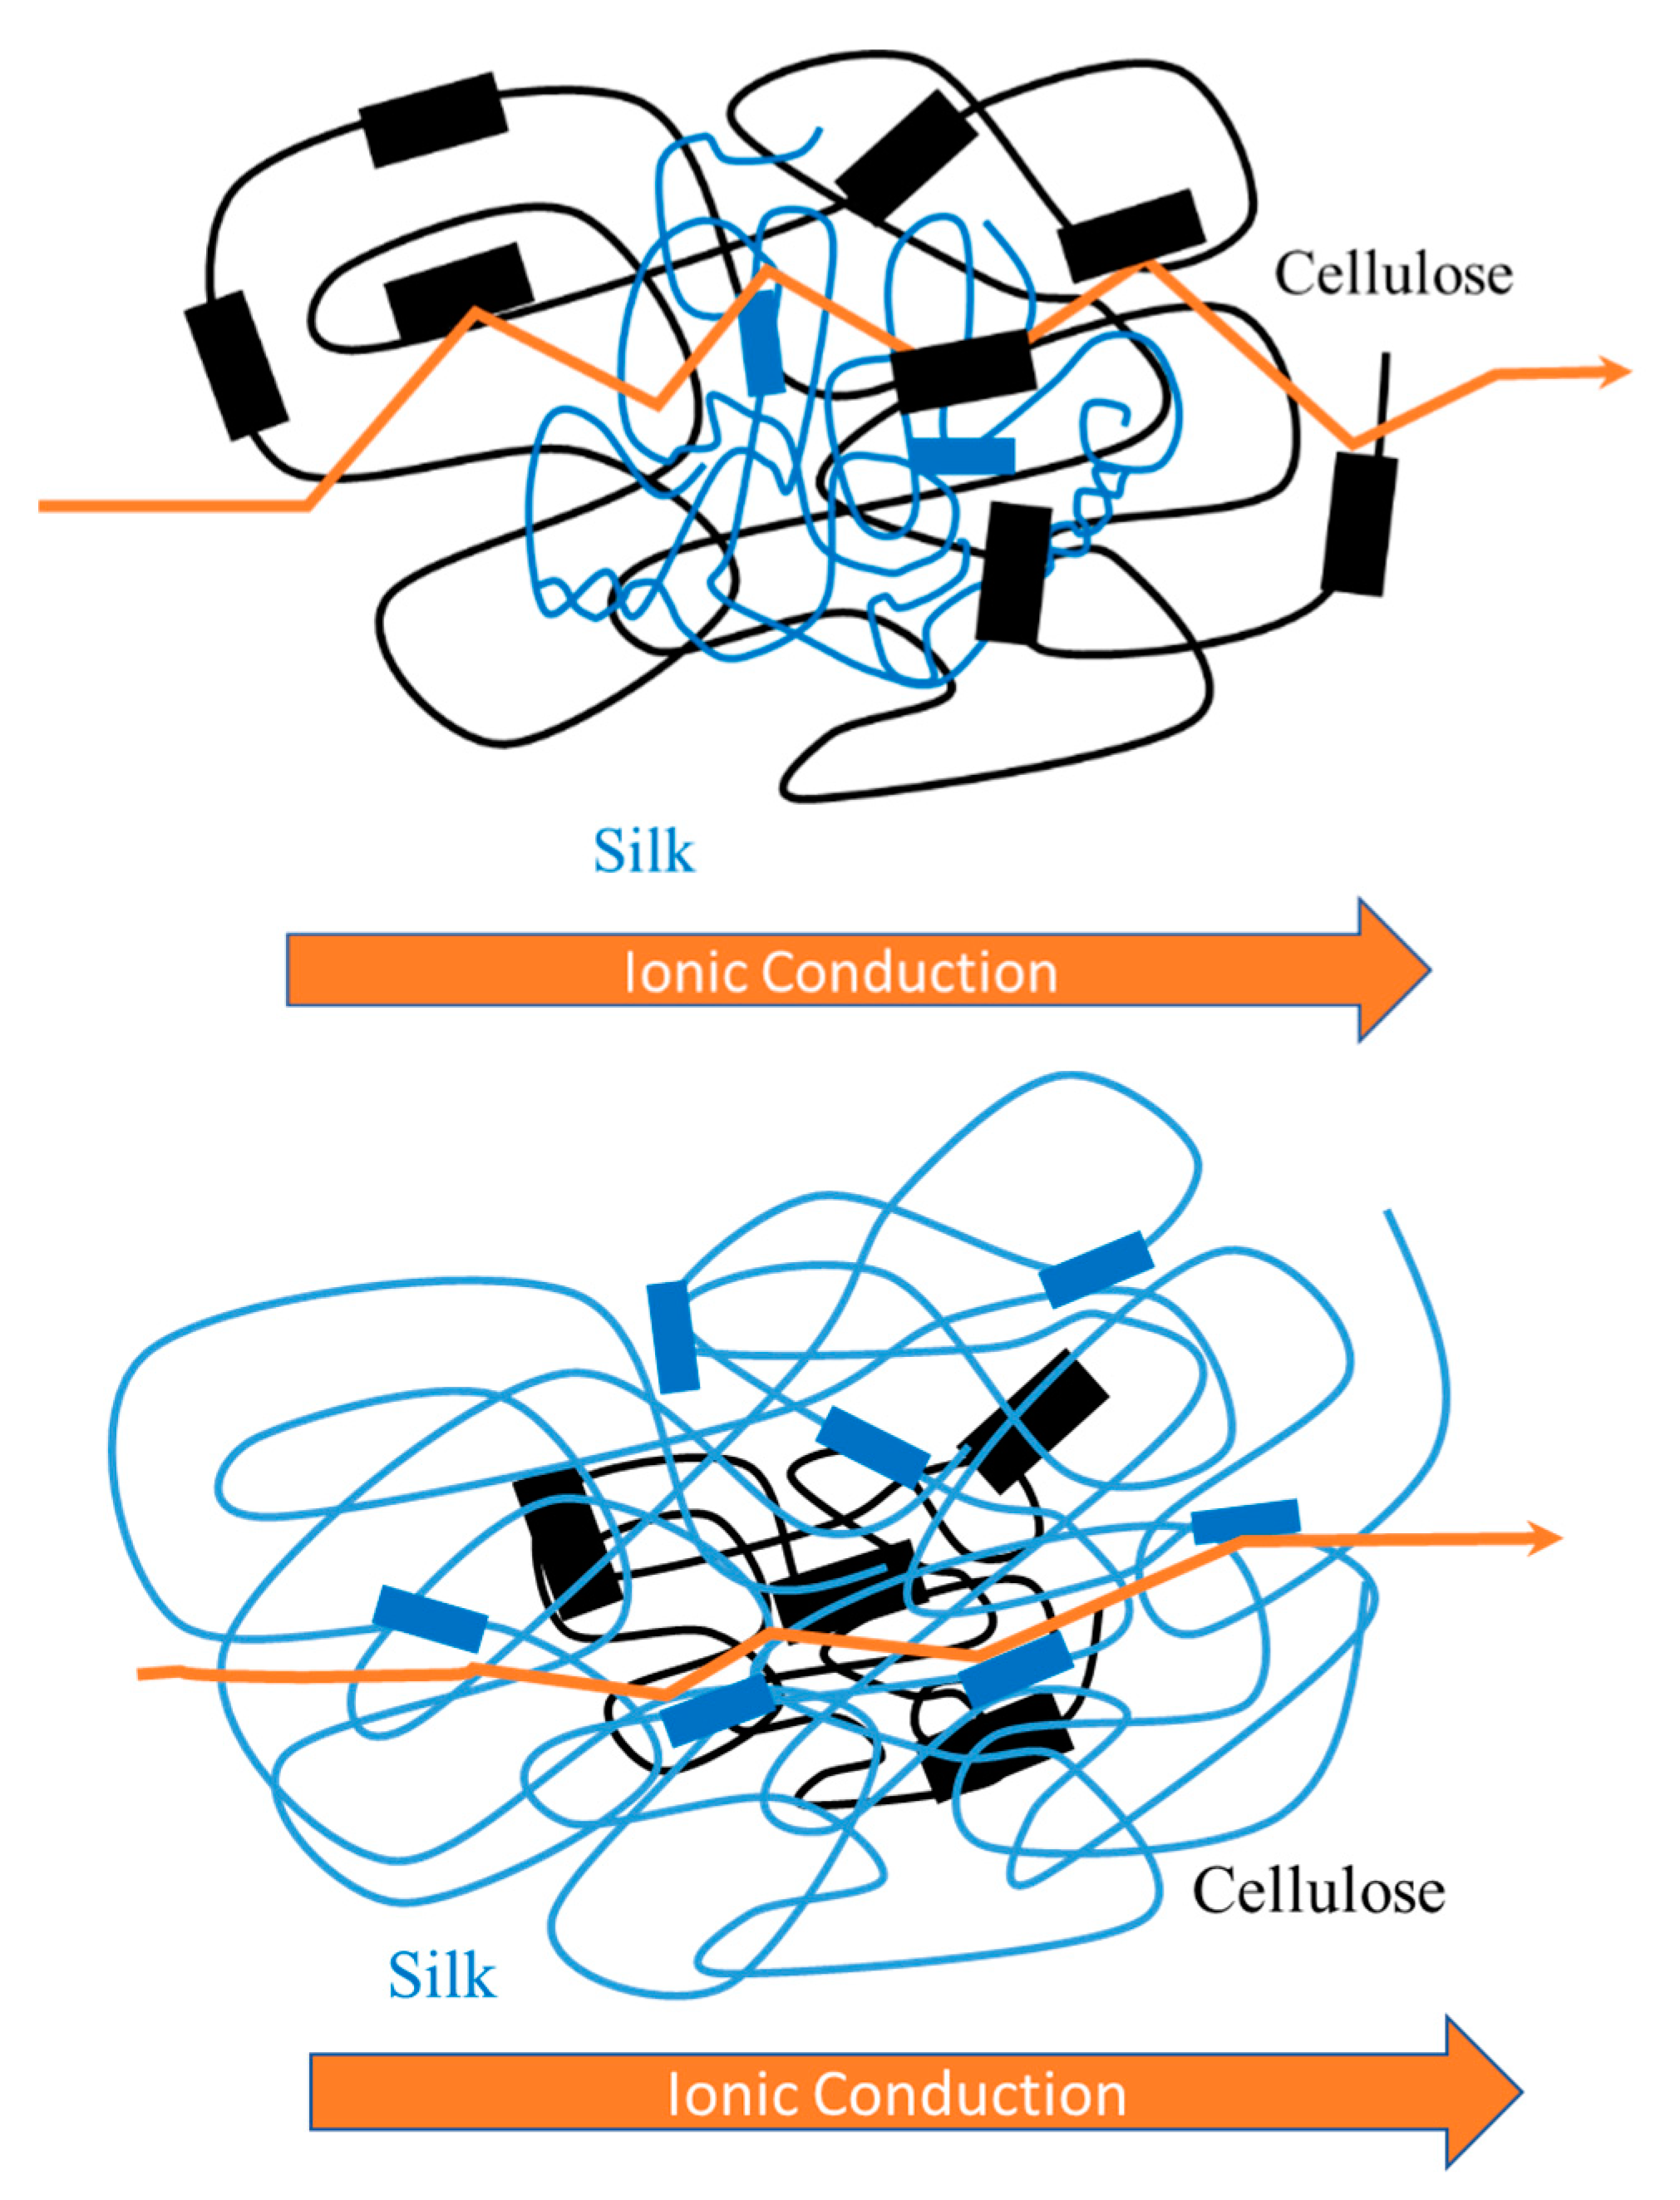
2. Results and Discussion
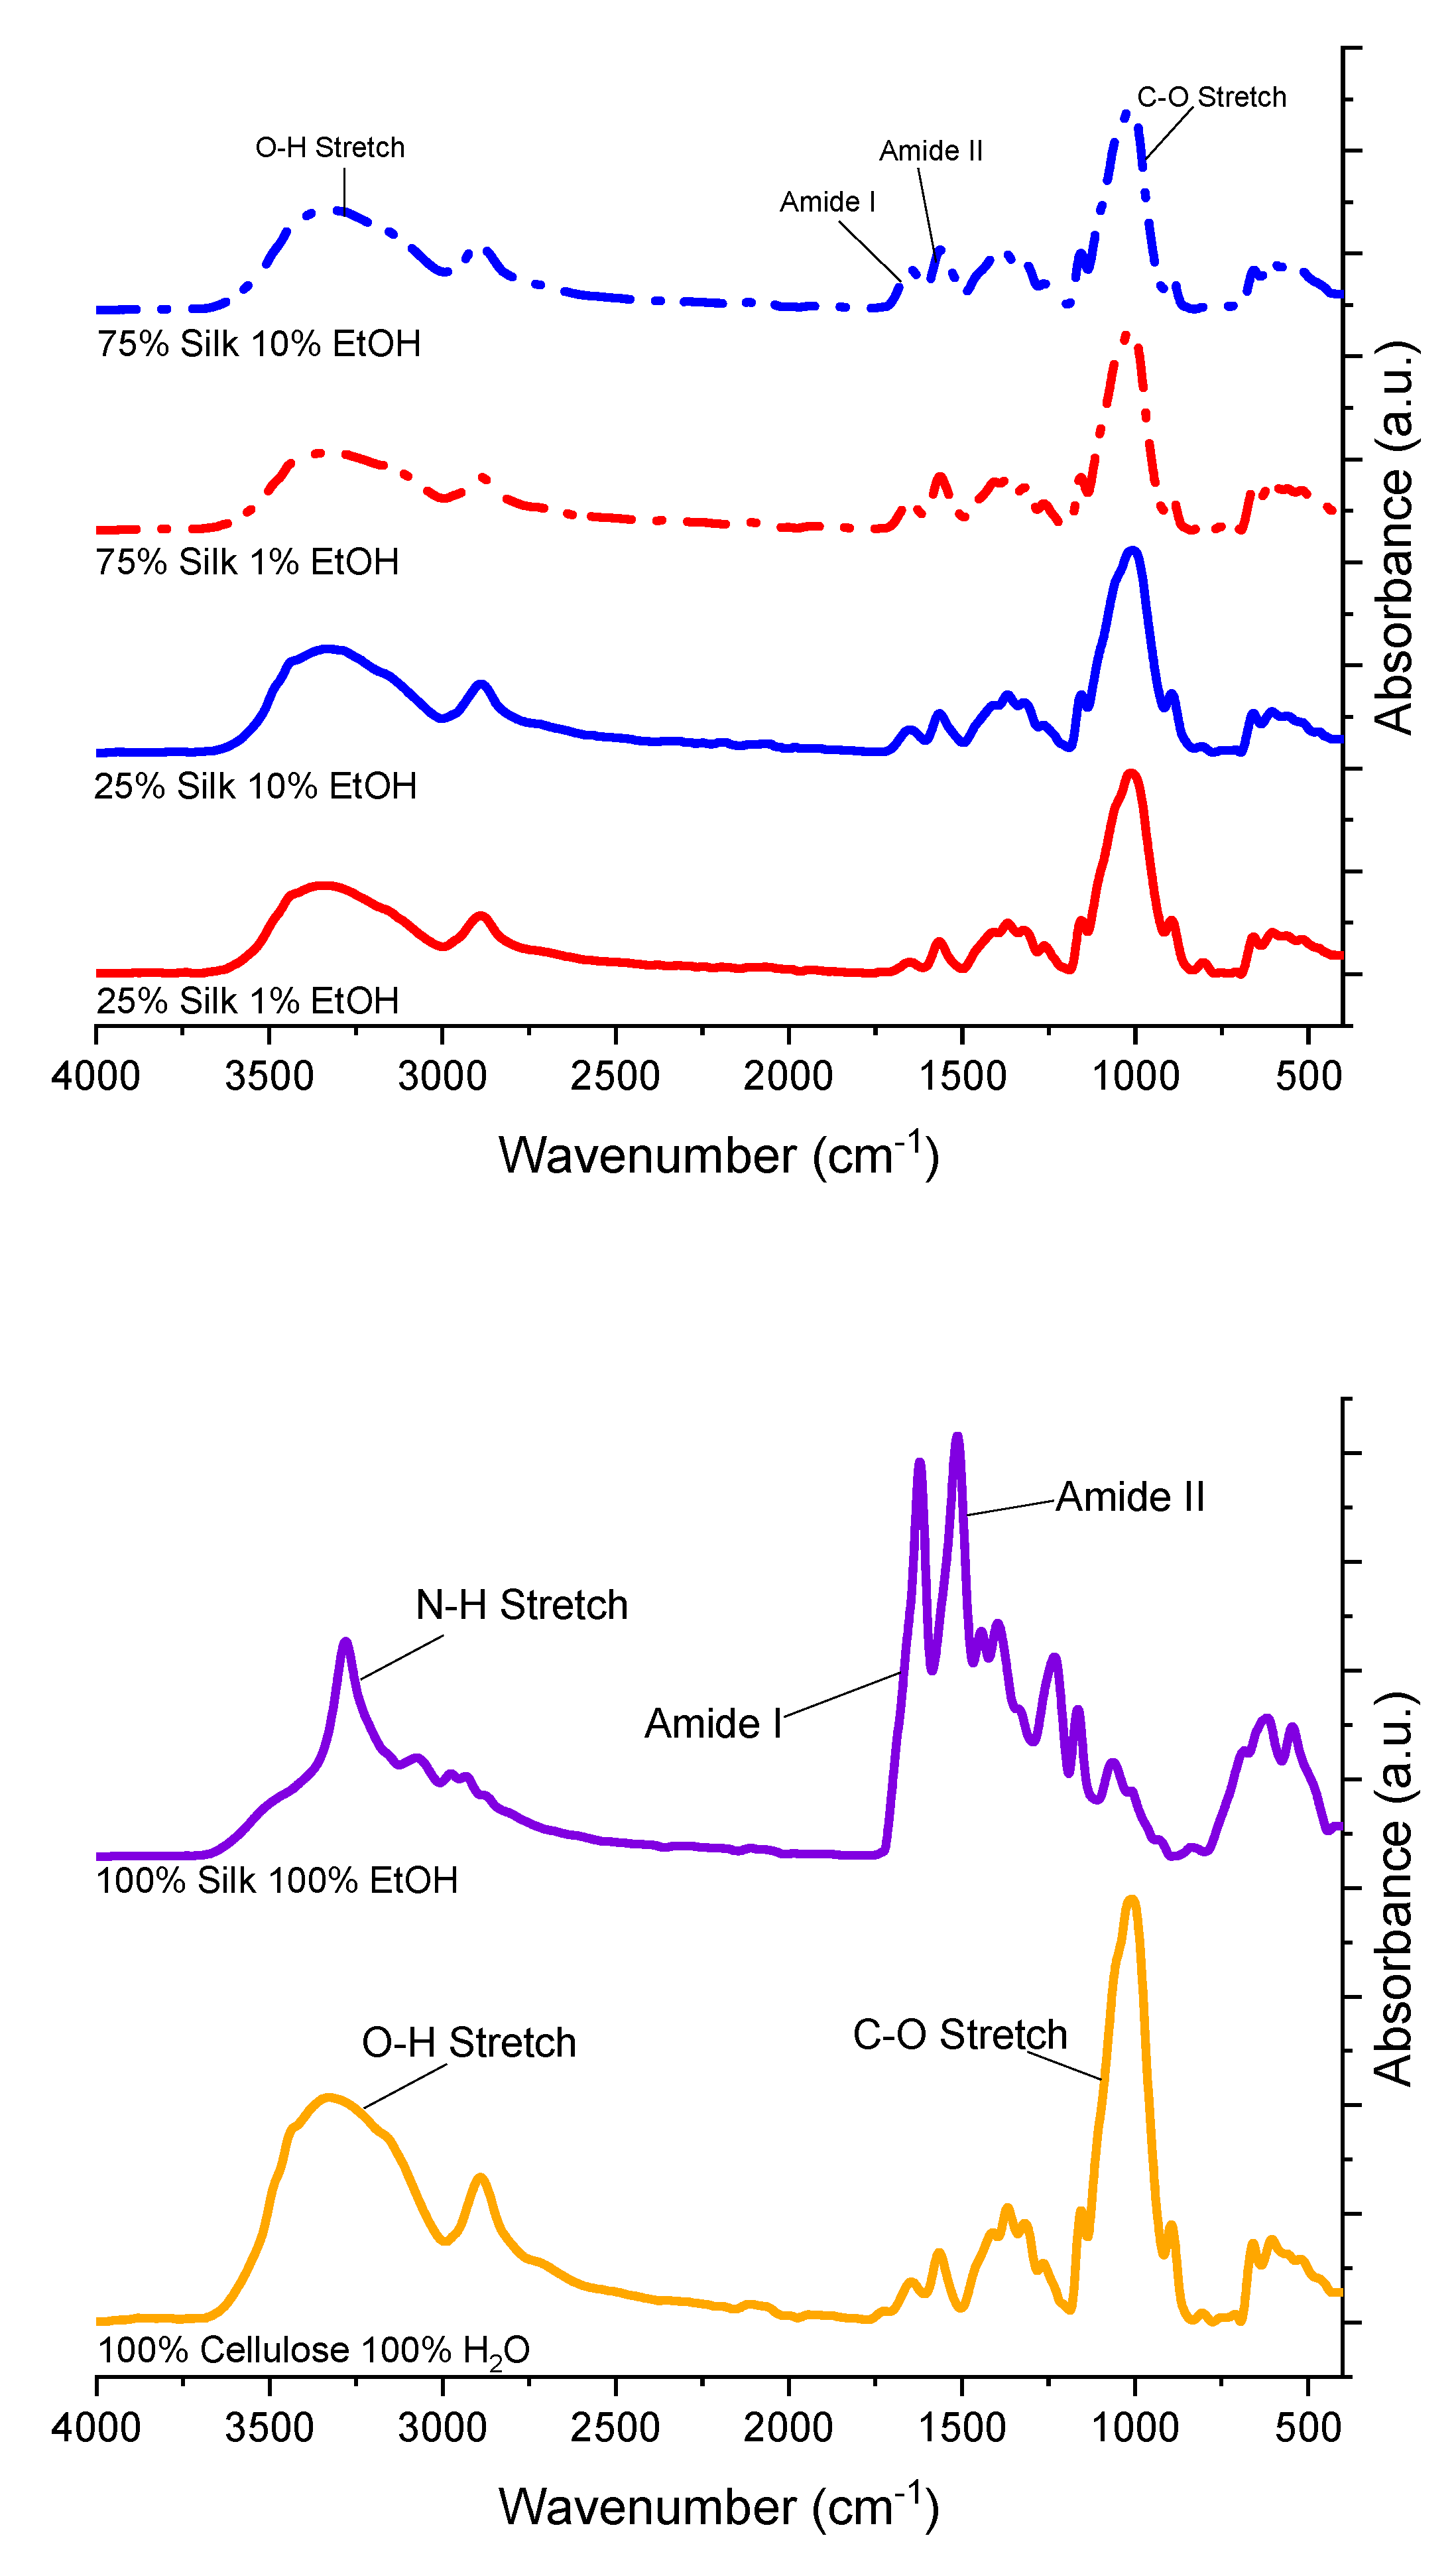
2.1. Fourier Transform Infrared Spectroscopy
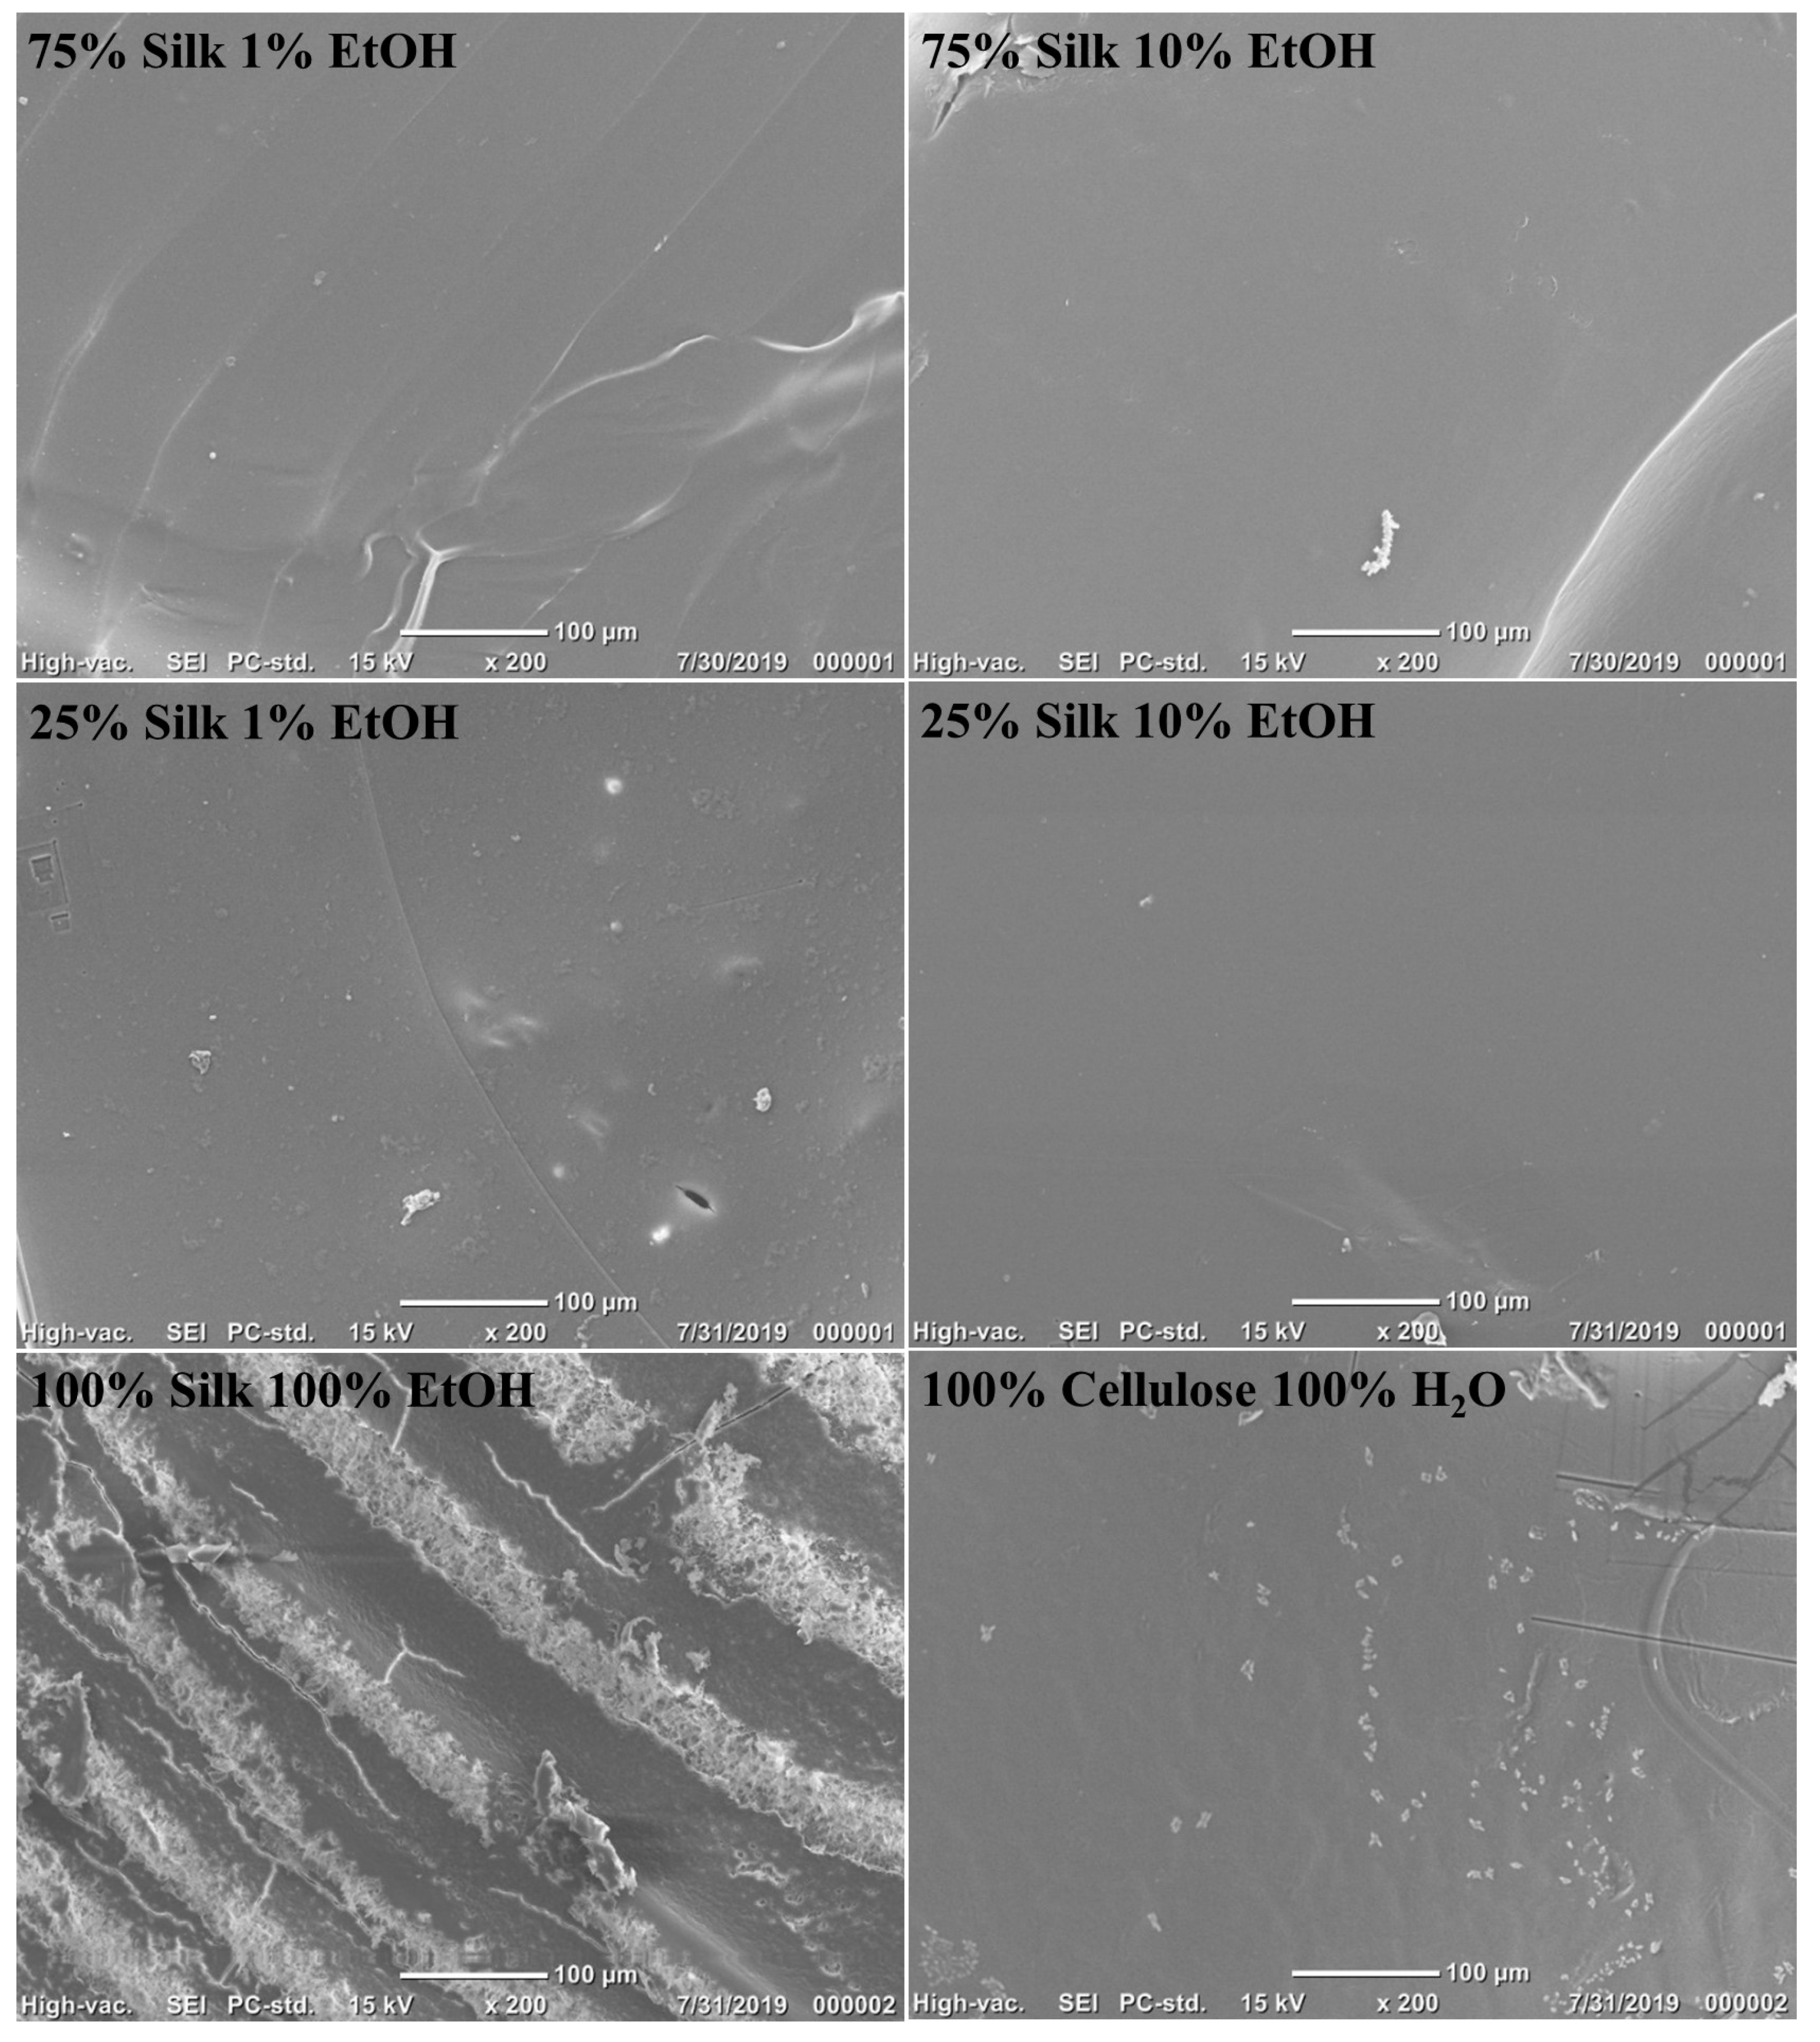
2.2. Scanning Electron Microscopy
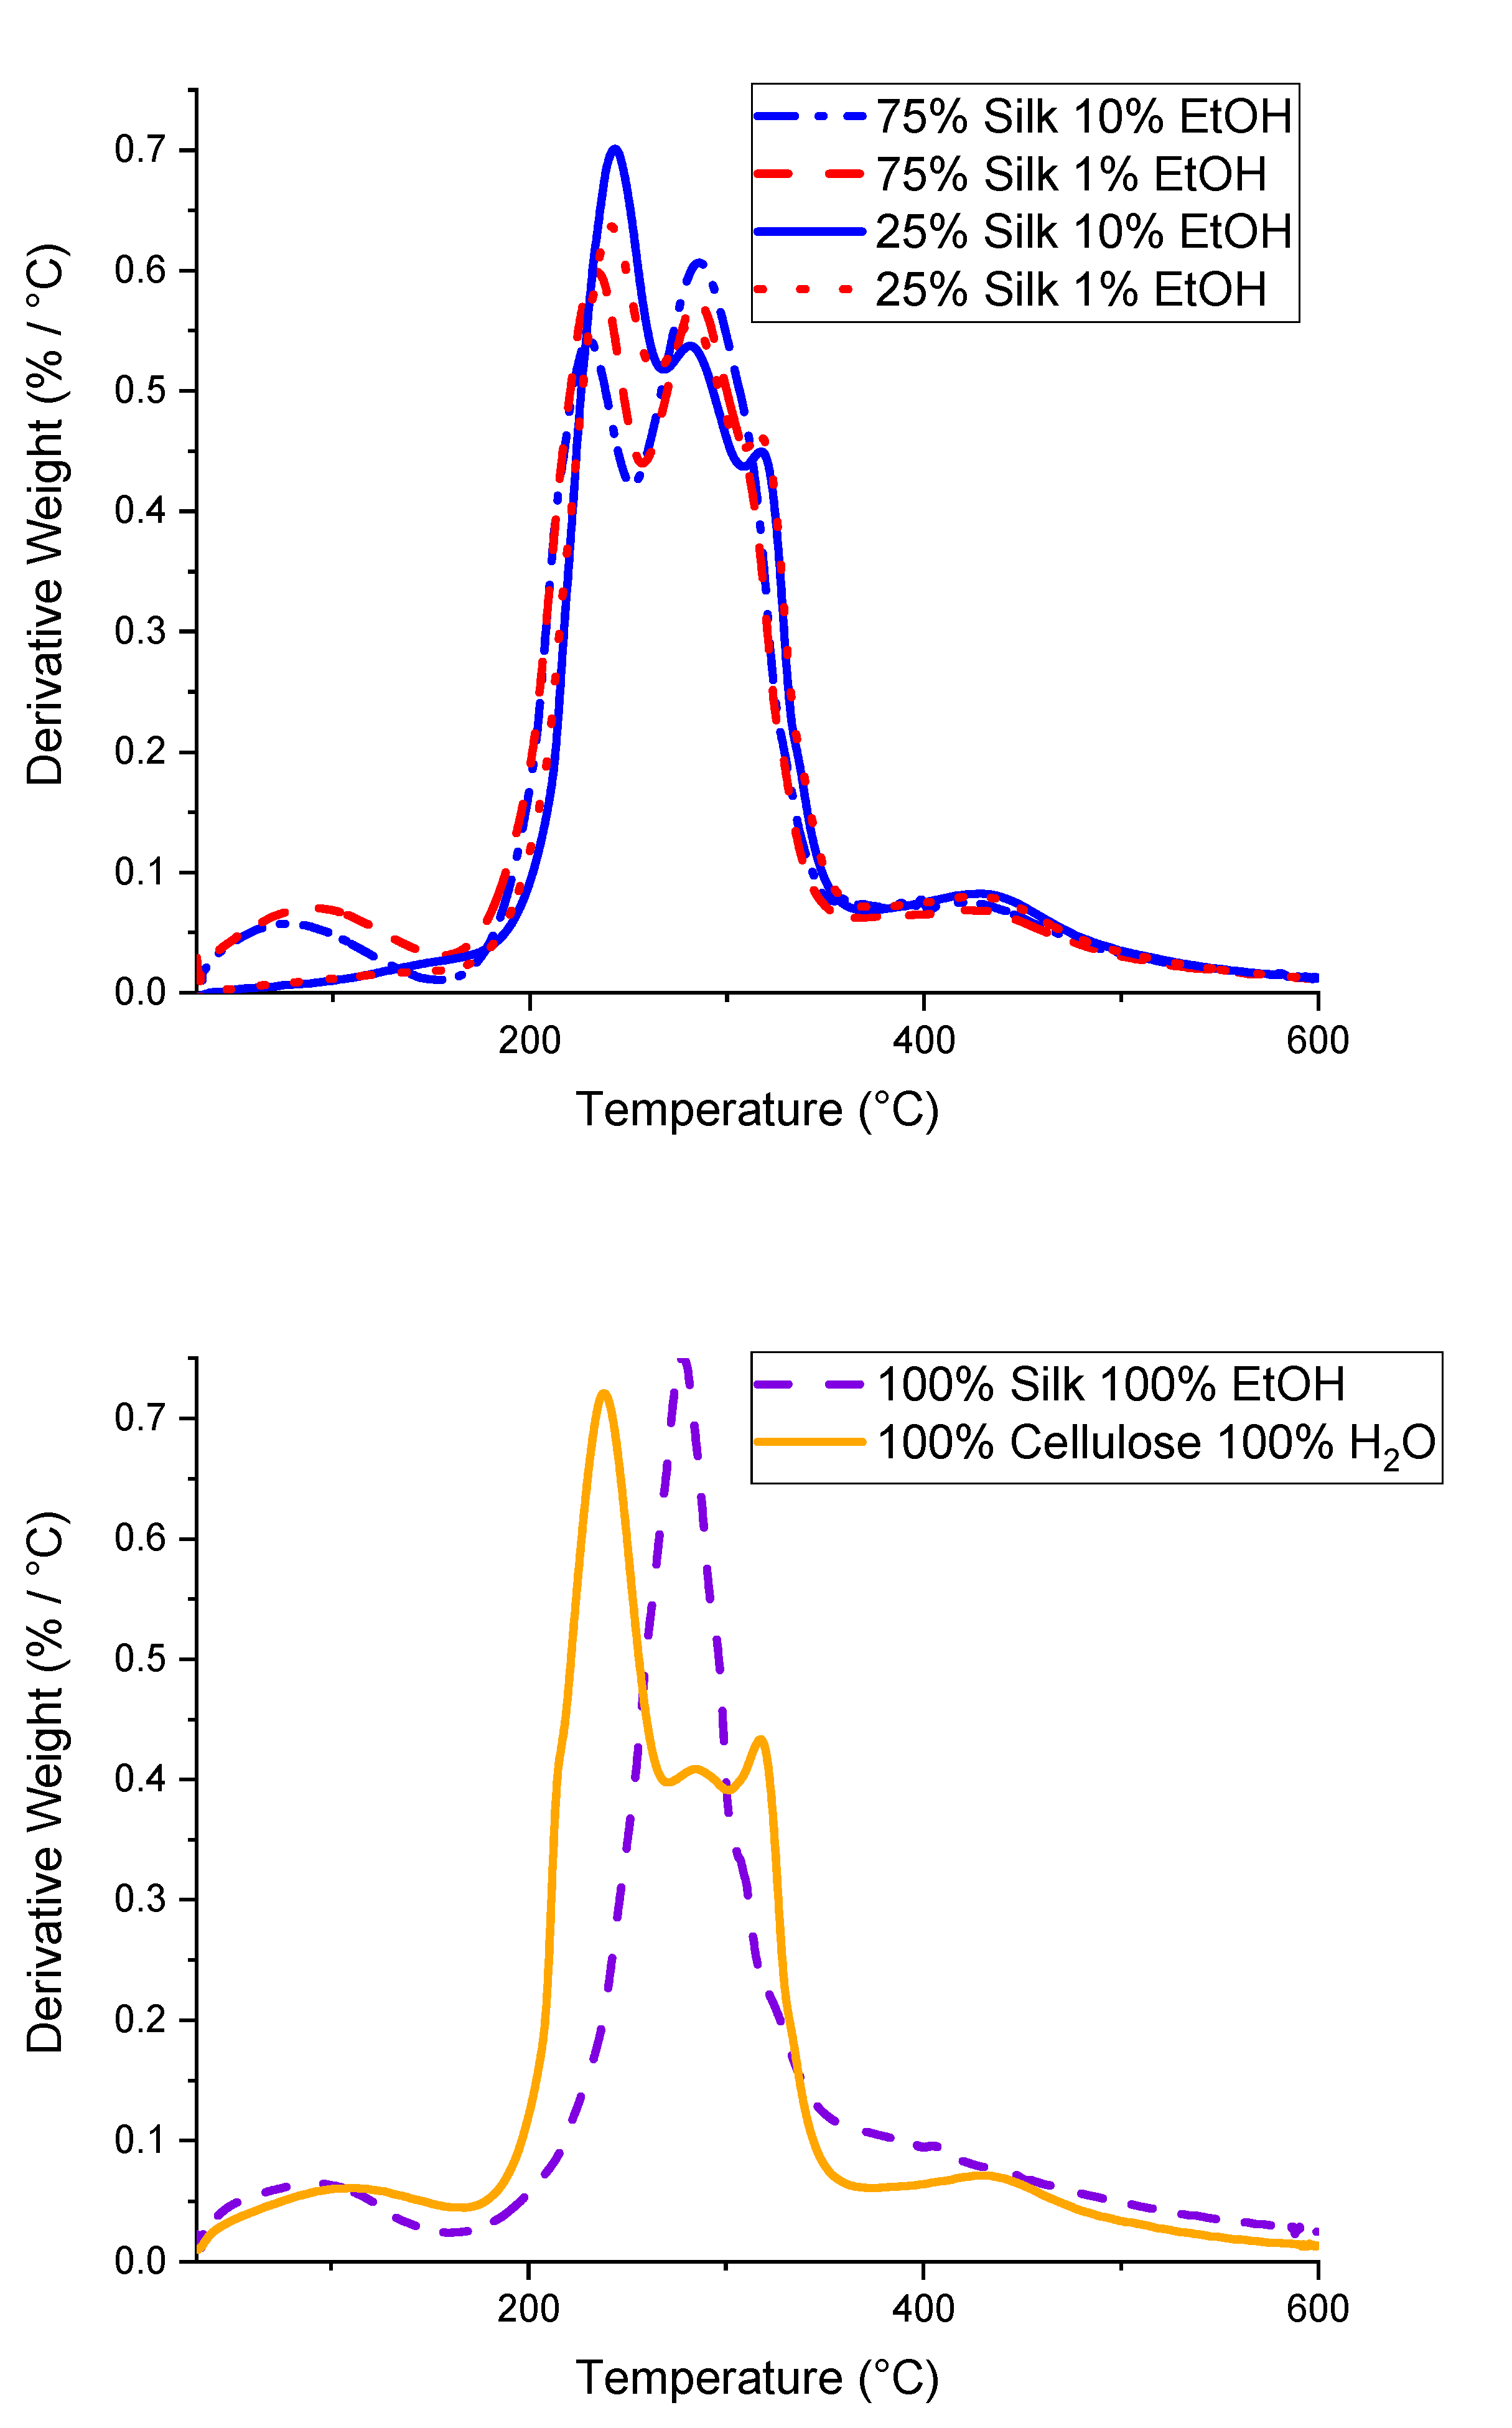
2.3. Thermogravimetric Analysis
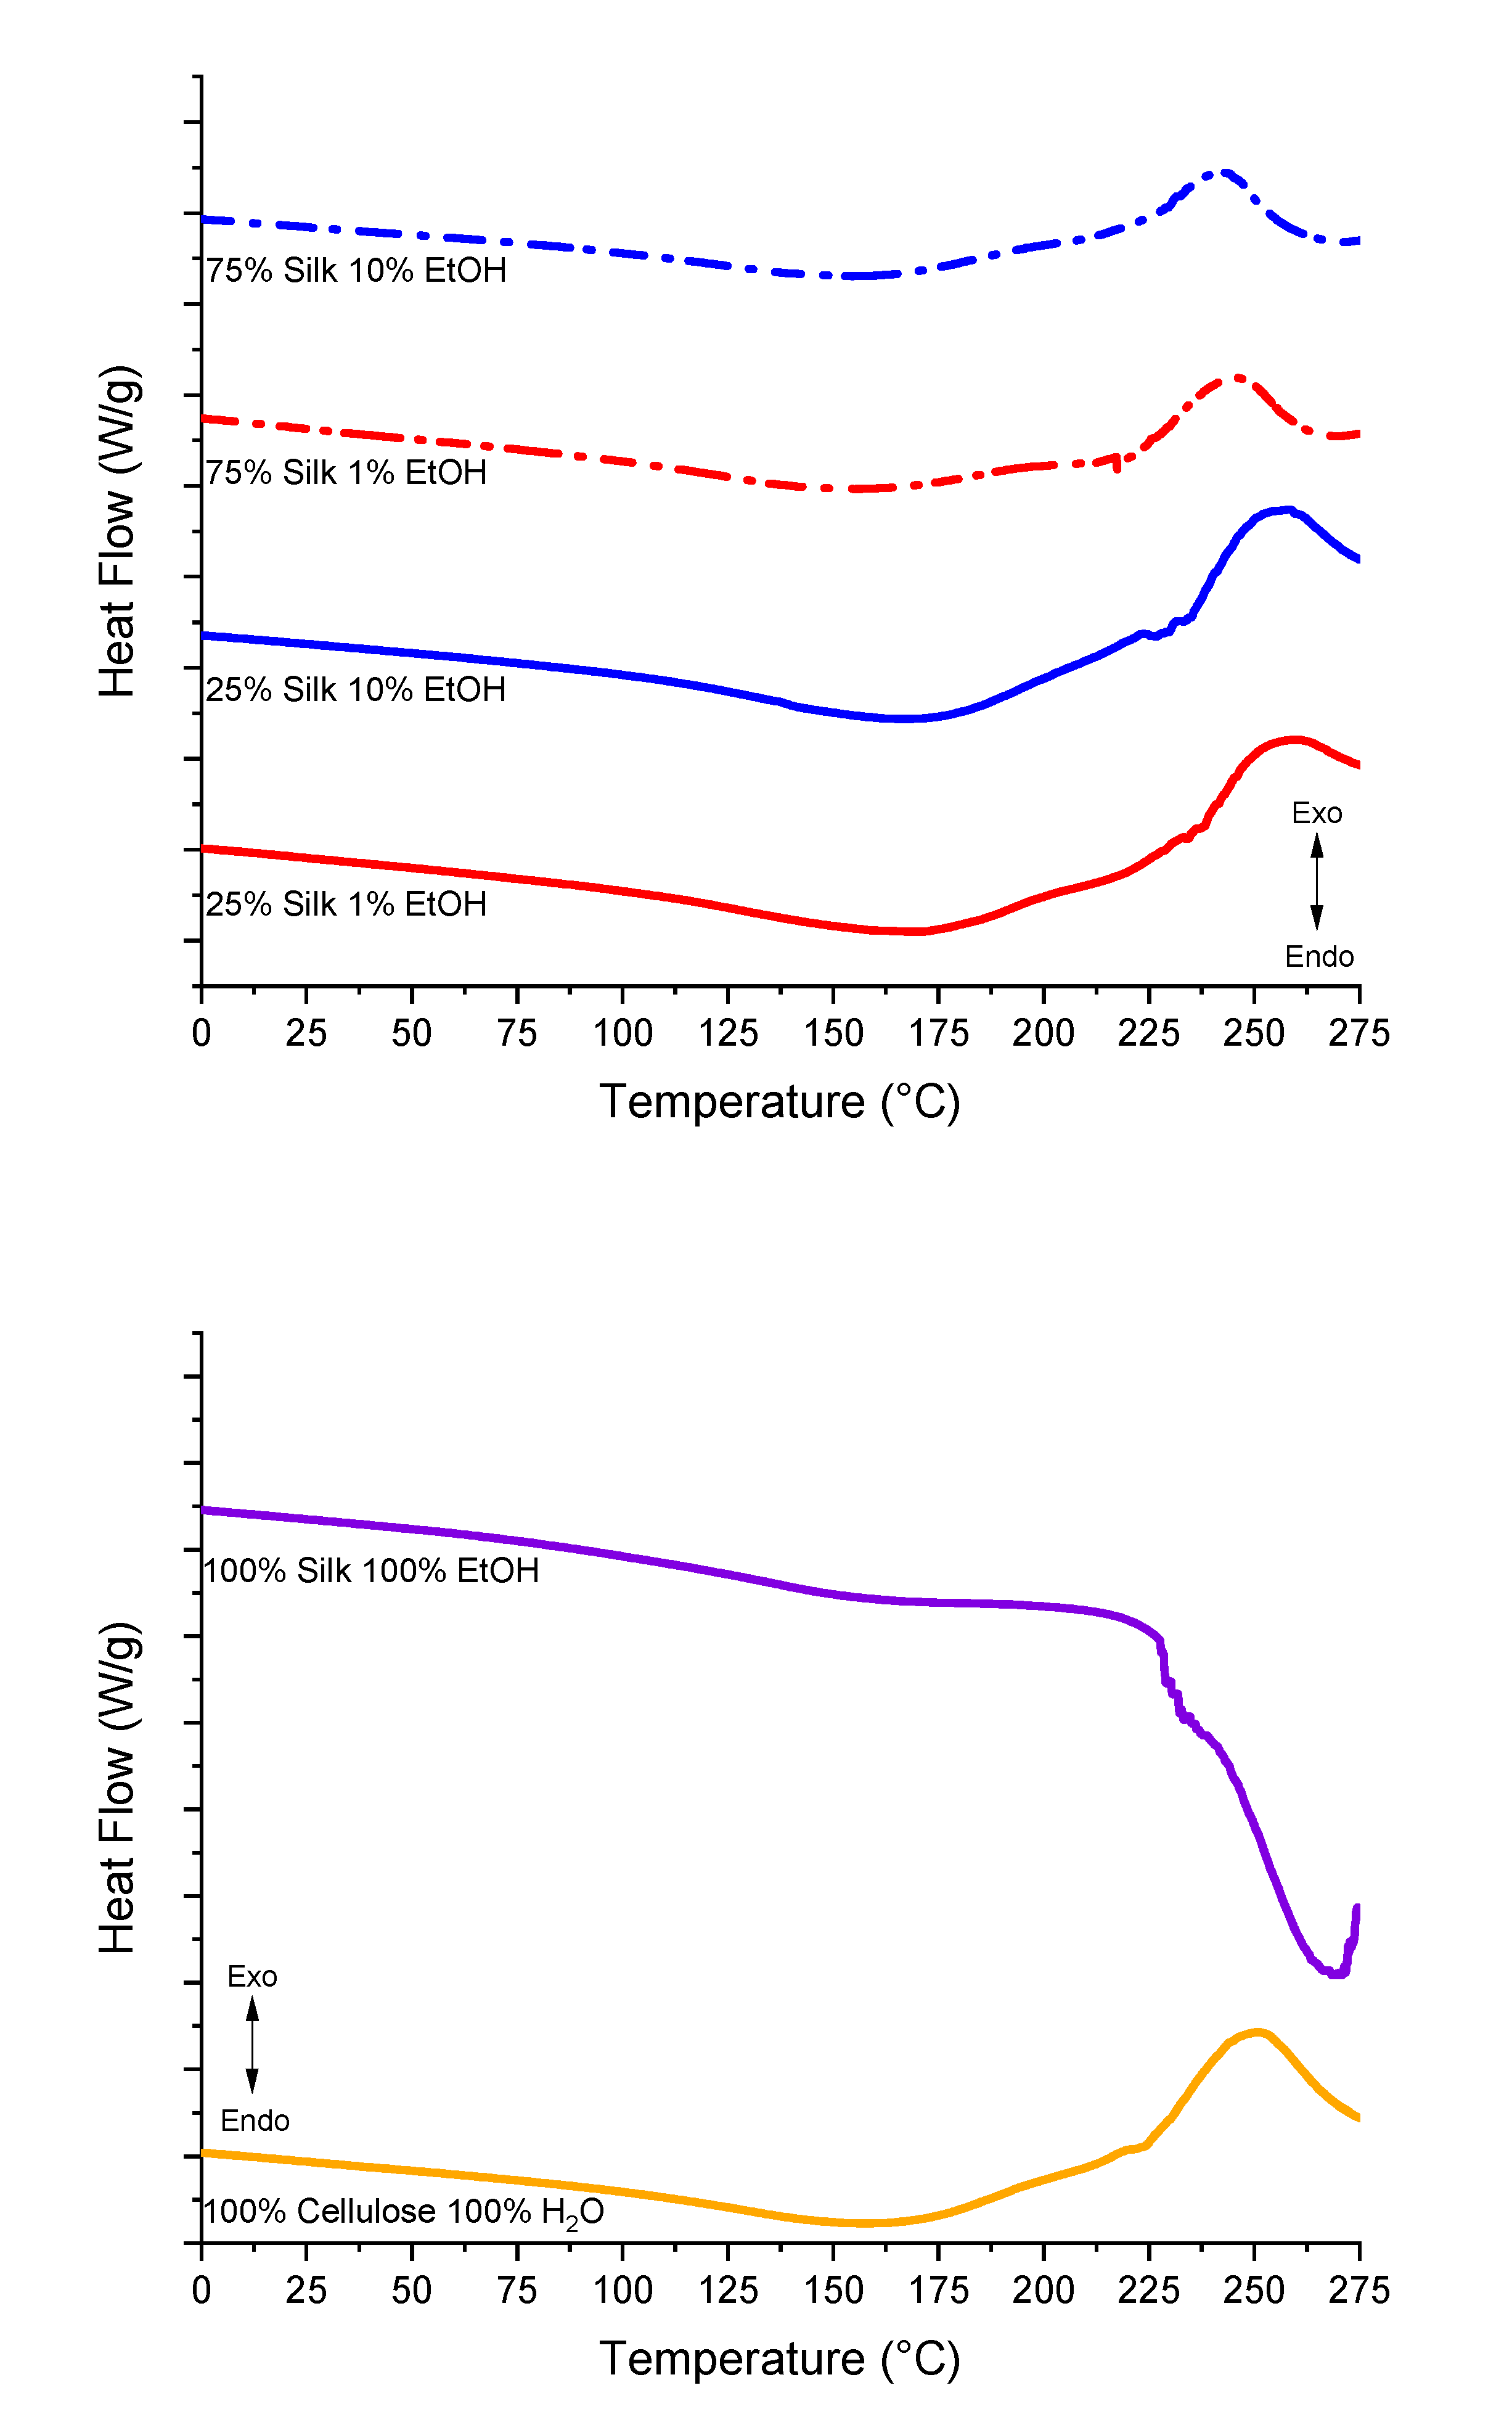
2.4. Differential Scanning Calorimetry
2.5. X-Ray Scattering
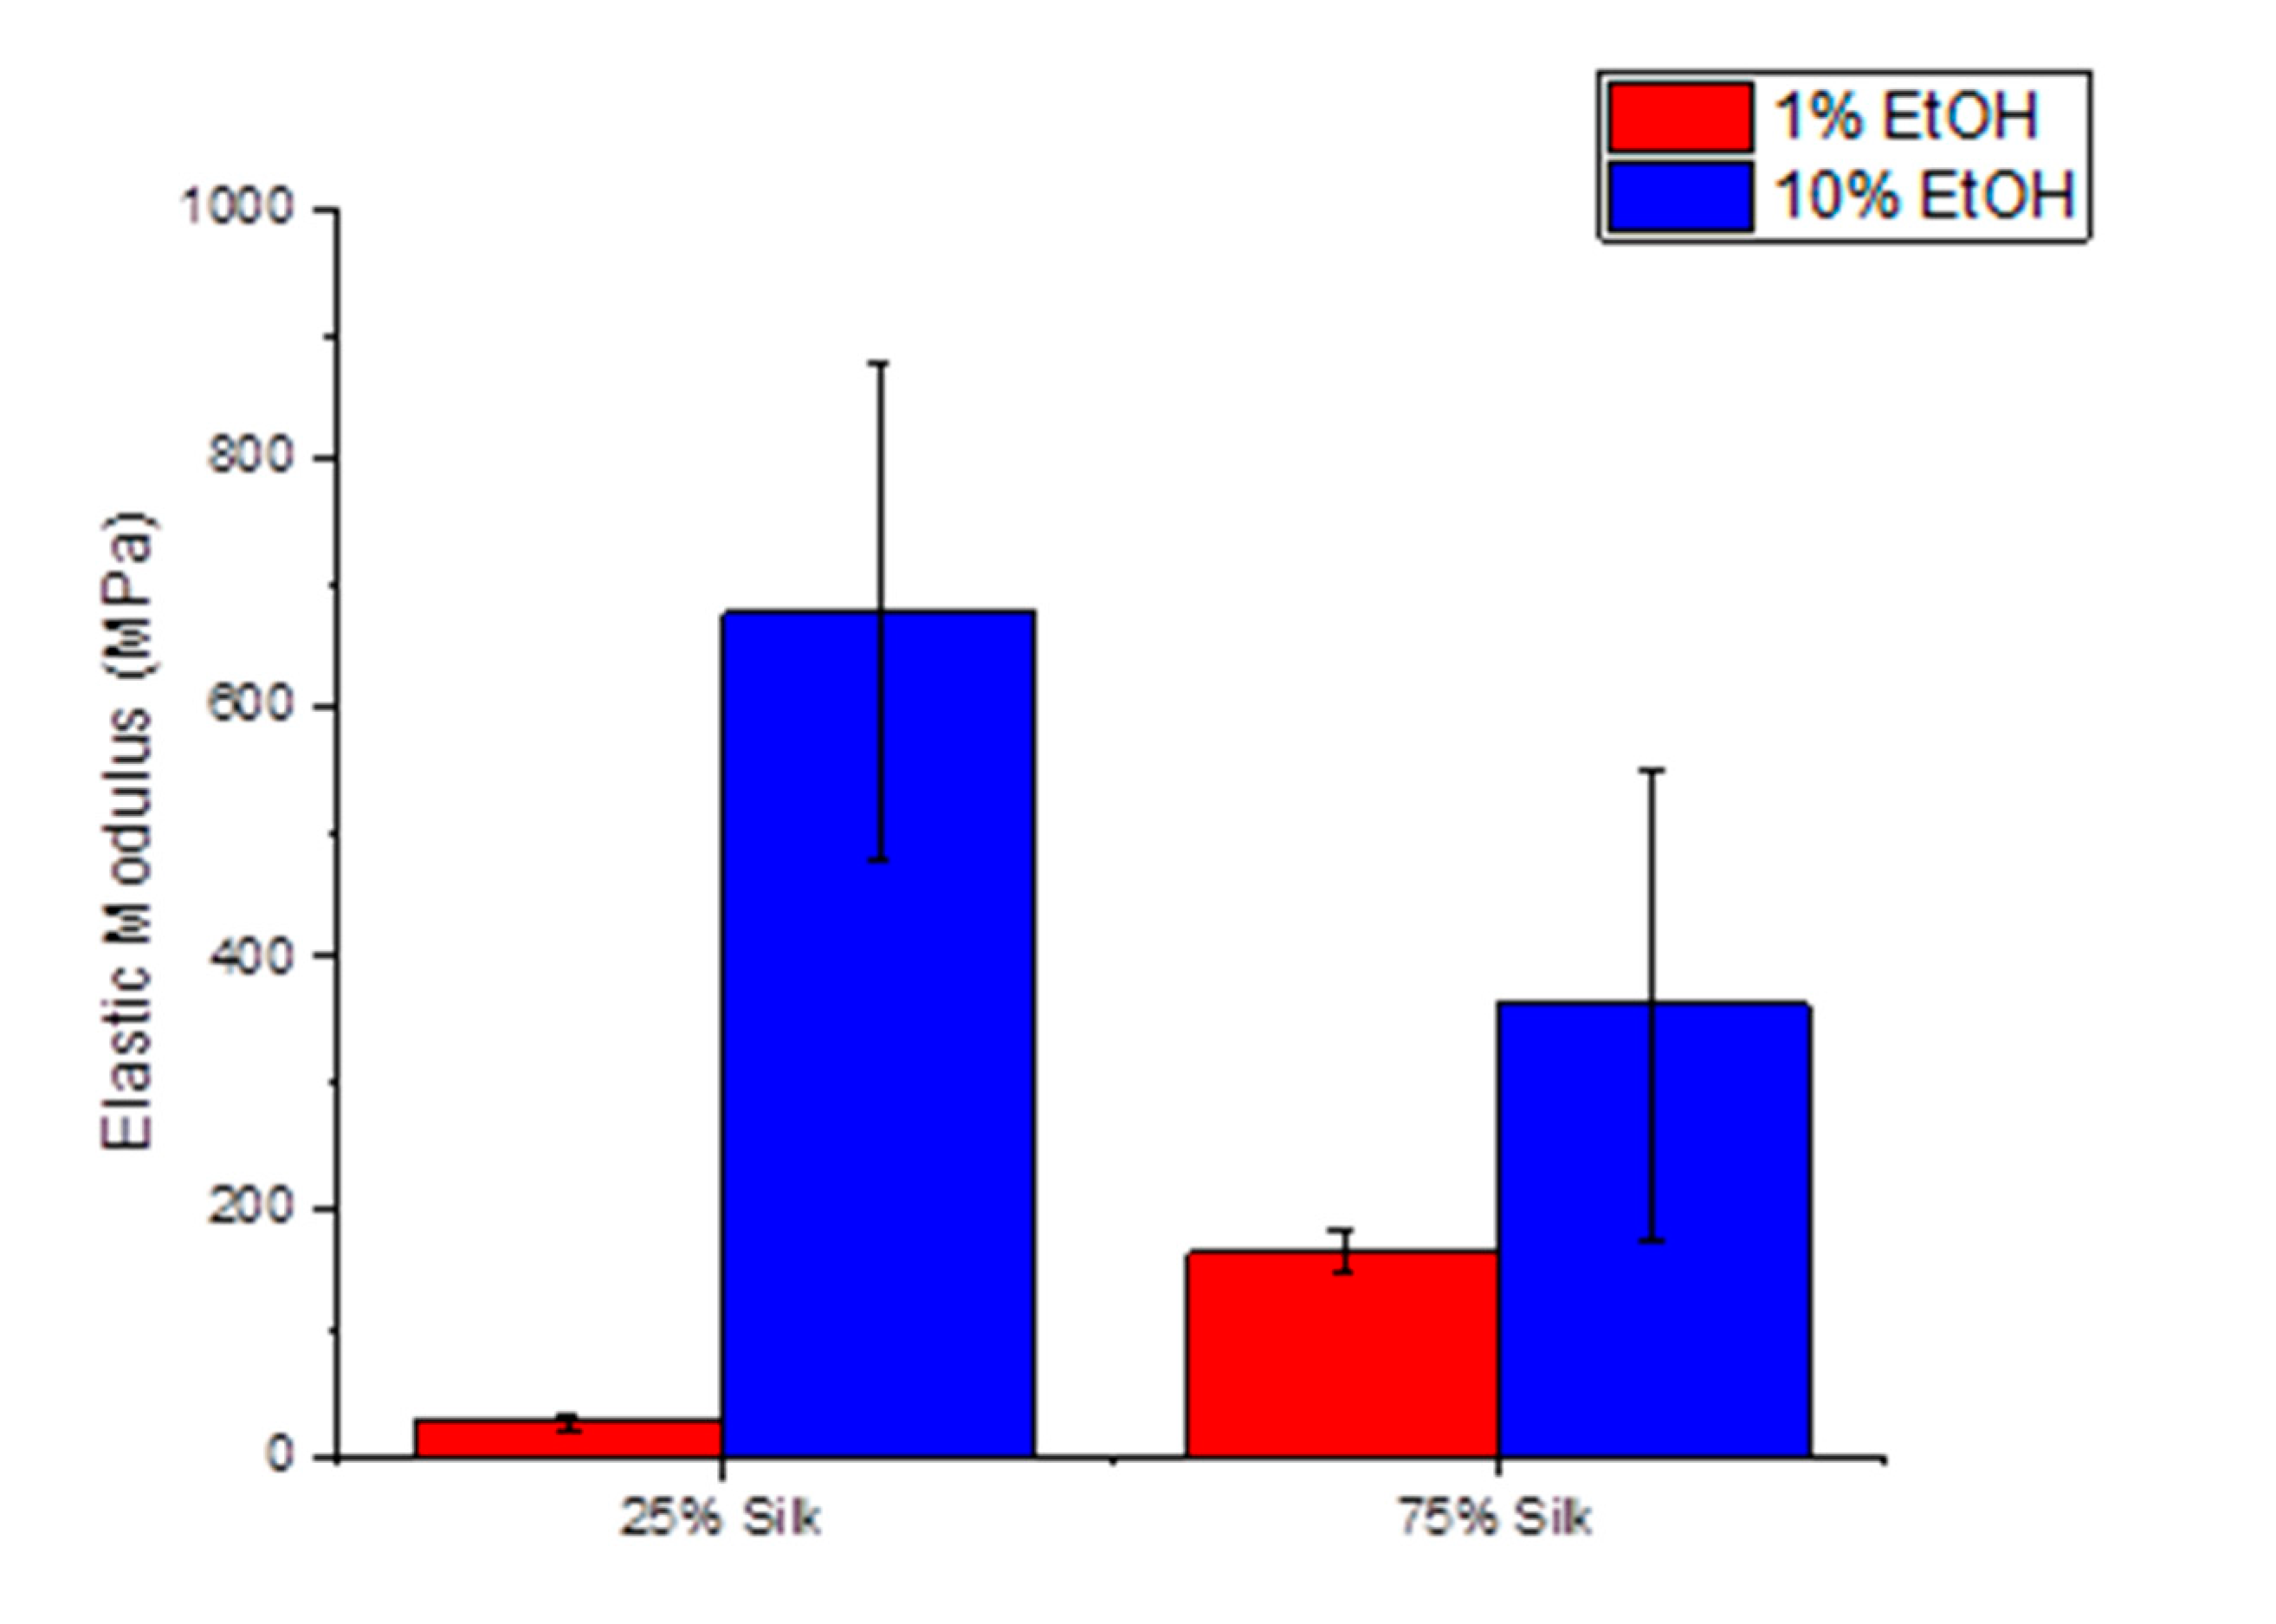
2.6. Atomic Force Microscopy (Nanoindentation)
2.7. Dielectric Relaxation Spectroscopy
3. Experimental Section
3.1. Materials
3.1.1. Ionic Liquid
3.1.2. Cellulose
3.1.3. Silk
3.1.4. Dissolution of the Protein and Polysaccharide
3.1.5. Preparation of Regenerated Biofilm
3.2. Characterization
3.2.1. Fourier Transform Infrared Spectroscopy
3.2.2. Scanning Electron Microscopy
3.2.3. Thermogravimetric Analysis
3.2.4. Differential Scanning Calorimetry
3.2.5. X-Ray Scattering
3.2.6. Atomic Force Microscopy (Nanoindentation)
3.2.7. Dielectric Relaxation Spectroscopy
4. Conclusions
Author Contributions
Funding
Acknowledgments
Conflicts of Interest
References
- Pavlovic, M. What Are Biomaterials? In Bioengineering: A Conceptual Approach; Springer International Publishing: Cham, Switzerland, 2015; pp. 229–244. [Google Scholar]
- Jia, X.; Wang, C.; Zhao, C.; Ge, Y.; Wallace, G.G. Toward biodegradable Mg–air bioelectric batteries composed of silk fibroin–polypyrrole film. Adv. Funct. Mater. 2016, 26, 1454–1462. [Google Scholar] [CrossRef] [Green Version]
- Agarwal, V.; Huber, G.W.; Conner, W.C., Jr.; Auerbach, S.M. Simulating infrared spectra and hydrogen bonding in cellulose Iβ at elevated temperatures. J. Chem. Phys. 2011, 135, 10B605. [Google Scholar] [CrossRef]
- Wilson, D.B.; Irwin, D.C. Genetics and properties of cellulases. In Recent Progress in Bioconversion of Lignocellulosics; Springer: Cham, Switzerland, 1999; pp. 1–21. [Google Scholar]
- Yamashiki, T.; Matsui, T.; Saitoh, M.; Matsuda, Y.; Okajima, K.; Kamide, K.; Sawada, T. Characterisation of cellulose treated by the steam explosion method. Part 3: Effect of crystal forms (cellulose I, II and III) of original cellulose on changes in morphology, degree of polymerisaion, solubility and supermolecular structure by steam explosion. Br. Polym. J. 1990, 22, 201–212. [Google Scholar]
- Helbert, W.; Nishiyama, Y.; Okano, T.; Sugiyama, J. Molecular imaging ofhalocynthia papillosacellulose. J. Struct. Biol. 1998, 124, 42–50. [Google Scholar] [CrossRef]
- Cheng, G.; Varanasi, P.; Li, C.; Liu, H.; Melnichenko, Y.B.; Simmons, B.A.; Kent, M.S.; Singh, S. Transition of cellulose crystalline structure and surface morphology of biomass as a function of ionic liquid pretreatment and its relation to enzymatic hydrolysis. Biomacromolecules 2011, 12, 933–941. [Google Scholar] [CrossRef] [Green Version]
- Dumitriu, S. Polysaccharides: Structural Diversity and Functional Versatility; CRC Press: Boca Raton, FL, USA, 2004. [Google Scholar]
- Hu, X.; Cebe, P.; Weiss, A.S.; Omenetto, F.; Kaplan, D.L. Protein-based composite materials. Mater. Today 2012, 15, 208–215. [Google Scholar] [CrossRef]
- Zhou, L.; Wang, Q.; Wen, J.; Chen, X.; Shao, Z. Preparation and characterization of transparent silk fibroin/cellulose blend films. Polymer 2013, 54, 5035–5042. [Google Scholar] [CrossRef]
- Marsh, R.E.; Corey, R.B.; Pauling, L. An investigation of the structure of silk fibroin. Biochim. Biophys. Acta 1955, 16, 1–34. [Google Scholar] [CrossRef]
- Takahashi, Y.; Gehoh, M.; Yuzuriha, K. Structure refinement and diffuse streak scattering of silk (Bombyx mori). Int. J. Biol. Macromol. 1999, 24, 127–138. [Google Scholar] [CrossRef]
- Chen, X.; Knight, D.P.; Shao, Z.; Vollrath, F. Regenerated Bombyx silk solutions studied with rheometry and FTIR. Polymer 2001, 42, 09969–09974. [Google Scholar] [CrossRef]
- Chen, X.; Shao, Z.; Marinkovic, N.S.; Miller, L.M.; Zhou, P.; Chance, M.R. Conformation transition kinetics of regenerated Bombyx mori silk fibroin membrane monitored by time-resolved FTIR spectroscopy. Biophys. Chem. 2001, 89, 25–34. [Google Scholar] [CrossRef]
- Stanton, J.; Xue, Y.; Pandher, P.; Malek, L.; Brown, T.; Hu, X.; Salas-de la Cruz, D. Impact of ionic liquid type on the structure, morphology and properties of silk-cellulose biocomposite materials. Int. J. Biol. Macromol. 2018, 108, 333–341. [Google Scholar] [CrossRef] [PubMed]
- Stanton, J.; Xue, Y.; Waters, J.C.; Lewis, A.; Cowan, D.; Hu, X.; Salas-de la Cruz, D. Structure–property relationships of blended polysaccharide and protein biomaterials in ionic liquid. Cellulose 2017, 24, 1775–1789. [Google Scholar] [CrossRef]
- Hadadi, A.; Whittaker, J.W.; Verrill, D.E.; Hu, X.; Larini, L.; Salas-De La Cruz, D. A Hierarchical Model to Understand the Processing of Polysaccharides/Protein-Based Films in Ionic Liquids. Biomacromolecules 2018, 19, 3970–3982. [Google Scholar] [CrossRef] [PubMed]
- Blessing, B.; Trout, C.; Morales, A.; Rybacki, K.; Love, S.A.; Lamoureux, G.; O’Malley, S.M.; Hu, X.; Salas-de la Cruz, D. Morphology and ionic conductivity relationship in silk/cellulose biocomposites. Polym. Int. 2019, 68, 1580–1590. [Google Scholar] [CrossRef]
- Zhang, H.; Wu, J.; Zhang, J.; He, J. 1-Allyl-3-methylimidazolium chloride room temperature ionic liquid: A new and powerful nonderivatizing solvent for cellulose. Macromolecules 2005, 38, 8272–8277. [Google Scholar] [CrossRef]
- Johnson, K.E. What’s an ionic liquid? Interface Electrochem. Soc. 2007, 16, 38–41. [Google Scholar]
- Pinkert, A.; Marsh, K.N.; Pang, S.; Staiger, M.P. Ionic liquids and their interaction with cellulose. Chem. Rev. 2009, 109, 6712–6728. [Google Scholar] [CrossRef]
- Freddi, G.; Romanò, M.; Massafra, M.R.; Tsukada, M. Silk fibroin/cellulose blend films: Preparation, structure, and physical properties. J. Appl. Polym. Sci. 1995, 56, 1537–1545. [Google Scholar] [CrossRef]
- Love, S.A.; Popov, E.; Rybacki, K.; Hu, X.; Salas-de la Cruz, D. Facile treatment to fine-tune cellulose crystals in cellulose-silk biocomposites through hydrogen peroxide. Int. J. Biol. Macromol. 2020, 147, 569–575. [Google Scholar] [CrossRef]
- Salas-de la Cruz, D. Morphology and Ionic Conductivity of Polymerized Ionic Liquids; University of Pennsylvania: Philadelphia, PA, USA, 2011. [Google Scholar]
- Murphy, E. The dependence of the conductivity of cellulose, silk and wool on their water content. J. Phys. Chem. Solids 1960, 16, 115–122. [Google Scholar] [CrossRef]
- Pereira, R.F.; Brito-Pereira, R.; Gonçalves, R.; Silva, M.P.; Costa, C.M.; Silva, M.M.; de Zea Bermudez, V.n.; Lanceros-Méndez, S. Silk fibroin separators: A step toward lithium-ion batteries with enhanced sustainability. ACS Appl. Mater. Interfaces 2018, 10, 5385–5394. [Google Scholar] [CrossRef] [PubMed]
- Hu, X.; Kaplan, D.; Cebe, P. Determining beta-sheet crystallinity in fibrous proteins by thermal analysis and infrared spectroscopy. Macromolecules 2006, 39, 6161–6170. [Google Scholar] [CrossRef]
- Um, I.C.; Kweon, H.; Park, Y.H.; Hudson, S. Structural characteristics and properties of the regenerated silk fibroin prepared from formic acid. Int. J. Biol. Macromol. 2001, 29, 91–97. [Google Scholar] [CrossRef]
- He, S.-J.; Valluzzi, R.; Gido, S.P. Silk I structure in Bombyx mori silk foams. Int. J. Biol. Macromol. 1999, 24, 187–195. [Google Scholar] [CrossRef]
- Gong, Z.; Huang, L.; Yang, Y.; Chen, X.; Shao, Z. Two distinct [small beta]-sheet fibrils from silk protein. Chem. Commun. 2009, 48, 7506–7508. [Google Scholar] [CrossRef]
- Asakura, T.; Yamane, T.; Nakazawa, Y.; Kameda, T.; Ando, K. Structure of Bombyx mori silk fibroin before spinning in solid state studied with wide angle x-ray scattering and 13C cross-polarization/magic angle spinning NMR. Biopolymers 2001, 58, 521–525. [Google Scholar] [CrossRef]
- Asakura, T.; Okushita, K.; Williamson, M.P. Analysis of the Structure of Bombyx mori Silk Fibroin by NMR. Macromolecules 2015, 48, 2345–2357. [Google Scholar] [CrossRef]
- Liu, X.; Zhang, K.-Q. Silk Fiber—Molecular Formation Mechanism, Structure-Property Relationship and Advanced Applications; IntechOpen: Rijeka, Croatia, 2014. [Google Scholar]
- Saitoh, H.; Ohshima, K.-i.; Tsubouchi, K.; Takasu, Y.; Yamada, H. X-ray structural study of noncrystalline regenerated Bombyx mori silk fibroin. Int. J. Biol. Macromol. 2004, 34, 259–265. [Google Scholar] [CrossRef]
- Nieduszynski, I.; Preston, R. Crystallite size in natural cellulose. Nature 1970, 225, 273–274. [Google Scholar] [CrossRef]
- Eyley, S.; Thielemans, W. Surface modification of cellulose nanocrystals. Nanoscale 2014, 6, 7764–7779. [Google Scholar] [CrossRef] [PubMed] [Green Version]
- French, A.D. Idealized powder diffraction patterns for cellulose polymorphs. Cellulose 2014, 21, 885–896. [Google Scholar] [CrossRef]
- Fernandes, A.N.; Thomas, L.H.; Altaner, C.M.; Callow, P.; Forsyth, V.T.; Apperley, D.C.; Kennedy, C.J.; Jarvis, M.C. Nanostructure of cellulose microfibrils in spruce wood. Proc. Natl. Acad. Sci. USA 2011, 108, E1195–E1203. [Google Scholar] [CrossRef] [PubMed] [Green Version]
- Kafle, K.; Shin, H.; Lee, C.M.; Park, S.; Kim, S.H. Progressive structural changes of Avicel, bleached softwood, and bacterial cellulose during enzymatic hydrolysis. Sci. Rep. 2015, 5, 1–10. [Google Scholar] [CrossRef] [Green Version]
- Salas-de la Cruz, D.; Green, M.D.; Ye, Y.; Elabd, Y.A.; Long, T.E.; Winey, K.I. Correlating backbone-to-backbone distance to ionic conductivity in amorphous polymerized ionic liquids. J. Polym. Sci. Part B Polym. Phys. 2012, 50, 338–346. [Google Scholar] [CrossRef]
- Lee, M.; Choi, U.H.; Salas-de la Cruz, D.; Mittal, A.; Winey, K.I.; Colby, R.H.; Gibson, H.W. Imidazolium polyesters: Structure–property relationships in thermal behavior, ionic conductivity, and morphology. Adv. Funct. Mater. 2011, 21, 708–717. [Google Scholar] [CrossRef]
- Ye, Y.; Elabd, Y.A. Anion exchanged polymerized ionic liquids: High free volume single ion conductors. Polymer 2011, 52, 1309–1317. [Google Scholar] [CrossRef]
- Johnson, K.L.; Kendall, K.; Roberts, A. Surface energy and the contact of elastic solids. Proc. R. Soc. Lond. A Math. Phys. Sci. 1971, 324, 301–313. [Google Scholar]
- Ebenstein, D.M.; Pruitt, L.A. Nanoindentation of biological materials. Nano Today 2006, 1, 26–33. [Google Scholar] [CrossRef]
- Notbohm, J.; Poon, B.; Ravichandran, G. Analysis of nanoindentation of soft materials with an atomic force microscope. J. Mater. Res. 2012, 27, 229–237. [Google Scholar] [CrossRef] [Green Version]
- Griffin, P.J.; Freyer, J.L.; Han, N.; Geller, N.; Yin, X.; Gheewala, C.D.; Lambert, T.H.; Campos, L.M.; Winey, K.I. Ion Transport in Cyclopropenium-Based Polymerized Ionic Liquids. Macromolecules 2018, 51, 1681–1687. [Google Scholar] [CrossRef]


| Composition | Coagulation | Side Chains | β-Sheets | Random Coils | Alpha Helices | Turns |
|---|---|---|---|---|---|---|
| 75/25 Silk-Cellulose | 10% EtOH | 0.92% | 20.56% | 29.16% | 18.37% | 30.98% |
| 75/25 Silk-Cellulose | 1% EtOH | 0.44% | 18.24% | 27.14% | 22.40% | 31.77% |
| 25/75 Silk-Cellulose | 10% EtOH | 1.08% | 17.12% | 33.36% | 19.42% | 29.02% |
| 25/75 Silk-Cellulose | 1% EtOH | 1.04% | 13.97% | 38.83% | 17.27% | 28.89% |
| 100 Silk | 100% EtOH | 5.71% | 46.71% | 15.36% | 10.93% | 21.29% |
| Composition | Coagulation | TOnset (°C) | TEnd (°C) | Wt. Loss (%) | T∆Max (°C) |
|---|---|---|---|---|---|
| 75/25 Silk-Cellulose | 10% EtOH | 225.8 | 319.6 | 67.95 | 229.5, 285.8 |
| 75/25 Silk-Cellulose | 1% EtOH | 213.8 | 310.2 | 67.63 | 233.4, 285.0 |
| 25/75 Silk-Cellulose | 10% EtOH | 223.4 | 305.6 | 65.95 | 243.3, 281.2, 317.0 |
| 25/75 Silk-Cellulose | 1% EtOH | 219.2 | 314.5 | 67.86 | 240.9, 280.7, 316.9 |
| 100 Silk | 100% EtOH | 251.5 | 305.4 | 53.48 | 278.1 |
| 100 Cellulose | 100% H2O | 219.9 | 295.0 | 64.74 | 238.2, 285.3, 317.5 |
| Composition | Coagulation | Tg (°C) | Tg (K) |
|---|---|---|---|
| 75/25 Silk-Cellulose | 10% EtOH | 128.58 | 401.73 |
| 75/25 Silk-Cellulose | 1% EtOH | 129.10 | 402.25 |
| 25/75 Silk-Cellulose | 10% EtOH | 133.07 | 406.22 |
| 25/75 Silk-Cellulose | 1% EtOH | 127.30 | 400.45 |
| 100 Silk | 100% EtOH | 137.98 | 411.13 |
| 100 Cellulose | 100% H2O | 128.68 | 401.83 |
| Peak Position | q (nm−1) | |||
|---|---|---|---|---|
| d (nm) | ||||
| 25/75 Silk-Cellulose | 75/25 Silk-Cellulose | |||
| 1% EtOH | 10% EtOH | 1% EtOH | 10% EtOH | |
| 1 | 8.83 0.71 | 8.83 0.71 | 8.40 0.75 | 8.40 0.75 |
| 2 | 14.40 0.44 | 14.40 0.44 | 14.40 0.44 | 14.40 0.44 |
| 3 | 20.27 0.31 | 20.27 0.31 | 20.27 0.31 | 20.27 0.31 |
| 4 | 25.15 0.25 | 25.15 0.25 | 24.79 0.23 | 24.79 0.23 |
| 5 | 29.43 0.21 | 29.43 0.21 | 29.43 0.21 | 29.43 0.21 |
| Peak Position | q (nm−1) d (nm) | Sample | Peak Position | q (nm−1) d (nm) | Sample |
|---|---|---|---|---|---|
| a | 5.42 1.16 | Regenerated 100% Silk | g | 1.31 4.80 | Regenerated 100% Cellulose |
| b | 14.45 0.44 | h | 8.78 0.72 | ||
| c | 17.67 0.36 | i | 14.32 0.44 | ||
| d | 22.52 0.28 | j | 15.66 0.40 | ||
| e | 28.66 0.22 | k | 20.56 0.30 | ||
| f | 31.40 0.20 | l | 24.9 0.25 | ||
| m | 29.66 0.21 |
© 2020 by the authors. Licensee MDPI, Basel, Switzerland. This article is an open access article distributed under the terms and conditions of the Creative Commons Attribution (CC BY) license (http://creativecommons.org/licenses/by/4.0/).
Share and Cite
Blessing, B.; Trout, C.; Morales, A.; Rybacki, K.; Love, S.A.; Lamoureux, G.; O’Malley, S.M.; Hu, X.; Salas-de la Cruz, D. The Impact of Composition and Morphology on Ionic Conductivity of Silk/Cellulose Bio-Composites Fabricated from Ionic Liquid and Varying Percentages of Coagulation Agents. Int. J. Mol. Sci. 2020, 21, 4695. https://doi.org/10.3390/ijms21134695
Blessing B, Trout C, Morales A, Rybacki K, Love SA, Lamoureux G, O’Malley SM, Hu X, Salas-de la Cruz D. The Impact of Composition and Morphology on Ionic Conductivity of Silk/Cellulose Bio-Composites Fabricated from Ionic Liquid and Varying Percentages of Coagulation Agents. International Journal of Molecular Sciences. 2020; 21(13):4695. https://doi.org/10.3390/ijms21134695
Chicago/Turabian StyleBlessing, Bailey, Cory Trout, Abneris Morales, Karleena Rybacki, Stacy A. Love, Guillaume Lamoureux, Sean M. O’Malley, Xiao Hu, and David Salas-de la Cruz. 2020. "The Impact of Composition and Morphology on Ionic Conductivity of Silk/Cellulose Bio-Composites Fabricated from Ionic Liquid and Varying Percentages of Coagulation Agents" International Journal of Molecular Sciences 21, no. 13: 4695. https://doi.org/10.3390/ijms21134695