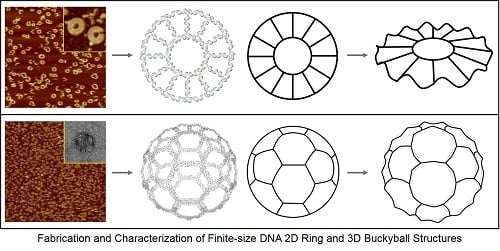
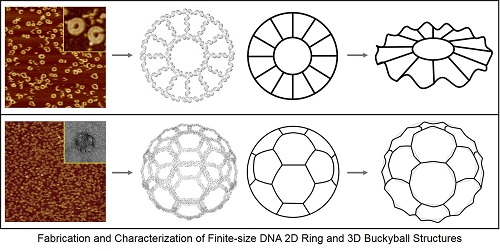
Fabrication and Characterization of Finite-Size DNA 2D Ring and 3D Buckyball Structures

 ,
,
Abstract
:
1. Introduction
2. Results
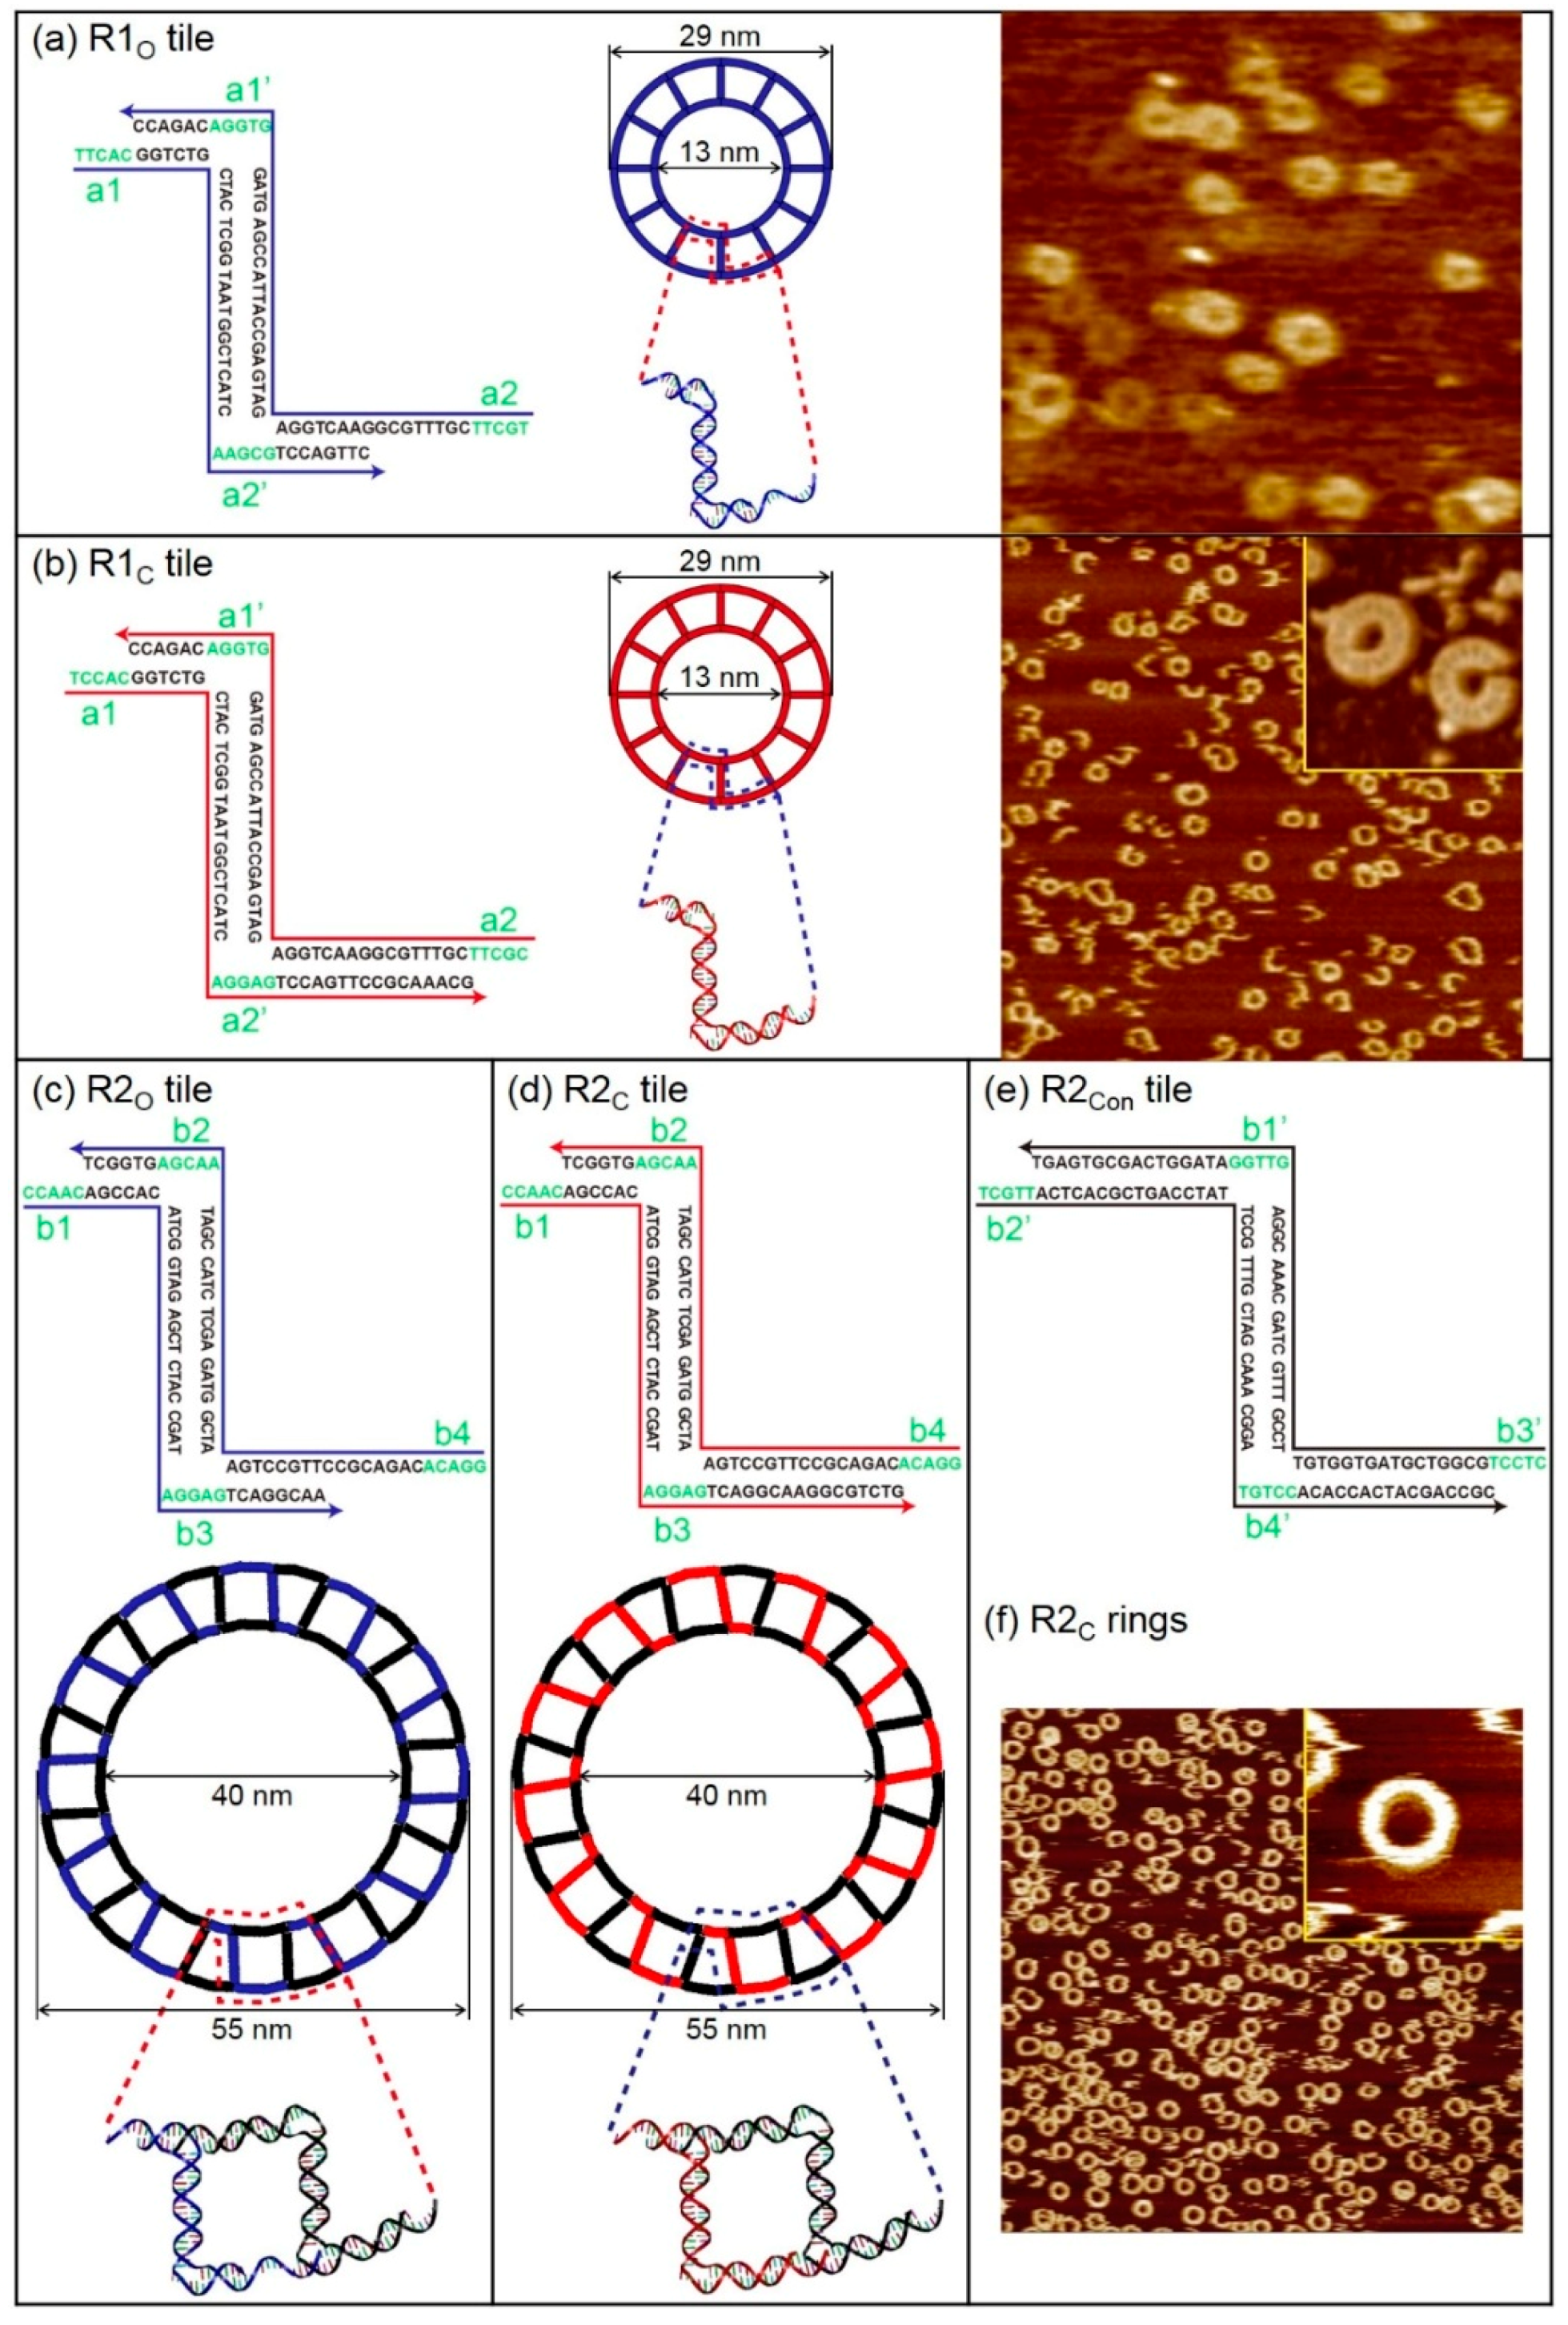
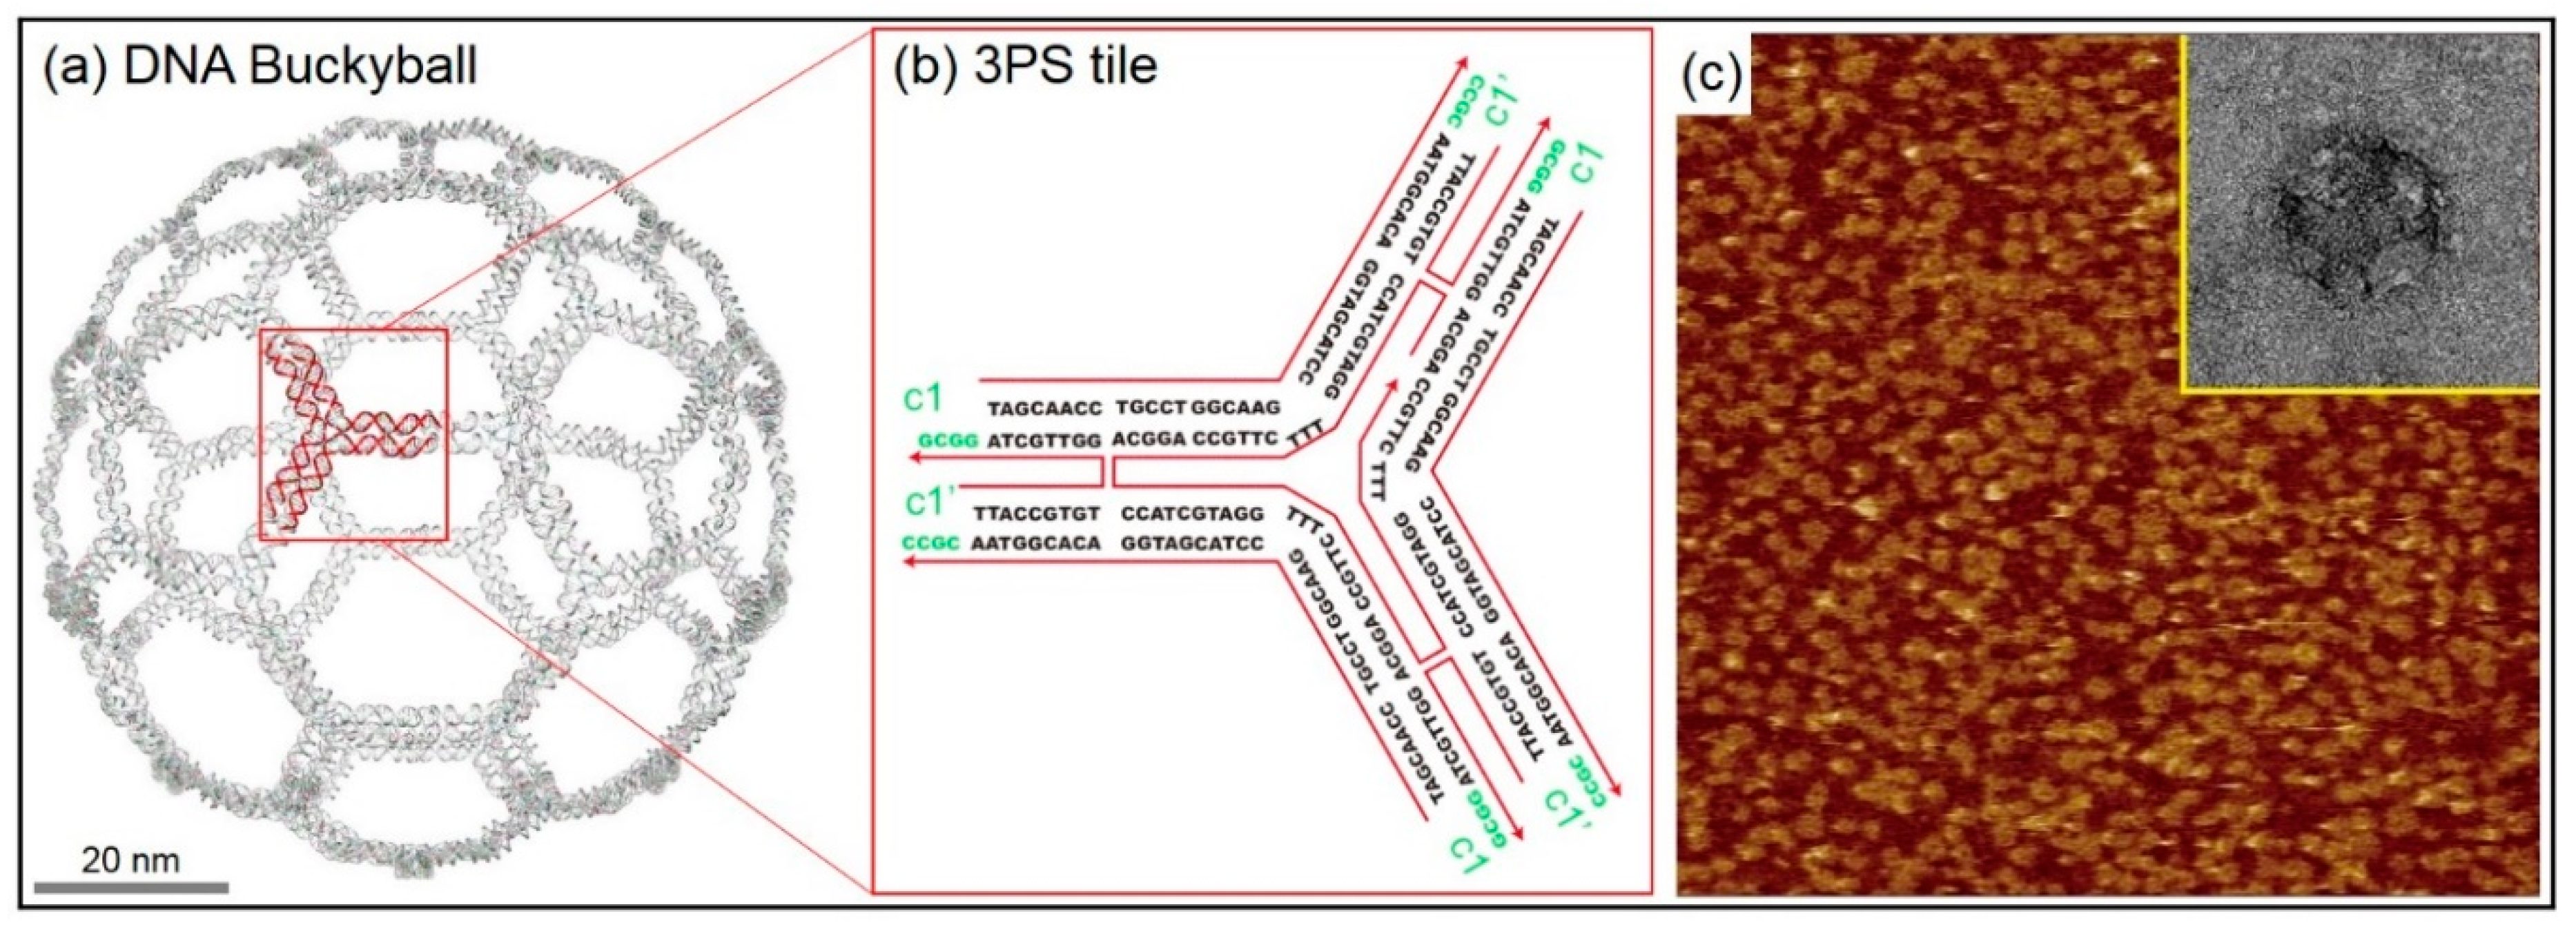
2.1. DNA 2D Ring and 3D Buckyball Synthesis Results
2.2. Normal Mode Analysis Results of DNA 2D Ring and 3D Buckyball Structures
3. Discussion
4. Materials and Methods
4.1. Synthesis Method
4.2. AFM and TEM Measurements
4.3. Mass-Weighted Chemical Elastic Network Model (MWCENM)
4.4. Symmetry-Constrained Elastic Network Model (SCENM)
4.5. Normal Mode Analysis (NMA)
Supplementary Materials
Author Contributions
Funding
Conflicts of Interest
References
- Nummelin, S.; Kommeri, J.; Kostiainen, M.A.; Linko, V. Evolution of structural DNA nanotechnology. Adv. Mater. 2018, 30, 1703721. [Google Scholar] [CrossRef] [PubMed]
- Wang, P.; Meyer, T.A.; Pan, V.; Dutta, P.K.; Ke, Y. The beauty and utility of DNA origami. Chem 2017, 2, 359–382. [Google Scholar] [CrossRef]
- Bathe, M.; Rothemund, P.W.K. DNA nanotechnology: A foundation for programmable nanoscale materials. MRS Bull. 2017, 42, 882–888. [Google Scholar] [CrossRef]
- Yin, P.; Hariadi, R.F.; Sahu, S.; Choi, H.M.; Park, S.H.; LaBean, T.H.; Reif, J.H. Programming DNA tube circumferences. Science 2008, 321, 824–826. [Google Scholar] [CrossRef] [PubMed]
- Winfree, E.; Liu, F.; Wenzler, L.A.; Seeman, N.C. Design and self-assembly of two-dimensional DNA crystals. Nature 1998, 394, 539–544. [Google Scholar] [CrossRef] [PubMed]
- Liu, D.; Wang, M.; Deng, Z.; Walulu, R.; Mao, C. Tensegrity: Construction of rigid DNA triangle with flexible four-arm DNA junctions. J. Am. Chem. Soc. 2004, 126, 2324–2325. [Google Scholar] [CrossRef] [PubMed]
- Hamada, S.; Murata, S. Substrate-assisted assembly of interconnected single-duplex DNA nanostructures. Angew. Chem. Int. Ed. Engl. 2009, 48, 6820–6823. [Google Scholar] [CrossRef] [PubMed]
- Zheng, J.; Birktoft, J.J.; Chen, Y.; Wang, T.; Sha, R.; Constantinou, P.E.; Ginell, S.L.; Mao, C.; Seeman, N.C. From molecular to macroscopic via the rational design of a self-assembled 3D DNA crystal. Nature 2009, 461, 74–77. [Google Scholar] [CrossRef] [PubMed] [Green Version]
- Rothemund, P.W.K. Folding DNA to create nanoscale shapes and patterns. Nature 2006, 440, 297–302. [Google Scholar] [CrossRef] [PubMed] [Green Version]
- Wei, B.; Dai, M.; Yin, P. Complex shapes self-assembled from single-stranded DNA tiles. Nature 2012, 485, 623–626. [Google Scholar] [CrossRef] [PubMed] [Green Version]
- Ke, Y.; Ong, L.L.; Shih, W.M.; Yin, P. Three-dimensional structures self-assembled from DNA bricks. Science 2012, 338, 1177–1183. [Google Scholar] [CrossRef] [PubMed]
- Lee, J.; Hamada, S.; Amin, R.; Kim, S.; Kulkarni, A.; Kim, T.; Roh, Y.; Murata, S.; Park, S.H. Size-controllable DNA rings with copper-ion modification. Small 2012, 8, 374–377. [Google Scholar] [CrossRef] [PubMed]
- Kim, J.; Lee, J.; Hamada, S.; Murata, S.; Park, S.H. Self-replication of DNA rings. Nat. Nanotechnol. 2015, 10, 528–533. [Google Scholar] [CrossRef] [PubMed]
- Chen, J.; Seeman, N.C. Synthesis from DNA of a molecule with the connectivity of a cube. Nature 1991, 350, 631–633. [Google Scholar] [CrossRef] [PubMed]
- Shih, W.M.; Quispe, J.D.; Joyce, G.F. A 1.7-kilobase single-stranded DNA that folds into a nanoscale octahedron. Nature 2004, 427, 618–621. [Google Scholar] [CrossRef] [PubMed]
- He, Y.; Ye, T.; Su, M.; Zhang, C.; Ribbe, A.E.; Jiang, W.; Mao, C. Hierarchical self-assembly of DNA into symmetric supramolecular polyhedra. Nature 2008, 452, 198–201. [Google Scholar] [CrossRef] [PubMed] [Green Version]
- Douglas, S.M.; Dietz, H.; Liedl, T.; Hogberg, B.; Graf, F.; Shih, W.M. Self-assembly of DNA into nanoscale three-dimensional shapes. Nature 2009, 459, 414–418. [Google Scholar] [CrossRef] [PubMed]
- Bahar, I.; Rader, A.J. Coarse-grained normal mode analysis in structural biology. Curr. Opin. Struct. Biol. 2005, 15, 586–592. [Google Scholar] [CrossRef] [PubMed] [Green Version]
- Kim, M.H.; Seo, S.; Jeong, J.I.; Kim, B.J.; Liu, W.K.; Lim, B.S.; Choi, J.B.; Kim, M.K. A mass weighted chemical elastic network model elucidates closed form domain motions in proteins. Protein Sci. 2013, 22, 605–613. [Google Scholar] [CrossRef] [PubMed] [Green Version]
- Kim, B.; Jo, S.; Son, J.; Kim, J.; Kim, M.H.; Hwang, S.U.; Dugasani, S.R.; Kim, B.D.; Liu, W.K.; Kim, M.K.; et al. Ternary and senary representations using DNA double-crossover tiles. Nanotechnology 2014, 25, 105601. [Google Scholar] [CrossRef] [PubMed] [Green Version]
- Jo, S.; Son, J.; Lee, B.H.; Dugasani, S.R.; Park, S.H.; Kim, M.K. Vibrational characteristics of DNA nanostructures obtained through a mass-weighted chemical elastic network model. RSC Adv. 2017, 7, 47190–47195. [Google Scholar] [CrossRef] [Green Version]
- Isami, S.; Sakamoto, N.; Nishimori, H.; Awazu, A. Simple elastic network models for exhaustive analysis of long double-stranded DNA dynamics with sequence geometry dependence. PLoS ONE 2015, 10, e0143760. [Google Scholar] [CrossRef] [PubMed]
- Gonzalez, A.L.; Teixidó, J.; Borrell, J.I.; Estrada-Tejedor, R. On the applicability of elastic network models for the study of RNA CUG trinucleotide repeat overexpansion. PLoS ONE 2016, 11, e0152049. [Google Scholar] [CrossRef] [PubMed]
- Pinamonti, G.; Bottaro, S.; Micheletti, C.; Bussi, G. Elastic network models for RNA: A comparative assessment with molecular dynamics and SHAPE experiments. Nucleic Acids Res. 2015, 43, 7260–7269. [Google Scholar] [CrossRef] [PubMed]
- Zimmermann, M.T.; Jernigan, R.L. Elastic network models capture the motions apparent within ensembles of RNA structures. RNA 2014, 20, 792–804. [Google Scholar] [CrossRef] [PubMed]
- Setny, P.; Zacharias, M. Elastic network models of nucleic acids flexibility. J. Chem. Theory Comput. 2013, 9, 5460–5470. [Google Scholar] [CrossRef] [PubMed]
- Qian, P.F.; Seo, S.; Kim, J.; Kim, S.; Lim, B.S.; Liu, W.K.; Kim, B.J.; LaBean, T.H.; Park, S.H.; Kim, M.K. DNA nanotube formation based on normal mode analysis. Nanotechnology 2012, 23, 105704. [Google Scholar] [CrossRef] [PubMed]
- Son, J.; Jo, S.; Song, Y.; Lee, B.H.; Kim, M.K.; Kim, B.D.; Park, S.H. Construction of foldback intercoil DNA nanostructures and analysis of their vibrational modes. J. Phys. Chem. C 2018, 122, 2890–2896. [Google Scholar] [CrossRef]
- Hu, G.; He, L.; Iacovelli, F.; Falconi, M. Intrinsic dynamics analysis of a DNA octahedron by elastic network model. Molecules 2017, 22, 145. [Google Scholar] [CrossRef] [PubMed]
- Afonin, K.A.; Kasprzak, W.; Bindewald, E.; Puppala, P.S.; Diehl, A.R.; Hall, K.T.; Kim, T.J.; Zimmermann, M.T.; Jernigan, R.L.; Jaeger, L.; et al. Computational and experimental characterization of RNA cubic nanoscaffolds. Methods 2014, 67, 256–265. [Google Scholar] [CrossRef] [PubMed] [Green Version]
- Alves, C.; Iacovelli, F.; Falconi, M.; Cardamone, F.; Morozzo della Rocca, B.; de Oliveira, C.L.P.; Desideri, A. A simple and fast semiautomatic procedure for the atomistic modeling of complex DNA polyhedra. J. Chem. Inf. Model. 2016, 56, 941–949. [Google Scholar] [CrossRef] [PubMed]
- Lee, H.; Seo, S.; Kim, M.H.; Choi, J.B.; Kim, S.M.; Jeon, T.J.; Kim, M.K. Opening and closing of a toroidal group II chaperonin revealed by a symmetry constrained elastic network model. Protein Sci. 2014, 23, 703–713. [Google Scholar] [CrossRef] [PubMed]
- Conway, J.F.; Wikoff, W.R.; Cheng, N.; Duda, R.L.; Hendrix, R.W.; Johnson, J.E.; Steven, A.C. Virus maturation involving large subunit rotations and local refolding. Science 2001, 292, 744–748. [Google Scholar] [CrossRef] [PubMed]
- Schuyler, A.D.; Chirikjian, G.S. Normal mode analysis of proteins: A comparison of rigid cluster modes with Cα coarse graining. J. Mol. Graph. Model. 2004, 22, 183–193. [Google Scholar] [CrossRef]
- Tozzini, V. Coarse-grained models for proteins. Curr. Opin. Cell Biol. 2005, 15, 144–150. [Google Scholar] [CrossRef] [PubMed]
- Doruker, P.; Atilgan, A.R.; Bahar, I. Dynamics of proteins predicted by molecular dynamics simulations and analytical approaches: Application to alpha-amylase inhibitor. Proteins 2000, 40, 512–524. [Google Scholar] [CrossRef]
- Atilgan, A.R.; Durell, S.R.; Jernigan, R.L.; Demirel, M.C.; Keskin, O.; Bahar, I. Anisotropy of fluctuation dynamics of proteins with an elastic network model. Biophys. J. 2001, 80, 505–515. [Google Scholar] [CrossRef]
- Hinsen, K. Analysis of domain motions by approximate normal mode calculations. Proteins 1998, 33, 417–429. [Google Scholar] [CrossRef]
- Kim, M.K.; Jernigan, R.L.; Chirikjian, G.S. An elastic network model of HK97 capsid maturation. J. Struct. Biol. 2003, 143, 107–117. [Google Scholar] [CrossRef]
- Lee, B.H.; Jo, S.; Choi, M.; Kim, M.H.; Choi, J.B.; Kim, M.K. Normal mode analysis of Zika virus. Comput. Biol. Chem. 2018, 72, 53–61. [Google Scholar] [CrossRef] [PubMed]
- Kim, M.H.; Lee, B.H.; Kim, M.K. Robust elastic network model: A general modeling for precise understanding of protein dynamics. J. Struct. Biol. 2015, 190, 338–347. [Google Scholar] [CrossRef] [PubMed]


| Mode Number | Mode Shape | ||||
|---|---|---|---|---|---|
| R1o Ring | R1c Ring | R2o Ring | R2c Ring | Buckyball | |
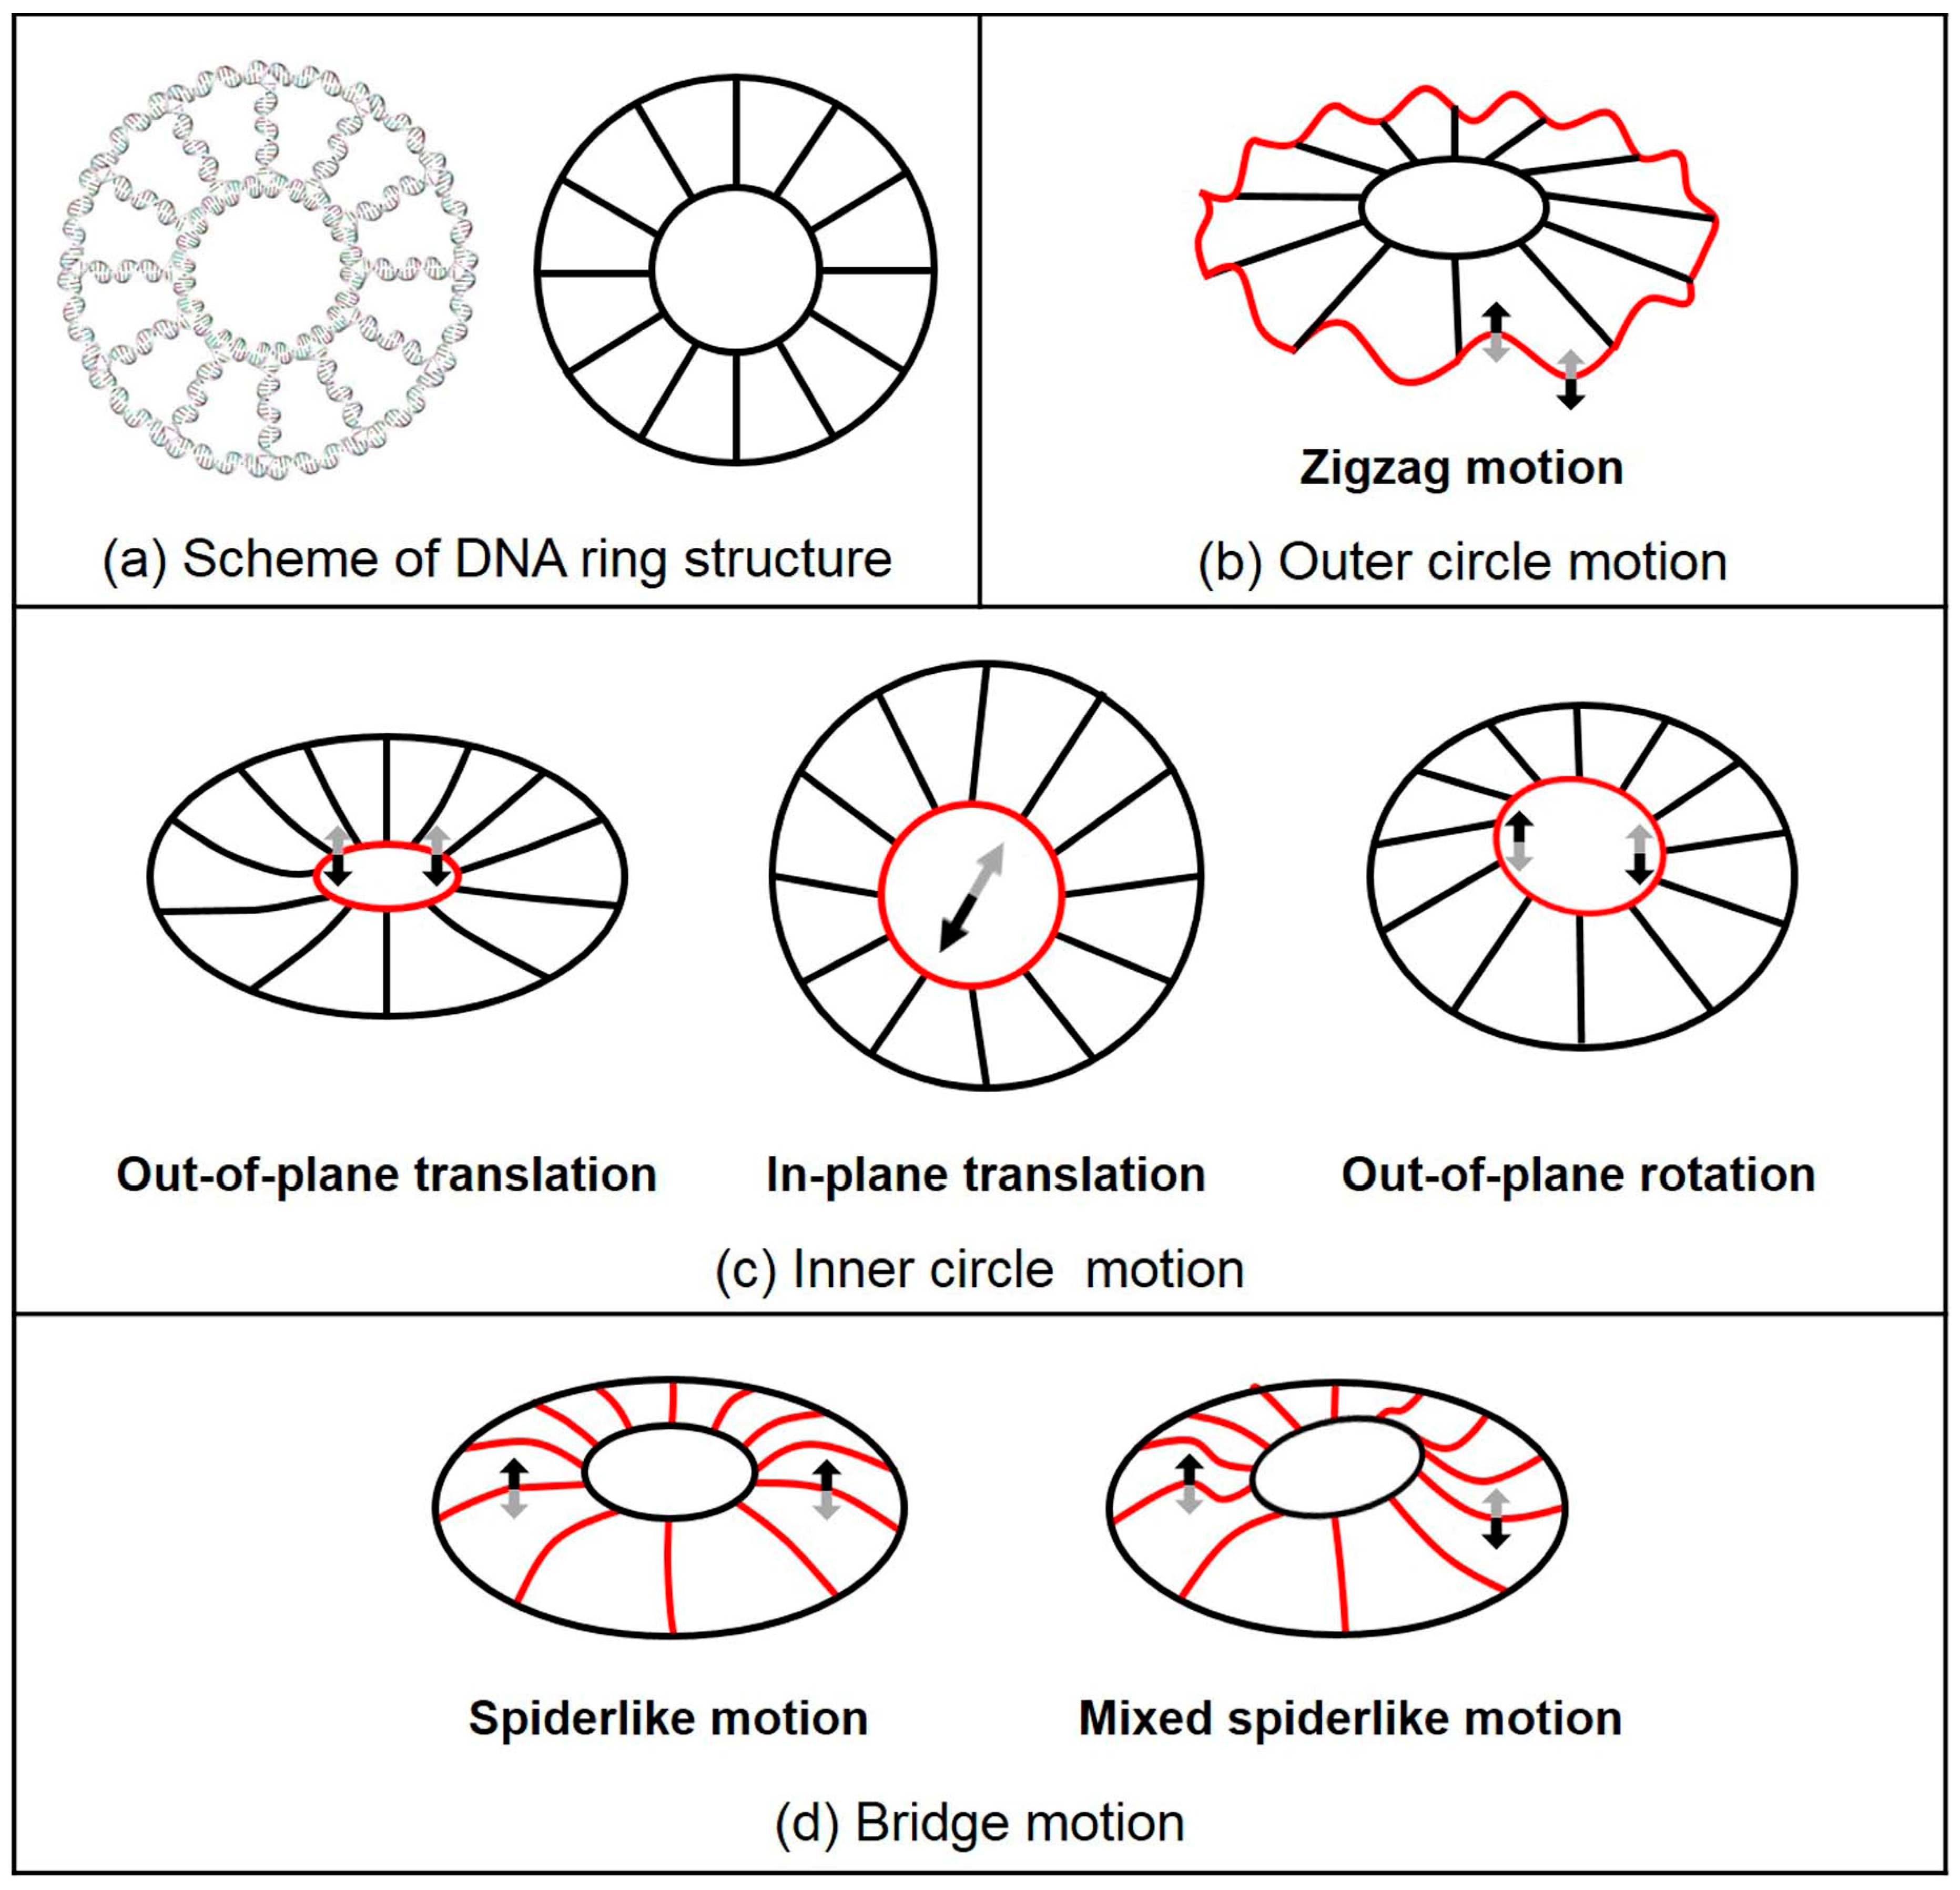
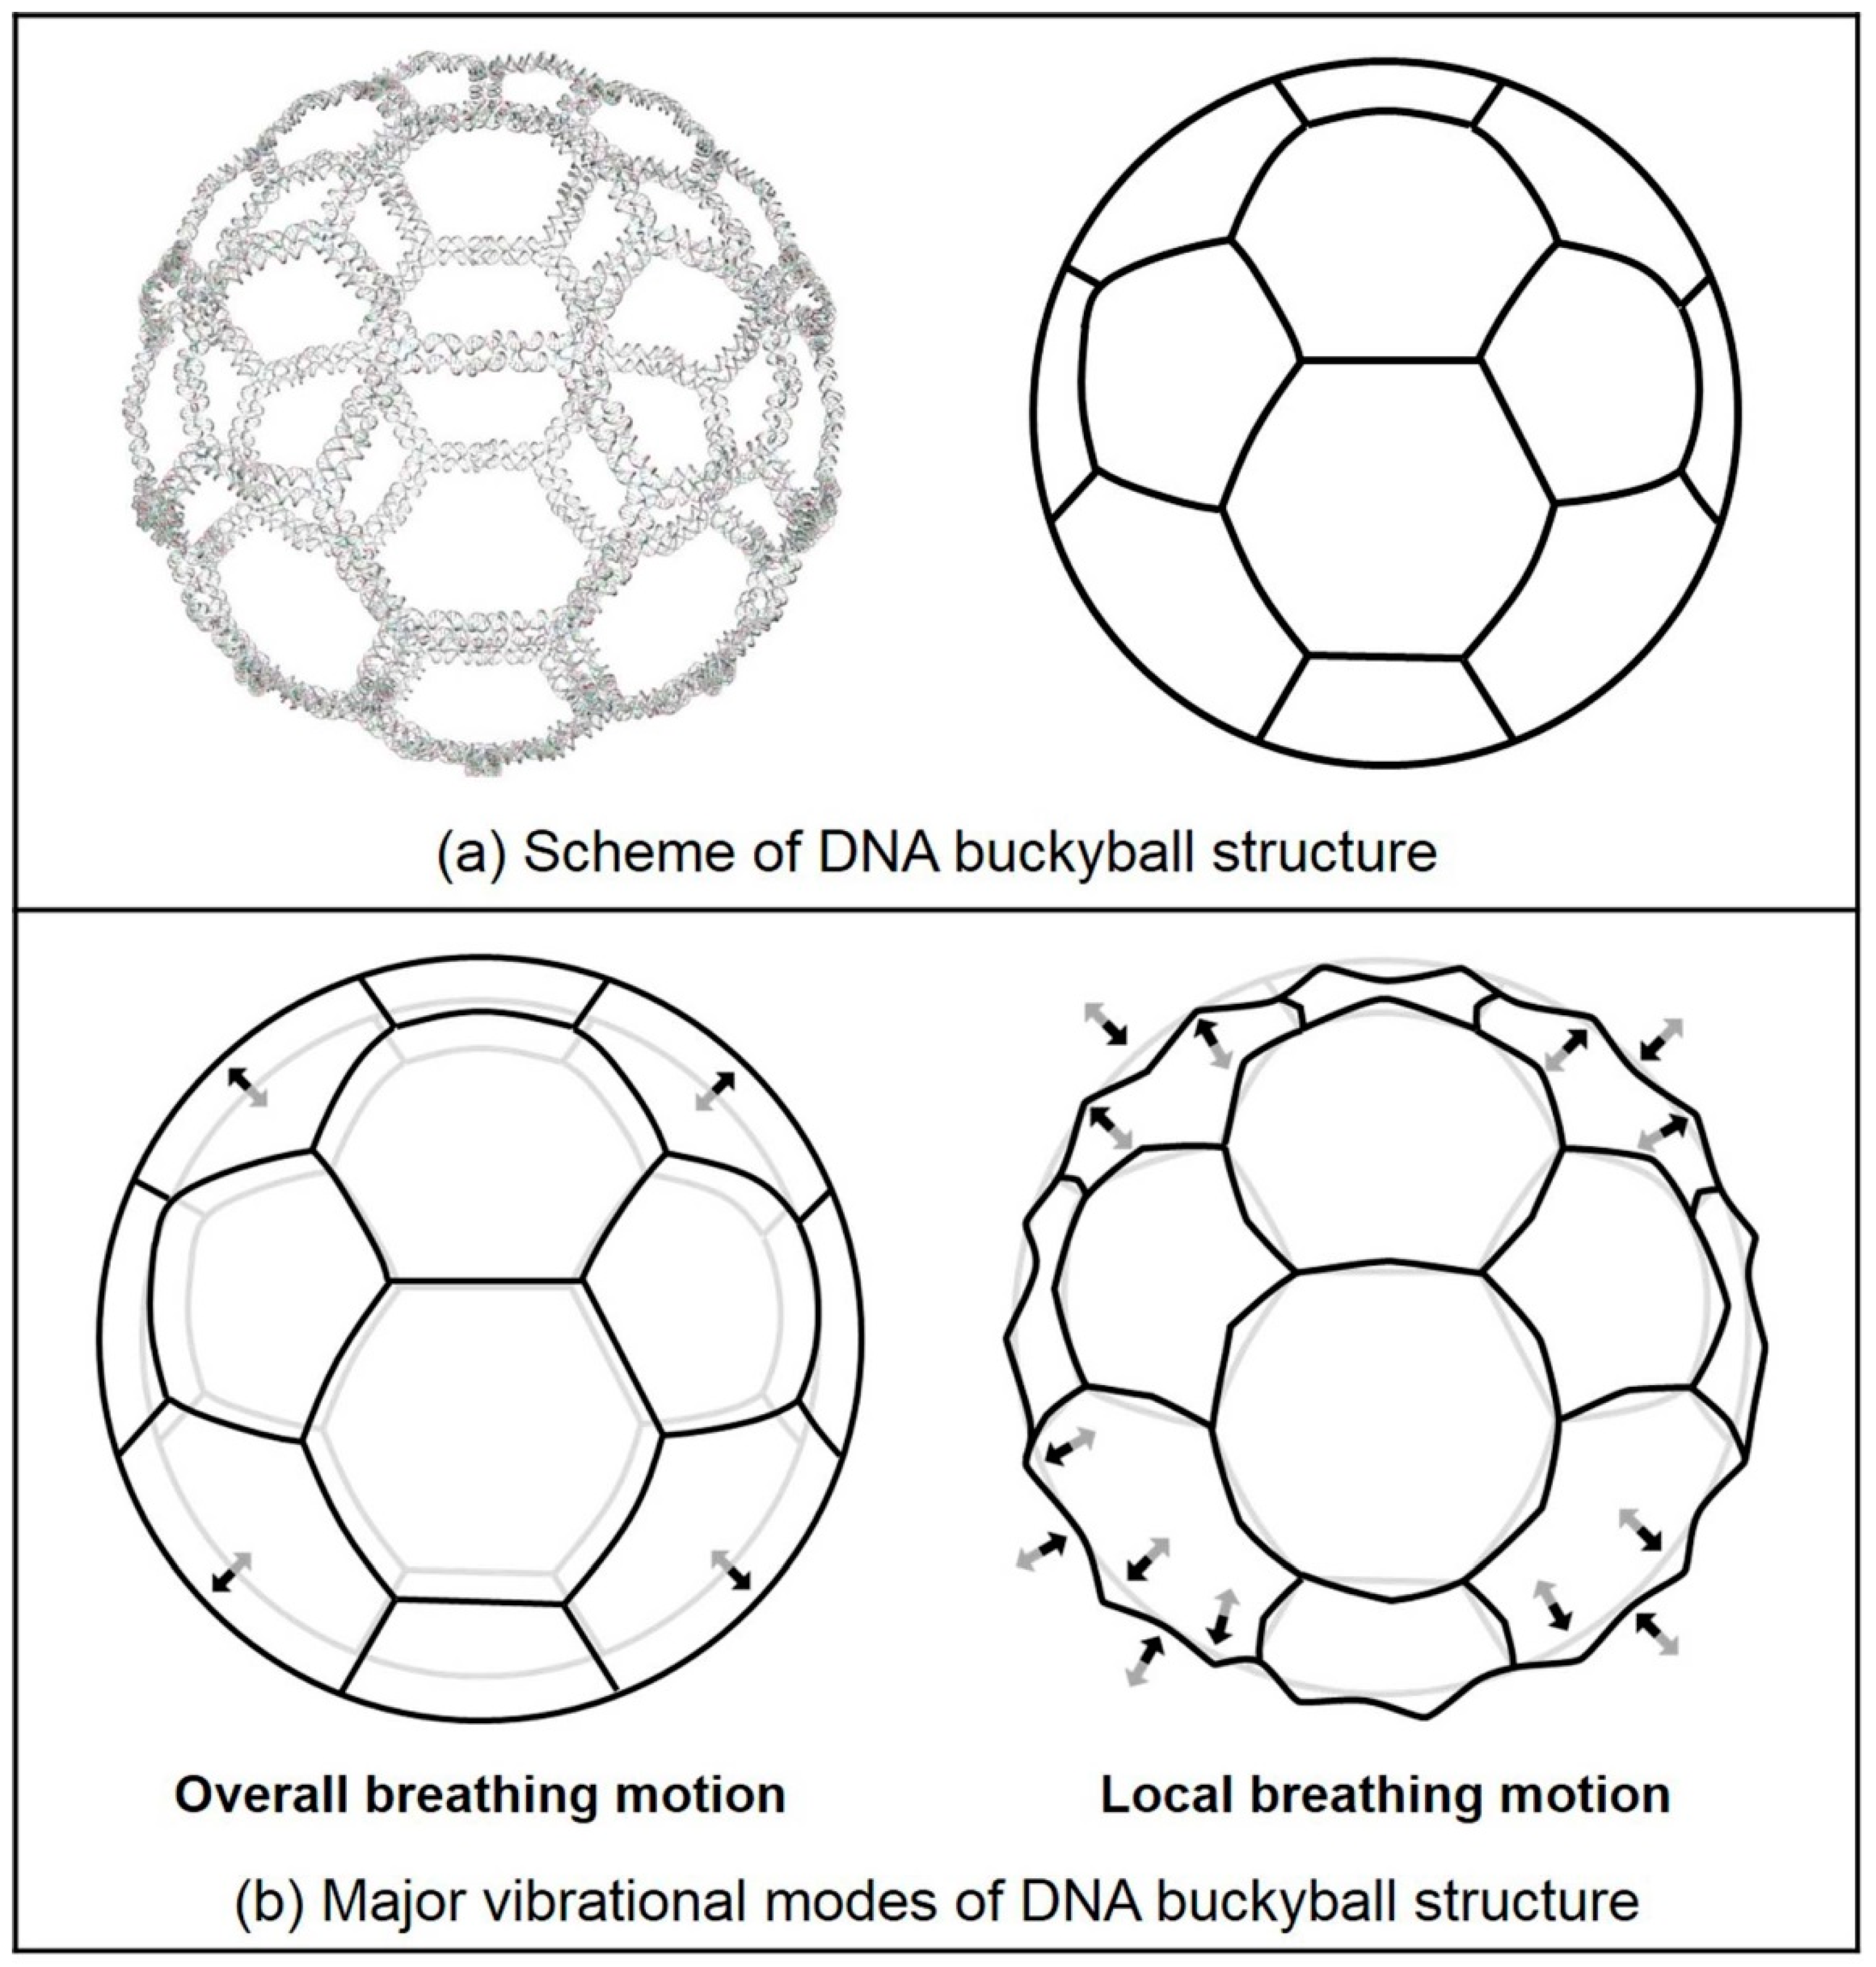
| Mode 1 | O-T a motion | O-T motion | O-T motion | O-T motion | O-B e motion |
| Mode 2 | O-R b motion | O-R motion | O-R motion | O-R motion | O-B motion |
| Mode 3 | O-R motion | O-R motion | O-R motion | O-R motion | Torsional motion |
| Mode 4 | Spiderlike motion | Spiderlike motion | Zigzag motion | Zigzag motion | L-B f motion |
| Mode 5 | M-S c motion | M-S motion | Zigzag motion | Zigzag motion | L-B motion |
| Mode 6 | M-S motion | M-S motion | Zigzag motion | Zigzag motion | L-B motion |
| Mode 7 | Spiderlike motion | I-T d motion | Zigzag motion | Zigzag motion | L-B motion |
| Mode 8 | Mixed motion | I-T motion | Zigzag motion | Zigzag motion | Mixed motion |
| Mode 9 | Mixed motion | Mixed motion | Mixed motion | Zigzag motion | Mixed motion |
| Mode 10 | Mixed motion | Mixed motion | Zigzag motion | Mixed motion | Mixed motion |
| Chemical Bond | Spring Constant (N/m) |
|---|---|
| Van der Waals | 7 |
| Hydrogen bond | 70 |
| Ion bond | 70 |
| Disulfide bond | 700 |
| Covalent bond | 700 |
© 2018 by the authors. Licensee MDPI, Basel, Switzerland. This article is an open access article distributed under the terms and conditions of the Creative Commons Attribution (CC BY) license (http://creativecommons.org/licenses/by/4.0/).
Share and Cite
Jo, S.; Kim, S.; Lee, B.H.; Tandon, A.; Kim, B.; Park, S.H.; Kim, M.K. Fabrication and Characterization of Finite-Size DNA 2D Ring and 3D Buckyball Structures. Int. J. Mol. Sci. 2018, 19, 1895. https://doi.org/10.3390/ijms19071895
Jo S, Kim S, Lee BH, Tandon A, Kim B, Park SH, Kim MK. Fabrication and Characterization of Finite-Size DNA 2D Ring and 3D Buckyball Structures. International Journal of Molecular Sciences. 2018; 19(7):1895. https://doi.org/10.3390/ijms19071895
Chicago/Turabian StyleJo, Soojin, Seungjae Kim, Byung Ho Lee, Anshula Tandon, Byunghoon Kim, Sung Ha Park, and Moon Ki Kim. 2018. "Fabrication and Characterization of Finite-Size DNA 2D Ring and 3D Buckyball Structures" International Journal of Molecular Sciences 19, no. 7: 1895. https://doi.org/10.3390/ijms19071895