Article

Arabidopsis Myrosinase Genes AtTGG4 and AtTGG5 Are Root-Tip Specific and Contribute to Auxin Biosynthesis and Root-Growth Regulation

Institute of Tropical Bioscience and Biotechnology, Key Laboratory of Tropical Crops Biology and Genetic Resources, Ministry of Agriculture; Hainan Bioenergy Center, Chinese Academy of Tropical Agricultural Sciences, Xueyuan Road 4, Haikou 571101, China
*
Author to whom correspondence should be addressed.
These authors contributed equally to this work.
Int. J. Mol. Sci. 2016, 17(6), 892; https://doi.org/10.3390/ijms17060892
Submission received: 27 April 2016 / Revised: 31 May 2016 / Accepted: 2 June 2016 / Published: 7 June 2016
(This article belongs to the Section Molecular Plant Sciences)

Abstract

:
Plant myrosinases (β-thioglucoside glucohydrolases) are classified into two subclasses, Myr I and Myr II. The biological function of Myr I has been characterized as a major biochemical defense against insect pests and pathogens in cruciferous plants. However, the biological function of Myr II remains obscure. We studied the function of two Myr II member genes AtTGG4 and AtTGG5 in Arabidopsis. RT-PCR showed that both genes were specifically expressed in roots. GUS-assay revealed that both genes were expressed in the root-tip but with difference: AtTGG4 was expressed in the elongation zone of the root-tip, while AtTGG5 was expressed in the whole root-tip. Moreover, myrosin cells that produce and store the Myr I myrosinases in aboveground organs were not observed in roots, and AtTGG4 and AtTGG5 were expressed in all cells of the specific region. A homozygous double mutant line tgg4tgg5 was obtained through cross-pollination between two T-DNA insertion lines, tgg4E8 and tgg5E12, by PCR-screening in the F2 and F3 generations. Analysis of myrosinase activity in roots of mutants revealed that AtTGG4 and AtTGG5 had additive effects and contributed 35% and 65% myrosinase activity in roots of the wild type Col-0, respectively, and myrosinase activity in tgg4tgg5 was severely repressed. When grown in Murashiege & Skoog (MS) medium or in soil with sufficient water, Col-0 had the shortest roots, and tgg4tgg5 had the longest roots, while tgg4E8 and tgg5E12 had intermediate root lengths. In contrast, when grown in soil with excessive water, Col-0 had the longest roots, and tgg4tgg5 had the shortest roots. These results suggested that AtTGG4 and AtTGG5 regulated root growth and had a role in flood tolerance. The auxin-indicator gene DR5::GUS was then introduced into tgg4tgg5 by cross-pollination. DR5::GUS expression patterns in seedlings of F1, F2, and F3 generations indicated that AtTGG4 and AtTGG5 contributed to auxin biosynthesis in roots. The proposed mechanism is that indolic glucosinolate is transported to the root-tip and converted to indole-3-acetonitrile (IAN) in the tryptophan-dependent pathways by AtTGG4 and AtTGG5, and IAN is finally converted to indole-3-acetic acid (IAA) by nitrilases in the root-tip. This mechanism guarantees the biosynthesis of IAA in correct cells of the root-tip and, thus, a correct auxin gradient is formed for healthy development of roots.

Graphical Abstract

1. Introduction

Glucosinolates are a group of S-linked secondary metabolites, occurring in the order Capparales, including the cruciferous crops and the model plant Arabidopsis thaliana [1,2,3]. These compounds are derived from amino acids and modified amino acids and, thus, more than 140 glucosinolate structures have been identified [4]. In A. thaliana, at least 37 glucosinolates with side chains derived from methionine, tryptophan, phenylalanine, and leucine were identified [5]. The glucosinolate profile in a certain cruciferous plant may also change at qualitative and quantitative levels during plant development and/or upon biotic and abiotic stresses, through regulated biosynthesis, and breakdown of glucosinolates [6,7,8,9].
Glucosinolates are hydrolyzed by a class of myrosinases (β-thioglucoside glucohydrolases, TGG, EC 3.2.1.147) into toxic compounds, such as nitriles, isothiocyanates, epithionitriles, and thiocyanates. Therefore, the glucosinolate-myrosinase system serves as a major chemical defense mechanism against pest insects, and bacterial and fungal pathogens [1,10]. Myrosinases are composed of two subfamilies, Myr I and Myr II [11]. Myr I activity has been detected in all of the glucosinolate-containing plants and tissues that have been investigated, and the coding genes have been cloned from Sinapis alba [12], Brassica napus [13], and A. thaliana [14,15]. All crucifers analyzed so far have multiple forms of Myr I. In oilseed rape (B. napus), about 25–30 myrosinase isoforms may be present [1]. These myrosinases were classified to MA, MB, and MC subfamilies, and were later grouped into a single Myr I subclass when the new type of myrosinases Myr II were identified [11,16]. The Myr I myrosinases are usually localized in specialized myrosin cells in all tissues of Brassica species and A. thaliana [17,18,19,20], while the substrate glucosinolates are localized in the “aleurone-like” cells in the seedlings [21] and/or “S-cells” in flower stalk [22]. Myrosinases and glucosinolates are mixed upon tissue disruption by pest insects and pathogens, thus providing chemical defense.
AtTGG4 and AtTGG5 were the first found Myr II genes [23,24], and their myrosinase activities of the recombinant proteins were confirmed by over-expressing the genes in Pichia [24]. Another member AtTGG6 in A. thaliana was previously considered as a pseudogene due to several frame-shift mutations [25], but it was specifically expressed in anthers, similar to AtTGG3, another myrosinase pseudogene in A. thaliana [26]. However, functional alleles of AtTGG6 were identified in some A. thaliana ecotypes recently [27].
Myr II subfamily members are distinct from Myr I subfamily members not only by sequence divergence, but also by gene structure and unusual intron utilization. To our knowledge, all Myr I subfamily genes have 12 exons, while Myr II have 13 exons. Unusual intron splice boundaries are present in myrosinase genes [28]. All known Myr I myrosinases use the GC..AG intron splice border for intron 1. However, the Myr II member genes AtTGG4, AtTGG5, and AtTGG6 in A. thaliana and AlTGG4, AlTGG5, and AlTGG6 in Arabidopsis lyrata use the GC..AG splice border for intron 10 instead [11,27], suggesting a different evolutionary scenario of Myr I and Myr II genes. In addition, AtTGG5 has a second GC..AG intron splice border for intron 3. It is unknown why myrosinase genes use rare intron splicing at such a high frequency. Two Myr II member genes CpTGG1 and CpTGG2 were cloned from Carica papaya [11,16]. These two myrosinase genes contained conserved Myr II gene structure, however, they did not contain any unusual intron splicing border, supporting the hypothesis that CpTGG1 and CpTGG2 were the primitive form of myrosinase genes, and Myr II subfamily may represent the ancestor of myrosinase family [11,16]. Myrosinase was suggested to be evolved from cyanogenic O-β-glucosidase [1]. However, none of the characterized genes of cyanogenic O-β-glucosidase contain an unusual intron splice border, and papaya is the rare plant species that contain both glucosinolates and cyanogenic O-β-glucosides [29,30,31].
The biological function of Myr I myrosinases has been extensively studied, however, the function of Myr II members remain poorly understood. In this study, we report the involvement of two Myr II members, AtTGG4 and AtTGG5, in auxin biosynthesis and root growth regulation.

2. Results

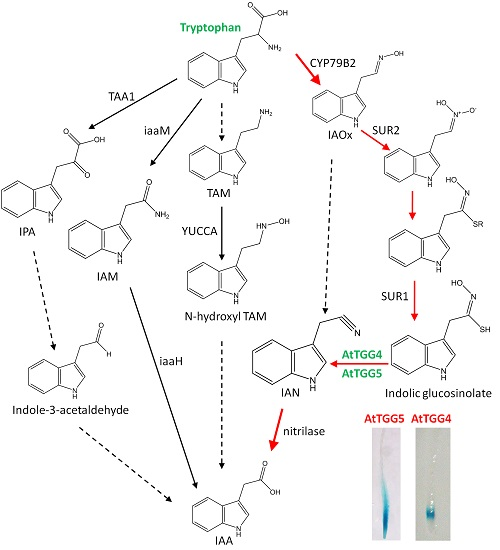
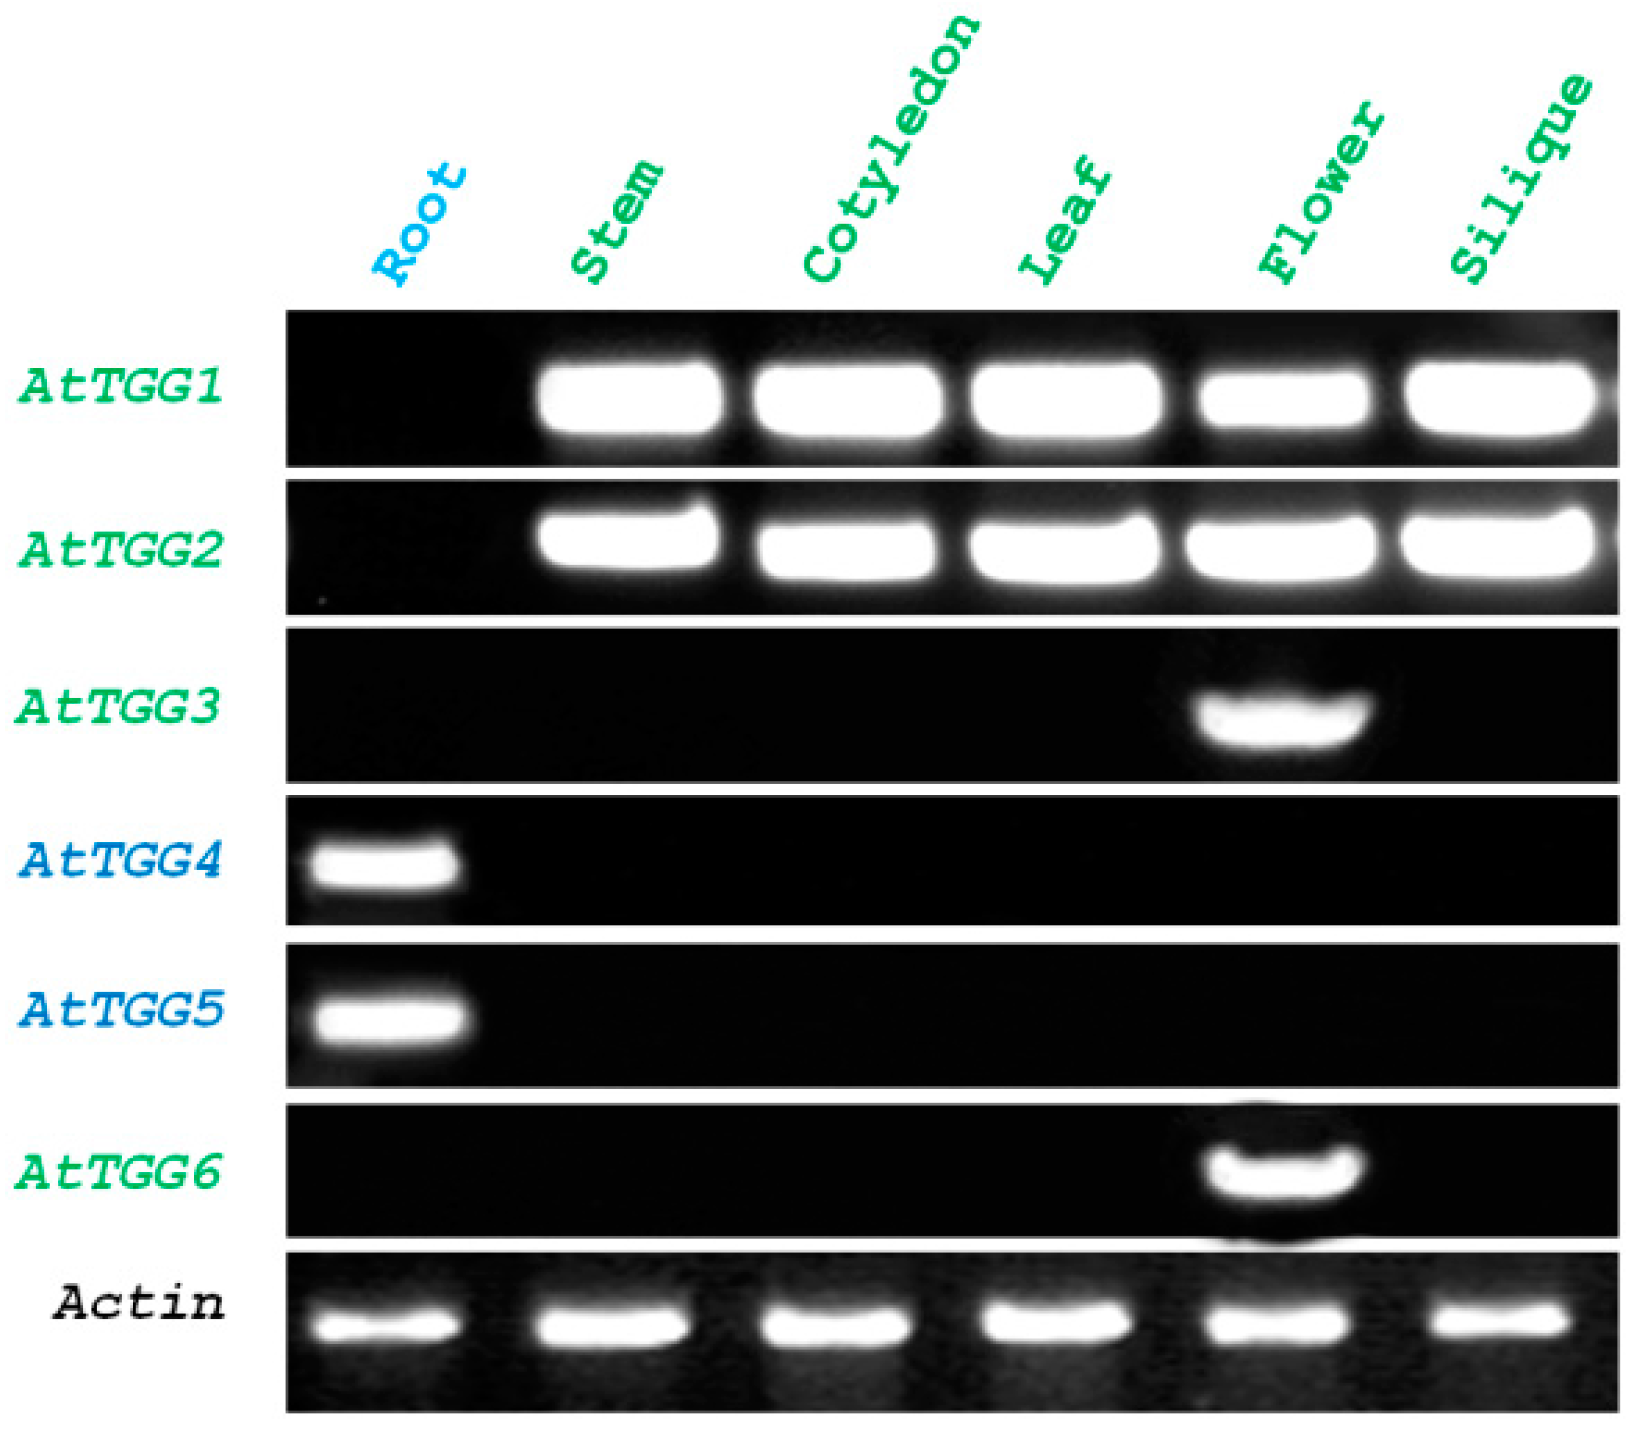
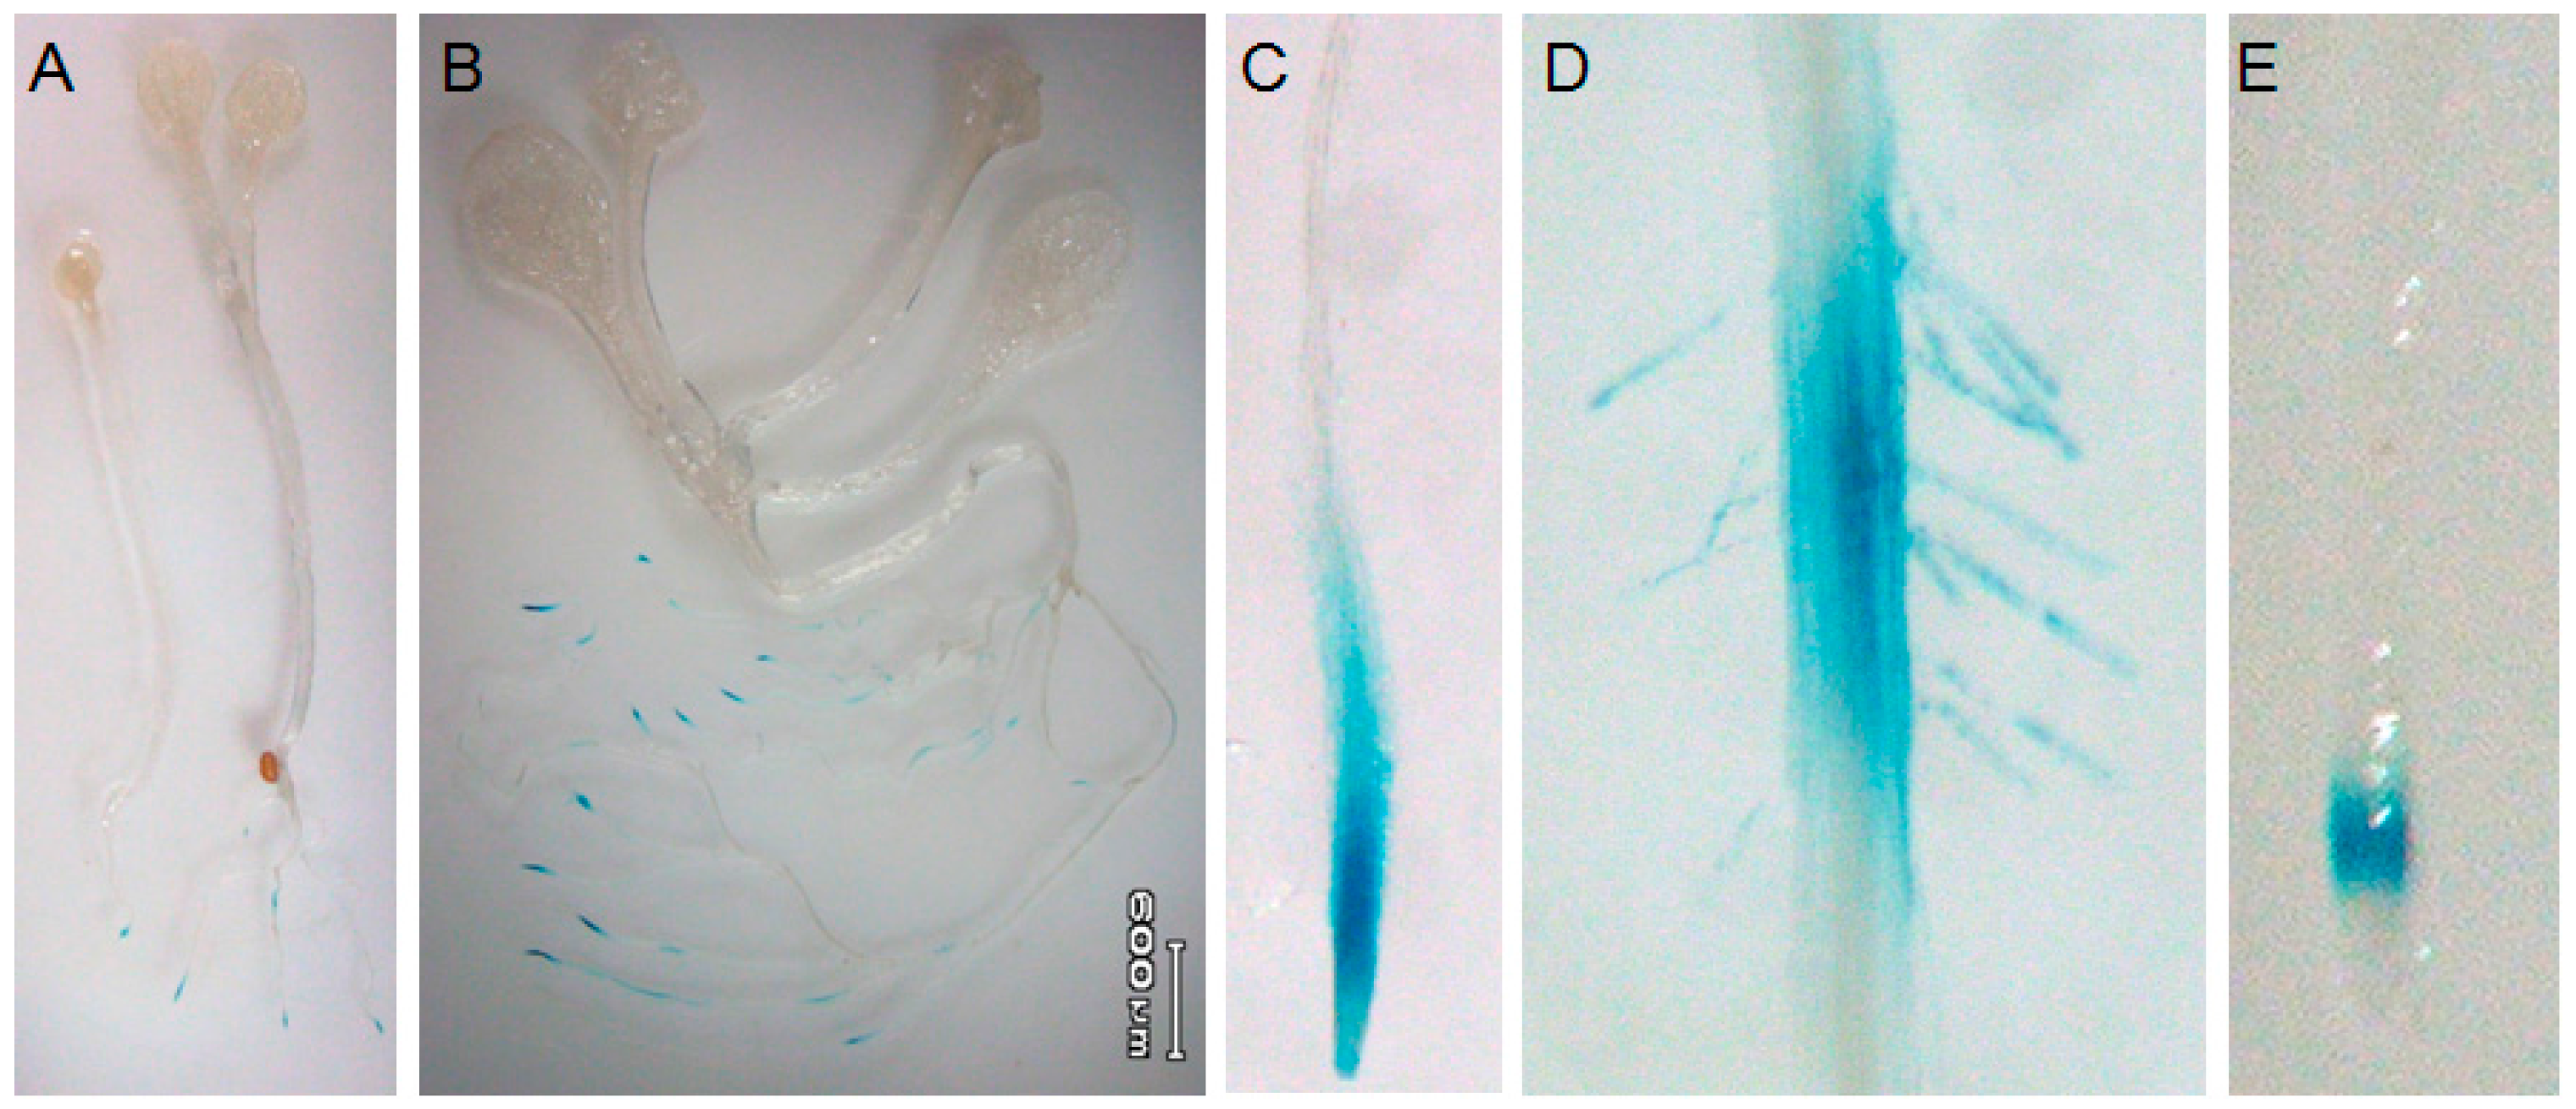
2.1. Root-Tip Specific Expression of AtTGG4 and AtTGG5

RT-PCR analysis of the myrosinase gene family in A. thaliana revealed root-specific expression of AtTGG4 and AtTGG5, while other myrosinase genes were not transcribed in roots (Figure 1). AtTGG1 and AtTGG2 were expressed in all aboveground organs, including stem, leaf, cotyledon, flower, and silique, whereas AtTGG3 and AtTGG6 were only expressed in the flower (Figure 1), suggesting functional allocations of the myrosinase gene family.
To further characterize the expression pattern of AtTGG4 and AtTGG5, their promoters were fused with GUS gene and transformed into A. thaliana Col-0. GUS staining revealed that AtTGG4 was expressed at the elongation zone of the primary root-tips (Figure 2A) and the lateral root-tips (Figure 2B). The regenerated roots induced from leaf petioles of the transgenic plants also showed root-tip specific expression (Figure 2C). The aboveground organs, including cotyledon, leaf, flower stalk, flower, silique, and immature embryos were not observed to have positive GUS staining (Figure 2D–F). The wild-type Col-0 did not exhibit any GUS staining (Figure 2G), while the positive control transformed with CaMV 35S::GUS showed constitutional expression (Figure 2H).
AtTGG5 Prom::GUS was primarily expressed at root-tips of primary and lateral roots with an expressing dense center at the elongation zone (Figure 3A,B). Its expression was not detected in aboveground organs. In contrast to AtTGG4, AtTGG5 was expressed at the whole root-tip including the root cap, the division zone, the elongation zone, and the zone of differentiation (Figure 3C), and also in some of the hairy zones (Figure 3D), while the expression of AtTGG4 Prom::GUS was limited to the elongation zone of the root-tips (Figure 3E). Therefore, AtTGG5 had a larger expression region and a higher expression level in roots, and had possibly more important biological function.

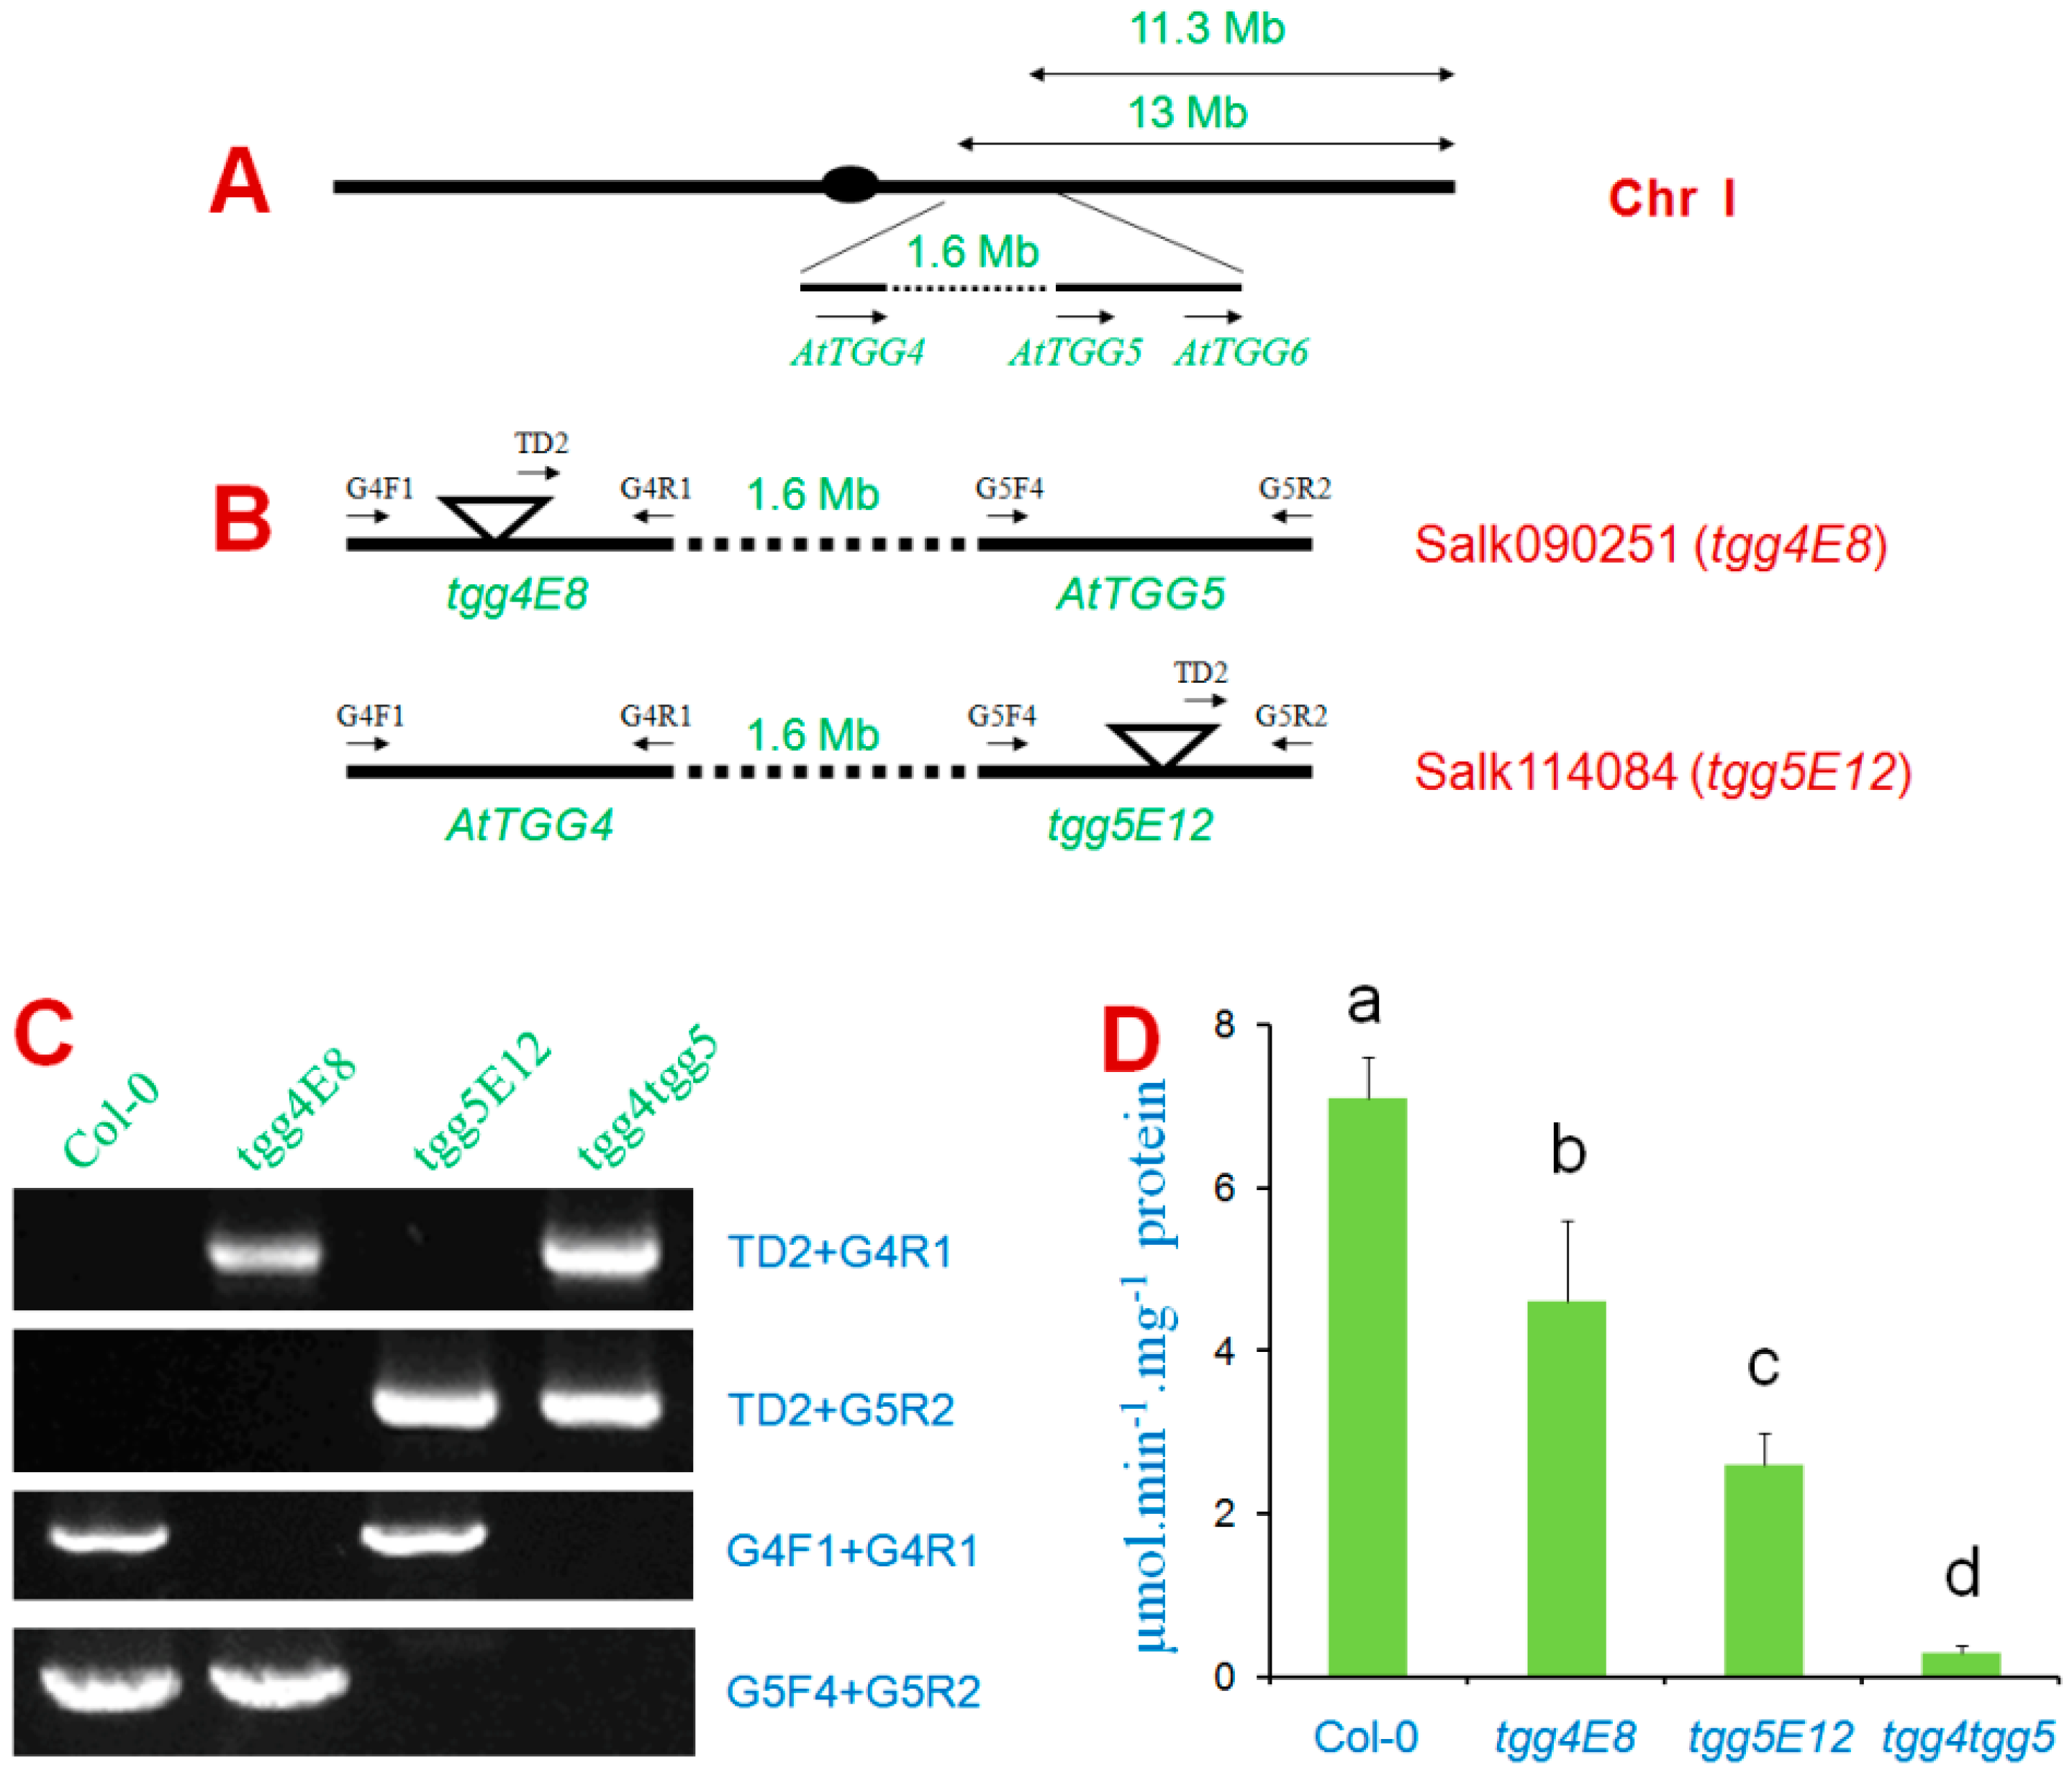
2.2. Screening of Homozygous Double T-DNA Insertion Mutants and Myrosinase Activity Test

Knock-out mutations are widely used to study the biological functions of genes. AtTGG4 and AtTGG5 are closely linked in Chromosome I of A. thaliana with a distance of 1.6 Mb (Figure 4A). To study the biological function of AtTGG4 and AtTGG5, two T-DNA insertion lines were obtained from the Arabidopsis Biological Resource Center (ABRC). The flanking regions of the T-DNA were PCR amplified with a T-DNA specific primer and gene specific primers as shown in Figure 4B. The fragments were sequenced to determine the accurate position of T-DNA insertion. Mutant line Salk090251 contained a T-DNA insertion at +1650 (from start codon) in exon 8 of AtTGG4 and, thus, designated as tgg4E8 hereafter. Mutant line Salk114084 contained a T-DNA insertion at +2455 (from start codon) in exon 12 of AtTGG5, thus designated as tgg5E12 hereafter.
In total, four primer pairs were used to determine whether a mutant plant possessed a homozygous T-DNA insertion (Figure 4C). The T-DNA specific primer TD2 and a gene specific primer were used to determine the existence of T-DNA insertion, and two gene specific primers located at 5′ and 3′ ends were used to amplify the allele without the T-DNA insertion. Thus, the homozygous tgg4E8 was verified by PCR negative with primer pairs G4F1 + G4R1 and TD2 + G5R2, and PCR positive with primer pairs G5F4 + G5R2 and TD2 + G4R1 (Figure 4C) and, accordingly, the homozygous tgg5E12 was verified vice versa (Figure 4C).
The homozygous tgg4E8 and tgg5E12 were cross-pollinated, and plants of the F2 generation were screened for recombinant events between the AtTGG4 and AtTGG5 loci using the PCR method. Seven out of 167 F2 plants were confirmed to have the desired linkage pattern of tgg4E8-tgg5E12. These plants were self-pollinated and seven F3 populations were generated. Ninety-seven F3 offspring were screened, and 27 homozygous double-mutant tgg4tgg5 were obtained, accounting for 27.8% of the offspring, no less than 25% (the theoretic ratio), indicating that the double mutants did not have survivor problems in the greenhouse conditions.
Analysis of myrosinase activities in roots revealed that tgg4E8 and tgg5E12 possessed, respectively, 65% and 35% myrosinase activity of Col-0 (Figure 4D), suggesting that AtTGG5 contributed most myrosinase activity in roots. The results were consistent with the GUS-staining results (Figure 3). Myrosinase activity in roots of the homozygous double mutant tgg4tgg5 was very weak and almost undetectable (Figure 4D). In contrast, the aboveground organs of the single and double mutants and the wild-type possessed high myrosinase activity, approximately 20-fold as in the root of Col-0, without significant difference between genotypes (data not shown).

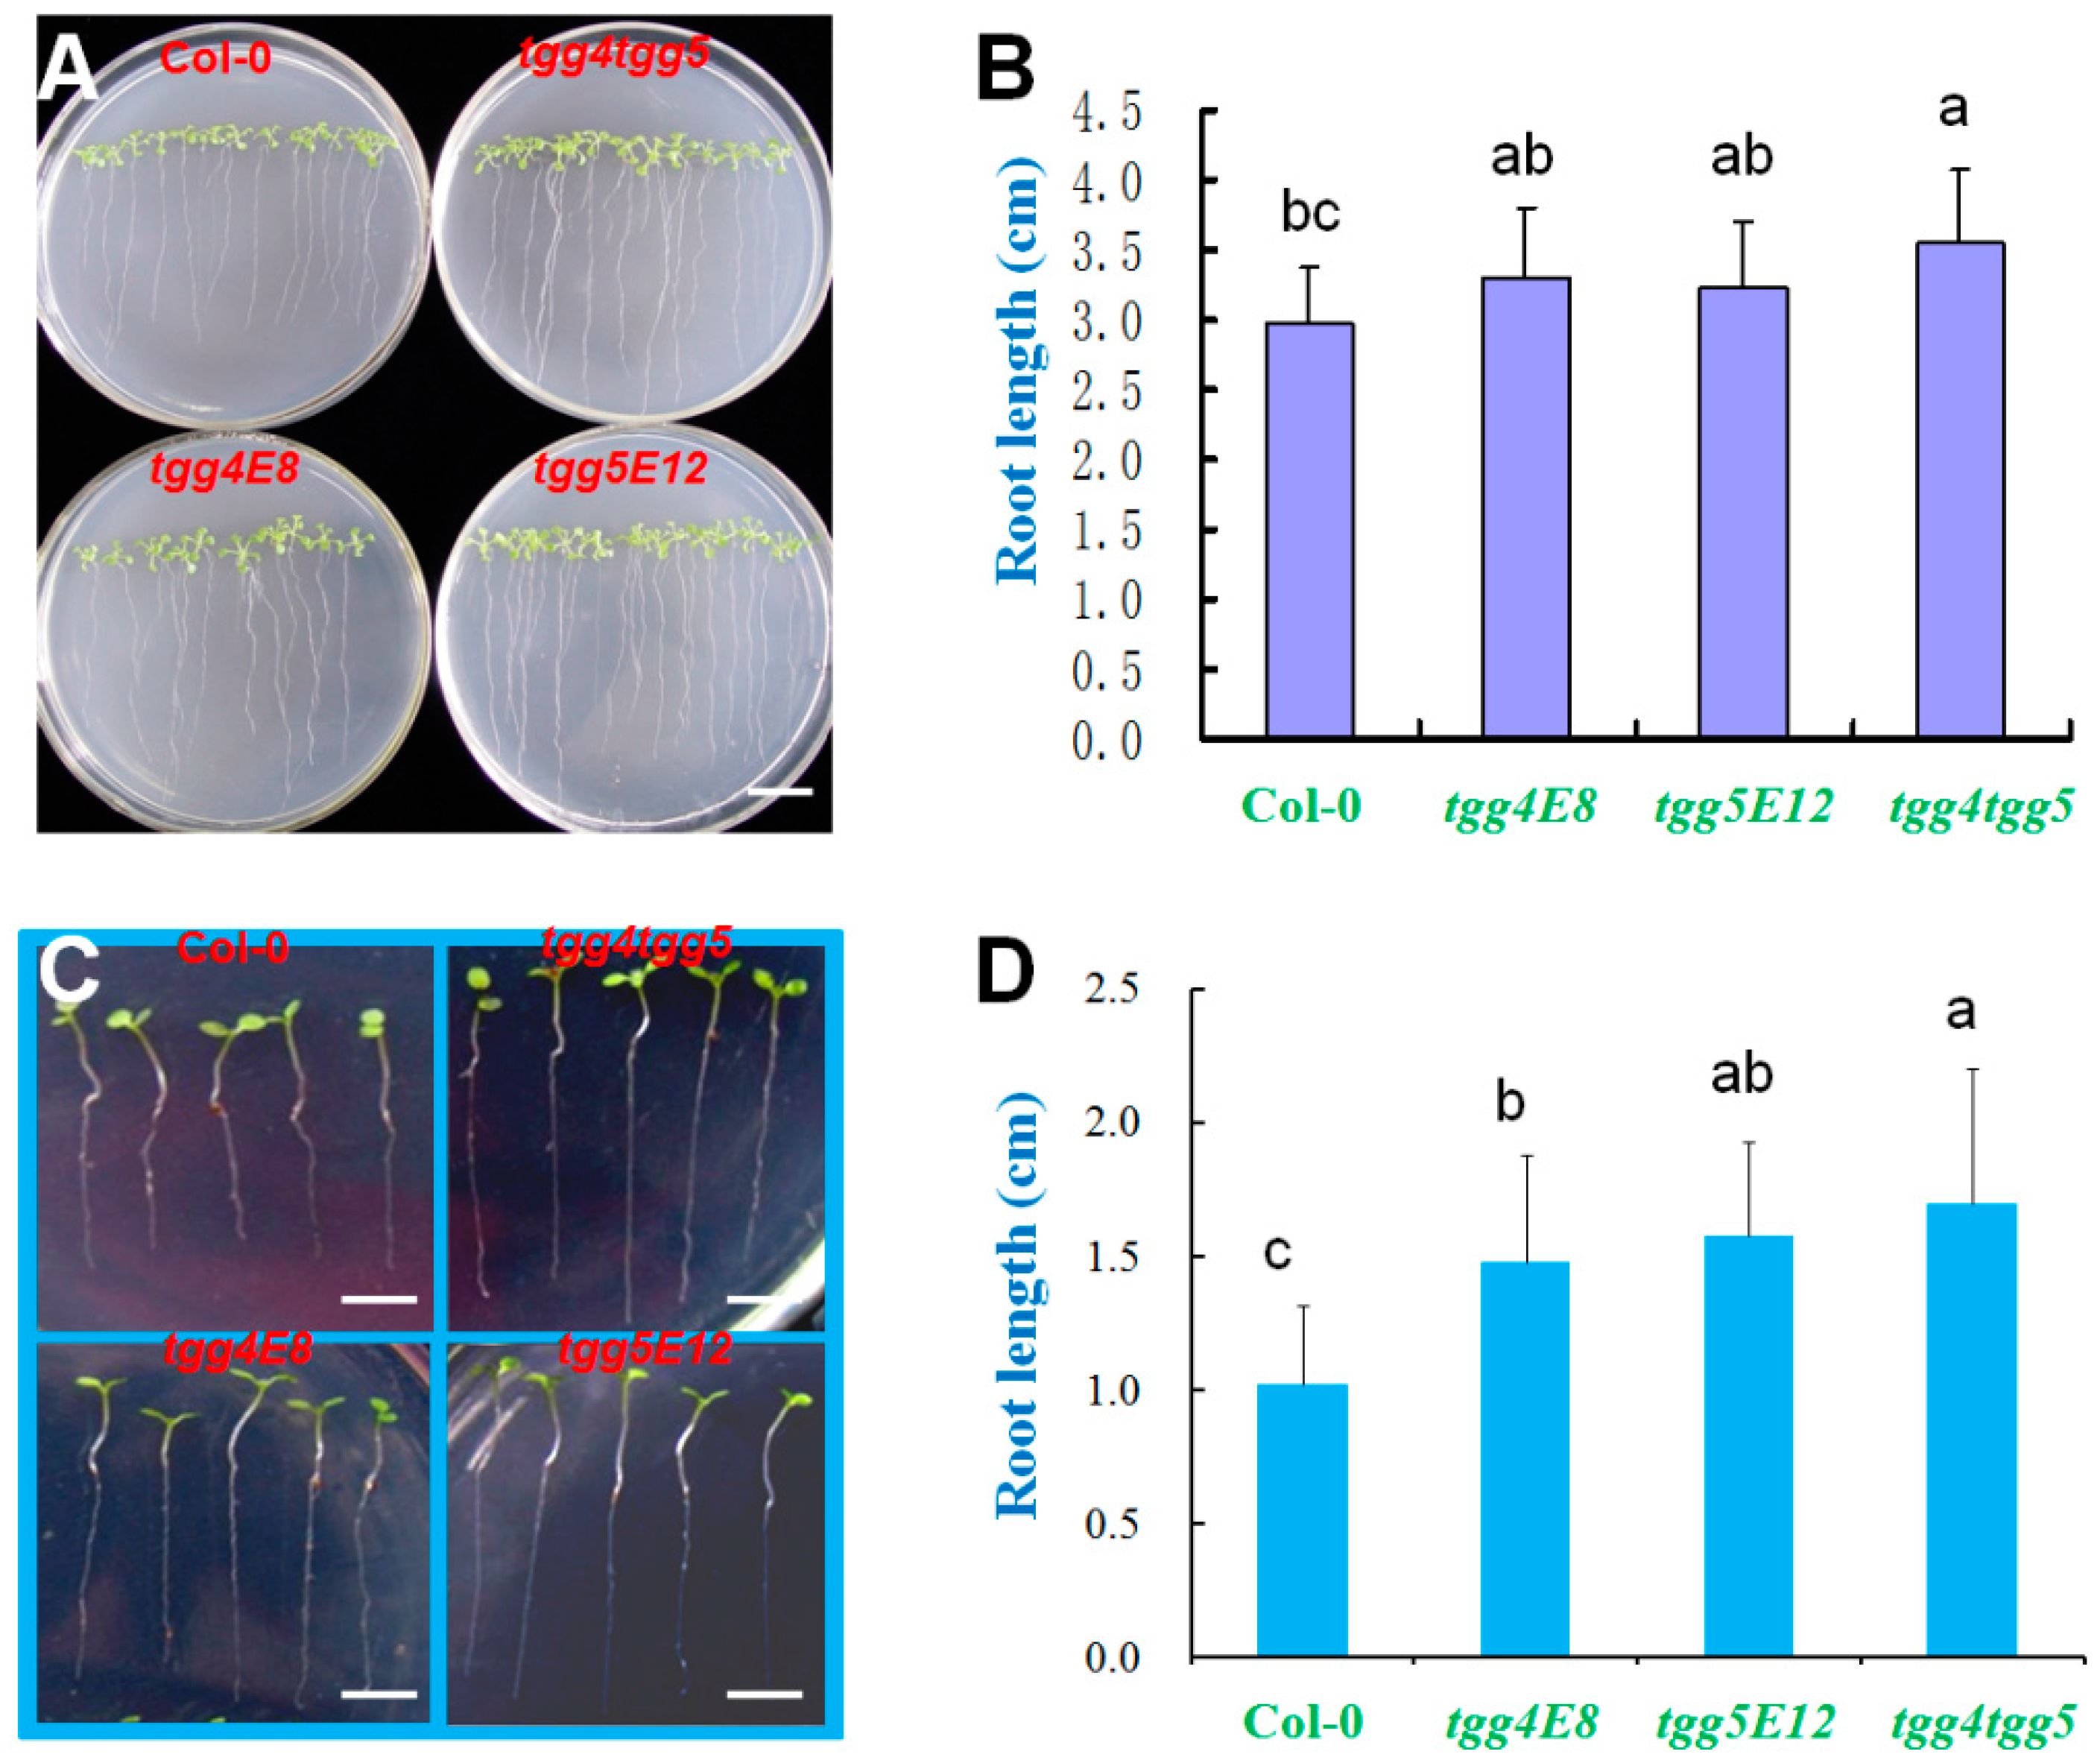
2.3. AtTGG4 and AtTGG5 Regulate Root Growth

To investigate the effects of AtTGG4 and AtTGG5 on root growth, the single and double mutants were grown on Murashieg & Skoog (MS) medium using Col-0 as control. Col-0 had the shortest roots among the four genotypes with an average length of 2.97 cm after two weeks of culture, while tgg4tgg5 had the longest roots with an average length of 3.54 cm (Figure 5A), which were significantly longer than that of Col-0 (p ≤ 0.05, Figure 5B). The single mutants, tgg4E8 and tgg5E12, both had slightly longer roots than Col-0, although it was not statistically significant (p > 0.05, Figure 5B). Similar results were observed in seedlings germinated in soil with sufficient water (Figure 5C,D), and Col-0 had the shortest roots (1.03 ± 0.23 cm), while tgg4tgg5 had the longest roots (1.67 ± 0.42 cm) after sowing in soil for two weeks. These results suggested that AtTGG4 and AtTGG5 had a role in root-growth regulation, and they were possibly involved in auxin biosynthesis.

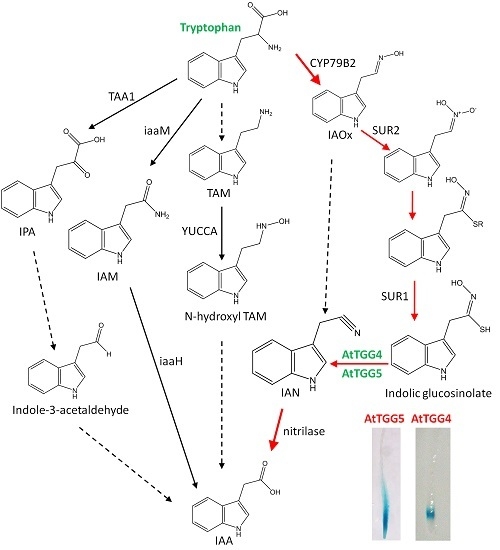
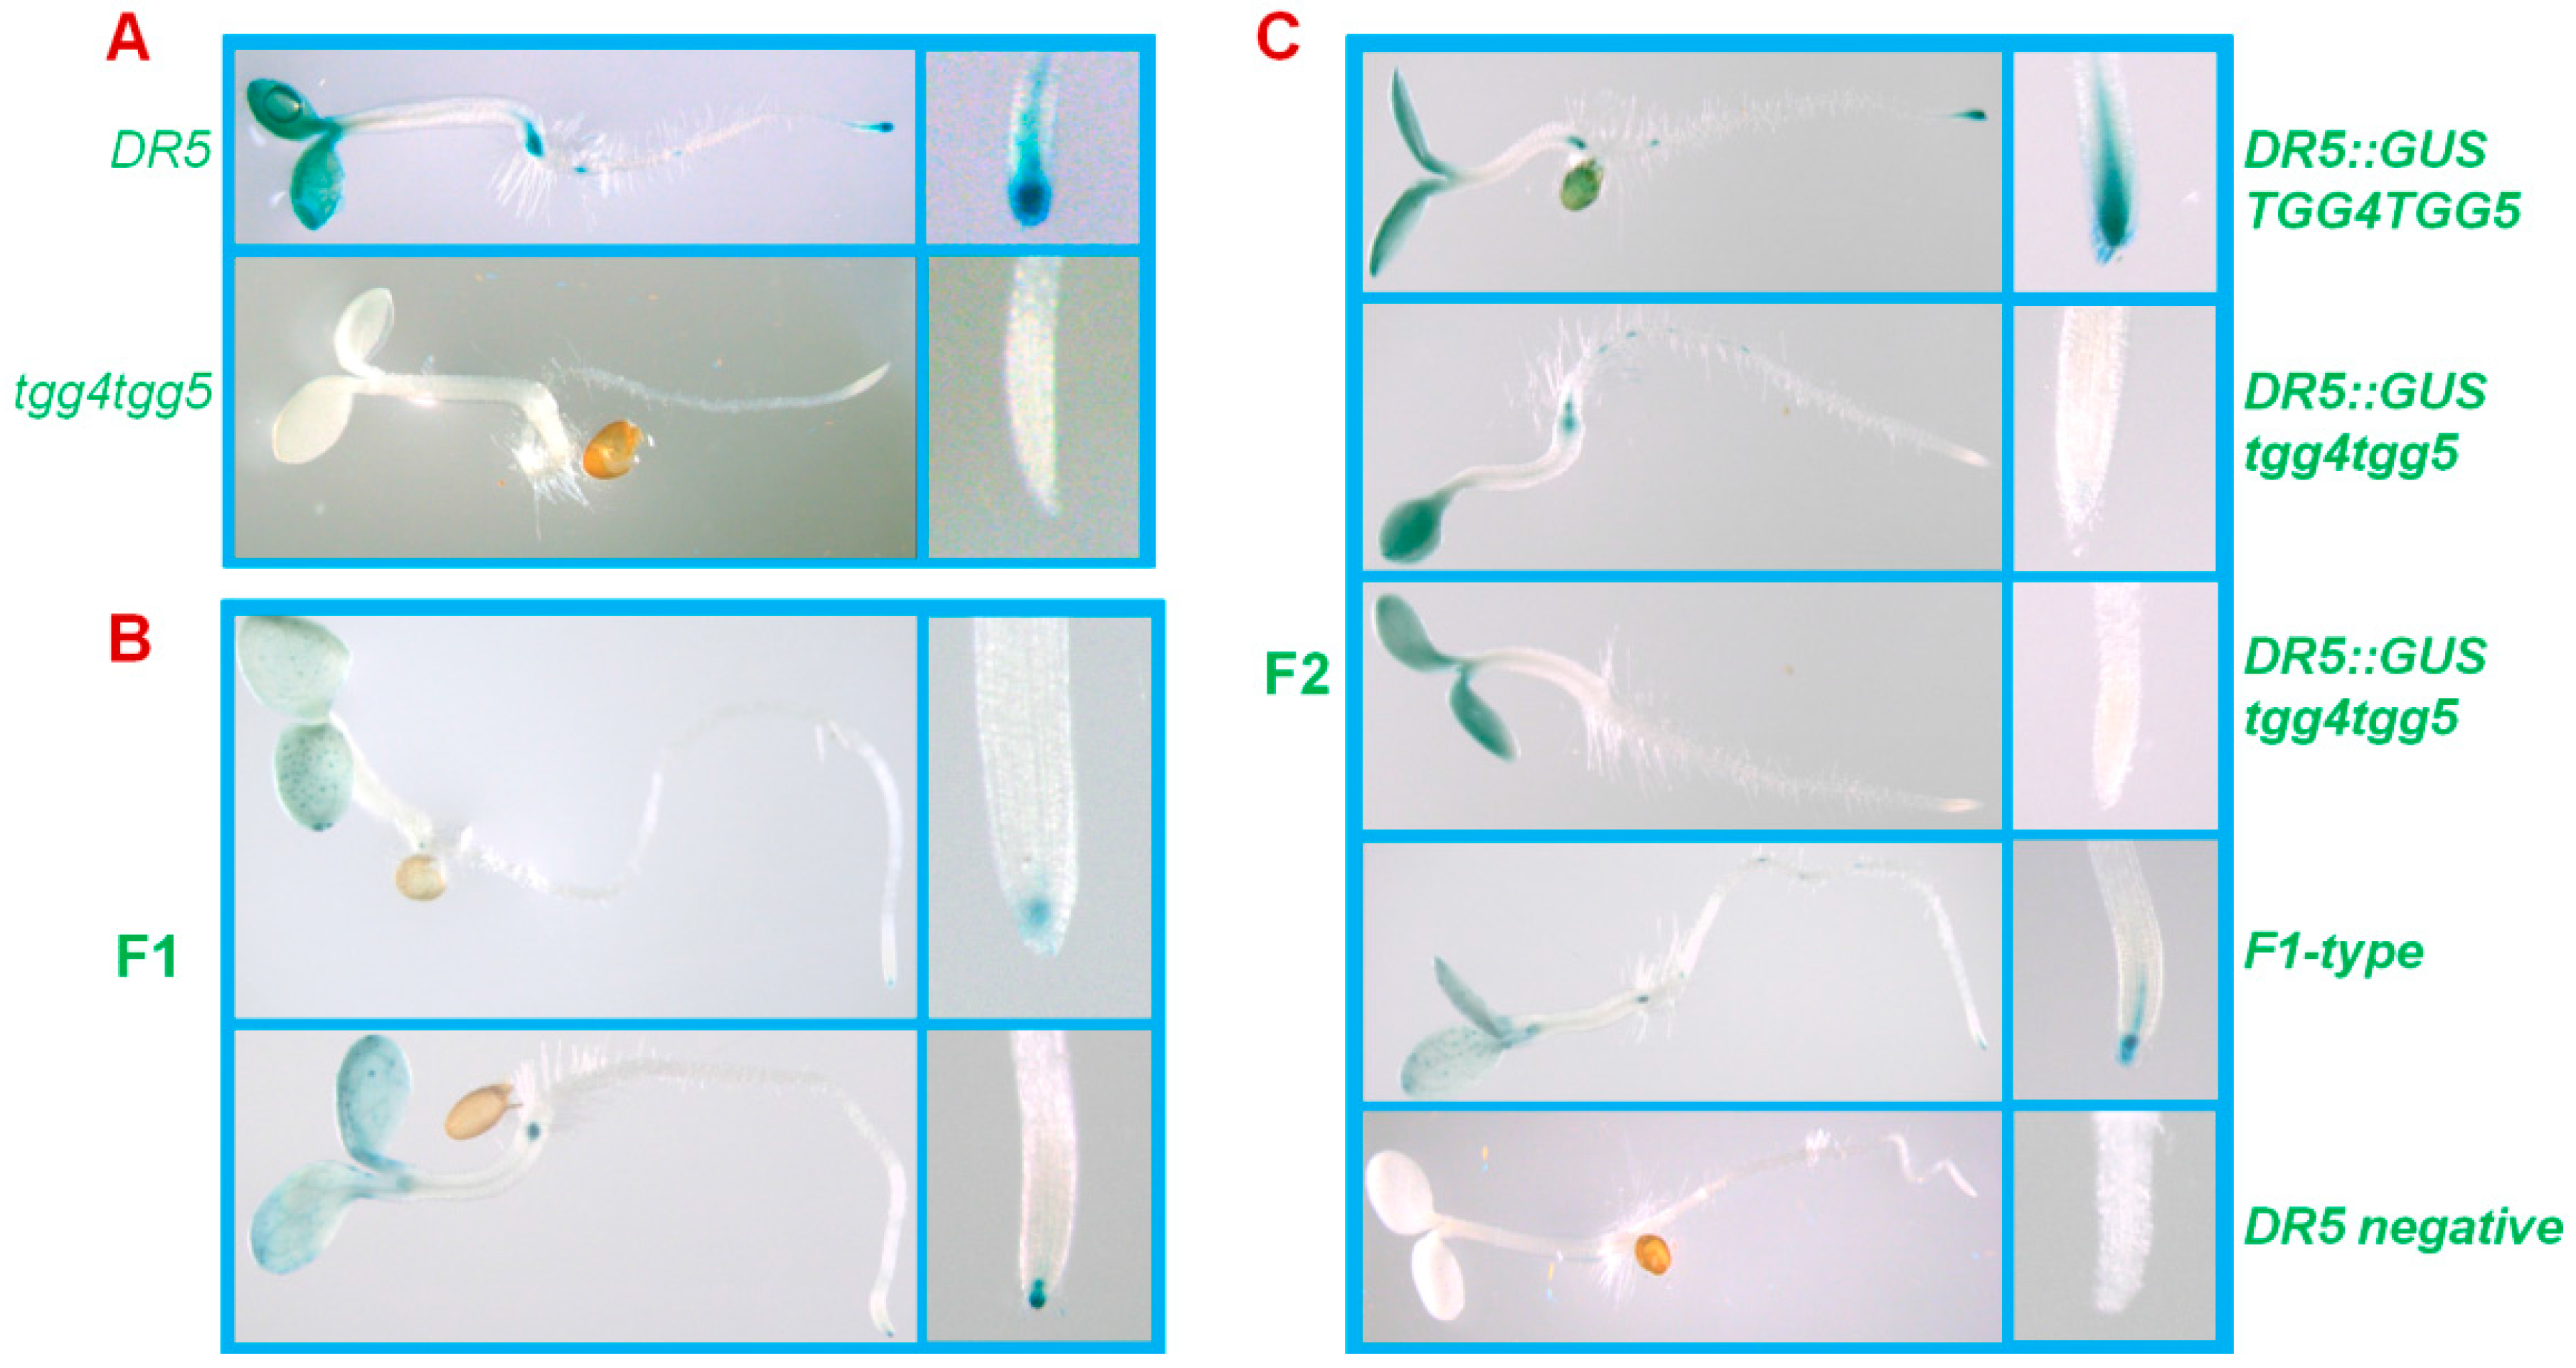
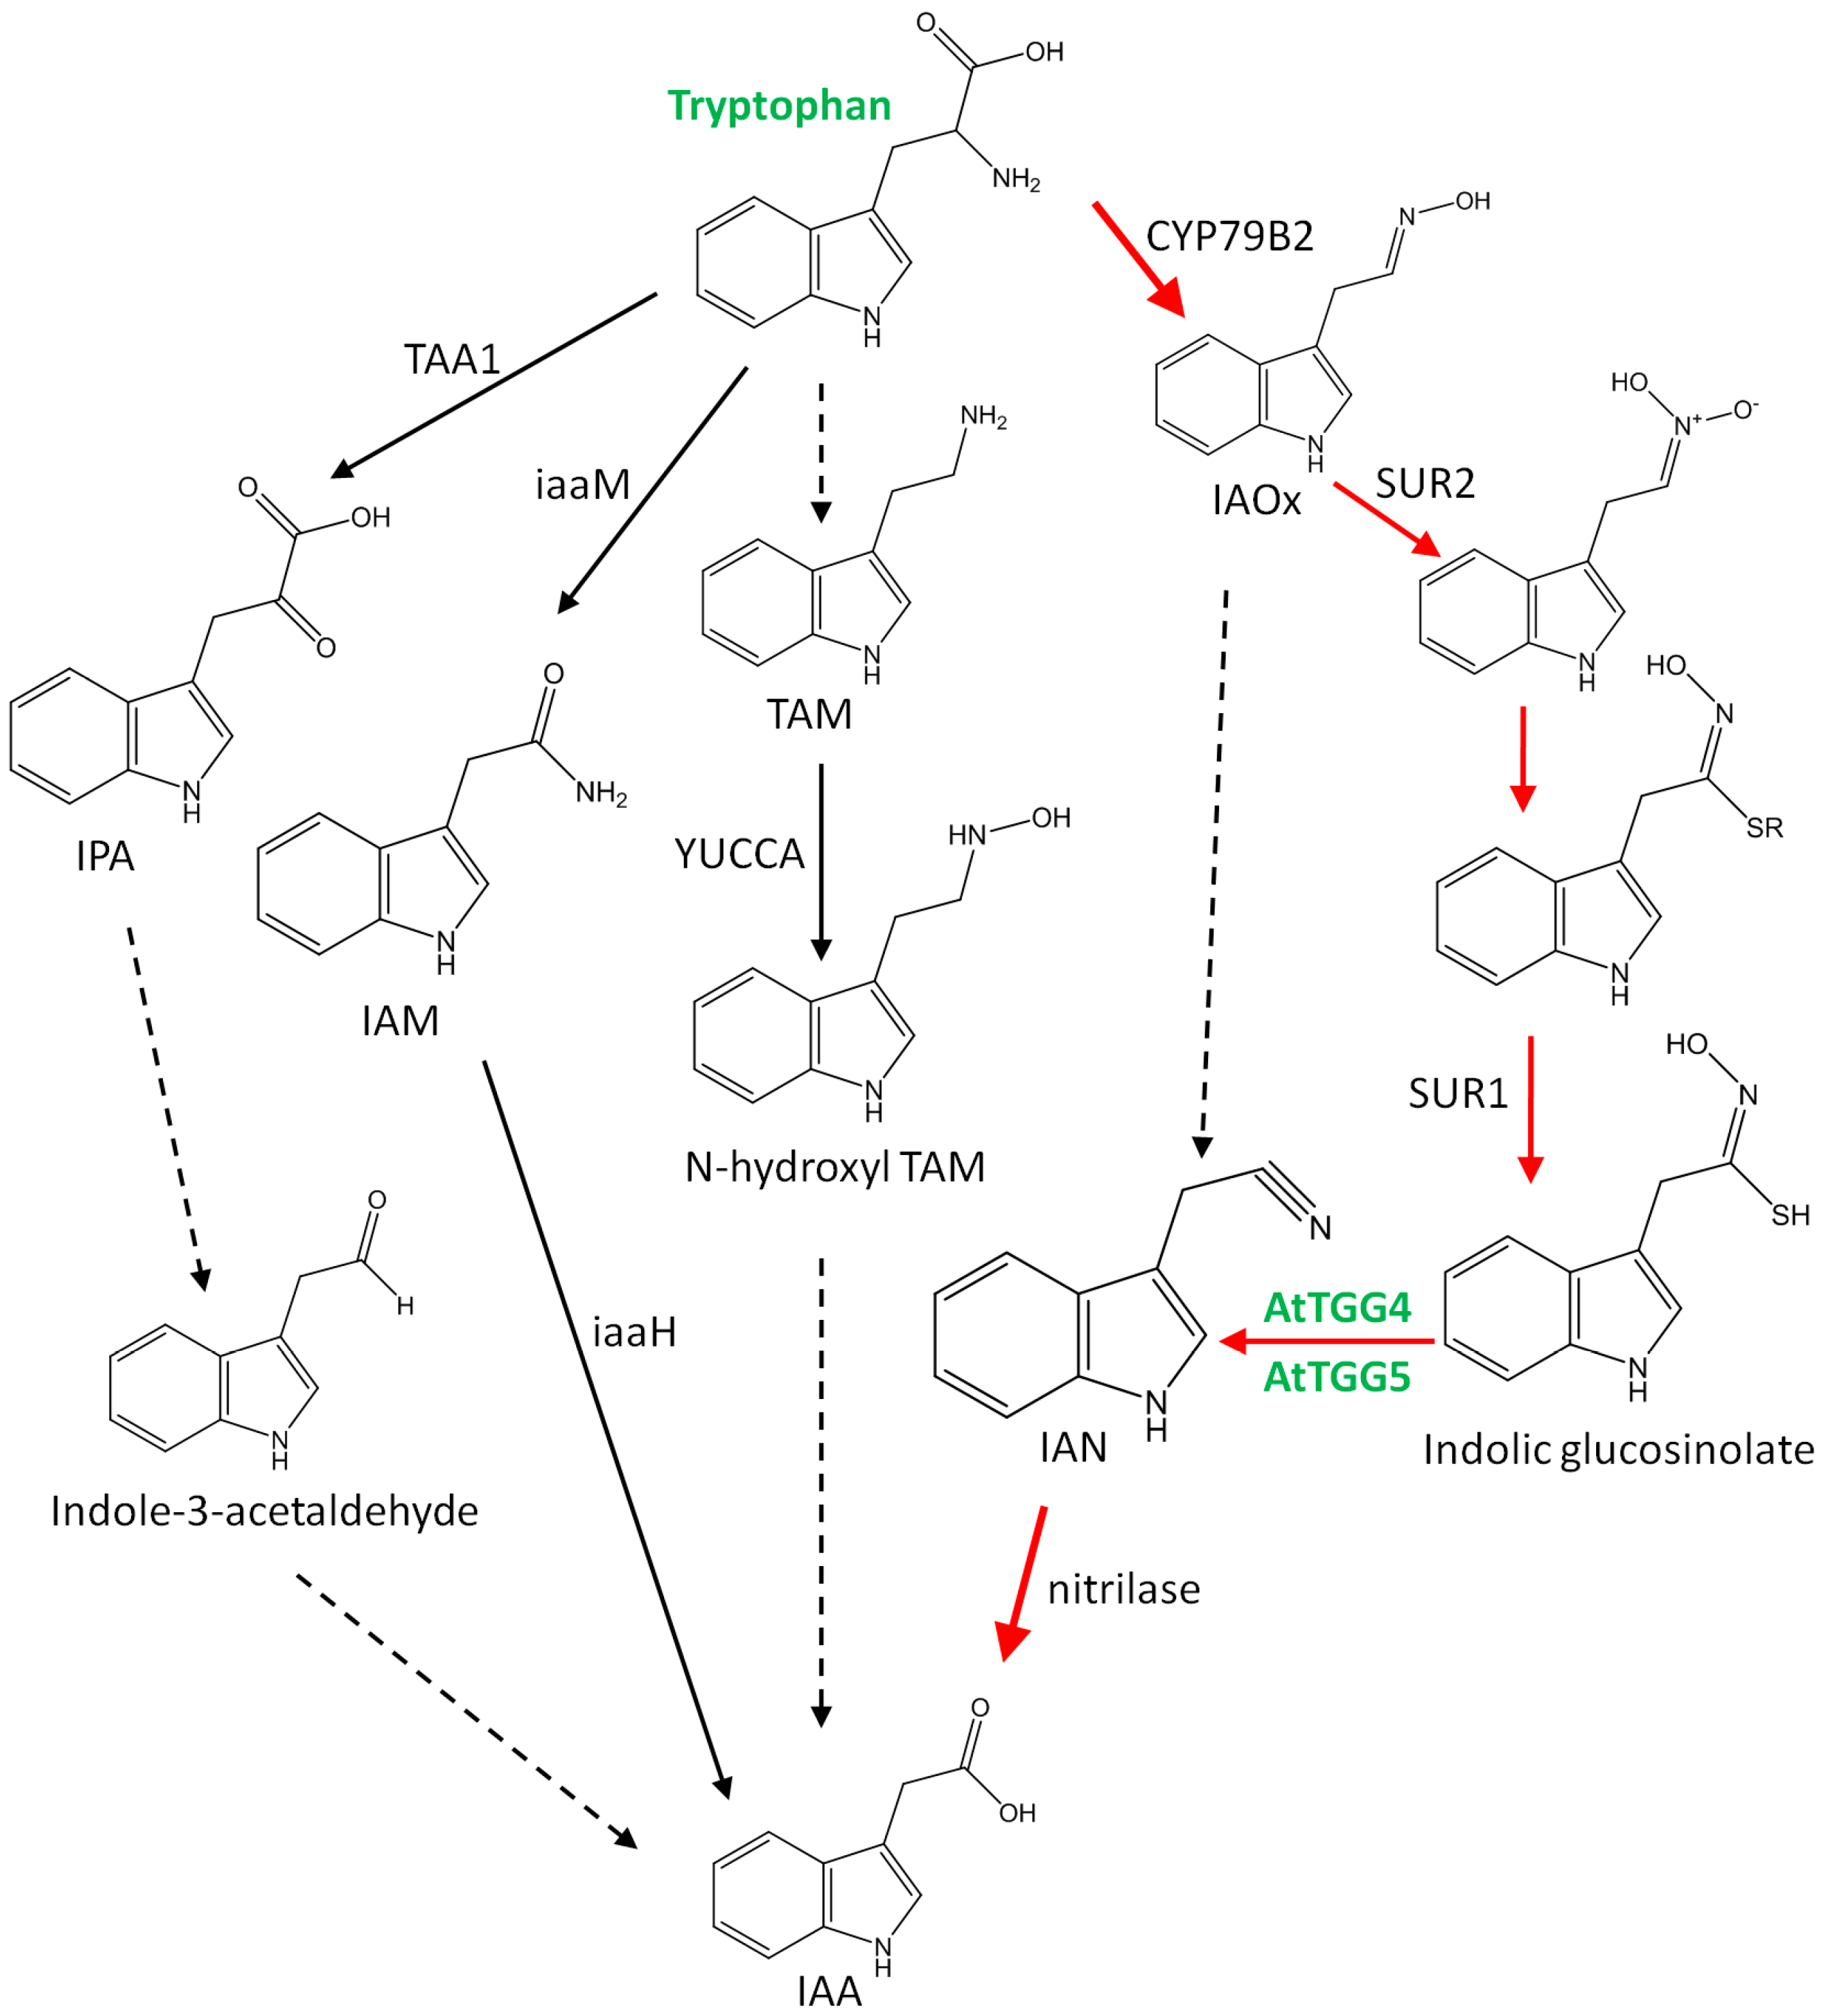
2.4. AtTGG4 and AtTGG5 Contribute to Auxin Biosynthesis in Roots

To test the involvement of AtTGG4 and AtTGG5 in auxin biosynthesis, the well characterized DR5::GUS gene was used as an auxin indicator [32]. A DR5 line containing the DR5::GUS gene was cross-pollinated with tgg4tgg5. GUS-staining results revealed that DR5::GUS was primarily expressed in cotyledons, root-tips, the hypocotyl-root junctions of the DR5 parent line, and the expression in root-tips were centered at the cap region (Figure 6A). The DR5::GUS expression level in the F1 generation was lowered down in both cotyledons and root-tips due to the half dosage of DR5::GUS, AtTGG4, and AtTGG5 genes (Figure 6B). In the F2 segregating generation, expression patterns similar to parents and F1 were identified. The plants that showed similar expression levels to DR5 in cotyledons, but lower or undetectable GUS expression in root-tips were also identified (Figure 6C), the genotype of these plants were DR5::GUS/tgg4tgg5 (Figure 6C). Therefore, we concluded that AtTGG4 and AtTGG5 played a major role in auxin biosynthesis in root-tips.

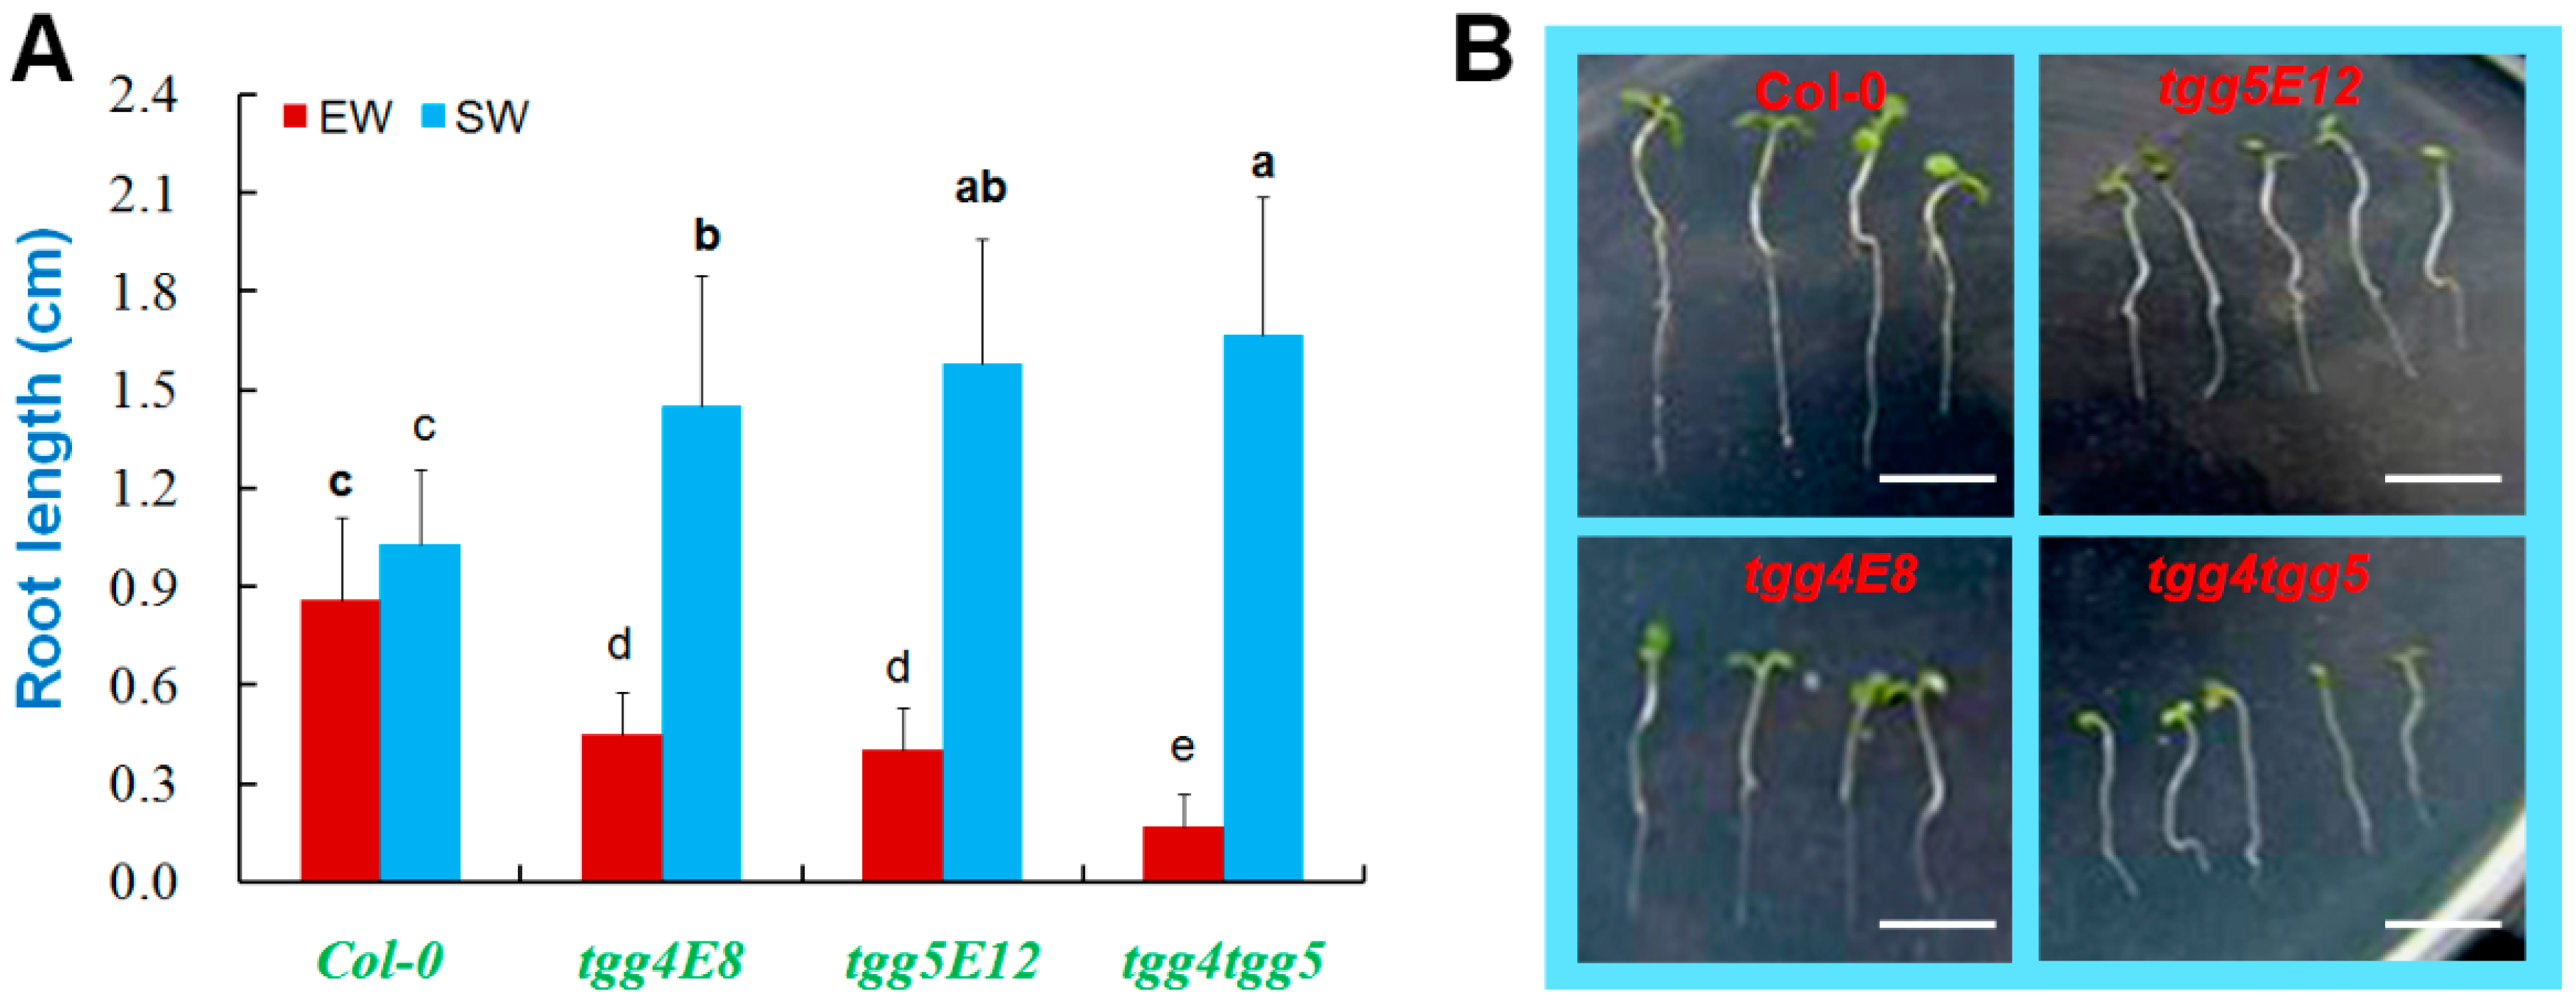
2.5. AtTGG4 and AtTGG5 Confer Flood-Stress Tolerance in Arabidopsis

To investigate the biological merits of AtTGG4 and AtTGG5, the seeds of mutant lines were sown in soil with excessive water. The germination and growth of Col-0 was slightly affected with an average root length of 0.86 cm in two weeks after sowing (Figure 7A), but the mutants were seriously affected with water-logged hypocotyls and much shorter roots (Figure 7B), especially for tgg4tgg5. The average root length of tgg4tgg5 was only 0.17 cm in length after two weeks of incubation, which was only 10% of the root length of Col-0, and some of the seedlings had no roots at all (Figure 7B). These results suggested that AtTGG4 and AtTGG5 genes were important to the root development of young seedlings in flooded conditions.

3. Discussion

3.1. Root-Tip Specific Expression Implicates a Role of AtTGG4 and AtTGG5 in Root Growth Regulation

AtTGG4 and AtTGG5 are the first myrosinases discovered in the MYR II myrosinase subfamily [11,23,24]. Other MYR II subfamily members: CpTGG1, CpTGG2, and AlTGG4–6 were then identified, respectively, in papaya and Arabidopsis lyrata [11,16,27]. The previously-reported inactive member gene Attgg6 in A. thaliana [25], was recently reported to have functional alleles that were predominantly expressed in pollen grains and served as defense against insect herbivores [27].
AtTGG4 and AtTGG5 have been found to be root specific long ago [23], and their recombinant proteins over-expressed in Pichia pastoris had different catalytic properties compared to the MYR I myrosinases AtTGG1 and AtTGG2 [24]. However, their root-tip-specific expression and biological function in plants was unknown. Analysis of the expression pattern of a gene has been widely used as an important method to deduce its biological function. We firstly studied the expression pattern of the myrosinase gene family in A. thaliana by RT-PCR, and confirmed the results in previous reports [23,25,33] (Figure 1). To further characterize the expression pattern of AtTGG4 and AtTGG5, we fused their promoters with the GUS reporter gene and transformed Col-0. GUS staining revealed that AtTGG4 and AtTGG5 were all predominantly expressed in root-tips with differences. AtTGG4 was only expressed in the elongation zone of all types of roots (Figure 2), while AtTGG5 was expressed in the whole root-tip, including the cap zone, the division zone, the elongation zone, and some hairy zones (Figure 3). However, the most densely expressed region for AtTGG5 was still the elongation zone. It was the first time the root-tip specific expression for AtTGG4 and AtTGG5 and their involvement in the regulation of root growth was reported.
Enzymatic analysis of the mutants revealed that AtTGG5 contributed 65% myrosinase activity in roots, while AtTGG4 contributed 35% (Figure 4B), which was in agreement with the expression pattern of the two genes. Therefore, AtTGG5 had a larger expression region and a higher expression level, and may have more important biological function compared to AtTGG4.

3.2. Screening of Homozygous Double T-DNA Insertion Mutants

AtTGG4 and AtTGG5 were located on the same arm of Chromosome I, with a distance of approximately 1.6 Mb (Figure 4A). To obtain a double mutant, two single T-DNA insertion mutants tgg4E8 and tgg5E12 carrying the same kanamycin resistant gene in T-DNA, were cross-pollinated, and the F2 population was screened for recombinant events between the AtTGG4 and AtTGG5 loci using the designated PCR protocol. We identified the desired linkage pattern of tgg4E8-tgg5E12 at a rate of 4.2%, which was approximately half of the expected rate calculated according to the 1.6 Mb distance between the two genes [34]. The lower identification rate may be explained by the failure to identify some genotypes with the recombination events, for example, the genotype tgg4E8-tgg5E12/TGG4-TGG5 would generate identical PCR patterns with tgg4E8-TGG5/TGG4-tgg5E12 (Table 1). False positive PCR reactions may have also ruled out some desired individuals. Anyway, a total of seven plants with tgg4E8-tgg5E12 linkage pattern were identified, and they were self-pollinated to generate F3 populations. Twenty-seven out of 97 F3 individuals were identified to be homozygous double mutants, accounting for 27.8% F3 plants. This ratio was close to the theoretical ratio, ignoring the cross-over between AtTGG4 and AtTGG5 loci, indicating that the double mutants did not have survivor problems in greenhouse conditions.
The myrosinase activity of the homozygous double mutant tgg4tgg5 was almost undetectable. However, we also detected weak myrosinase activity, which was possibly from the non-specific hydrolysis of sinigrin by O-β-glucosidases. Some O-β-glucosidases in the leaves of A. thaliana have been demonstrated to have weak myrosinase activity [35]; however, no O-β-glucosidases in roots of A. thaliana have been shown to have myrosinase activity. Two putative myrosinase genes (At2g44460 and At3g09260 (Pyk10)) were demonstrated to be expressed in roots [36,37]. However, there was no evidence to prove that they catalyzed the hydrolysis of thioglucosides. Phylogenetic analysis indicated that these two proteins were not clustered in either the Myr I or the Myr II subfamily of myrosinases, but clustered with the linamarase from cassava (Figure 8). Moreover, all plant myrosinases use a glutamine residue to replace the general acid/base glutamate of O-β-glucosidases [11,16,38]. However, the two putative myrosinases (At2g44460 and At3g09260) do not contain this replacement. Therefore, they are not likely myrosinases, but they might possess weak non-specific myrosinase activity.

3.3. AtTGG4 and AtTGG5 Regulate Root Growth and Confer Flood Tolerance

We have demonstrated that AtTGG4 and AtTGG5 were involved in root growth. The wild-type Col-0 did not show better phenotypes than their disabled mutant lines either on MS medium or in soil with sufficient water (Figure 5). When germinated on MS medium, Col-0 had the shortest roots, and tgg4tgg5 had the longest roots, while the single mutants had intermediate root lengths (Figure 5A,B). Similar differences were observed in seedlings germinated in soil with sufficient water (Figure 5C,D), in which Col-0 had the shortest roots, while tgg4tgg5 had the longest roots.
However, when seeds were sown in soil with excessive water, the growth of Col-0 seedlings was only slightly affected and the root length was similar to those grown in soil with sufficient water (Figure 7); but root growth of the mutant lines was significantly affected, especially for tgg4tgg5. The average root length of tgg4tgg5 was only 10% of the root length of Col-0 (Figure 7). The single mutant lines tgg4E8 and tgg5E12 had intermediate phenotypes, supporting the additive effects of the two genes. These results suggested that AtTGG4 and AtTGG5 genes were very important to the development of young seedlings in flooded conditions. Flooding causes premature senescence, which results in leaf chlorosis, necrosis, defoliation, cessation of growth, and reduced yield [42]. The mechanism of AtTGG4 and AtTGG5 in flood stress tolerance is unknown. However, the two genes may function through the biosynthesis of indole-3-acetic acid (IAA) from indolic glucosinolates and, thus, promote root growth in flooded soil. Indolic glucosinolates make up nearly half of the total glucosinolate composition in roots and late-stage rosette leaves [6].

3.4. AtTGG4 and AtTGG5 Contribute to Auxin Biosynthesis through a Tryptophan-Dependent Pathway

We have proved the involvement of AtTGG4 and AtTGG5 in auxin biosynthesis by using the well-characterized auxin indicator, the DR5::GUS gene [32]. When the DR5::GUS gene was introduced into tgg4tgg5 line by cross-pollination, the expression pattern of DR5::GUS gene was altered in many plants of the F2 generation, in which the root-tips had no or very low GUS staining compared to the parent DR5 line, while the cotyledons had as dense staining as the parent DR5 line (Figure 6). Therefore, we concluded that AtTGG4 and AtTGG5 played an important role in auxin biosynthesis in root-tips. Although most plants in the homozygous DR5::GUS/tgg4tgg5 population possessed high GUS expression in cotyledons, but weak GUS expression in root-tips, a few plants that possessed the expression pattern similar to the parent DR5 line were observed. These results could be explained by the existence of other auxin biosynthetic pathways besides the AtTGG4 and AtTGG5 pathway in the root-tips (Figure 9).
Auxin biosynthesis in plants is extremely complicated [43]. Plants can synthesize auxin via many independent biosynthetic pathways, including at least four trytophan-dependent pathways and one tryptophan-independent pathway. Auxin can also be released from inactive conjugates by hydrolysis, such as IAA-methyl ester [44,45], IAA-amino acids, IAA-sugar, IAA-proteins, and peptides [46,47,48].
The tryptophan-dependent pathways have been extensively reviewed [43,48,49]. However, the involvement of myrosinases and glucosinolates in auxin biosynthesis is obscure. Glucosinolates are derived from amino acids [50,51], and cytochrome P450 has been known to play a key role in the conversion of amino acids to oxime in the biosynthesis of glucosinolates [52]. In the case of indolic glucosinolate, tryptophan was the precursor, and it was converted to indole-3-acetaldoxime (IAOx) by CYP79B2 in A. thaliana [53,54]. IAOx was then converted to indolic glucosinolate by SUR2 and SUR1, respectively [55,56]. Inactive mutation of SUR2 and SUR1 resulted in “high-auxin” phenotype and “super-root” [55,56]. Therefore, biosynthesis of indolic glucosinolate seemed to serve as a mechanism to reduce IAA level in roots [55,56]. However, our research indicated that the indolic glucosinolates may be transported to root-tips, and then hydrolyzed to indole-3-acetonitrile (IAN) by AtTGG4 and AtTGG5 (Figure 9). IAN is finally converted to IAA by nitrilases in the root-tips. Therefore, the biosynthesis of indolic glucosinolate may serve as a mechanism to guarantee the biosynthesis of IAA in correct cells in root-tip to form a proper auxin gradient for healthy development of roots. When this gradient was destroyed, as in sur1 and sur2 mutants, “super-root” occurred [55,56].

4. Materials and Methods

4.1. Plant Material and Growth Conditions

Arabidopsis ecotype Col-0 (N1092) was obtained from the Nottingham Arabidopsis Stock Centre (NASC), UK. The T-DNA insertion lines were obtained from the Arabidopsis Biological Resource Center (ABRC). The plants were grown at 20 °C, 16 h day photoperiod, and 200 μmol·m−2·s−1 light intensity. Roots were collected from two-week-old plants, cotyledons were collected from one-week-old plants, leaves were collected from 2–5 week old plants, and flowers and siliques were collected from 4–5 week old plants.

4.2. Expression Analysis of Myrosinase Gene Family by Reverse Transcription Polymerase Chain Reaction (RT-PCR)

Plant samples were ground in liquid nitrogen. Total RNA was isolated with 3S Trizol Total RNA isolation reagents (Shenergy Biocolor Bioscience and Technology Company, Shanghai, China). mRNA was then purified from the total RNA with an Oligotex Direct mRNA purification kit (Qiagen GmbH, Hilden, Germany). Moloney Murine Leukemia Virus (M-MuLV) reverse transcriptase (TaKaRa Biotechnologies, Dalian, China) was used to generate first strand cDNA. PCR was performed to study the spatial expression using gene specific primers. For AtTGG4, G4E1 (5′-ACCGTACGGGATTTCCCAG-3′) and G4E2 (5′-ATCCATCTCCATAGCCTTTGGT-3′) were used. For AtTGG5, G5E1 (5′-AACCGTAGTGGATTTCCCAA-3′) and G5E2 (5′-ATCCATTTCCATAGCCTTTGAG-3′) were used. For AtTGG6, G6F1 (5′-ACCCGCTGAAAAGCTCCATCAA-3′) and G6R1 (5′-GGCTTCCACTTATTTTGCAATGAACC-3′) were used [25]. For AtTGG1, G1E1 (5′-ATAAACCATGAAGCTTCTTATGC-3′) and G1E2 (5′-GATATTTCATGCATCTGCAAGA-3′) were used. For AtTGG2, G2E1 (5′-TAACCATGAAGCTTCTTGGGT-3′) and G2E2 (5′-GTTTTGGTCTTTCATGTGAGG-3′) were used. For AtTGG3, T7F4 (5′-GACGGCTATAGATTCTCGCTT-3′) and P12 (5′-ACGGCTATGTCGCAACA-3′) were used [26]. An actin gene (ACT2) was used as a control in the RT-PCR experiments with primers ActF1 (5′-GGCAAAAGGATGCTTATGTTGG-3′) and ActR1 (5′-ATTTCACGCTCTGCTGTGGTGG-3′) [57]. The PCR reactions were performed at 94 °C for 4 min, followed by 30 cycles of 94 °C for 30 s, 55 °C for 30 s, and 72 °C for 3 min.

4.3. Expression Analysis of AtTGG4 Prom::GUS and AtTGG5 Prom::GUS

The promoter of AtTGG4 (1475 bp) was amplified from Col-0 with primers AP13 (5′-AGAGAAGCTTGTCGGTTTTGATTGGGTGAGAGA-3′, Bam HI site underlined) and AP14 (5′-AGTTGGATCCGGTTTGTATTTTCTTTATTGATGTGCTTC-3′, Hind III site underlined) and LA Taq DNA polymerase (TaKaRa Biotechnologies). AtTGG5 promoter (1455 bp) was amplified with primers AP17 (5′-TGAGAAGCTTCCAGTTGGGTTTGGGTTAGTTTG-3′, Bam HI site underlined) and AP18 (5′-TGTTGGATCCGGTTTGTATTTTCTTTATTGATGGGCT-3′, Hind III site underlined). The products were digested with Bam HI and Hind III and ligated with the Bam HI and Hind III site of the binary vector pBI121 to replace the cauliflower 35S promoter for the GUS gene. The constructs were transformed into Agrobacterium tumefaciens strain C58. Col-0 wild type plants were transformed using vacuum filtration [58]. Transformants were selected on medium containing 40 mg/L kanamycin. T2 homozygous transgenic lines were used for GUS staining according to a standard method [59].

4.4. Confirmation of T-DNA Insertion Mutants and Creation of Homozygous Double Mutant tgg4tgg5

The T-DNA insertion lines were grown as described above. DNA was isolated with a Plant Genomic DNA Isolation Kit (TaKaRa Biotechnologies). The T-DNA flanking sequences in AtTGG4 mutant lines were amplified with a primer TD2 (5′-AACCCTATCTCGGGCTATTC-3′) located at the T-DNA border and an AtTGG4 gene specific primer G4R1 (5′-CATATACAAAACACATAAGGTC-3′), and the T-DNA flanking sequences in the AtTGG5 mutant lines were amplified with TD2 and an AtTGG5 specific primer G5R2 (5′-AACACACAACAAGGTATAGGTA-3′). The locations and orientations of the primers were shown in Figure 8. The homozygous nature of the mutant lines was examined by amplification of AtTGG4 and AtTGG5 full length genomic DNA with primers pairs G4F1 (5′-ATCACCAAAAGAAGCACA-3′) and G4R1 for AtTGG4, and G5F4 (5′-TCATCACCAAAAGAAGCC-3′) and G5R2 for AtTGG5. The homozygous T-DNA insertion line would not be able to yield a PCR fragment for the relevant gene due to T-DNA insertion under designated PCR conditions (94 °C, 30 s; 60 °C, 30 s; 72 °C, 3 min, 35 cycles), while the wild type Col-0 would yield both AtTGG4 and AtTGG5 bands (Figure 4).
Although AtTGG4 and AtTGG5 loci were tightly linked with only a 1.6 Mb distance (Figure 4), the homozygous T-DNA insertion lines tgg4E8 and tgg5E12 were cross-pollinated to get homozygous double mutant lines tgg4tgg5. F1 individuals that were PCR positive with both primer pairs TD2 + G5R2 and TD2 + G4R1 were grown to get seeds. The proposed genotypes of the F1 gametes and F2 population were listed in Table 1. DNA was extracted from 157 F2 plants. Primer pairs TD2 + G4R1, TD2 + G5R2, G4F1 + G4R1, and G5F4 + G5R2 were used to screen for plants with the linkage pattern of tgg4E8-tgg5E12. The target plants were PCR positive with primer pairs TD2 + G4R1 and TD2 + G5R2, and PCR negative with either primer pair G4F1 + G4R1 or G5F4 + G5R2. The selected plants were self-pollinated to generate a F3 population, and screened with primer pairs TD2 + G4R1, TD2 + G5R2, G4F1 + G4R1, and G5F4 + G5R2 again. The homozygous double gene mutant should be PCR positive with both primer pairs TD2 + G4R1 and TD2 + G5R2, and PCR negative with both G4F1 + G4R1 and G5F4 + G5R2 (Figure 4C).

4.5. Analysis of Myrosinase Activity

Myrosinase activity in the roots of mutants and wild-type was measured, as described previously [11]. The glucose produced during enzymatic hydrolysis was measured by a glucose oxidase (GOD)-4-aminoantipyrine (PAP) test reagent (Shanghai Rongsheng Biotechnologies, Shanghai, China), as described previously [16].

4.6. Flood Tolerance Test

To test the influence of excessive water on seed germination and root growth, the seeds of mutants and wild-type were sown in sterilized soil and watered with sterilized tap water. For the normally watered control, excessive water was removed from the container that held the pots when the soil in the pots was completely wet. For flooding treatment, excessive water of approximately three fourths of the soil depth was always retained in the pots. Ten pots (five for flood treatment and five for control) were prepared for each genotype. The pots were placed in a clean growth chamber free of insects. The growth conditions were 16 h day photoperiod, 200 μmol·m−2·s−1 light intensity, and 20 °C. The root length of the seedlings was measured two weeks after sowing. The significance of the differences between genotypes was assayed by one-way ANOVA test at a 5% significance level, followed by LSD test.

4.7. The Role of AtTGG4 and AtTGG5 in Auxin Biosynthesis

To test the involvement of AtTGG4 and AtTGG5 in auxin biosynthesis, a DR5 line containing the DR5::GUS gene [32] was used as a pollen donor to cross-pollinate with the homozygous tgg4tgg5 line. The F1 seedlings were stained as described above to verify the hybrid. F1 seedlings were grown under normal conditions as described above to get seeds for F2. A portion of F2 seedlings were stained to analyze the segregation of GUS expression patterns, while the rest of the F2 seedlings were grown in a growth chamber under normal conditions and were screened for homozygous tgg4tgg5 genotypes with the PCR method as described above. The homozygous tgg4tgg5 plants were grown to get seeds by self-pollination. The F3 seeds were germinated sterile and stained with GUS-reagent, and the F2 single plant lines with 100% GUS positive were regarded as homozygous DR5::GUS/tgg4tgg5.

Acknowledgments

This project was funded partly by the Natural Science Foundation of China (Grant No. 31471561, 31070271), and the International Science and Technology Cooperation Program of China (2014DFA30680).

Author Contributions

Jiaming Zhang conceived and designed the experiments. Lili Fu, Meng Wang, Bingying Han, Deguan Tan, and Xuepiao Sun performed the experiments. Lili Fu, Meng Wang analyzed the data. Lili Fu and Jiaming Zhang wrote the paper.

Conflicts of Interest

The authors declare no conflict of interest.

References

  1. Rask, L.; Andréasson, E.; Ekbom, B.; Eriksson, S.; Pontoppidan, B.; Meijer, J. Myrosinase: Gene family evolution and herbivore defense in Brassicaceae. Plant Mol. Biol. 2000, 42, 93–113. [Google Scholar] [CrossRef] [PubMed]
  2. Bones, A.M.; Rossiter, J.T. The enzymic and chemically induced decomposition of glucosinolates. Phytochemistry 2006, 67, 1053–1067. [Google Scholar] [CrossRef] [PubMed]
  3. Raybould, A.F.; Moyes, C.L. The ecological genetics of aliphatic glucosinolates. Heredity 2001, 87, 383–391. [Google Scholar] [CrossRef] [PubMed]
  4. Fahey, J.W.; Zalcmann, A.T.; Talalay, P. The chemical diversity and distribution of glucosinolates and isothiocyanates among plants. Phytochemistry 2001, 56, 5–51. [Google Scholar] [CrossRef]
  5. Reichelt, M.; Brown, P.D.; Schneider, B.; Oldham, N.J.; Stauber, E.; Tokuhisa, J.; Kliebenstein, D.J.; Mitchell-Olds, T.; Gershenzon, J. Benzoic acid glucosinolate esters and other glucosinolates from Arabidopsis thaliana. Phytochemistry 2002, 59, 663–671. [Google Scholar] [CrossRef]
  6. Brown, P.D.; Tokuhisa, J.G.; Reichelt, M.; Gershenzon, J. Variation of glucosinolate accumulation among different organs and developmental stages of Arabidopsis thaliana. Phytochemistry 2003, 62, 471–481. [Google Scholar] [CrossRef]
  7. Petersen, B.L.; Chen, S.; Hansen, C.H.; Olsen, C.E.; Halkier, B.A. Composition and content of glucosinolates in developing Arabidopsis thaliana. Planta 2002, 214, 562–571. [Google Scholar] [CrossRef] [PubMed]
  8. Brader, G.; Mikkelsen, M.D.; Halkier, B.A.; Tapio Palva, E. Altering glucosinolate profiles modulates disease resistance in plants. Plant J. 2006, 46, 758–767. [Google Scholar] [CrossRef] [PubMed]
  9. Mewis, I.; Tokuhisa, J.G.; Schultz, J.C.; Appel, H.M.; Ulrichs, C.; Gershenzon, J. Gene expression and glucosinolate accumulation in Arabidopsis thaliana in response to generalist and specialist herbivores of different feeding guilds and the role of defense signaling pathways. Phytochemistry 2006, 67, 2450–2462. [Google Scholar] [CrossRef] [PubMed]
  10. Bones, A.M.; Rossiter, J.T. The myrosinase-glucosinolate system, its organisation and biochemistry. Physiol. Plant. 1996, 97, 194–208. [Google Scholar] [CrossRef]
  11. Wang, M.; Li, D.; Sun, X.; Zhu, Y.J.; Nong, H.; Zhang, J. Characterization of a root-specific β-thioglucoside glucohydrolase gene in Carica papaya and its recombinant protein expressed in Pichia pastoris. Plant Sci. 2009, 177, 716–723. [Google Scholar] [CrossRef]
  12. Xue, J.P.; Lenman, M.; Falk, A.; Rask, L. The glucosinolate-degrading enzyme myrosinase in Brassicaceae is encoded by a gene family. Plant Mol. Biol. 1992, 18, 387–398. [Google Scholar] [CrossRef] [PubMed]
  13. Falk, A.; Ek, B.; Rask, L. Characterization of a new myrosinase in Brassica napus. Plant Mol. Biol. 1995, 27, 863–874. [Google Scholar] [CrossRef] [PubMed]
  14. Chadchawan, S.; Bishop, J.; Thangstad, O.P.; Bones, A.M.; Mitchell-Olds, T.; Bradley, D. Arabidopsis cDNA sequence encoding myrosinase. Plant Physiol. 1993, 103, 671–672. [Google Scholar] [CrossRef] [PubMed]
  15. Xue, J.; Jorgensen, M.; Pihlgren, U.; Rask, L. The myrosinase gene family in Arabidopsis thaliana: Gene organization, expression and evolution. Plant Mol. Biol. 1995, 27, 911–922. [Google Scholar] [CrossRef] [PubMed]
  16. Nong, H.; Zhang, J.; Li, D.; Wang, M.; Sun, X.; Zhu, Y.J.; Meijer, J.; Wang, H. Characterization of a novel β-thioglucosidase CpTGG1 in Carica papaya and its substrate-dependent and ascorbic acid-independent O-β-glucosidase activity. J. Integr. Plant Biol. 2010, 52, 879–890. [Google Scholar] [CrossRef] [PubMed]
  17. Husebye, H.; Chadchawan, S.; Winge, P.; Thangstad, O.P.; Bones, A.M. Guard cell- and phloem idioblast-specific expression of thioglucoside glucohydrolase 1 (myrosinase) in Arabidopsis. Plant Physiol. 2002, 128, 1180–1188. [Google Scholar] [CrossRef] [PubMed]
  18. Andreasson, E.; Bolt Jorgensen, L.; Hoglund, A.S.; Rask, L.; Meijer, J. Different myrosinase and idioblast distribution in Arabidopsis and Brassica napus. Plant Physiol. 2001, 127, 1750–1763. [Google Scholar] [CrossRef] [PubMed]
  19. Xue, J.; Pihlgren, U.; Rask, L. Temporal, cell-specific, and tissue-preferential expression of myrosinase genes during embryo and seedling development in Sinapis alba. Planta 1993, 191, 95–101. [Google Scholar] [CrossRef]
  20. Thangstad, O.P.; Evjen, K.; Bones, A. Immunogold-EM localization of myrosinase in Brassicaceae. Protoplasma 1991, 161, 85–93. [Google Scholar] [CrossRef]
  21. Kelly, P.J.; Bones, A.; Rossiter, J.T. Sub-cellular immunolocalization of the glucosinolate sinigrin in seedlings of Brassica juncea. Planta 1998, 206, 370–377. [Google Scholar] [CrossRef] [PubMed]
  22. Koroleva, O.A.; Davies, A.; Deeken, R.; Thorpe, M.R.; Tomos, A.D.; Hedrich, R. Identification of a new glucosinolate-rich cell type in Arabidopsis flower stalk. Plant Physiol. 2000, 124, 599–608. [Google Scholar] [CrossRef] [PubMed]
  23. Zhang, J.; Andersson, D.; Meijer, J. Characterisation of a new type of beta-thioglucoside glycosidase (myrosinase) in Arabidopsis thaliana. In Proceedings of the VIII International Conference on Arabidopsis Research, Sevilla, Spain, 28 June–2 July 2002; pp. 6–25.
  24. Andersson, D.; Chakrabarty, R.; Bejai, S.; Zhang, J.; Rask, L.; Meijer, J. Myrosinases from root and leaves of Arabidopsis thaliana have different catalytic properties. Phytochemistry 2009, 70, 1345–1354. [Google Scholar] [CrossRef] [PubMed]
  25. Wang, M.; Li, D.; Tan, D.; Gong, S.; Sun, X.; Meijer, J.; Zhang, J. The two non-functional myrosinase genes TGG3 and TGG6 in Arabidopsis are expressed predominantly in pollen. Plant Sci. 2009, 177, 371–375. [Google Scholar] [CrossRef]
  26. Zhang, J.; Pontoppidan, B.; Xue, J.; Rask, L.; Meijer, J. The third myrosinase gene TGG3 in Arabidopsis thaliana is a pseudogene specifically expressed in stamen and petal. Physiol. Plant. 2002, 115, 25–34. [Google Scholar] [CrossRef] [PubMed]
  27. Fu, L.; Han, B.; Tan, D.; Wang, M.; Ding, M.; Zhang, J. Identification and evolution of functional alleles of the previously described pollen specific myrosinase pseudogene AtTGG6 in Arabidopsis thaliana. Int. J. Mol. Sci. 2016, 17. [Google Scholar] [CrossRef] [PubMed]
  28. Xue, J.; Rask, L. The unusual 5′ splicing border GC is used in myrosinase genes of the Brassicaceae. Plant Mol. Biol. 1995, 29, 167–171. [Google Scholar] [CrossRef] [PubMed]
  29. Olafsdottir, E.S.; Bolt Jorgensen, L.; Jaroszewski, J.W. Cyanogenesis in glucosinolate-producing plants: Carica papaya and Carica quercifolia. Phytochemistry 2002, 60, 269–273. [Google Scholar] [CrossRef]
  30. Cairns, T.; Siegmund, E.G.; Stamp, J.J.; Jacobs, R.M. Characterization of benzyl isothiocyanate and phenyl acetonitrile from papayas by mass spectrometry. J. Assoc. Off. Anal. Chem. 1988, 71, 547–550. [Google Scholar] [PubMed]
  31. Flath, R.A.; Forrey, R.R. Volatile components of papaya (Carica papaya L., Solo variety). J. Agric. Food Chem. 1977, 25, 103–109. [Google Scholar] [CrossRef]
  32. Ulmasov, T.; Murfett, J.; Hagen, G.; Guilfoyle, T.J. Aux/IAA proteins repress expression of reporter genes containing natural and highly active synthetic auxin response elements. Plant Cell 1997, 9, 1963–1971. [Google Scholar] [CrossRef] [PubMed]
  33. Barth, C.; Jander, G. Arabidopsis myrosinases TGG1 and TGG2 have redundant function in glucosinolate breakdown and insect defense. Plant J. 2006, 46, 549–562. [Google Scholar] [CrossRef] [PubMed]
  34. Lukowitz, W.; Gillmor, C.S.; Scheible, W.R. Positional cloning in Arabidopsis: Why it feels good to have a genome initiative working for you. Plant Physiol. 2000, 123, 795–805. [Google Scholar] [CrossRef] [PubMed]
  35. Bednarek, P.; Pislewska-Bednarek, M.; Svatos, A.; Schneider, B.; Doubsky, J.; Mansurova, M.; Humphry, M.; Consonni, C.; Panstruga, R.; Sanchez-Vallet, A.; et al. A glucosinolate metabolism pathway in living plant cells mediates broad-spectrum antifungal defense. Science 2009, 323, 101–106. [Google Scholar] [CrossRef] [PubMed]
  36. Nitz, I.; Berkefeld, H.; Puzio, P.S.; Grundler, F.M. Pyk10, a seedling and root specific gene and promoter from Arabidopsis thaliana. Plant Sci. 2001, 161, 337–346. [Google Scholar] [CrossRef]
  37. Dan, H.; Yang, G.; Zheng, Z.L. A negative regulatory role for auxin in sulphate deficiency response in Arabidopsis thaliana. Plant Mol. Biol. 2007, 63, 221–235. [Google Scholar] [CrossRef] [PubMed]
  38. Burmeister, W.P.; Cottaz, S.; Driguez, H.; Iori, R.; Palmieri, S.; Henrissat, B. The crystal structures of Sinapis alba myrosinase and a covalent glycosyl-enzyme intermediate provide insights into the substrate recognition and active-site machinery of an S-glycosidase. Structure 1997, 5, 663–675. [Google Scholar] [CrossRef]
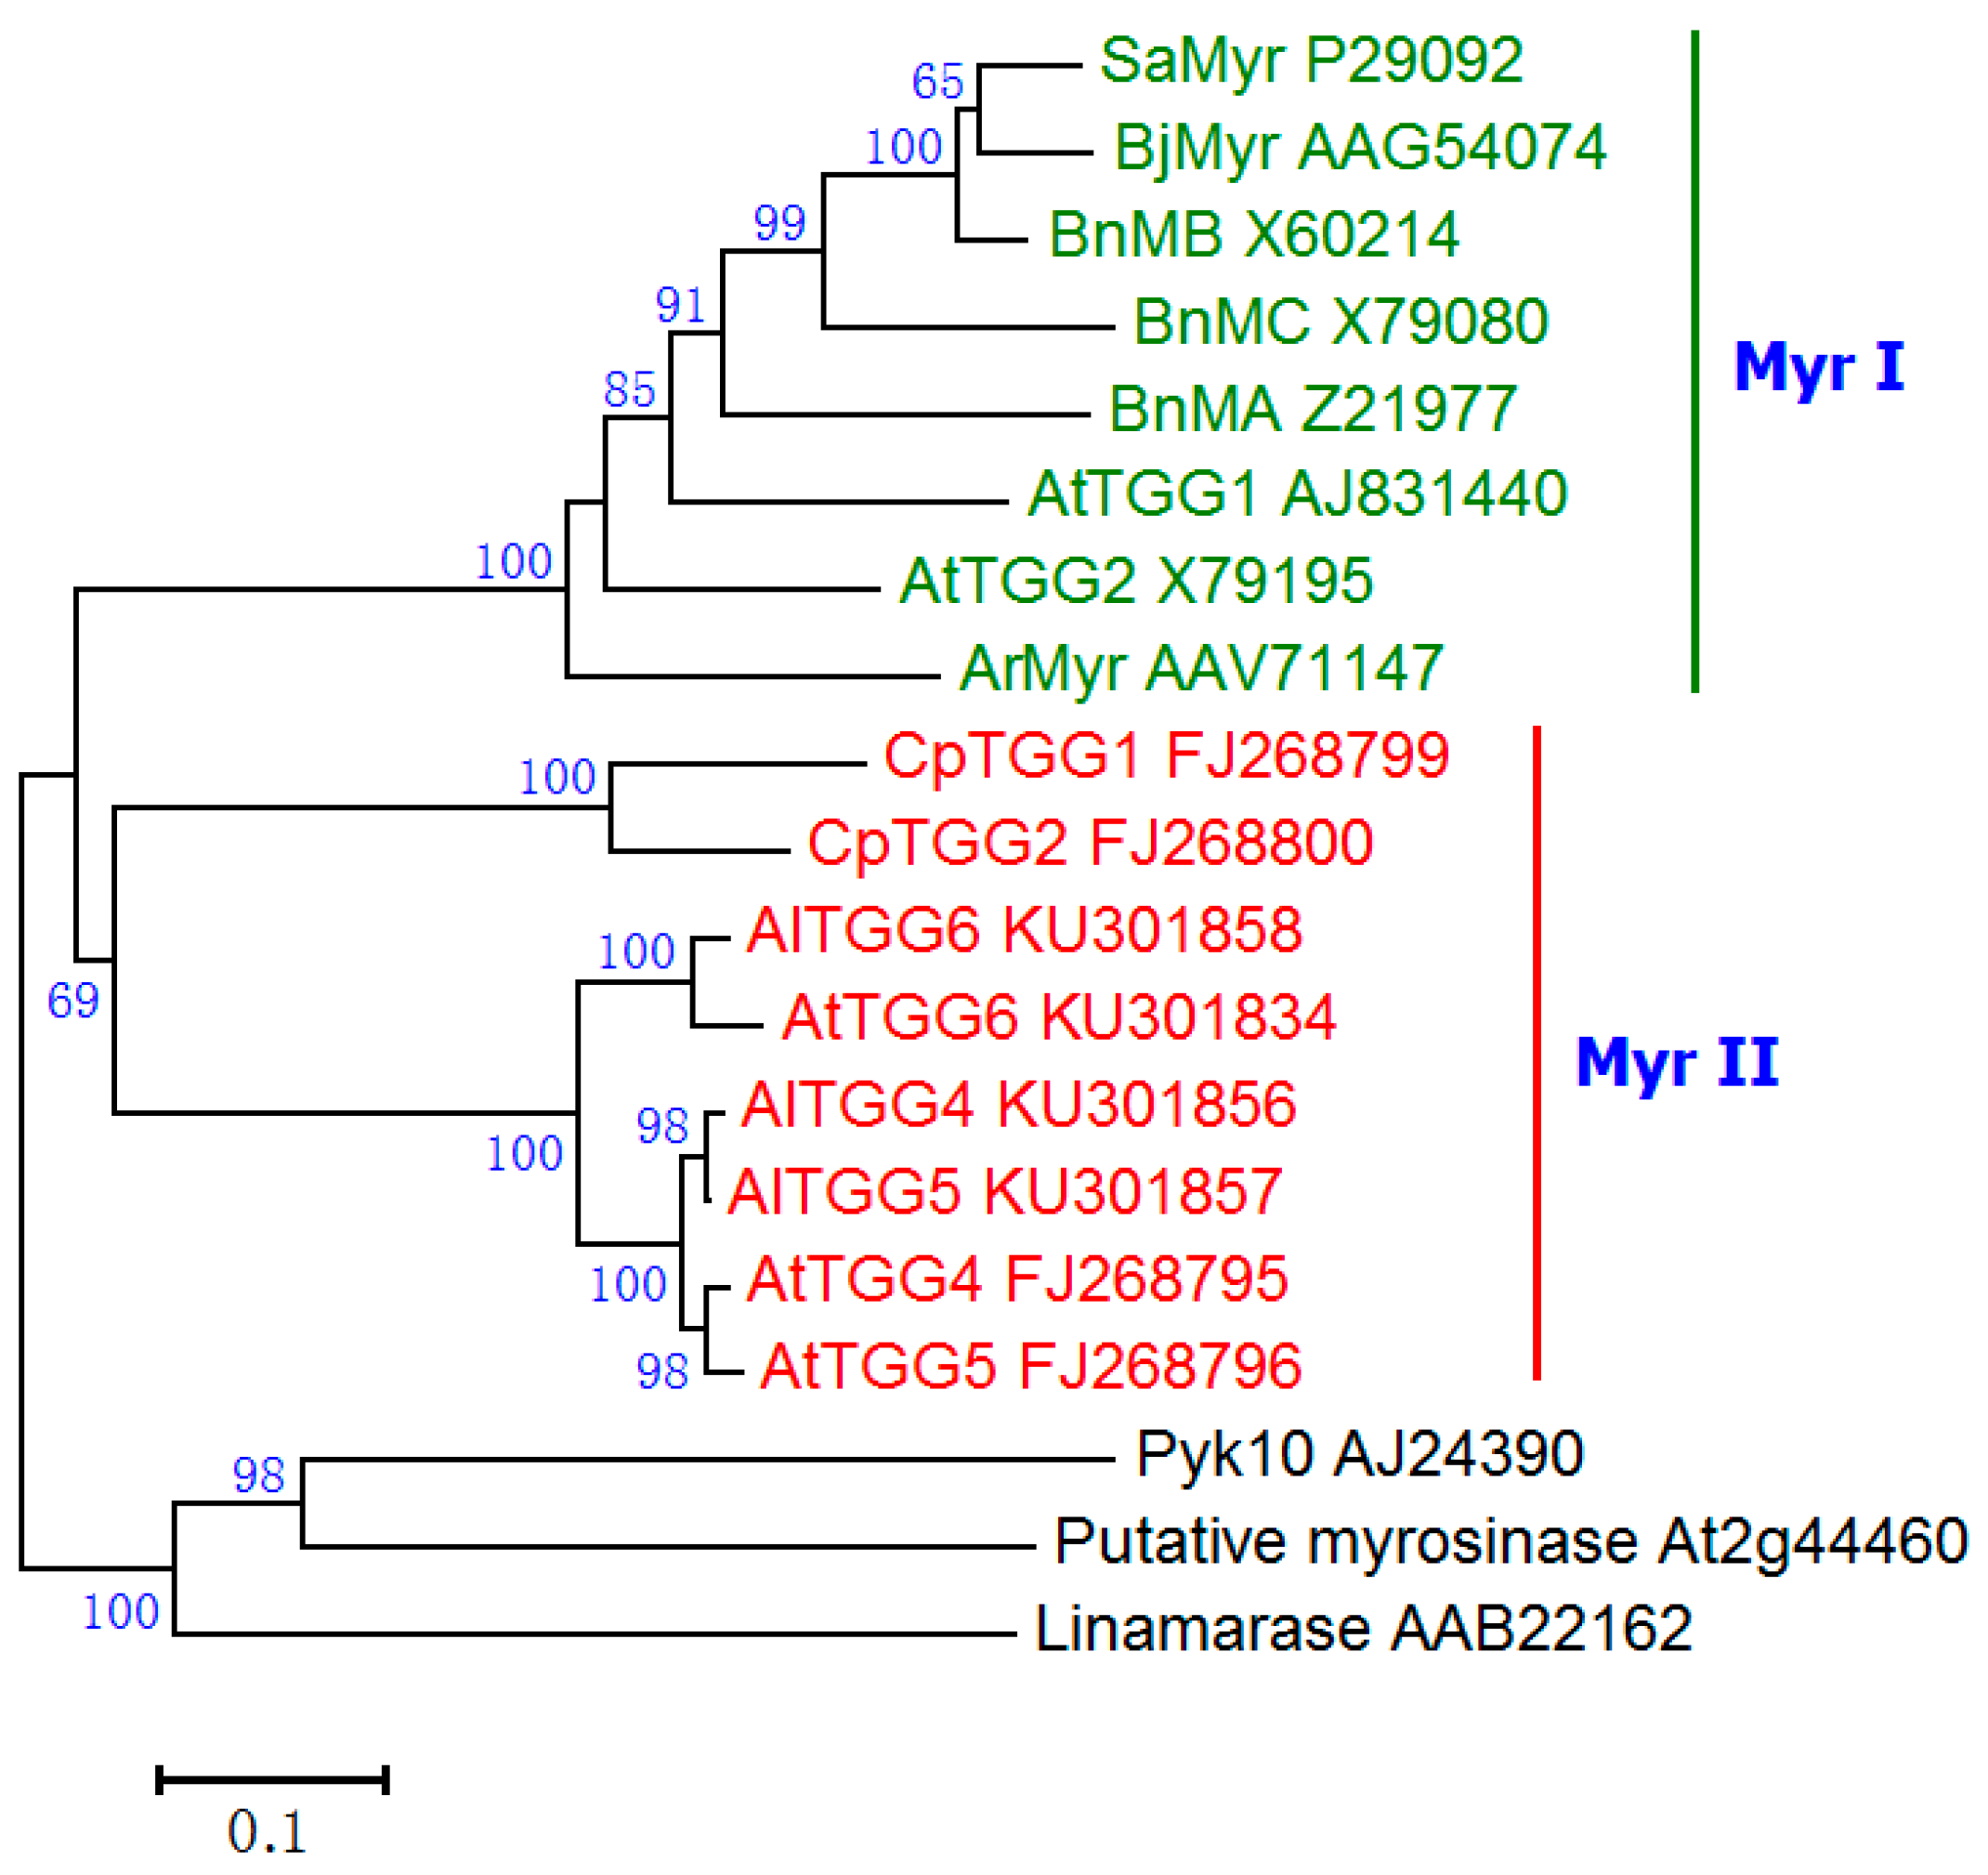
  39. Saitou, N.; Nei, M. The neighbor-joining method: A new method for reconstructing phylogenetic trees. Mol. Biol. Evol. 1987, 4, 406–425. [Google Scholar] [PubMed]
  40. Felsenstein, J. Confidence limits on phylogenies: An approach using the bootstrap. Evolution 1985, 39, 783–791. [Google Scholar] [CrossRef]
  41. Kumar, S.; Stecher, G.; Tamura, K. MEGA7: Molecular evolutionary genetics analysis version 7.0 for bigger datasets. Mol. Biol. Evol. 2016. [Google Scholar] [CrossRef] [PubMed]
  42. Sairam, R.K.; Kumutha, D.; Ezhilmathi, K.; Deshmukh, P.S.; Srivastava, G.C. Physiology and biochemistry of waterlogging tolerance in plants. Biol. Plant. 2008, 52, 401–412. [Google Scholar] [CrossRef]
  43. Zhao, Y. Auxin biosynthesis and its role in plant development. Annu. Rev. Plant Biol. 2010, 61, 49–64. [Google Scholar] [CrossRef] [PubMed]
  44. Li, L.; Hou, X.; Tsuge, T.; Ding, M.; Aoyama, T.; Oka, A.; Gu, H.; Zhao, Y.; Qu, L.J. The possible action mechanisms of indole-3-acetic acid methyl ester in Arabidopsis. Plant Cell Rep. 2008, 27, 575–584. [Google Scholar] [CrossRef] [PubMed]
  45. Yang, Y.; Xu, R.; Ma, C.J.; Vlot, A.C.; Klessig, D.F.; Pichersky, E. Inactive methyl indole-3-acetic acid ester can be hydrolyzed and activated by several esterases belonging to the AtMES esterase family of Arabidopsis. Plant Physiol. 2008, 147, 1034–1045. [Google Scholar] [CrossRef] [PubMed]
  46. Seidel, C.; Walz, A.; Park, S.; Cohen, J.D.; Ludwig-Muller, J. Indole-3-acetic acid protein conjugates: Novel players in auxin homeostasis. Plant Biol. 2006, 8, 340–345. [Google Scholar] [CrossRef] [PubMed]
  47. Walz, A.; Seidel, C.; Rusak, G.; Park, S.; Cohen, J.D.; Ludwig-Muller, J. Heterologous expression of IAP1, a seed protein from bean modified by indole-3-acetic acid, in Arabidopsis thaliana and Medicago truncatula. Planta 2008, 227, 1047–1061. [Google Scholar] [CrossRef] [PubMed]
  48. Korasick, D.A.; Enders, T.A.; Strader, L.C. Auxin biosynthesis and storage forms. J. Exp. Bot. 2013, 64, 2541–2555. [Google Scholar] [CrossRef] [PubMed]
  49. Woodward, A.W.; Bartel, B. Auxin: Regulation, action, and interaction. Ann. Bot. 2005, 95, 707–735. [Google Scholar] [CrossRef] [PubMed]
  50. Kutachek, M.; Prochazka, Z.; Veres, K. Biogenesis of glucobrassicin, the in vitro precursor of ascorbigen. Nature 1962, 194, 393–394. [Google Scholar] [CrossRef]
  51. Underhill, E.W.; Wetter, L.R.; Chisholm, M.D. Biosynthesis of glucosinolates. Biochem. Soc. Symp. 1973, 303–326. [Google Scholar]
  52. Du, L.; Lykkesfeldt, J.; Olsen, C.E.; Halkier, B.A. Involvement of cytochrome P450 in oxime production in glucosinolate biosynthesis as demonstrated by an in vitro microsomal enzyme system isolated from jasmonic acid-induced seedlings of Sinapis alba L. Proc. Natl. Acad. Sci. USA 1995, 92, 12505–12509. [Google Scholar] [CrossRef] [PubMed]
  53. Hull, A.K.; Vij, R.; Celenza, J.L. Arabidopsis cytochrome P450s that catalyze the first step of tryptophan-dependent indole-3-acetic acid biosynthesis. Proc. Natl. Acad. Sci. USA 2000, 97, 2379–2384. [Google Scholar] [CrossRef] [PubMed]
  54. Zhao, Y.; Hull, A.K.; Gupta, N.R.; Goss, K.A.; Alonso, J.; Ecker, J.R.; Normanly, J.; Chory, J.; Celenza, J.L. Trp-dependent auxin biosynthesis in Arabidopsis: Involvement of cytochrome P450s CYP79B2 and CYP79B3. Gene Dev. 2002, 16, 3100–3112. [Google Scholar] [CrossRef] [PubMed]
  55. Mikkelsen, M.D.; Naur, P.; Halkier, B.A. Arabidopsis mutants in the C–S lyase of glucosinolate biosynthesis establish a critical role for indole-3-acetaldoxime in auxin homeostasis. Plant J. 2004, 37, 770–777. [Google Scholar] [CrossRef] [PubMed]
  56. Boerjan, W.; Cervera, M.T.; Delarue, M.; Beeckman, T.; Dewitte, W.; Bellini, C.; Caboche, M.; van Onckelen, H.; van Montagu, M.; Inze, D. Superroot, a recessive mutation in Arabidopsis, confers auxin overproduction. Plant Cell 1995, 7, 1405–1419. [Google Scholar] [CrossRef] [PubMed]
  57. An, Y.Q.; McDowell, J.M.; Huang, S.; McKinney, E.C.; Chambliss, S.; Meagher, R.B. Strong, constitutive expression of the Arabidopsis ACT2/ACT8 actin subclass in vegetative tissues. Plant J. 1996, 10, 107–121. [Google Scholar] [CrossRef] [PubMed]
  58. Bechtold, N.; Ellis, J.; Pelletier, G. In planta agrobacterium mediated gene transfer by infiltration of adult Arabidopsis thaliana plants. C. R. Acad. Sci. Paris Life Sci. 1993, 316, 1194–1199. [Google Scholar]
  59. Jefferson, R.A.; Kavanagh, T.A.; Bevan, M.W. Gus fusions: β-glucuronidase as a sensitive and versatile gene fusion marker in higher plants. EMBO J. 1987, 6, 3901–3907. [Google Scholar] [PubMed]
Figure 1. RT-PCR analysis of the myrosinase gene family in Arabidopsis thaliana. An actin gene (ACT2, U41998) was used as control.
Ijms 17 00892 g001
Figure 2. Gene expression pattern of AtTGG4 Prom::GUS. (A) A four-day-old seedling; (B) a two-week-old plant; (C) roots induced from the petiole of a leaf showing root-tip specific GUS staining; (D) a leaf; (E) an inflorescence; (F) a silique; (G) wild-type (negative control); and (H) transgenic plants with CaMV 35S::GUS (positive control).
Ijms 17 00892 g002
Figure 3. Gene expression pattern of AtTGG5 Prom::GUS. (A) Four-day-old seedlings; (B) a two-week-old plants; (C) a zoomed-in image of a root-tip showing the expression region of AtTGG5 Prom::GUS in the whole tip; (D) a zoomed-in image of a hairy zone; and (E) a zoomed-in image of a root-tip of AtTGG4 Prom::GUS presented here for easier comparison between AtTGG4 and AtTGG5.
Ijms 17 00892 g003
Figure 4. Schematic presentations of PCR primers and verification of single and double gene mutants in A. thaliana. (A) Relative locations of three Myr II genes in Chromosome I (Chr I) of A. thaliana; (B) schematic of PCR primers used to identify T-DNA insertion and homozygous mutants; the triangles stand for the T-DNA insertions in the relevant genes; (C) confirmation of T-DNA insertion in the single and double mutants using four primer pairs; and (D) myrosinase activity in roots of the single and double mutants; different letters on the columns indicate significant difference at 1% significant level.
Ijms 17 00892 g004
Figure 5. Root growth of AtTGG4 and AtTGG5 mutants on Murashiege & Skoog (MS) medium (A,B) and in soil with sufficient water (C,D). (A) Representative plates of four genotypes grown on MS medium for two weeks; scale bar represents 1 cm; (B) analysis of root lengths grown on MS medium; different letters above the columns indicate significant difference at 5% significant level; (C) representative seedlings of four genotypes grown in soil for two weeks after sowing; scale bars represent 5 mm; and (D) analysis of root lengths grown in soil; different letters indicate significant difference at 5% significant level.
Ijms 17 00892 g005
Figure 6. The role of AtTGG4 and AtTGG5 in auxin biosynthesis. (A) GUS staining of the parents: DR5::GUS and tgg4tgg5; (B) representative F1 plants; and (C) representative plants of the segregating F2 generation. Zoom-in images of the root-tips were presented beside each seedling.
Ijms 17 00892 g006
Figure 7. Root growth of AtTGG4 and AtTGG5 mutants in soil with excessive water. (A) Analysis of root length grown in soil with excessive water (EW) and sufficient water (SW) for two weeks after sowing; different letters above columns indicate significance at 5% significant level; and (B) representative seedlings of the four genotypes grown in soil with excessive water for two weeks after sowing; scale bars represent 5 mm.
Ijms 17 00892 g007
Figure 8. Evolutionary relationships of myrosinases and O-β-glucosidases. The evolutionary history was inferred using the neighbor-joining method [39]. The percentage of replicate trees in which the associated taxa clustered together in the bootstrap test (1000 replicates) are shown next to the branches [40]. Evolutionary analyses were conducted in MEGA7 [41]. The scale bar indicates 0.1 residue substitutions.
Ijms 17 00892 g008
Figure 9. A model of the tryptophan-dependent auxin biosynthetic pathways. Modified from Zhao et al. [43]. The pathway that AtTGG4 and AtTGG5 are involved in is shown in red. Solid arrows indicate that the enzymes catalyzing the steps have been identified; Dashed arrows indicate proposed steps, in which enzymes catalyzing the steps have not been determined conclusively. TAM, tryptamine; IAOx, indole-3-acetaldoxime; IPA, indole-3-pyruvate; IAM, indole-3-acetamide; IAN, indole-3-acetonitrile; TGG, thioglucoside glucohydrolase (AtTGG4, AtTGG5).
Ijms 17 00892 g009
Table 1. Genotypes of gametes and F2 individuals of the hybrid TGG4tgg5E12/tgg4E8TGG5.
GametesTGG4-tgg5E12 (≈44%)tgg4E8-TGG5 (≈44%)TGG4-TGG5 (≈6%)tgg4E8-tgg5E12 (≈6%)
TGG4-tgg5E12 (≈44%)TGG4-tgg5E12tgg4E8-TGG5TGG4-TGG5tgg4E8-tgg5E12
TGG4-tgg5E12TGG4-tgg5E12TGG4-tgg5E12TGG4-tgg5E12
(≈19.4%)(≈19.4%)(≈2.6%)(≈2.6%)
tgg4E8-TGG5 (≈44%)TGG4-tgg5E12tgg4E8-TGG5TGG4-TGG5tgg4E8-tgg5E12
tgg4E8-TGG5tgg4E8-TGG5tgg4E8-TGG5tgg4E8-TGG5
(≈19.4%)(≈19.4%)(≈2.6%)(≈2.6%)
TGG4-TGG5 (≈6%)TGG4-tgg5E12tgg4E8-TGG5TGG4-TGG5tgg4E8-tgg5E12
TGG4-TGG5TGG4-TGG5TGG4-TGG5TGG4-TGG5
(≈2.6%)(≈2.6%)(≈0.36%)(≈0.36%)
tgg4E8-tgg5E12 (≈6%)TGG4-tgg5E12tgg4E8-TGG5TGG4-TGG5tgg4E8-tgg5E12
tgg4E8-tgg5E12tgg4E8-tgg5E12tgg4E8-tgg5E12tgg4E8-tgg5E12
(≈2.6%)(≈2.6%)(≈0.36%)(≈0.36%)
The frequencies of genotypes in brackets were based on the assumption of an average 250 kb/cM for A. thaliana [34]; Recombinant gametes and F2 individuals with recombinant events were presented in grey.

