European Digital Elevation Model Validation against Extensive Global Navigation Satellite Systems Data and Comparison with SRTM DEM and ASTER GDEM in Central Macedonia (Greece)


Abstract
:1. Introduction
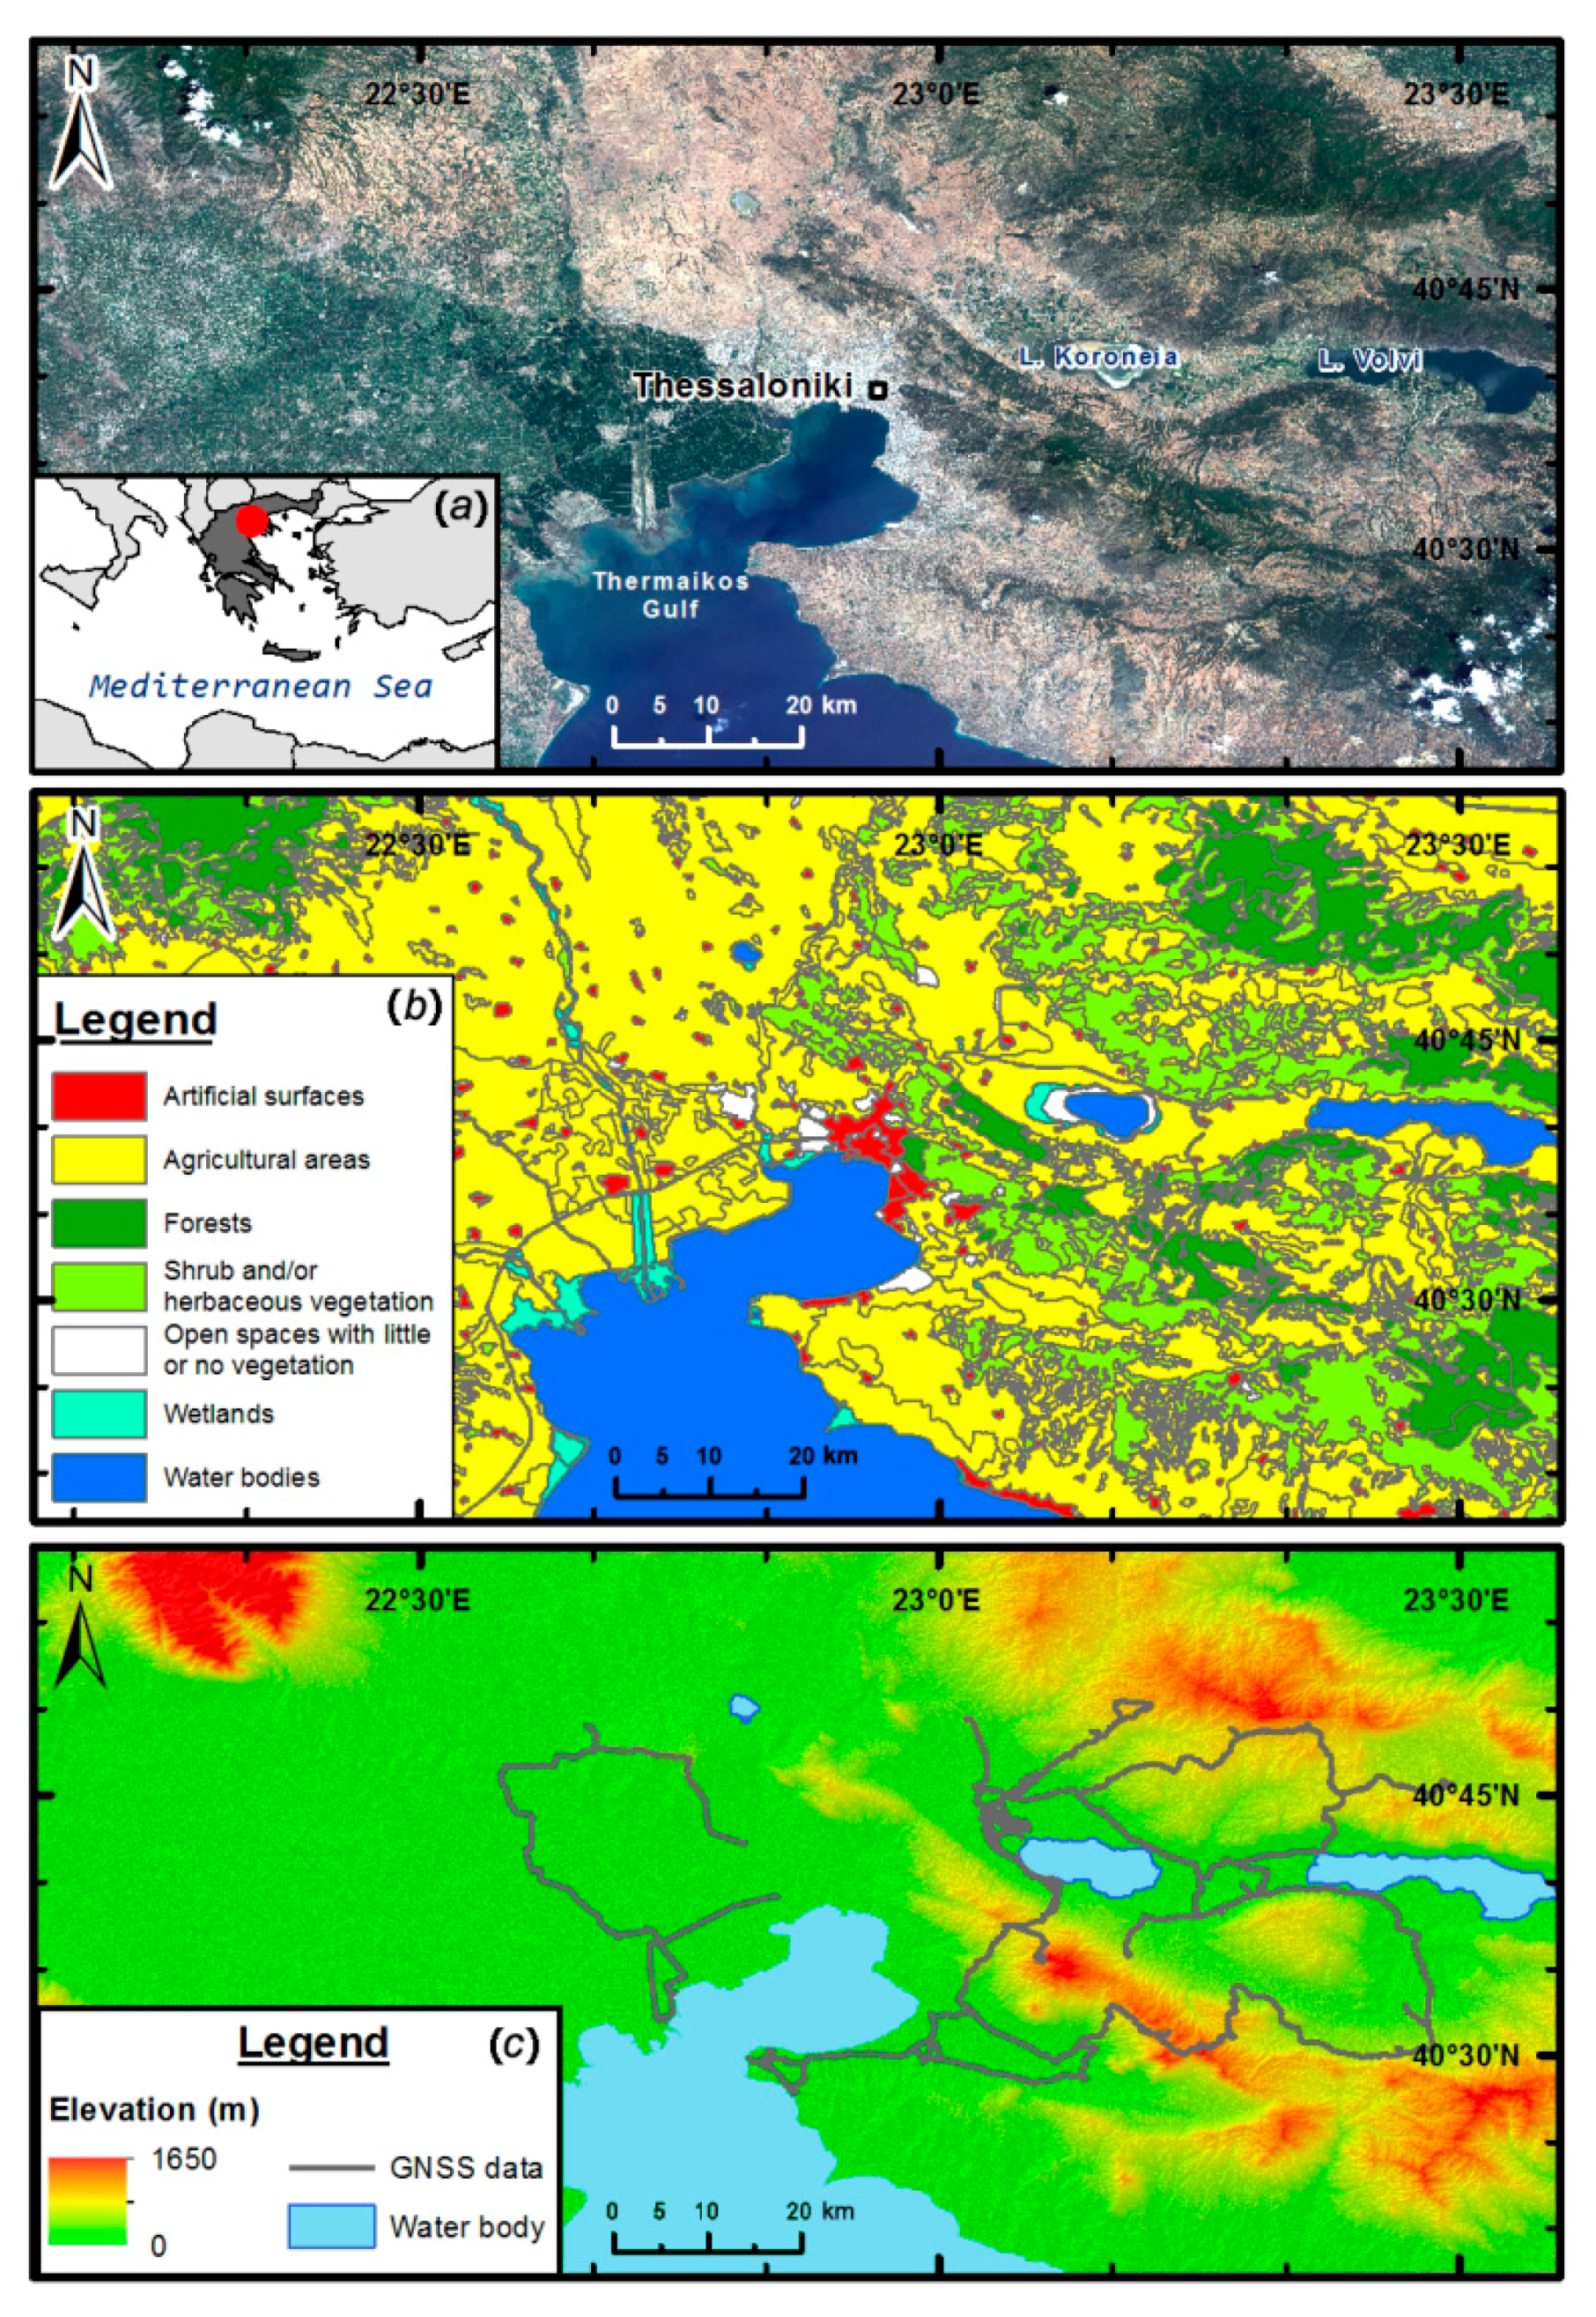
2. Study Area
3. Materials and Methods
3.1. Data Used in the Evaluation
3.1.1. Digital Elevation Models
- (1)
- EU-DEM v1: The original version of EU-DEM produced by merging NASA’s SRTM DEM v2 (also known as the “finished” version) with ASTER-GDEM v2 1-arcsec data to generate a 1-arcsec resolution (about 23 × 30 m in the study area) DEM using a weighted averaging approach. EU-DEM is generated as a contiguous dataset divided into 1° × 1° tiles, corresponding to the SRTM DEM naming convention. The spatial reference system of EU-DEM is geographic latitude/longitude, with horizontal datum ETRS89, ellipsoid GRS80 and vertical datum the European Vertical Reference System 2000 (EVRS2000), using the European Gravimetric Geoid model EGG08. The 1° × 1° tiles are then also aggregated into 5° × 5° tiles, which are further projected to the European Terrestrial Reference System 1989-Lambert Azimuthal Equal Area projection (ETRS89-LAEA) by the Joint Research Centre (JRC) [9].
- (2)
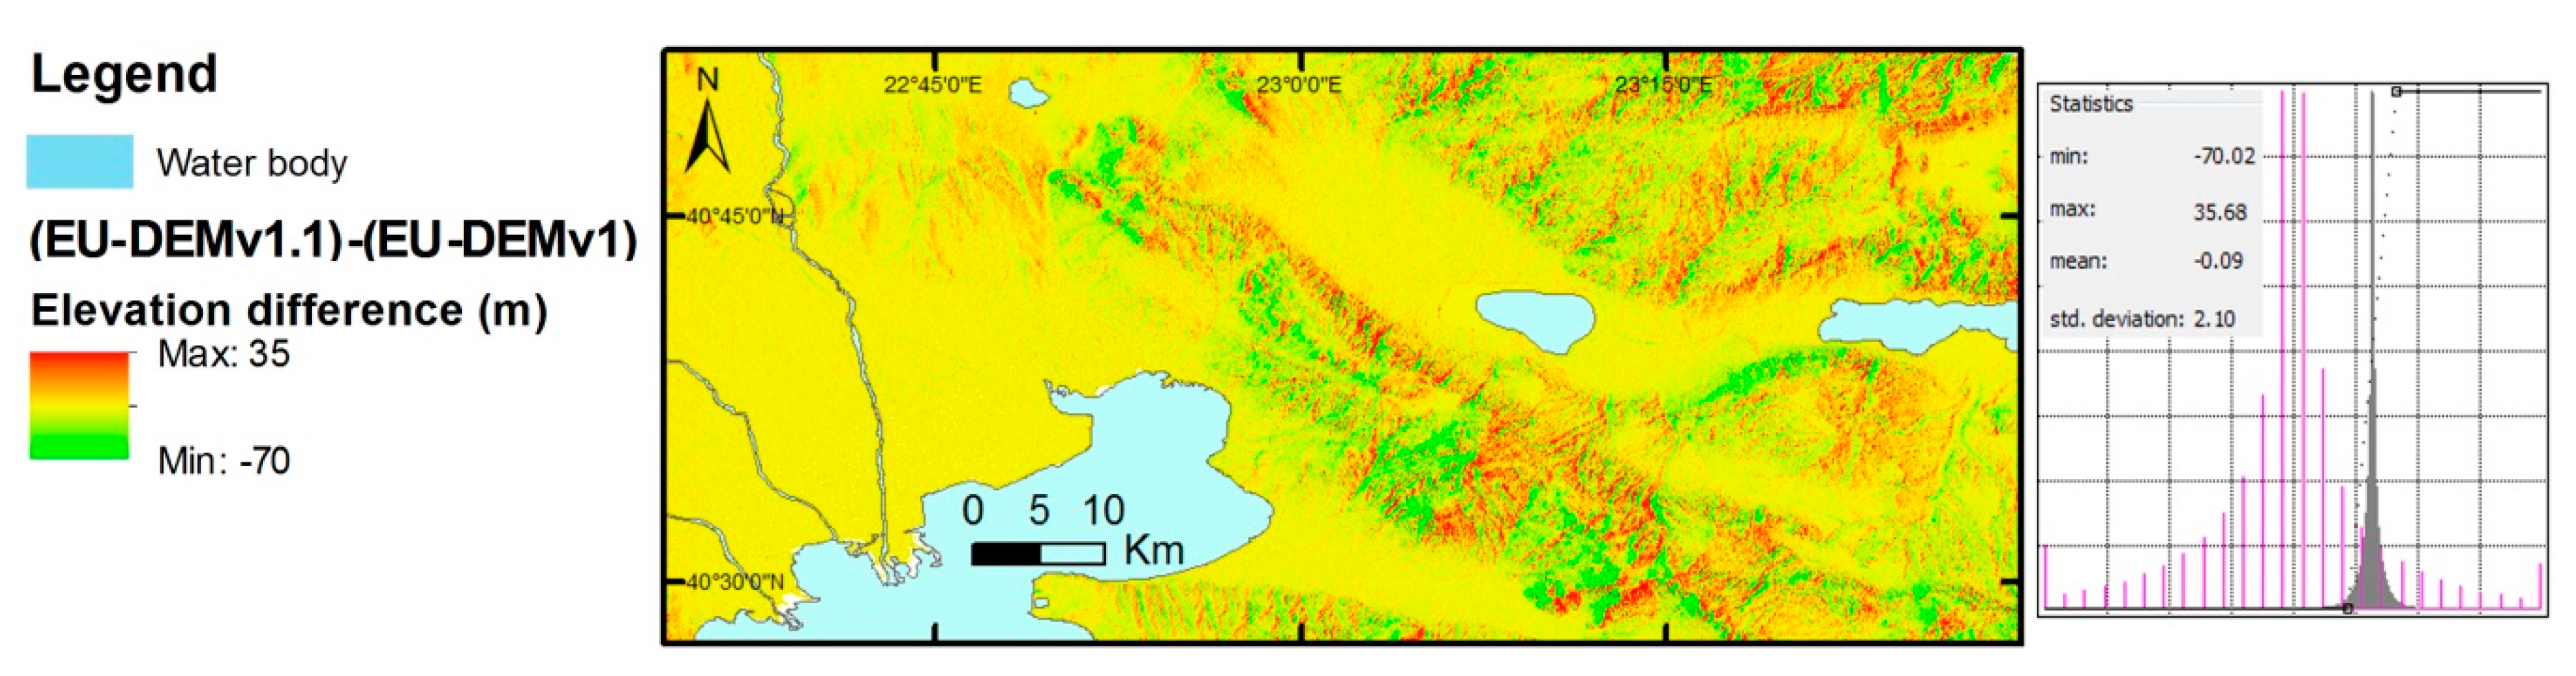
- EU-DEM v1.1: A resulting dataset of the EU-DEM v1.0 upgrade, enhancing geolocation accuracy with the use of SPOT 2011 imagery, screening and removal of artefacts including the presence of blunders (i.e., negative or positive anomalies), improving the vertical accuracy using Ice, Cloud, and land Elevation Satellite (ICESat) data as reference (bias adjustment with ICESat points), as well as ensuring consistency with EU-Hydro 2015 data (river networks, coastlines, water bodies). EU-DEM v1.1 is only provided in projected coordinates (ETRS89-LAEA) in grouped tiles covering extensive regions at a 25-m resolution [11].
- (3)
- SRTM DEM v4: A 3-arcsecond resolution (about 69 × 90 m in the study area) DEM, delivered in 5° × 5° tiles by the Consultative Group on International Agricultural Research-Consortium for Spatial Information (CGIAR-CSI) [38]. A thorough validation of SRTM DEM for the area of interest can be found in Mouratidis et al. [26]. Note that according to Mouratidis et al. [26], for the area of interest, the CGIAR-CSI SRTM v4 is identical to SRTM v2 from NASA. The reason why v4 is used here is because it is provided in larger tiles than v2; thus, for a reasonable study area extent, the process of having to mosaic different SRTM DEM tiles can usually be avoided. The data are provided in the World Geodetic System of 1984 (WGS 84) latitude and longitude and orthometric height with respect to the Earth Geopotential Model of 1996 (EGM96) [39].
- (4)
- ASTER GDEM version two (v2): This stereoscopic product is an improved version of the first release in 2009, with a resolution of 1 arcsecond (about 23 × 30 m in the study area) [4]. It includes 260,000 additional scenes to improve coverage, a smaller kernel-to-yield correlation, higher spatial resolution, and improved water masking. The negative 5 m overall bias observed in ASTER GDEM v1 was eliminated in the newer version. ASTER GDEM v2 is distributed in 1° × 1° tiles. The data are given in WGS 84 latitude and longitude and orthometric height with respect to the EGM96 geoid.
3.1.2. GNSS Data
3.1.3. Other Data and Software
3.2. Data Preparation
3.2.1. Horizontal and Vertical Datum Transformations
3.2.2. GNSS Data Pre-Processing
3.2.3. Pre-Processing of DEMs
4. Results
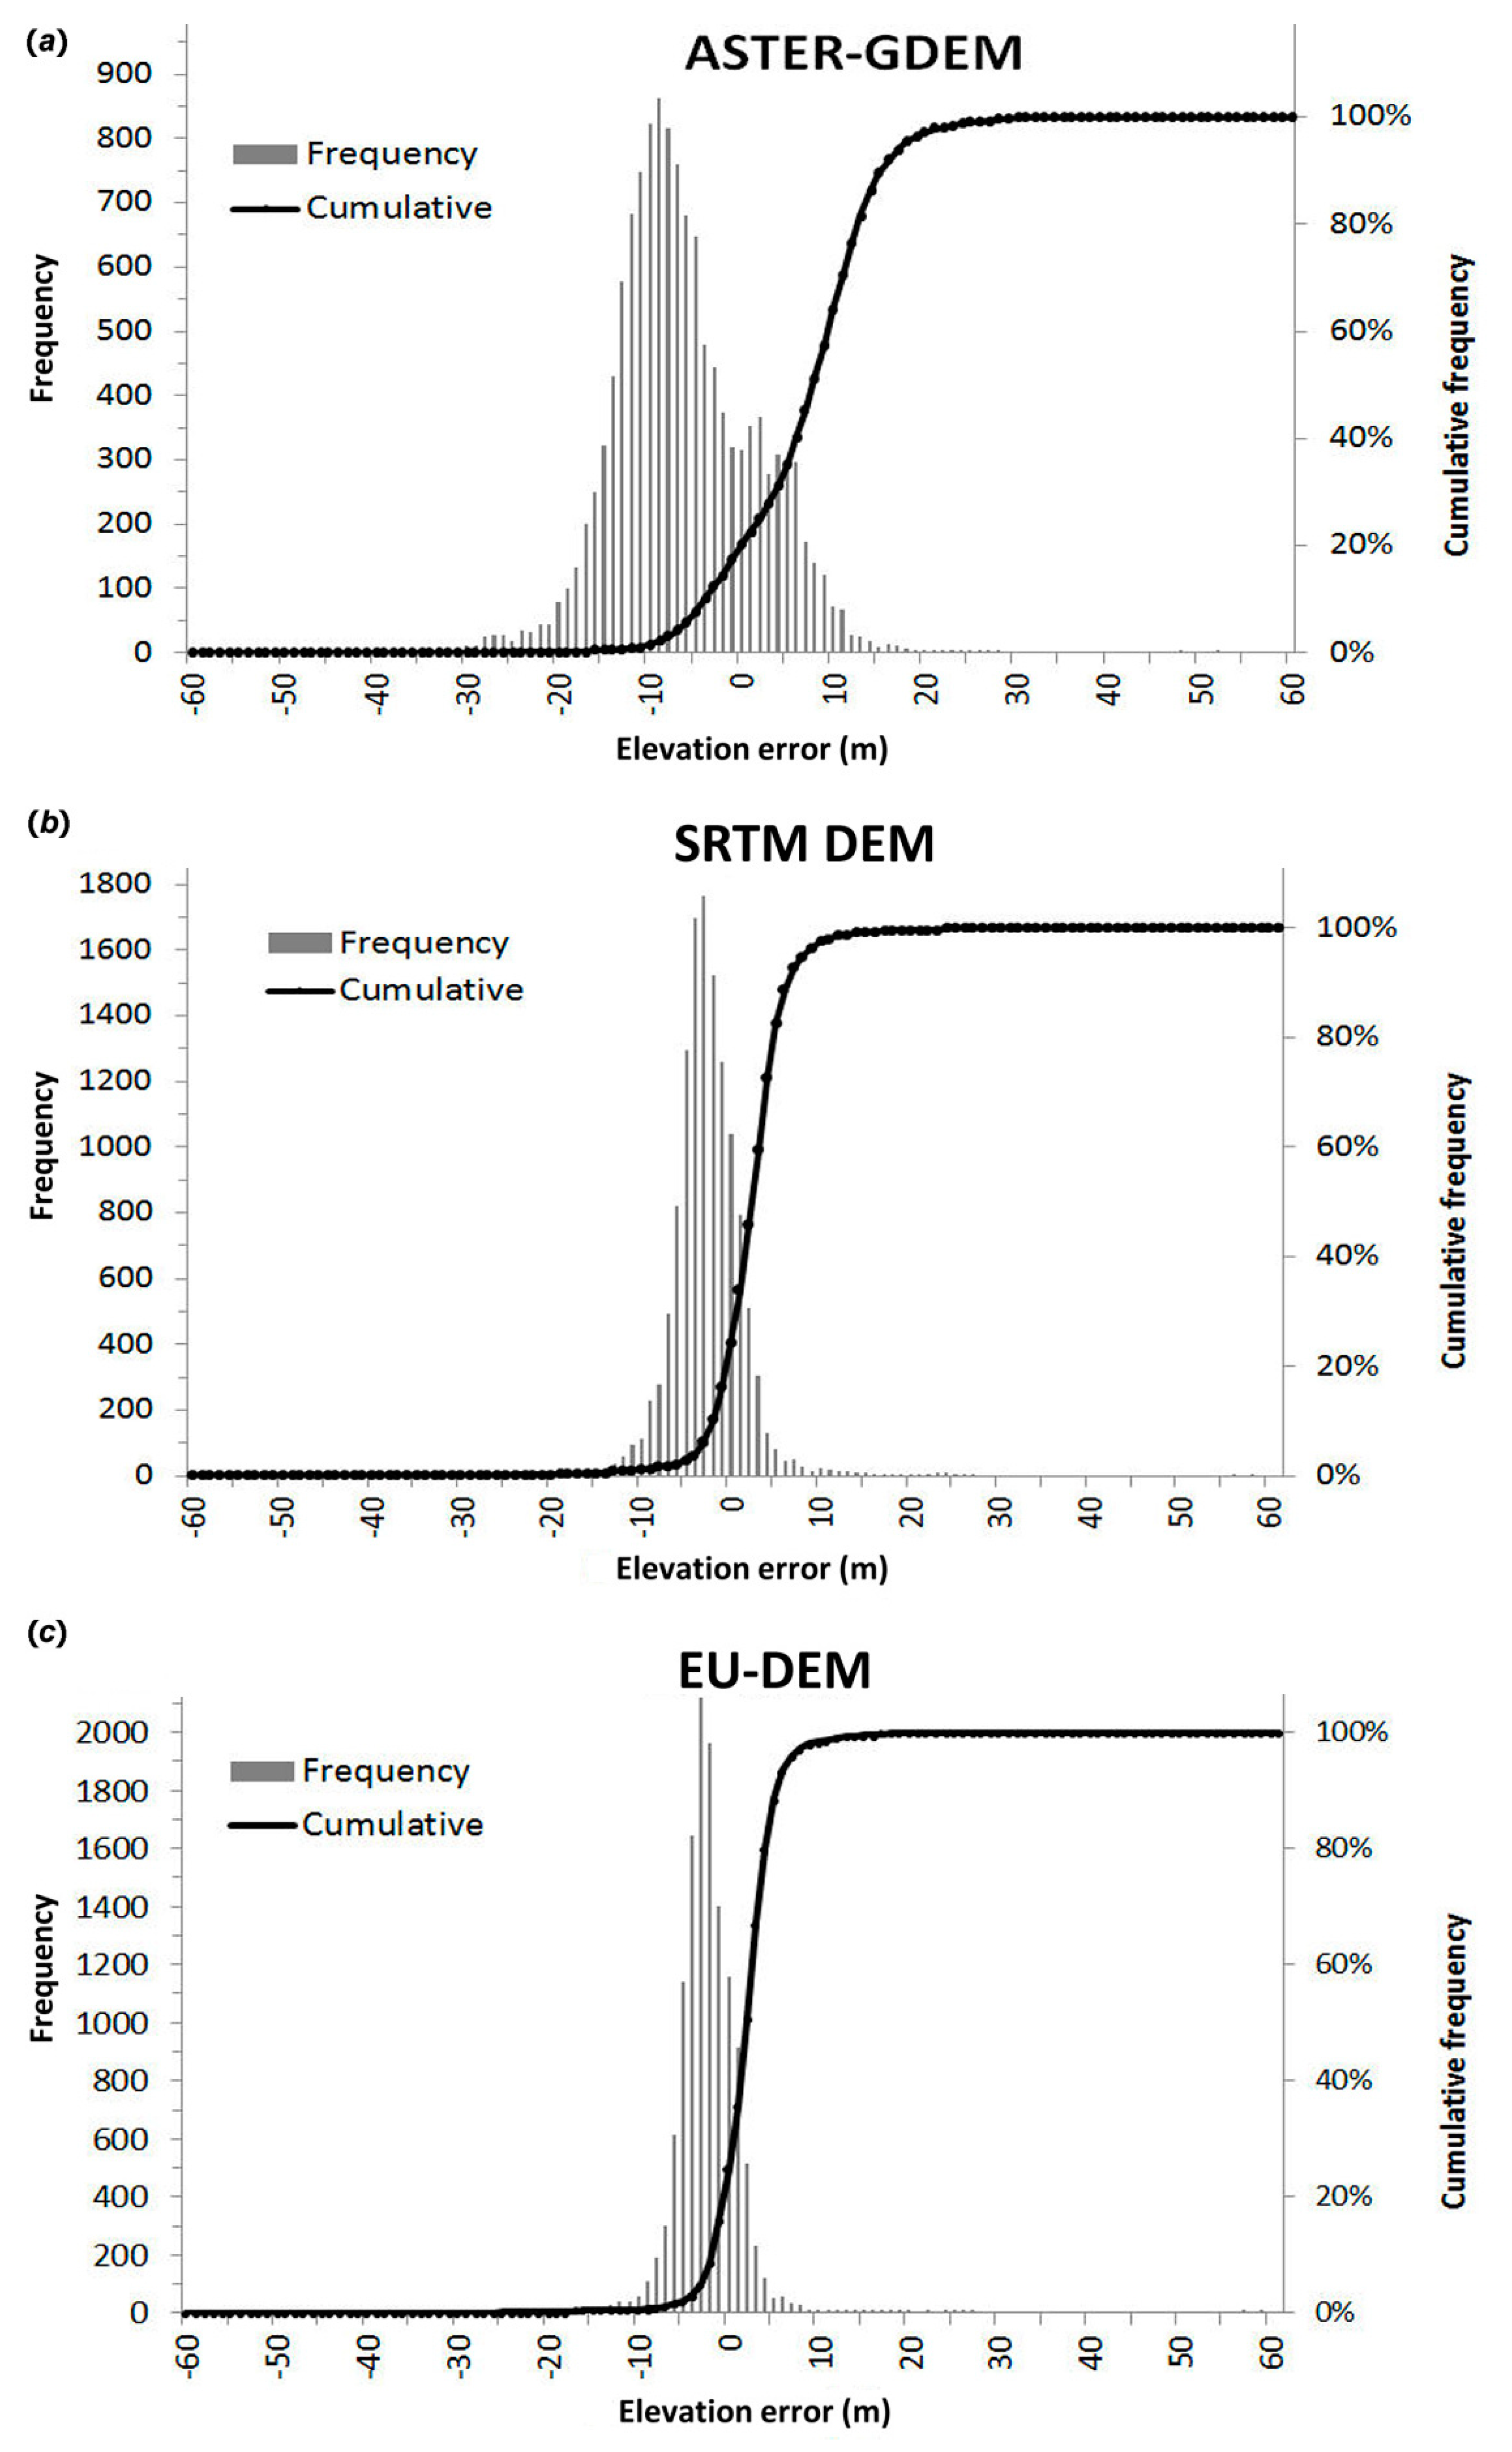
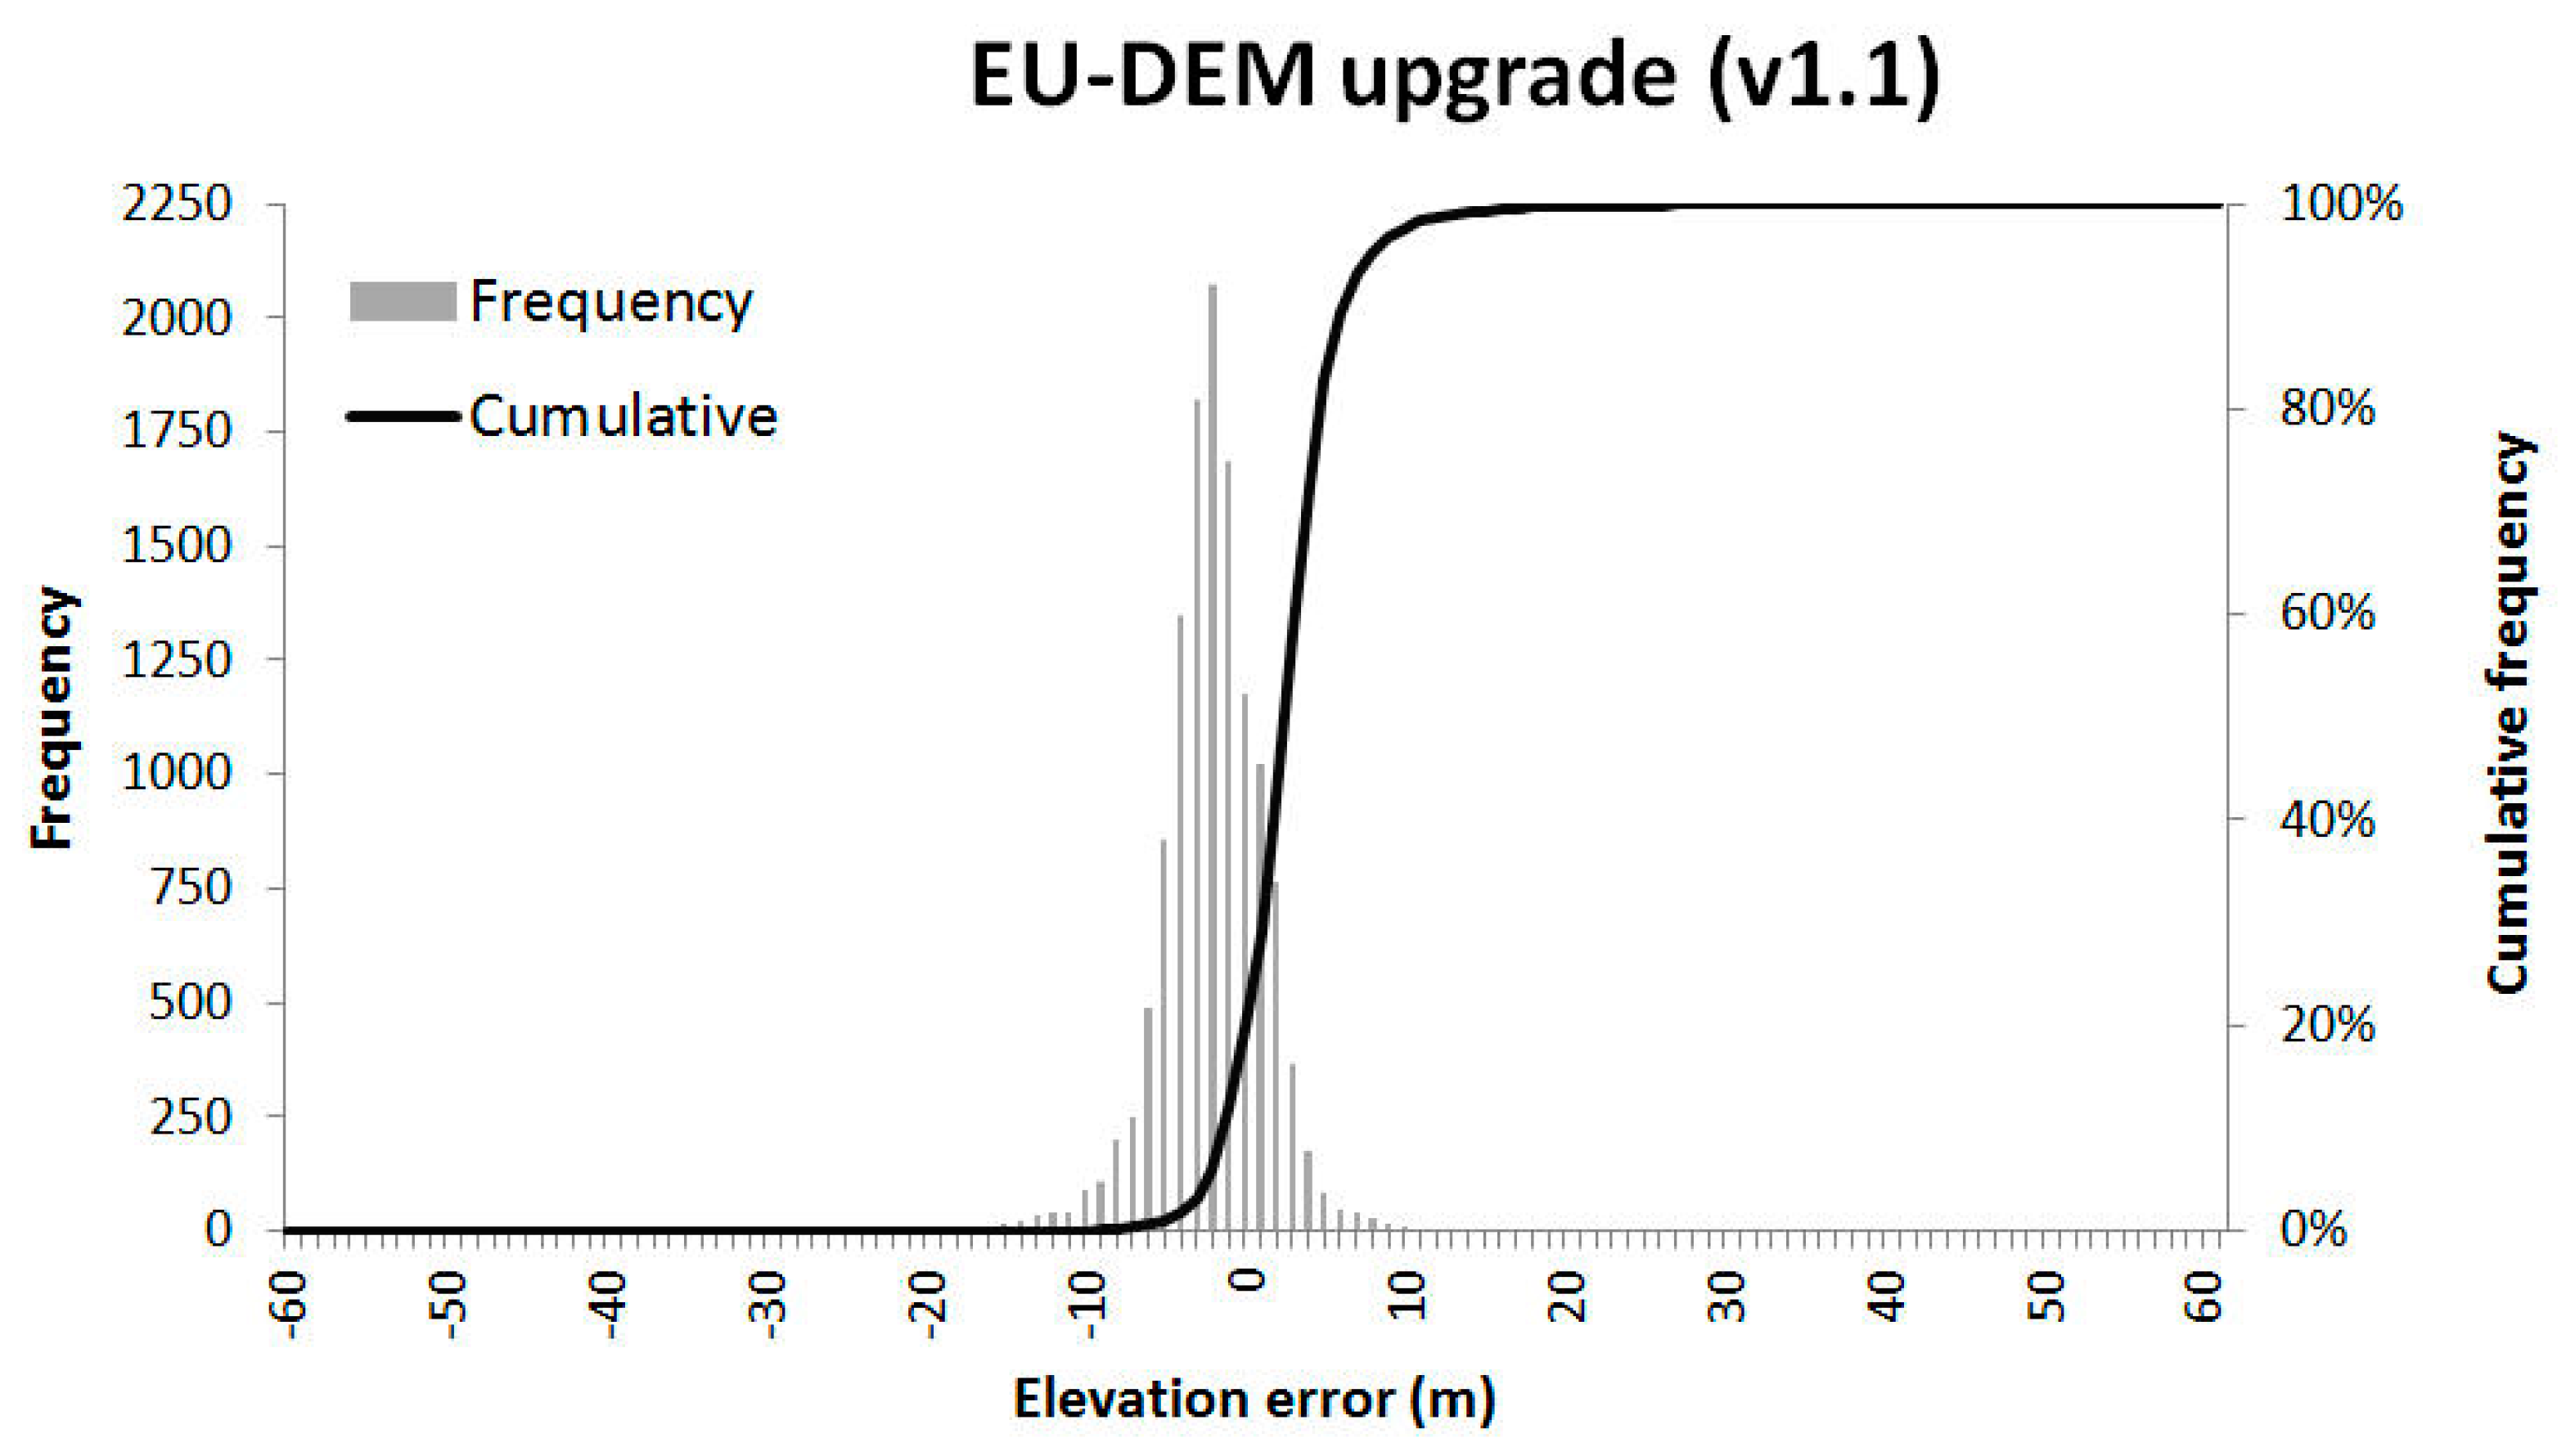
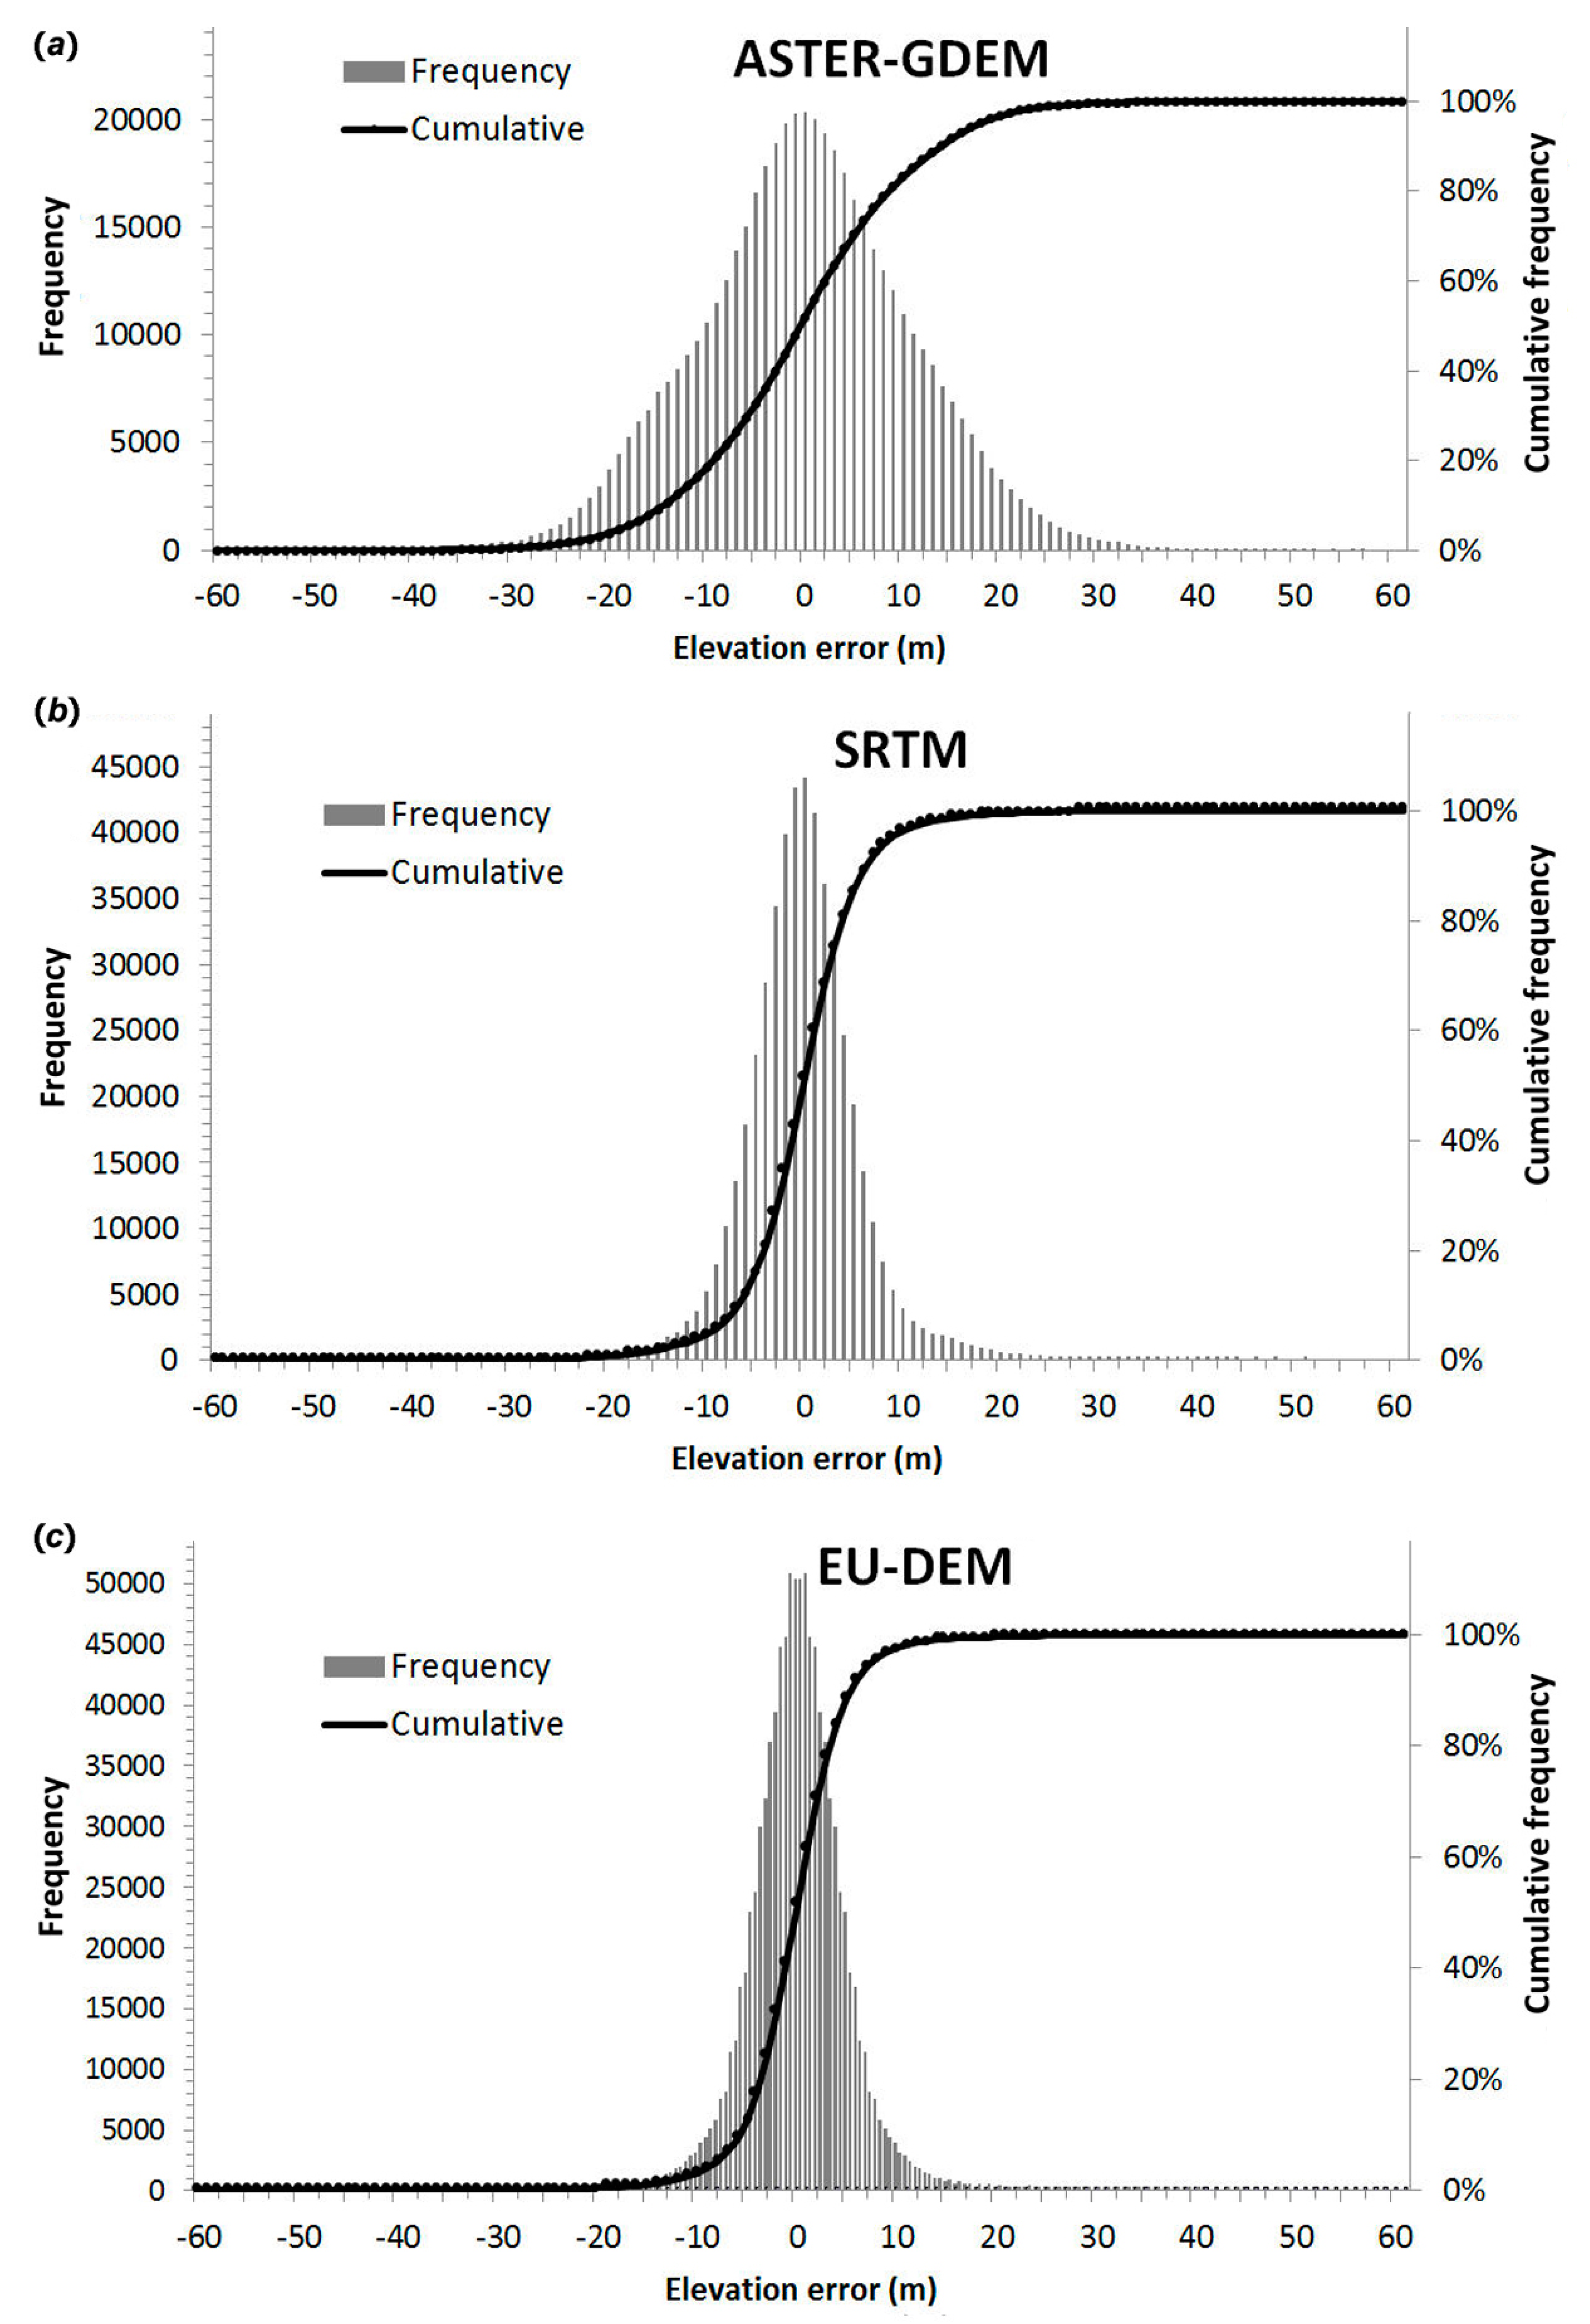
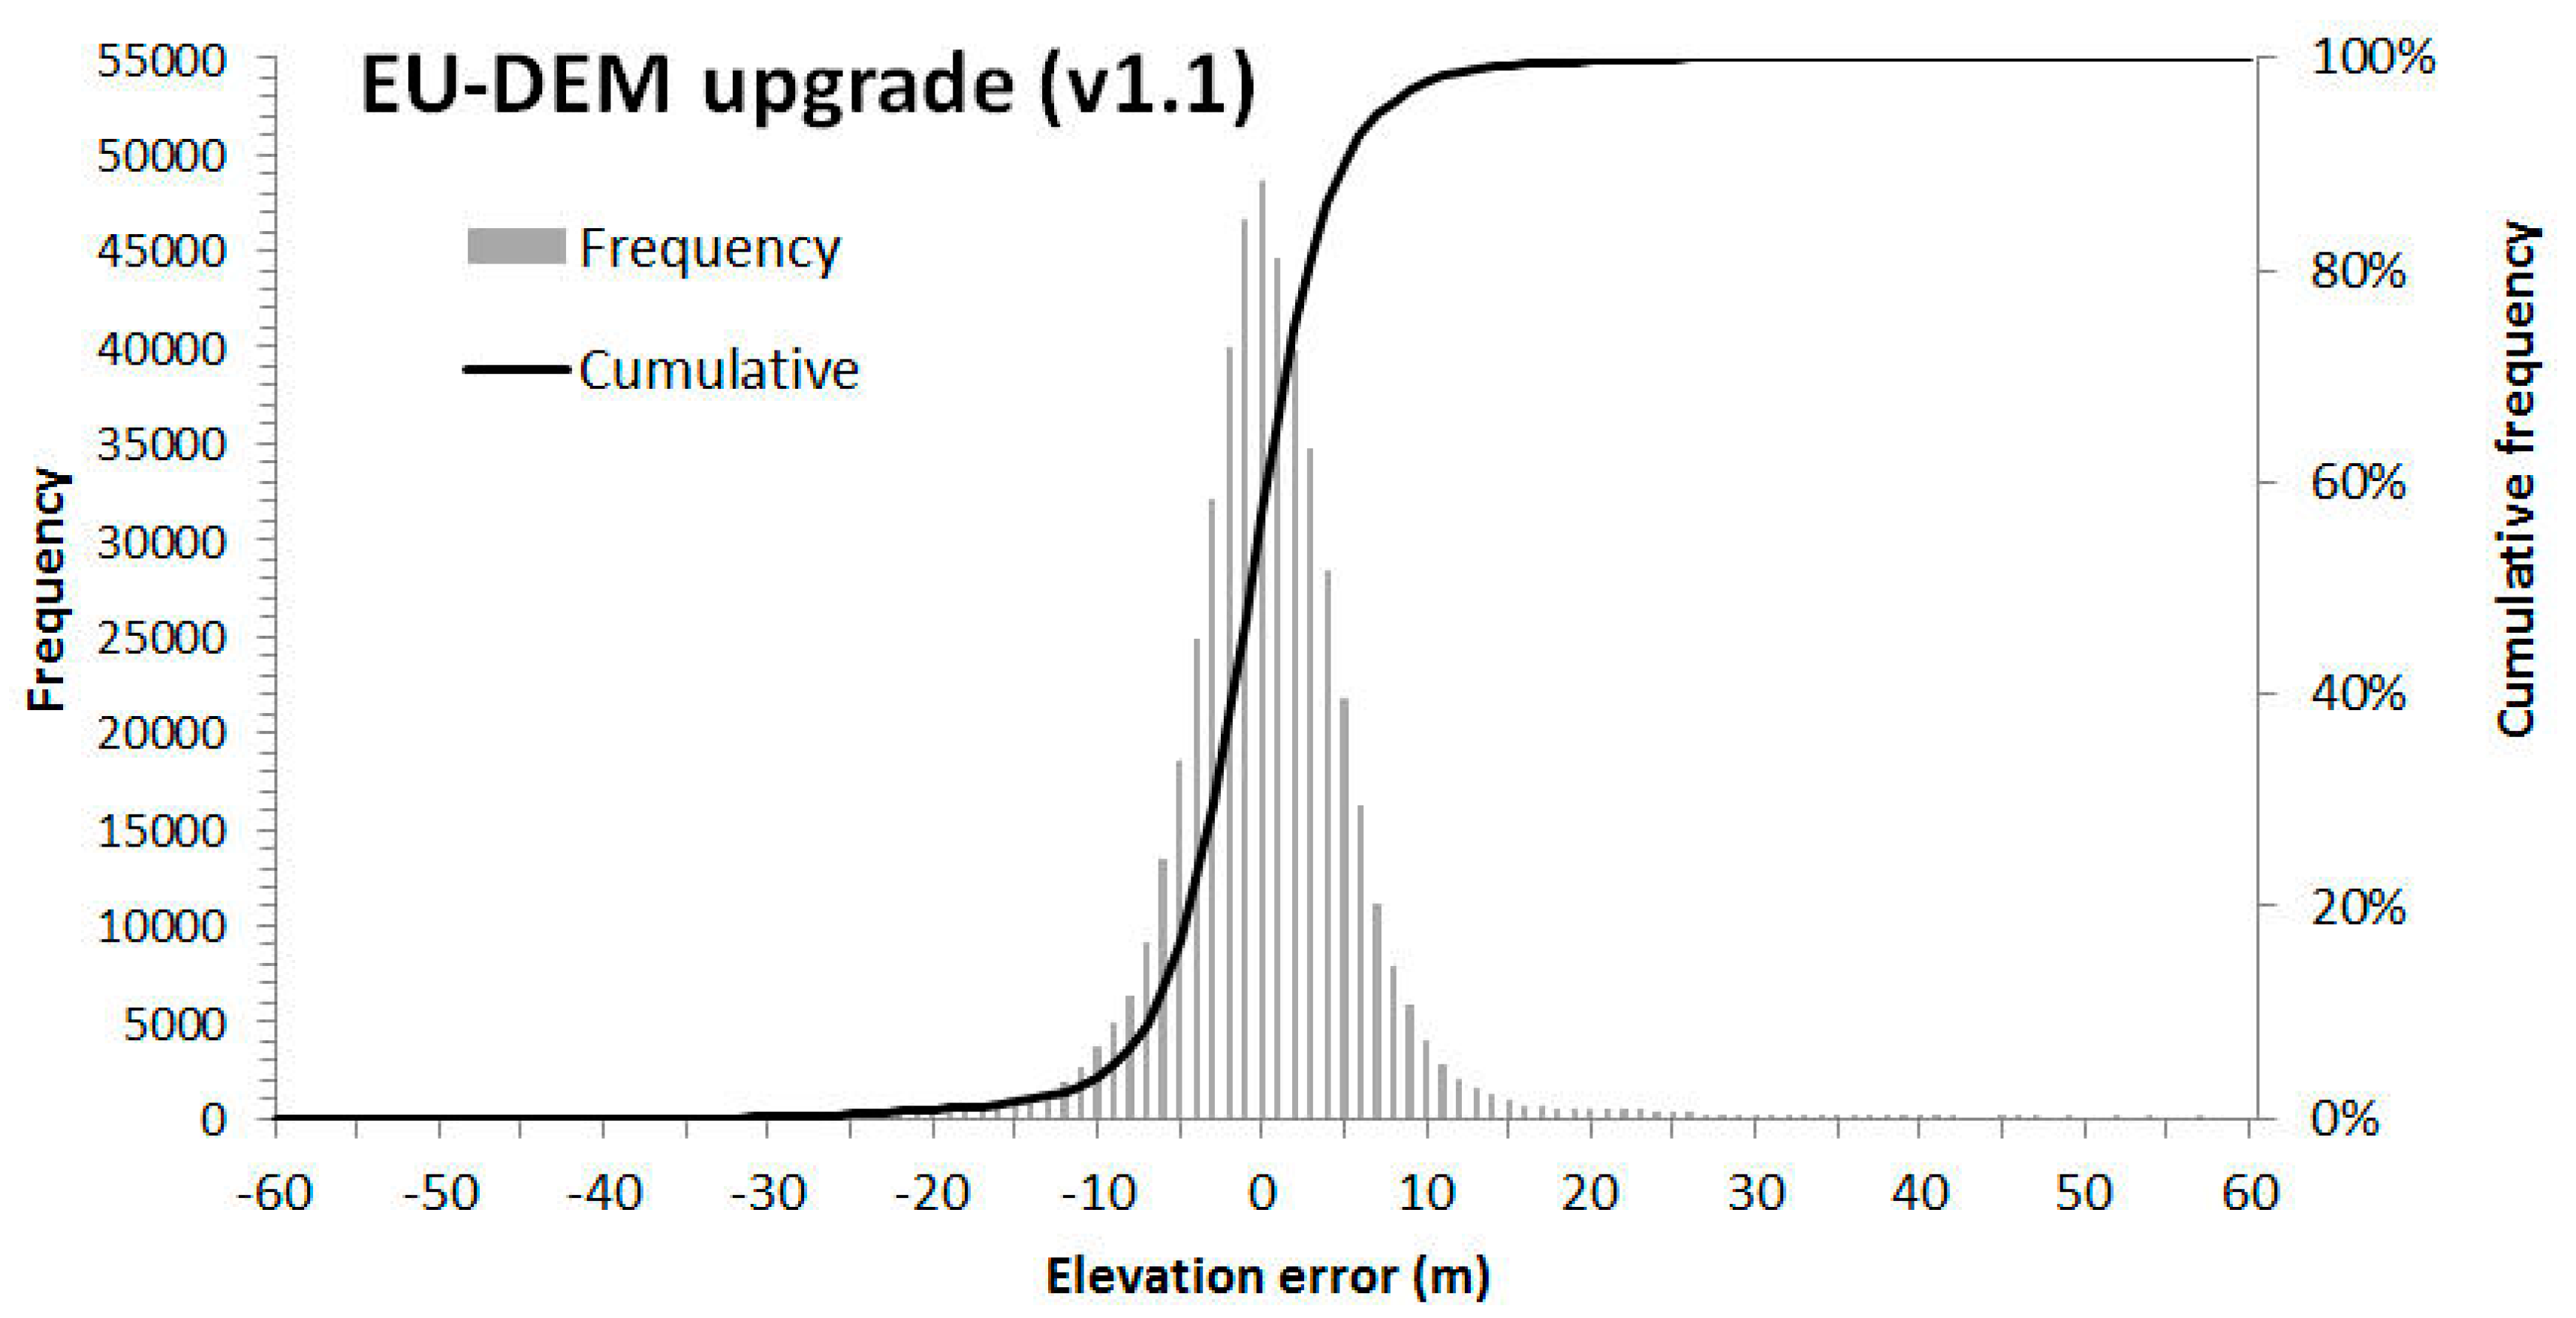
4.1. Direct Comparison of EU-DEM with SRTM DEM and ASTER GDEM
4.2. Absolute Elevations
4.3. Relative Elevation
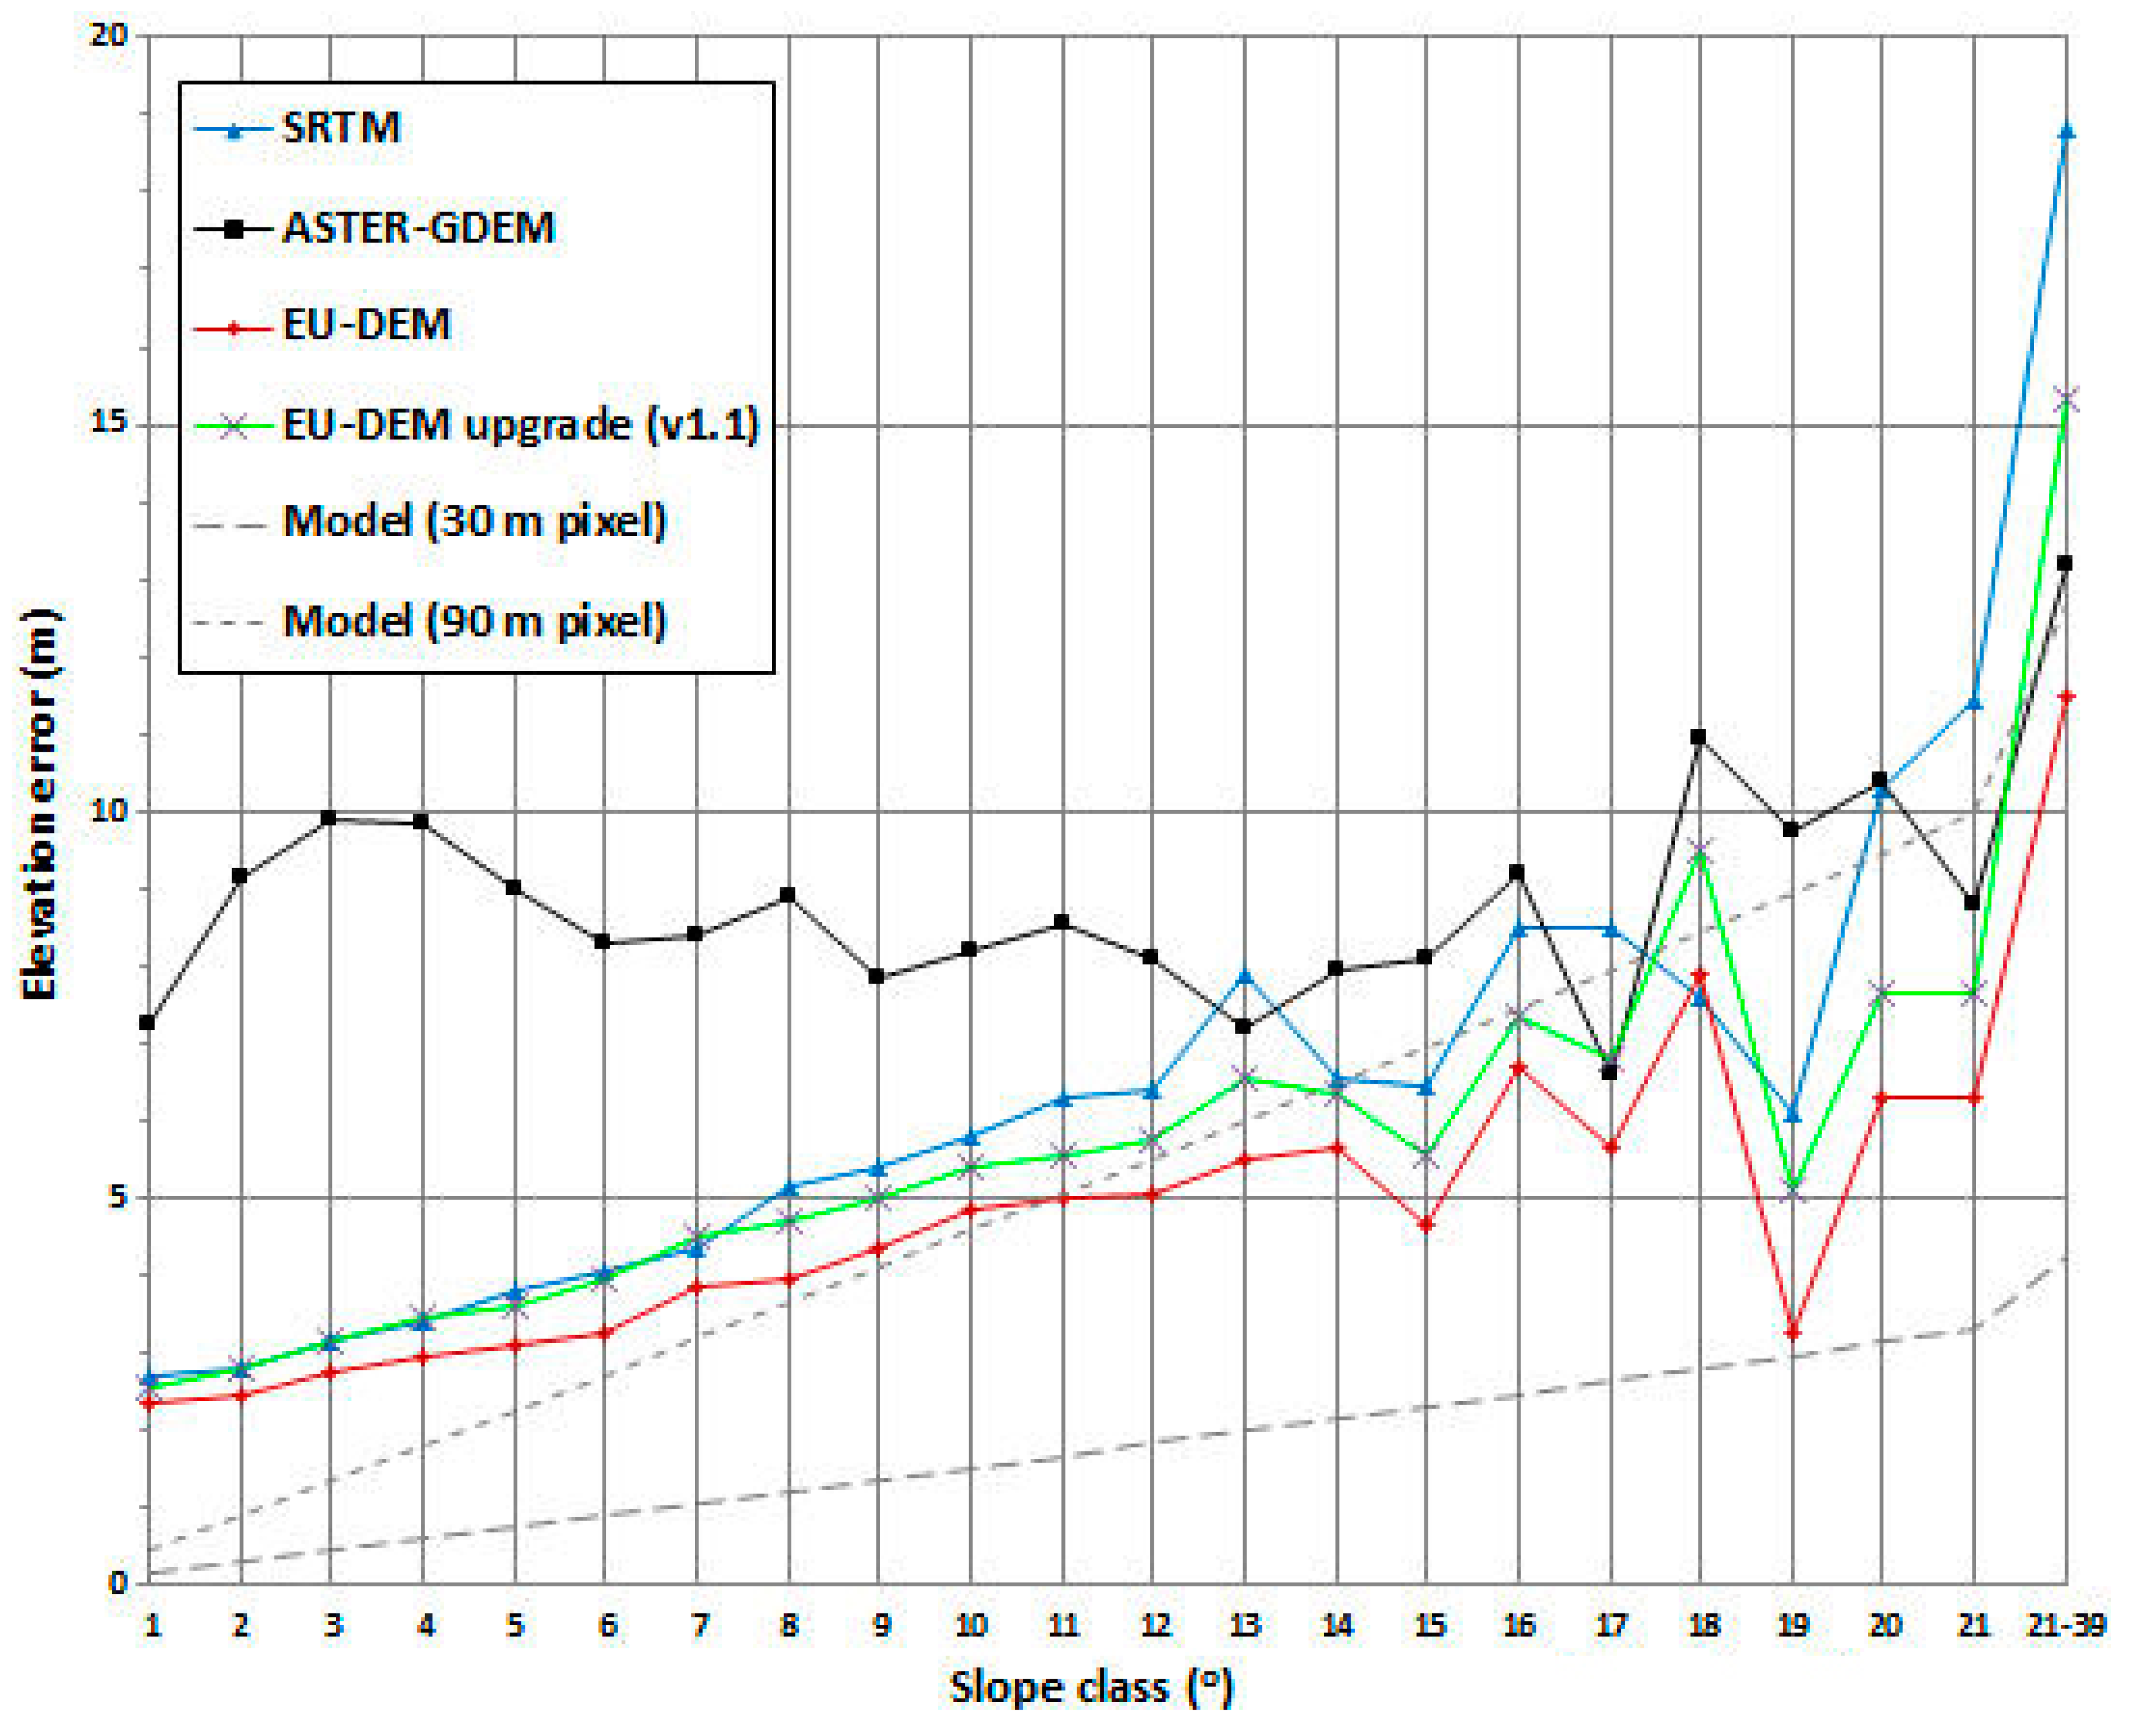
4.4. Slope
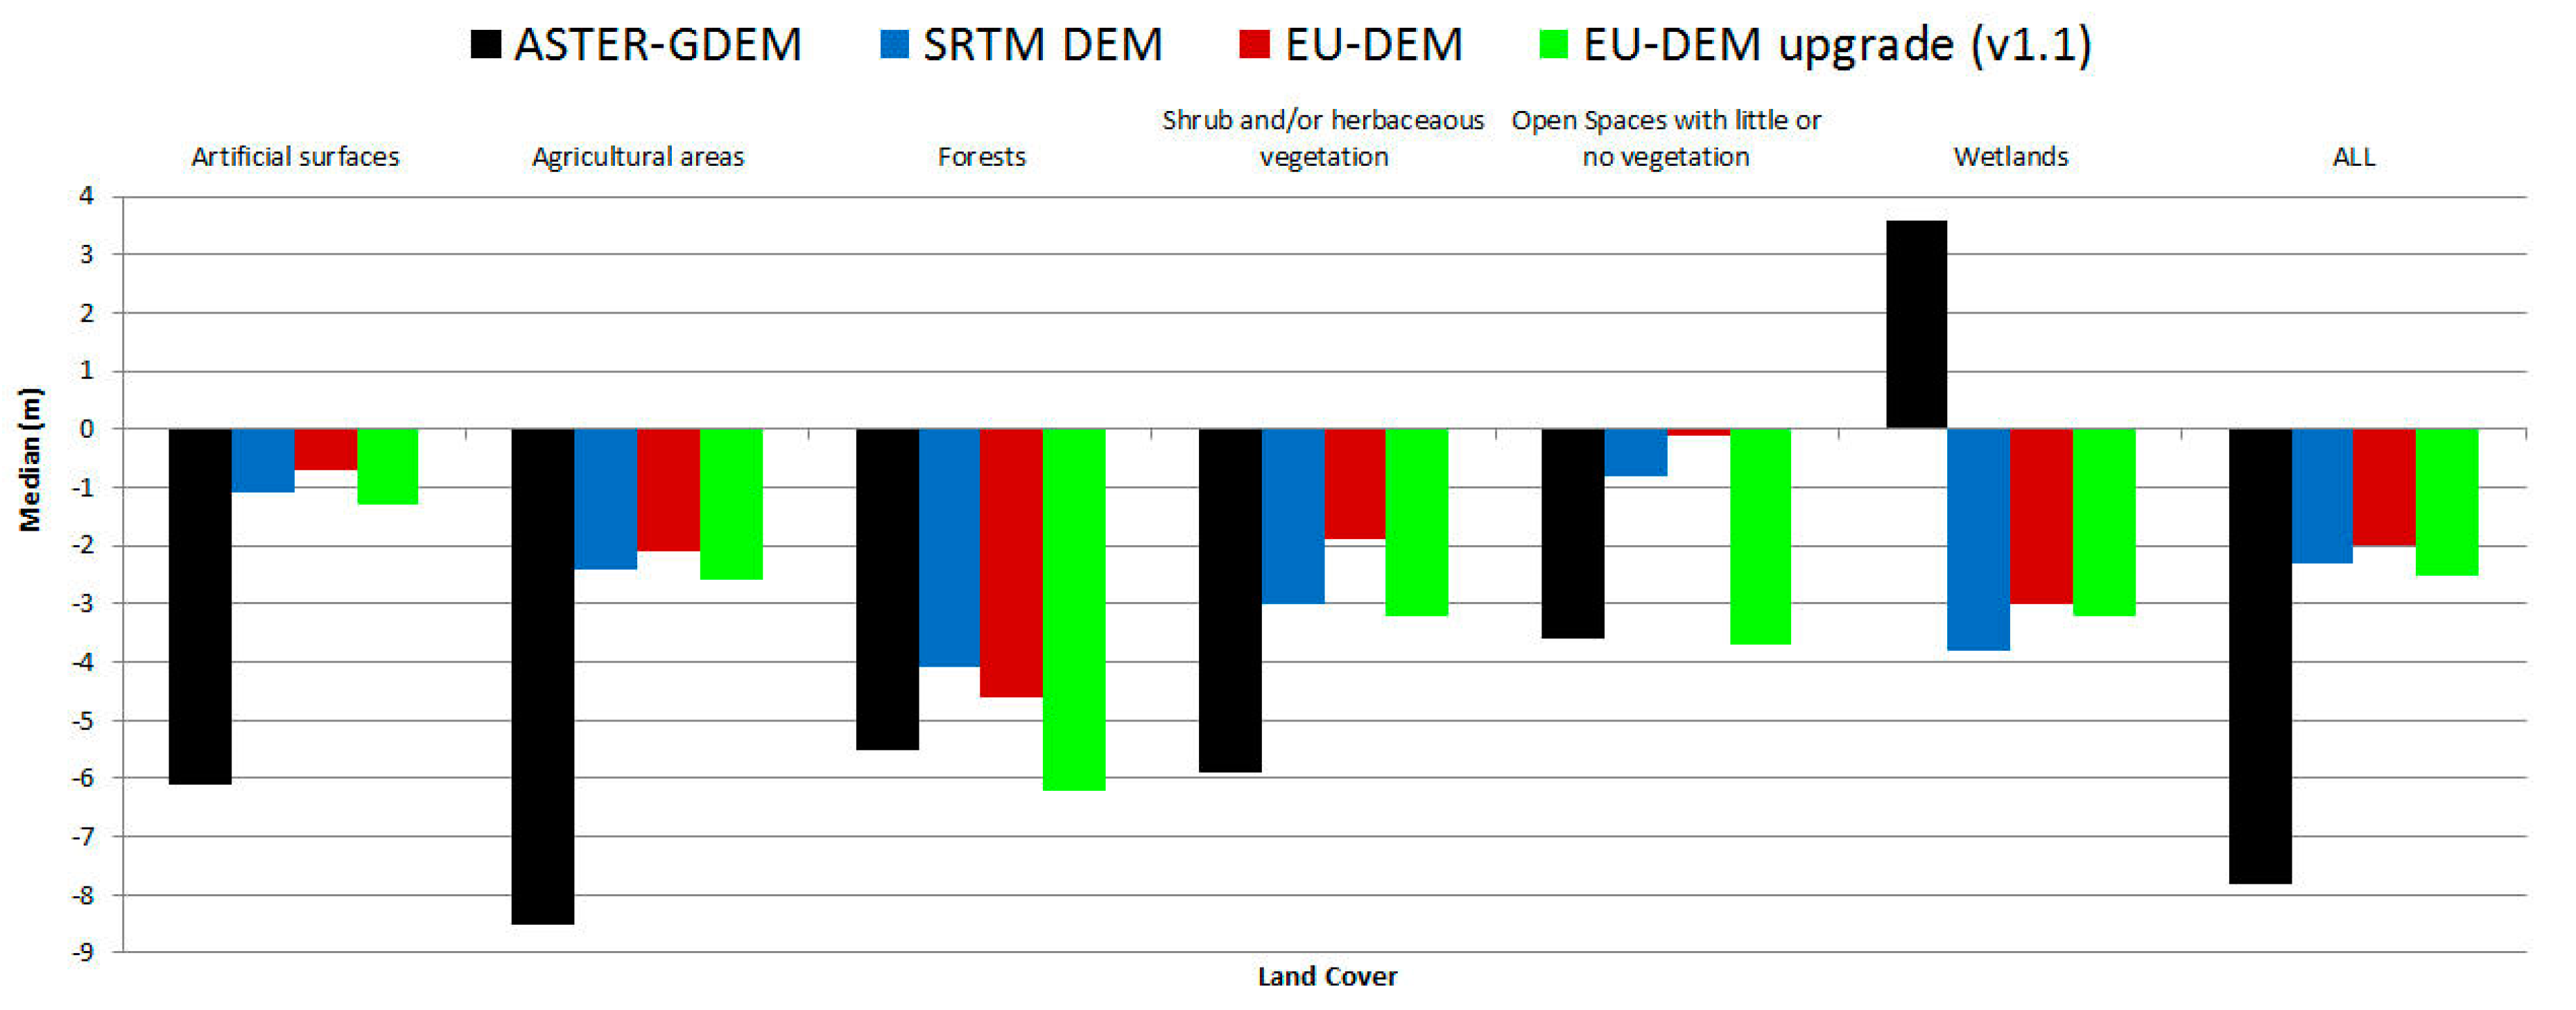
4.5. Land Cover
5. Discussion
6. Conclusions
Author Contributions
Funding
Acknowledgments
Conflicts of Interest
References
- Farr, T.G.; Kobrick, M. Shuttle radar topography mission produces a wealth of data. Eos 2000, 81, 583–585. [Google Scholar] [CrossRef]
- Meyer, D.; Tachikawa, T.; Kaku, M.; Iwasaki, A.; Gesch, D.; Oimoen, M.; Zhang, Z.; Danielson, J.; Krieger, T.; Curtis, B.; et al. Summary for Policymakers. In Climate Change 2013—The Physical Science Basis; Intergovernmental Panel on Climate Change, Ed.; Cambridge University Press: Cambridge, UK, 2011; pp. 1–30. ISBN 9788578110796. [Google Scholar]
- ASTER Global DEM Validation Summary Report. Available online: https://lpdaac.usgs.gov/sites/default/files/public/aster/docs/ASTER_GDEM_Validation_Summary_Report.pdf (accessed on 4 January 2014).
- Tachikawa, T.; Hato, M.; Kaku, M.; Iwasaki, A. Characteristics of ASTER GDEM version 2. In Proceedings of the International Geoscience and Remote Sensing Symposium (IGARSS), Vancouver, BC, Canada, 24–29 July 2011; pp. 3657–3660. [Google Scholar]
- Massonnet, D.; Elachi, C. High-resolution land topography. C. R. Geosci. 2006, 338, 1029–1041. [Google Scholar] [CrossRef]
- ALOS Global Digital Surface Model “ALOS World 3D—30m (AW3D30)”. Available online: https://www.eorc.jaxa.jp/ALOS/en/aw3d30/index.htm (accessed on 24 January 2019).
- Airbus—Elevation Models. Available online: http://www.astrium-geo.com/worlddem (accessed on 30 December 2018).
- Lidar Surface Topography (LIST). Available online: https://eospso.nasa.gov/missions/lidar-surface-topography (accessed on 24 January 2019).
- EU-DEM. Available online: http://www.eea.europa.eu/data-and-maps/data/eu-dem (accessed on 3 January 2015).
- EU-DEM Statistical Validation Report. Available online: http://land.copernicus.eu/user-corner/technical-library (accessed on 5 May 2015).
- EU-DEM v1.1. Available online: https://land.copernicus.eu/imagery-in-situ/eu-dem/eu-dem-v1.1?tab=metadata (accessed on 30 December 2018).
- Denker, H. Evaluation of SRTM3 and GTOPO30 Terrain Data in Germany. Gravity Geoid Space Mission. 2005, 129, 218–223. [Google Scholar] [CrossRef]
- Hirt, C.; Filmer, M.S.; Featherstone, W.E. Comparison and validation of the recent freely available ASTER-GDEM ver1, SRTM ver4.1 and GEODATA DEM-9s ver3 digital elevation models over Australia. Aust. J. Earth Sci. 2010, 57, 337–347. [Google Scholar] [CrossRef]
- Paul, D.; Mandla, V.R.; Singh, T. Quantifying and modeling of stream network using digital elevation models. Ain Shams Eng. J. 2017, 8, 311–321. [Google Scholar] [CrossRef] [Green Version]
- Rodríguez, E.; Morris, C.S.; Belz, J.E. A Global Assessment of the SRTM Performance. Photogramm. Eng. Remote Sens. 2006, 72, 249–260. [Google Scholar] [CrossRef]
- Tachikawa, T.; Kaku, M.; Iwasaki, A. ASTER GDEM Version 2 Validation Report. In Proceedings of the International Geoscience and Remote Sensing Symposium, Vancouver, BC, Canada, 24–29 July 2011; pp. 1–24. [Google Scholar]
- Foumelis, M.; Chalkias, C.; Plank, S. Influence of Satellite Imaging Geometry on ASTER and SRTM Global Digital Elevation Models. In Proceedings of the 10th International Congress of the Hellenic Geographical Society, Thessaloniki, Greece, 22–24 October 2014; Mouratidis, A., Ed.; Hellenic Geographical Society: Thessaloniki, Greece, 2014; pp. 275–286. [Google Scholar]
- Miliaresis, G.C.; Paraschou, C.V.E. An evaluation of the accuracy of the ASTER GDEM and the role of stack number: A case study of Nisiros Island, Greece. Remote Sens. Lett. 2011, 2, 127–135. [Google Scholar] [CrossRef]
- Miliaresis, G.C.; Paraschou, C.V.E. Vertical accuracy of the SRTM DTED level 1 of Crete. Int. J. Appl. Earth Obs. Geoinf. 2005, 7, 49–59. [Google Scholar] [CrossRef]
- Weydahl, D.J.; Sagstuen, J.; Dick, B.; Rønning, H. SRTM DEM accuracy assessment over vegetated areas in Norway. Int. J. Remote Sens. 2007, 28, 3513–3527. [Google Scholar] [CrossRef]
- Helm, A.; Braun, A.; Eickschen, S.; Schöne, T. Calibration of the shuttle radar topography mission X-SAR instrument using a synthetic altimetry data model. Can. J. Remote Sens. 2002, 28, 573–580. [Google Scholar] [CrossRef]
- Sun, G.; Ranson, K.J.; Kharuk, V.I.; Kovacs, K. Validation of surface height from shuttle radar topography mission using shuttle laser altimeter. Remote Sens. Environ. 2003, 88, 401–411. [Google Scholar] [CrossRef]
- Gorokhovich, Y.; Voustianiouk, A. Accuracy assessment of the processed SRTM-based elevation data by CGIAR using field data from USA and Thailand and its relation to the terrain characteristics. Remote Sens. Environ. 2006, 104, 409–415. [Google Scholar] [CrossRef]
- Bulatović, V.; Sušić, Z.; Ninkov, T. Estimate of the ASTER GDEM regional systematic errors and their removal. Int. J. Remote Sens. 2012, 33, 5915–5926. [Google Scholar] [CrossRef]
- Li, P.; Shi, C.; Li, Z.; Muller, J.P.; Drummond, J.; Li, X.; Li, T.; Li, Y.; Liu, J. Evaluation of ASTER GDEM using GPS benchmarks and SRTM in China. Int. J. Remote Sens. 2013, 34, 1744–1771. [Google Scholar] [CrossRef]
- Mouratidis, A.; Briole, P.; Katsambalos, K. SRTM 3″ DEM (versions 1, 2, 3, 4) validation by means of extensive kinematic GPS measurements: A case study from North Greece. Int. J. Remote Sens. 2010, 31, 6205–6222. [Google Scholar] [CrossRef]
- Rodriguez, E.; Morris, C.S.; Belz, J.E.; Chapin, E.C.; Martin, J.M.; Daffer, W.; Hensley, S. An Assessment of the SRTM Topographic Products; Technical Report JPL D-31639; JPL, NASA: Pasadena, CA, USA, 2005.
- Werner, M. Shuttle Radar Topography Mission (SRTM) mission overview. Frequenz 2001, 55, 75–79. [Google Scholar] [CrossRef]
- Rabus, B.; Eineder, M.; Roth, A.; Bamler, R. The shuttle radar topography mission—A new class of digital elevation models acquired by spaceborne radar. ISPRS J. Photogramm. Remote Sens. 2003, 57, 241–262. [Google Scholar] [CrossRef]
- Farr, T.G.; Rosen, P.A.; Caro, E.; Crippen, R.; Duren, R.; Hensley, S.; Kobrick, M.; Paller, M.; Rodriguez, E.; Roth, L.; et al. The shuttle radar topography mission. Rev. Geophys. 2007, 45, RG2004. [Google Scholar] [CrossRef]
- Mukul, M.; Srivastava, V.; Jade, S.; Mukul, M. Uncertainties in the Shuttle Radar Topography Mission (SRTM) Heights: Insights from the Indian Himalaya and Peninsula. Sci. Rep. 2017, 7, 41672. [Google Scholar] [CrossRef] [PubMed] [Green Version]
- ASTER Global Digital Elevation Model Version 2—Summary of Validation Results. Available online: https://ssl.jspacesystems.or.jp/ersdac/GDEM/ver2Validation/Summary_GDEM2_validation_report_final.pdf (accessed on 2 February 2019).
- Varga, M.; Bašić, T. Accuracy validation and comparison of global digital elevation models over Croatia. Int. J. Remote Sens. 2015, 36, 170–189. [Google Scholar] [CrossRef]
- Mouratidis, A. Contribution of—GPS and GIS—Assisted Spaceborne Remote Sensing in the Morphotectonic Research of Central Macedonia (Northern Greece); Aristotle University of Thessaloniki: Thessaloniki, Greece, 2010. [Google Scholar]
- Copernicus Land Monitoring Service—Reference Data: EU-DEM. Available online: https://land.copernicus.eu/user-corner/publications/eu-dem-flyer/view (accessed on 2 January 2019).
- EU-DEM Upgrade Documentation EEA User Manual. Available online: https://land.copernicus.eu/user-corner/technical-library/eu-dem-v1-1-user-guide (accessed on 2 January 2019).
- Józsa, E.; Fábián, S.Á.; Kovács, M. An evaluation of EU-DEM in comparison with ASTER GDEM, SRTM and contour-based DEMs over the Eastern Mecsek Mountains. Hung. Geogr. Bull. 2014, 63, 401–423. [Google Scholar] [CrossRef]
- Jarvis, A.; Reuter, H.I.; Nelson, A.; Guevara, E. Hole-Filled SRTM for the Globe Version 4, available from the CGIAR-CSI SRTM 90m Database. Available online: http://srtm.csi.cgiar.org (accessed on 4 January 2019).
- Lemoine, F.G.; Kenyon, S.C.; Factor, J.K.; Trimmer, R.G.; Pavlis, N.K.; Chinn, D.S.; Cox, C.M.; Klosko, S.M.; Luthcke, S.B.; Torrence, M.H.; et al. The NASA GSFC and NIMA Joint Geopotential Model. Available online: https://ntrs.nasa.gov/archive/nasa/casi.ntrs.nasa.gov/19980218814.pdf (accessed on 4 January 2019).
- Mouratidis, A.; Albanakis, K. Hypsometric changes near Kavallari based on multi-temporal DEMs and extensive GNSS measurements. In Proceedings of the 9th Geographical Conference of Greece, Athens, Greece, 4–6 November 2010; pp. 116–123. [Google Scholar]
- Altamimi, Z.; Collilieux, X.; Legrand, J.; Garayt, B.; Boucher, C. ITRF2005: A new release of the International Terrestrial Reference Frame based on time series of station positions and Earth Orientation Parameters. J. Geophys. Res. Solid Earth 2007, 112. [Google Scholar] [CrossRef] [Green Version]
- CORINE Land Cover/CLC 2012. Available online: https://land.copernicus.eu/pan-european/corine-land-cover/clc-2012?tab=download (accessed on 4 January 2019).
- ITRS and WGS84. Available online: ftp://itrf.ensg.ign.fr/pub/itrf/WGS84.TXT (accessed on 4 January 2019).
- Boucher, C.; Altamimi, Z. Specifications for Reference Frame Fixing in the Analysis of a EU-REF GPS Campaign. Available online: http://etrs89.ensg.ign.fr/memo-V7.pdf (accessed on 4 January 2019).
- Augath, W.; Ihde, J. EUREF Permanent GNSS Network—ETRF/ITRF Transformation. Available online: http://www.epncb.oma.be/_productsservices/coord_trans/index.php (accessed on 4 January 2019).
- Gruber, T. Evaluation of the EGM08 Gravity Field by Means of GPS-Levelling and Sea Surface Topography Solutions. Available online: https://mediatum.ub.tum.de/doc/1368753/file.pdf (accessed on 28 February 2019).
- Kotsakis, C.; Katsambalos, K. Quality Analysis of Global Geopotential Models at 1542 GPS/levelling Benchmarks over the Hellenic Mainland. Surv. Rev. 2010, 42, 327–344. [Google Scholar] [CrossRef]
- Rizos, C.; Grejner-Brzezinska, D. Geodesy and Surveying. In GNSS Applications and Methods; Gleason, S., Gebre-Egziabher, D., Eds.; Artech House: Boston, MA, USA, 2009; pp. 347–380. ISBN 9781596933293. [Google Scholar]
- Weikko, A.H.; Moritz, H. Physical Geodesy; W. H. Freeman and Company: San Francisco, CA, USA, 1967. [Google Scholar]
- EGM2008—WGS 84 Version. Available online: Earth-info.nga.mil/GandG/wgs84/gravitymod/egm2008/egm08_wgs84.html (accessed on 4 January 2019).
- Kotsakis, C.; Katsambalos, K.; Ampatzidis, D.; Gianniou, M. Evaluation of EGM08 Using GPS and Leveling Heights in Greece. In International Association of Geodesy Symposia; Springer: Cham, Switzerland, 2010; Volume 135, pp. 481–488. [Google Scholar]
- Pavlis, N.K.; Holmes, S.A.; Kenyon, S.C.; Factor, J.K. The development and evaluation of the Earth Gravitational Model 2008 (EGM2008). J. Geophys. Res. 2012, 117, B04406. [Google Scholar] [CrossRef]
- Vergos, G.S.; Grigoriadis, V.N.; Tziavos, I.N.; Kotsakis, C. Evaluation of GOCE/GRACE Global Geopotential Models over Greece with Collocated GPS/Levelling Observations and Local Gravity Data. In Gravity, Geoid and Height Systems; Marti, U., Ed.; Springer: Cham, Switzerland, 2014; pp. 85–92. [Google Scholar]
- Höhle, J.; Höhle, M. Accuracy assessment of digital elevation models by means of robust statistical methods. ISPRS J. Photogramm. Remote Sens. 2009, 64, 398–406. [Google Scholar] [CrossRef] [Green Version]
- Frey, H.; Paul, F. On the suitability of the SRTM DEM and ASTER GDEM for the compilation of: Topographic parameters in glacier inventories. Int. J. Appl. Earth Obs. Geoinf. 2012, 18, 480–490. [Google Scholar] [CrossRef]
- Miliaresis, G.C. The landcover impact on the aspect/slope accuracy dependence of the SRTM-1 elevation data for the humboldt range. Sensors 2008, 8, 3134–3149. [Google Scholar] [CrossRef] [PubMed]
- Becek, K. Investigating error structure of shuttle radar topography mission elevation data product. Geophys. Res. Lett. 2008, 35. [Google Scholar] [CrossRef] [Green Version]
- Becek, K. Assessing global digital elevation models using the runway method: The advanced spaceborne thermal emission and reflection radiometer versus the shuttle radar topography mission case. IEEE Trans. Geosci. Remote Sens. 2014, 52, 4823–4831. [Google Scholar] [CrossRef]


| Statistical Measure | ASTER GDEM | SRTM DEM | EU-DEM | EU-DEM Upgrade (v1.1) |
|---|---|---|---|---|
| Mean (m) | −6.8 | −2.2 | −1.8 | −2.6 |
| Standard Deviation (m) | 7.6 | 4.3 | 3.6 | 3.4 |
| RMSE (m) | 10.2 | 4.8 | 4.0 | 4.3 |
| RMSE 95% (m) | 9.1 | 3.6 | 3.0 | 3.4 |
| RMSE 90% (m) | 8.5 | 3.2 | 2.7 | 3.0 |
| Median (m) | −7.8 | −2.3 | −2.0 | −2.5 |
| Normalized Median Absolute Deviation (NMAD) (m) | 6.8 | 3.0 | 2.6 | 2.7 |
| (Excess) Kurtosis | 0.8 | 17.4 | 21.7 | 7.7 |
| Skewness | 0.3 | 0.4 | 1.3 | −1.2 |
| Maximum (m) | 51.6 | 58.6 | 59.3 | 10.0 |
| Minimum (m) | −36.6 | −59.4 | −27.1 | −33.6 |
| Range (m) | 88.2 | 118 | 86.4 | 43.6 |
| n (number of pixels evaluated) | 12,943 | 12,943 | 12,943 | 12,943 |
| Statistical Measure | ASTER GDEM | SRTM DEM | EU-DEM | EU-DEM Upgrade (v1.1) |
|---|---|---|---|---|
| Mean (m) | 0.4 | 0.3 | 0.2 | 0.9 |
| Standard Deviation (m) | 11.0 | 6.1 | 5.3 | 5.5 |
| RMSE (m) | 11.0 | 6.1 | 5.3 | 5.6 |
| RMSE 95% (m) | 9.5 | 4.6 | 3.9 | 4.1 |
| RMSE 90% (m) | 8.6 | 4.0 | 3.4 | 3.6 |
| Median (m) | 0.4 | 0.2 | 0.1 | 0.7 |
| Normalized Median Absolute Deviation (NMAD) (m) | 10.4 | 4.7 | 4.1 | 4.2 |
| (Excess) Kurtosis | 0.3 | 3.6 | 4.7 | 5.2 |
| Skewness | 0.0 | 0.2 | 0.0 | 0.5 |
| Maximum (m) | 57.8 | 51.1 | 48.1 | 57.0 |
| Minimum (m) | −54.6 | −50.0 | −51.4 | −38.7 |
| Range (m) | 112.4 | 101.1 | 99.5 | 95.7 |
| n (number of pixel differences evaluated) | 499,500 | 499,500 | 499,500 | 499,500 |
| Land Cover Type | Median | |||
|---|---|---|---|---|
| ASTER-GDEM | SRTM DEM | EU-DEM | EU-DEM Upgrade (v1.1) | |
| Artificial surfaces | −6.1 | −1.1 | −0.7 | −1.3 |
| Agricultural areas | −8.5 | −2.4 | −2.1 | −2.6 |
| Forests | −5.5 | −4.1 | −4.6 | −6.2 |
| Shrub and/or herbaceous vegetation | −5.9 | −3.0 | −1.9 | −3.2 |
| Open Spaces with little or no vegetation | −3.6 | −0.8 | −0.1 | −3.7 |
| Wetlands | 3.6 | −3.8 | −3.0 | −3.2 |
| ALL | −7.8 | −2.3 | −2.0 | −2.5 |
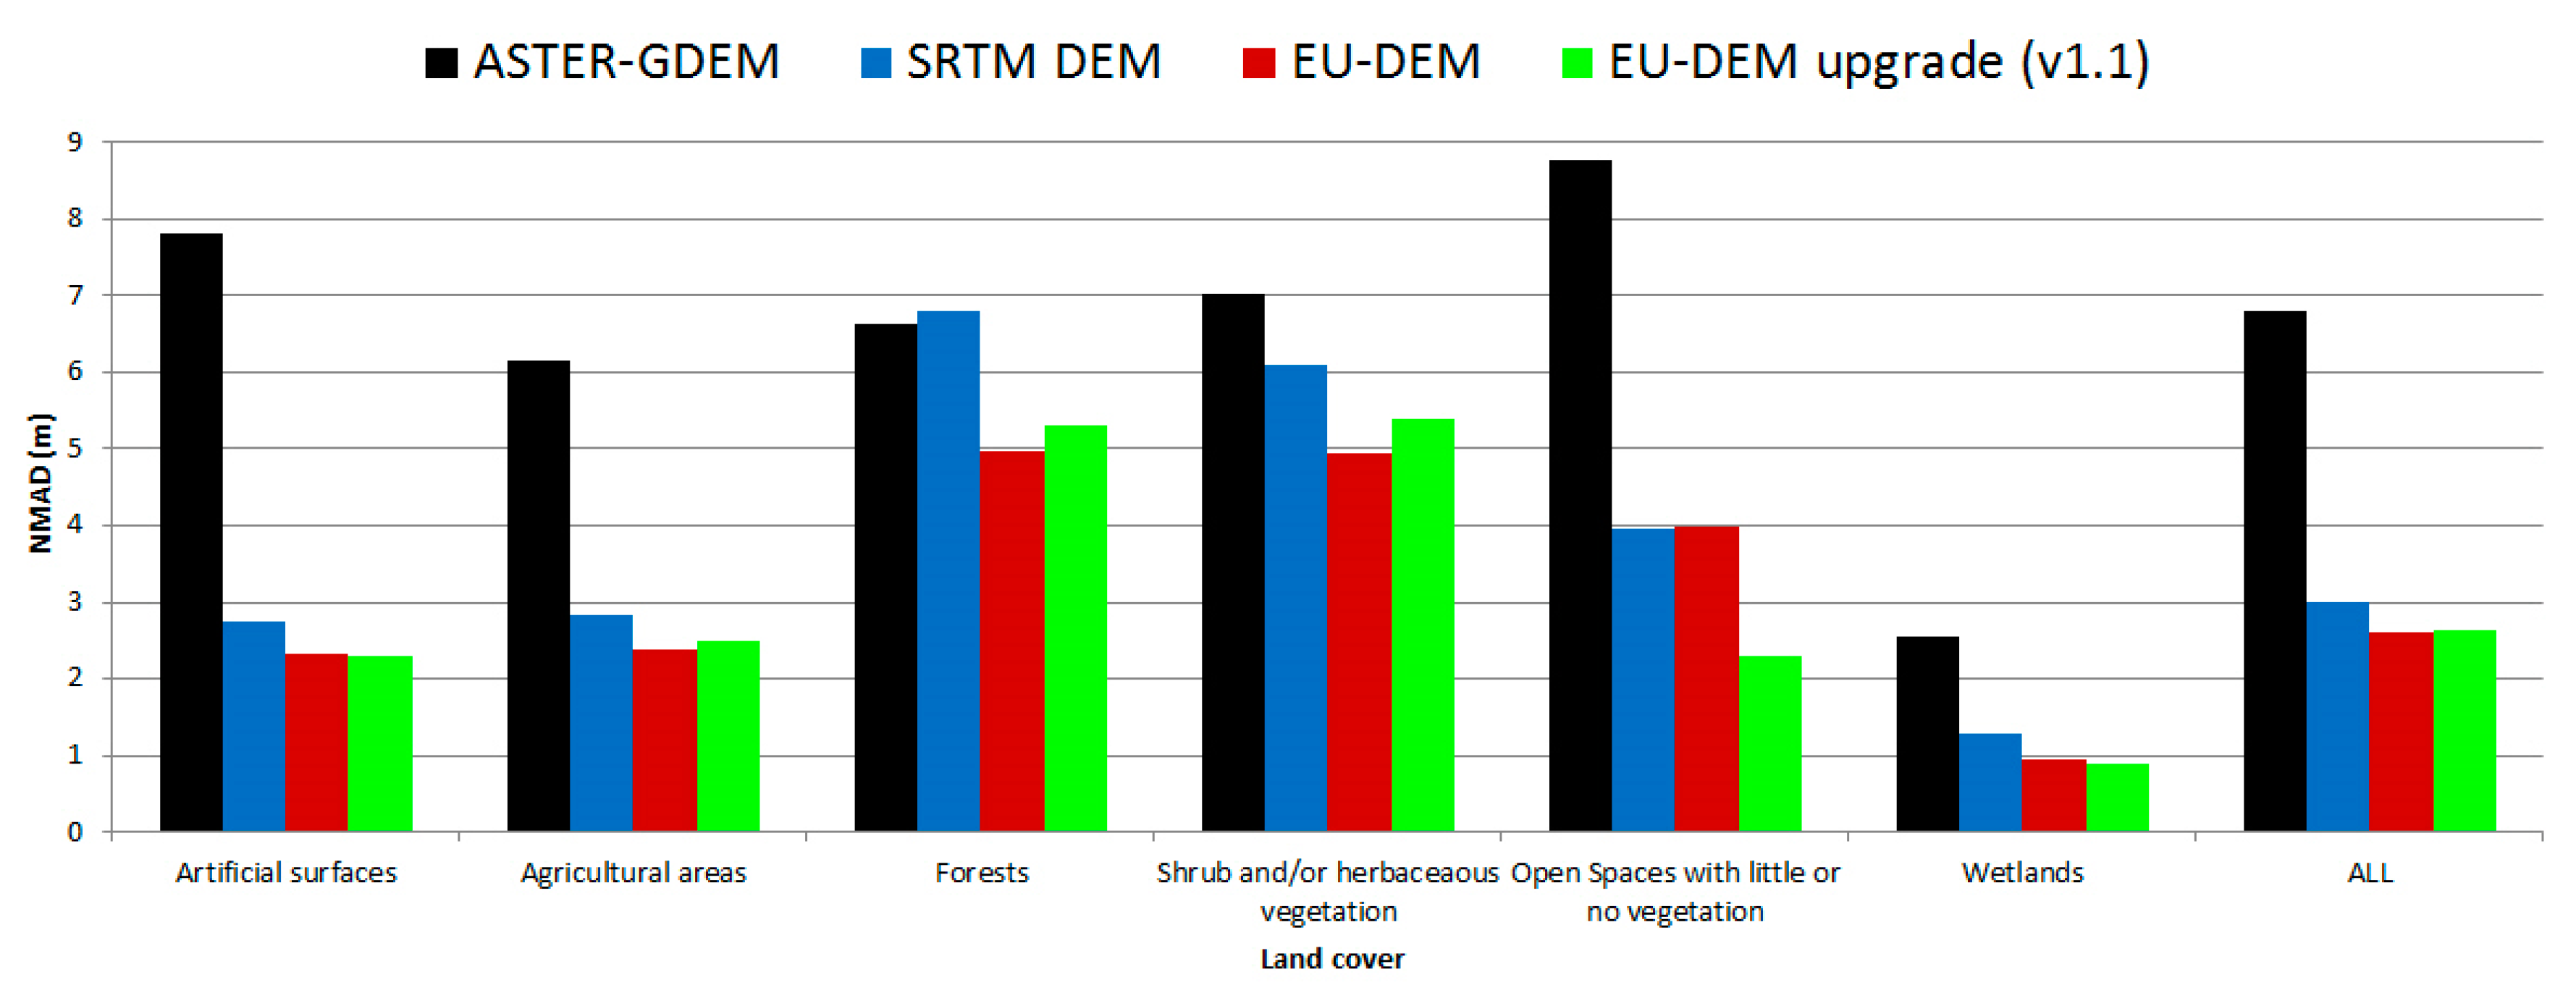
| Land Cover Type | NMAD | |||
|---|---|---|---|---|
| ASTER-GDEM | SRTM DEM | EU-DEM | EU-DEM Upgrade (v1.1) | |
| Artificial surfaces | 7.8 | 2.7 | 2.3 | 2.3 |
| Agricultural areas | 6.1 | 2.8 | 2.4 | 2.5 |
| Forests | 6.6 | 6.8 | 5.0 | 5.3 |
| Shrub and/or herbaceous vegetation | 7.0 | 6.1 | 5.0 | 5.4 |
| Open Spaces with little or no vegetation | 8.8 | 4.0 | 4.0 | 2.3 |
| Wetlands | 2.6 | 1.3 | 1.0 | 0.9 |
| ALL | 6.8 | 3.0 | 2.6 | 2.6 |
© 2019 by the authors. Licensee MDPI, Basel, Switzerland. This article is an open access article distributed under the terms and conditions of the Creative Commons Attribution (CC BY) license (http://creativecommons.org/licenses/by/4.0/).
Share and Cite
Mouratidis, A.; Ampatzidis, D. European Digital Elevation Model Validation against Extensive Global Navigation Satellite Systems Data and Comparison with SRTM DEM and ASTER GDEM in Central Macedonia (Greece). ISPRS Int. J. Geo-Inf. 2019, 8, 108. https://doi.org/10.3390/ijgi8030108
Mouratidis A, Ampatzidis D. European Digital Elevation Model Validation against Extensive Global Navigation Satellite Systems Data and Comparison with SRTM DEM and ASTER GDEM in Central Macedonia (Greece). ISPRS International Journal of Geo-Information. 2019; 8(3):108. https://doi.org/10.3390/ijgi8030108
Chicago/Turabian StyleMouratidis, Antonios, and Dimitrios Ampatzidis. 2019. "European Digital Elevation Model Validation against Extensive Global Navigation Satellite Systems Data and Comparison with SRTM DEM and ASTER GDEM in Central Macedonia (Greece)" ISPRS International Journal of Geo-Information 8, no. 3: 108. https://doi.org/10.3390/ijgi8030108