An Analytics Platform for Integrating and Computing Spatio-Temporal Metrics


Geospatial Technologies Research Group (GEOTEC), Universitat Jaume I, Av. Vicente Sos Baynat s/n, 12071 Castellón de la Plana, Spain
*
Author to whom correspondence should be addressed.
ISPRS Int. J. Geo-Inf. 2019, 8(2), 54; https://doi.org/10.3390/ijgi8020054
Submission received: 30 November 2018
/
Revised: 11 January 2019
/
Accepted: 22 January 2019
/
Published: 26 January 2019
Abstract
:In large-scale context-aware applications, a central design concern is capturing, managing and acting upon location and context data. The ability to understand the collected data and define meaningful contextual events, based on one or more incoming (contextual) data streams, both for a single and multiple users, is hereby critical for applications to exhibit location- and context-aware behaviour. In this article, we describe a context-aware, data-intensive metrics platform —focusing primarily on its geospatial support—that allows exactly this: to define and execute metrics, which capture meaningful spatio-temporal and contextual events relevant for the application realm. The platform (1) supports metrics definition and execution; (2) provides facilities for real-time, in-application actions upon metrics execution results; (3) allows post-hoc analysis and visualisation of collected data and results. It hereby offers contextual and geospatial data management and analytics as a service, and allow context-aware application developers to focus on their core application logic. We explain the core platform and its ecosystem of supporting applications and tools, elaborate the most important conceptual features, and discuss implementation realised through a distributed, micro-service based cloud architecture. Finally, we highlight possible application fields, and present a real-world case study in the realm of psychological health.
1. Introduction
Notwithstanding the early promise of location- and context-aware applications (see e.g., [1] for a survey of early systems), only in the last decade have we witnessed the required technological and infrastructural enablers to truly unleash their potential [2,3]. For the technological enablers, the increasing availability of a variety of context-capturing machinery, in which embedded sensors, local processing and communication capabilities are combined, allows for large-scale, high-volume capturing and streaming of a broad variety of context data. Examples notably include sensor-packed smart vehicles, mobile hand-held devices (e.g., smart phones, tables) and smart, wearable devices (e.g., smart watches and bracelets, sport trackers, smart clothing), which can effectively collect an individual’s real-time location, along with other relevant contextual information (e.g., [4]). A second technological milestone is the rapid evolution and proliferation of powerful mobile hand-held computing devices, a condition sine qua non to run full-fledged, context-aware applications [5].
On the other hand, infrastructure-related enablers are now in place: fully rolled-out communication networks (e.g., 3G and 4G) with resulting ubiquitous internet access, and commercially available, economised cloud-based storage and computing infrastructures [6], provide unprecedented means to build the next-generation of context-aware applications and services, based on multi-user, real-time and high-frequency input streams; real-time data handling, processing and analytics; and real-time, location- and context-based reactiveness [7]. Indeed, we see a breakthrough of such applications in various application fields, such as mobility and transportation (e.g., [8]), health (e.g., [9,10]), tourism (e.g., [11], smart cities (e.g., [12,13]), smart homes (e.g., [14]), gaming (e.g., Pokemon Go [15]), to name but a few.
Nevertheless, due to their relatively new and evolving supportive technologies, building such applications remains a tedious job. The client-side application needs to deal with and be built around an additional, dynamically changing concern, namely context in general and location specifically, while server-side handling of context data, especially in large-scale multi-user deployments, needs to deal with streaming data, big data issues, real-time analysis and reactiveness. From the point of view of geographic information science, an impressive arsenal of techniques, methods and tools for capturing, storing, managing, and processing spatial information was developed over the past decades [16,17,18]. Vector-based and raster-based spatial operators are usually arranged together as automated geospatial workflows. Research works (e.g., [19,20,21,22,23]) have made substantial progress over the past years to go well beyond desktop-based environments to bring geospatial workflows to the cloud and distributed computing environments, contributing to the field of Geoprocessing Web [24,25]. To this regard, leading voices recently called for an entirely new brand of geospatial platforms and systems to analyse and process real-time data streams [26,27,28,29]. In other words, what served in the past and still serves for scenarios in non-real time, does not fit well with scenarios that handle data streams. State-of-the-art research in analytics platforms for stream computing, which facilitate measuring and quantifying location- and context-related aspects based on real-time streamed data and take it into account in the application, are still in their infancy, especially in the support for the spatial and spatio-temporal dimensions of data streams [30].
In this article, we present an analytics platform for defining and computing spatio-temporal, context-aware metrics. The proposed concept of metrics is central to allow application developers to define data requirements that capture relevant spatio-temporal aspects of an observed phenomenon, collect the required (client-generated) data, and execute the associated function to process streams of collected data. Based on the processed data, the analytics platform provides asynchronous notifications, for real-time reaction in end-user applications, as well as post-hoc programmatic access and data visualisation features. Hereby, the analytics platform acts as a service, allowing application developers to outsource the burden of handling, analysing and interpreting context-related data. It suffices to communicate relevant raw data to the platform to receive context-related event notifications, based on the defined metrics. The platform is based on a cloud-based, distributed architecture, and is specifically designed to handle large amounts of (streaming) data, perform analysis over the collected data, and realise real-time notifications in a decentralised way. Although the platform is able of handling any type of user-collected data, the focus in this article is on the geospatial aspect. As such, the main strong points of the analytics platform are: (1) defined at a sufficient level of abstraction to be able to support multiple application domains, i.e., not application-specific; (2) capable of handling spatial and non-spatial metrics; (3) design for intrinsic support for real-time streaming data collection (done) and processing (future work); (4) use of an extended metrics model, including specification of necessary data and its structure, a function to define a relevant context condition, and associated action(s); (5) open metrics specifications allowing re-use and replication over different applications and application domains, and ultimately, comparison of metrics.
In what follows, we first overview the platform as an ecosystem of applications and supporting tools (Section 2), highlight notable features such as the multi-dimensional data definition, and the support for automatic location-based data collection (Section 3). Next, we discuss the platform implementation emphasising the use of state-of-the-art big data processing and analytics technologies (Section 4). Finally, we critically discuss, present possible use cases and application fields, and a running case in the field of psychological health.
2. Architectural View of the Analytics Platform
The analytics platform for computing spatio-temporal metrics presented here grew out of our previous work in location-aware games, a specific class of location-based applications [31]. Rodríguez-Pupo et al. [32] analysed existing game analytic platforms to assess their level of support of spatio-temporal features for analytic processes. Results suggested that little support is currently available, and existing solutions lack generality and re-usability. Although a plethora of location- and context-aware systems can be found in the literature, existing solutions focus only on limited facets of a context-aware system [33]. For example, some frameworks offer programming-level support for context-aware applications (e.g., [34,35]). Other solutions are mostly designed for one particular application field such as ambient assisted living [36], multimedia services [37] and mobile social networks [38]. Therefore, the common denominator is a lack of solutions to support both spatial and non-spatial analytic computing for location- and context-aware applications. In response to this lack, we describe an analytics platform to enable the definition and execution of spatio-temporal metrics as part of location-aware applications. In this section, we overview the conceptual architecture of the proposed analytics platform at a high level of abstraction, while we delve further into the implementation details and the technology stack on which the platform is built in Section 4.
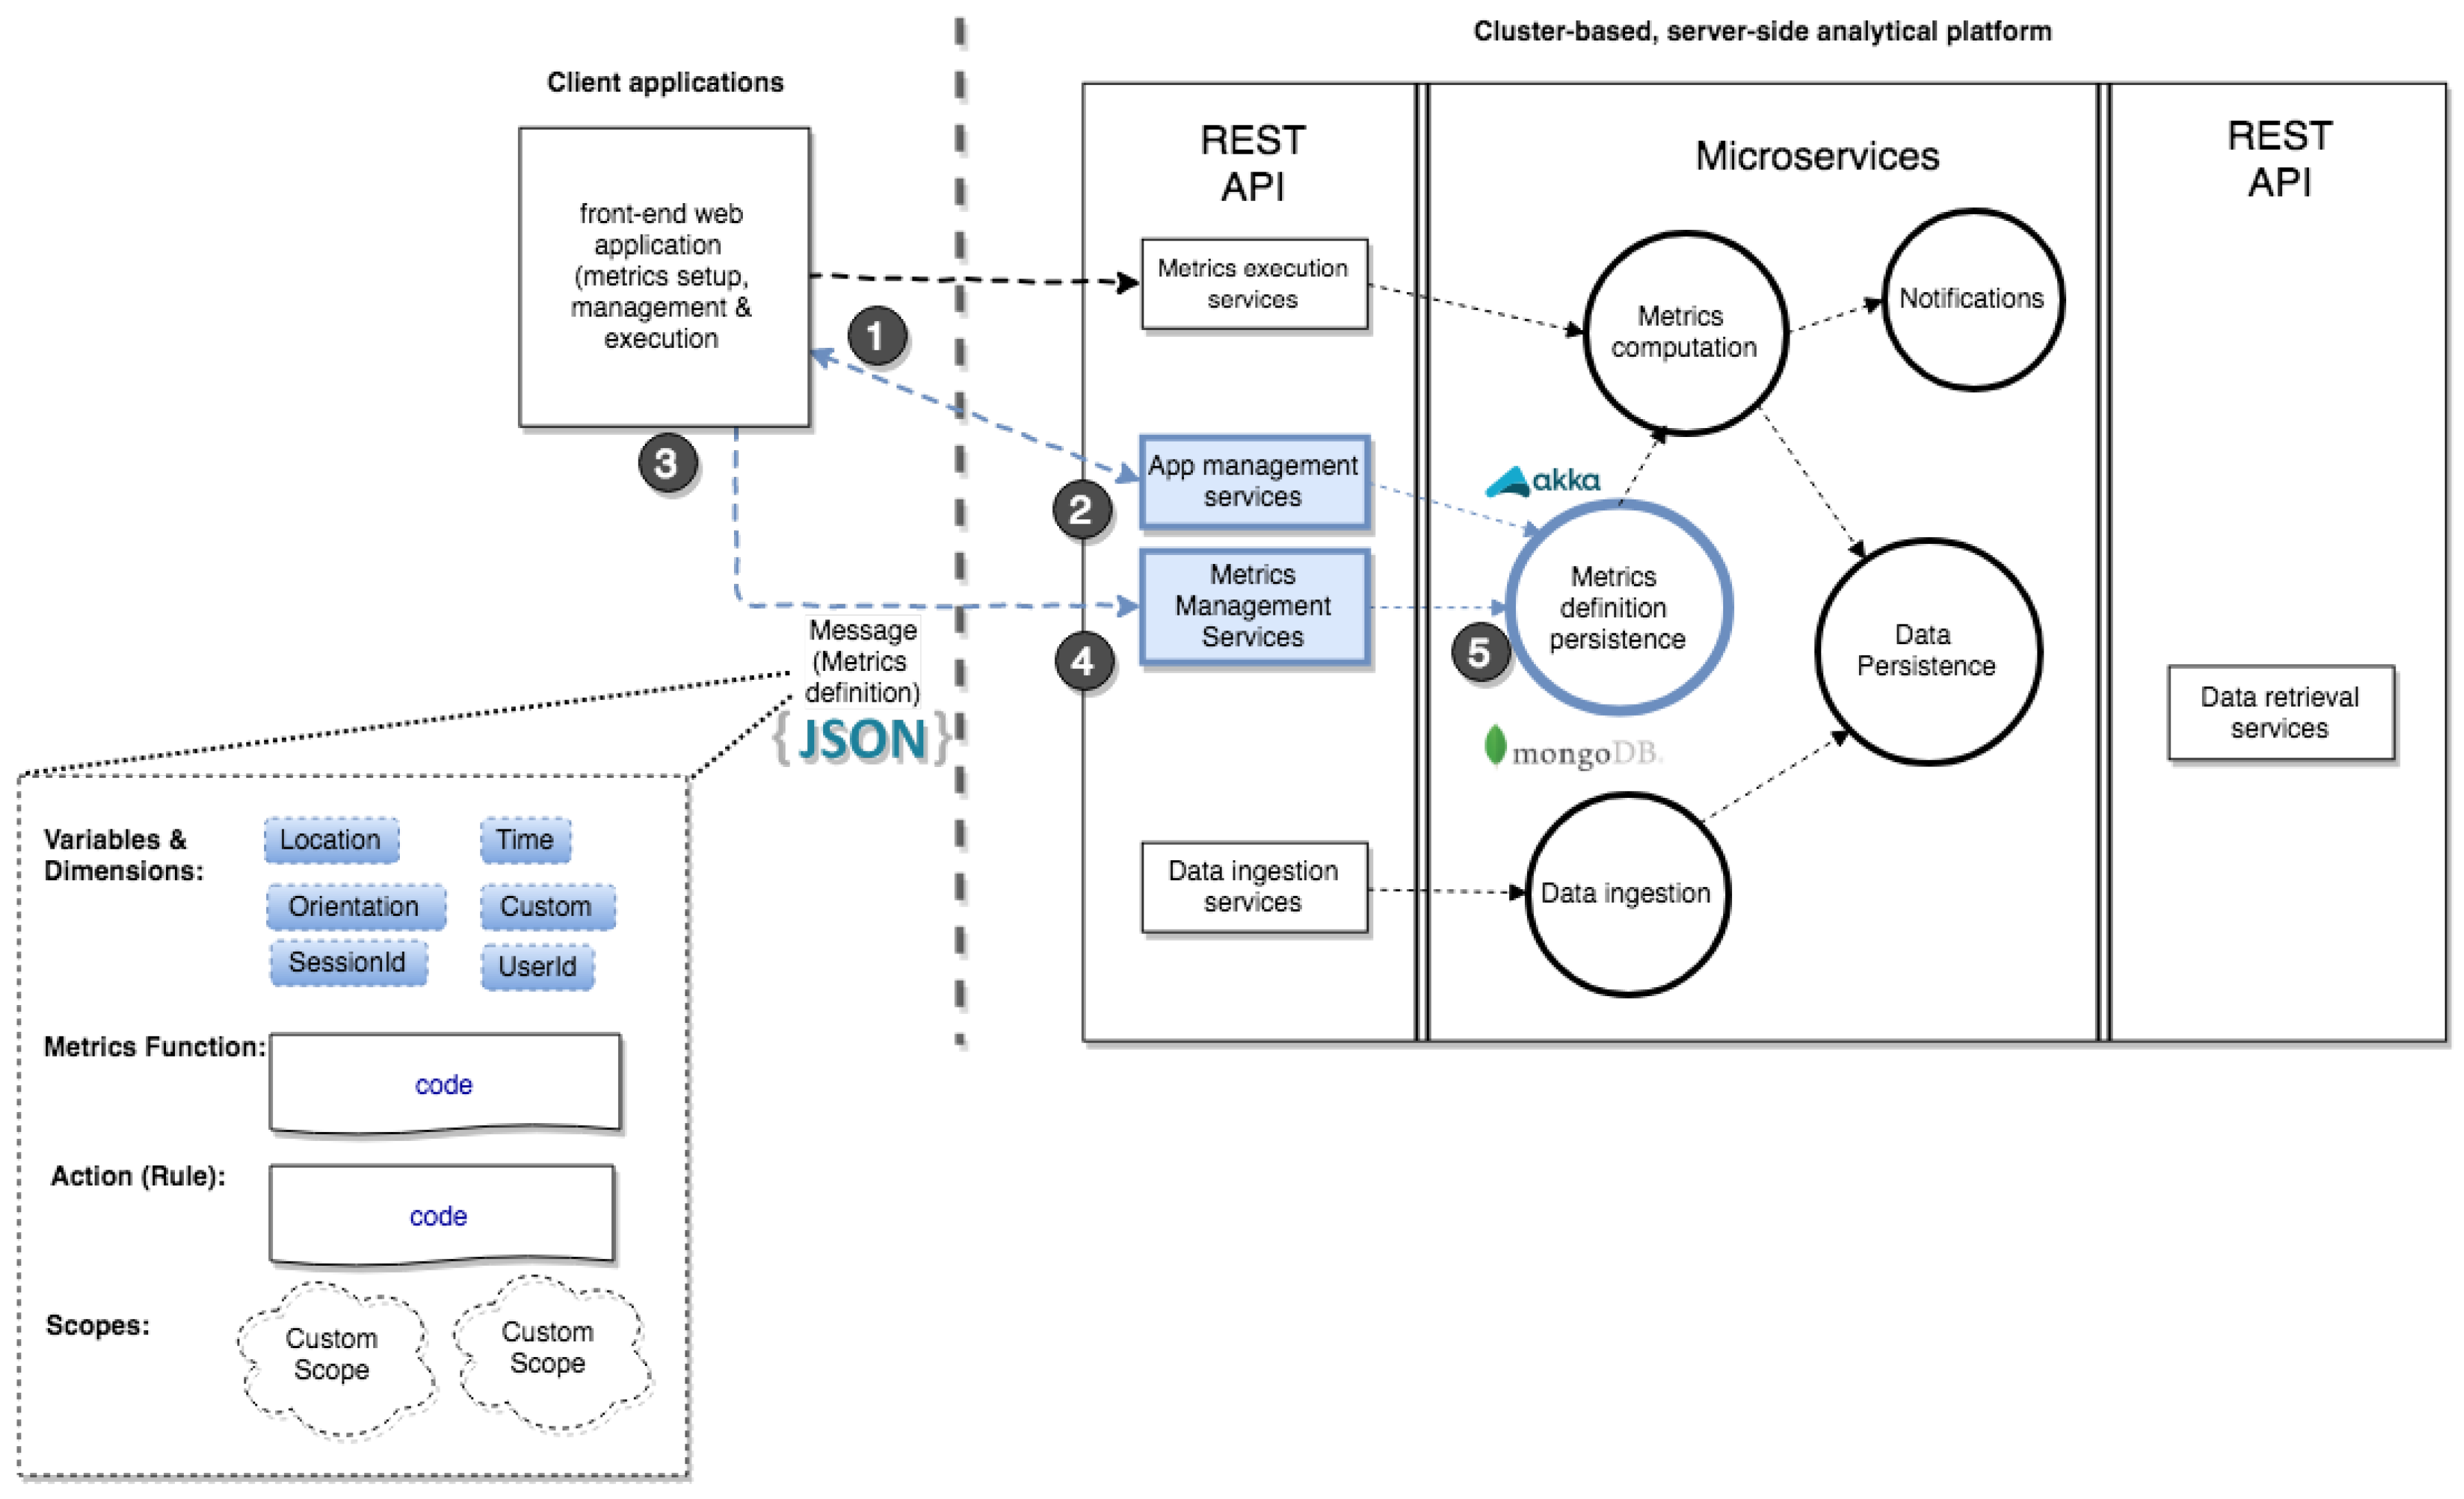
Figure 1 shows the architecture of the analytics platform, viewed as an ecosystem of client- and server-side applications, whereby the server side is realised as distributed applications organised as (micro)services and backed by big data processing methods [39], and the client side as a set of Web and mobile applications, communicating with the server-side through service interfaces.
The conceptual logic of the server-side platform follows the lambda architecture to integrate stream- and batch-processing at the same time. Lambda architecture refers to a big data processing architecture that combines batch-processing and fast- or stream-processing methods [40]. Shown in Figure 1 in the central box Microservices, the stream-processing method is used in the Data ingestion microservice for storing collected data. It depicts the flow of client-side collected data by various client applications (right side of Figure 1), their buffering and routing, and finally their storage into (distributed) database (Data persistence microservice). This stream processing pathway, which is represented in Figure 1 (in yellow) as a single circle but indeed contains distinct types of micro-services, is logically decoupled from the computational pathway (in blue), which uses the batch-processing model in order to compute metrics and perform data analysis (Metrics computation microservice).
The Metrics computation microservice uses stored metrics definitions (Metrics definition persistence microservice), generated by a client-side application (see below), and includes other types of specific microservices (not depicted in Figure 1), such as metrics scheduler, evaluator and execution. This microservice also produces notifications which are separately handled through Notifications microservices to end users (e.g., developers, designers). The decoupling between data ingestion and metrics computation (coloured circles in Figure 1) promotes a distributed big data architecture, while ensuring continuous data storage capabilities, independently of the data analytical operations.
The client side includes two types of applications: management applications (left side in Figure 1), which allow configuring metrics and visualising metrics results, and end-user applications (right side), which contribute application data and receive metrics notifications. For the former, the first management application is a one-stop Web (front-end) application (Available at https://gganalytics.geotecuji.org) to set up, access and manage all running applications and metrics. Through a visual interface, application developers define, test and update metrics, including their defining characteristics such as application and run-time scope, data requirements, and resulting actions. The second management application is a Web-based visualisation and reporting application, which allows the visualisation and inspection of metrics data and results. Both management applications are targeted to application developers who decide to rely on spatio-temporal metrics for their location-aware applications. The latter type of client applications plays the role of both (raw) spatio-temporal data collectors, necessary as input data for metrics computation, and data consumers, for (push-based) notifications of the results of the computation of metrics.
3. Conceptual Model of Spatio-Temporal Metrics
The central concept of the analytics platform is the notion of metrics. In general, metrics are used to monitor or characterise natural or artificial phenomena. A metric can be considered a function that takes input data and produces comparable outputs, i.e., for comparing or contrasting similar phenomena, and thereby characterising them. In economy, an illustrative example is the GNP (Gross National Product) metric that is broadly used to compare economic development across countries. In urban sciences, urban landscape metrics [41] and urban sprawl metrics [42] help urban planners and researchers characterise urban dynamics to better understand how cities function. In video-games, metrics are must-have tools for game developers and designers to monitor aspects of the game (e.g., game mechanics, strategies, user interface, player behaviour) and consequently make informed decisions to improve overall gameplay experience [43]. Specifically in location-aware games, the role of spatio-temporal metrics is as important as other metrics [32], and more generally, in location- and context-aware applications, spatio-temporal metrics can help developers to quantify and better understand the phenomena and dynamics that occur in real-world applications [44,45].
The concept of metrics has been commonly associated with a sole function. Here, we extend this concept to a model composed of three main elements: the data model or structure, the analytic function, and associated action(s). The specification of the data model of the phenomenon to be monitored is the only mandatory requirement to obtain a functional but minimal metrics model, which can only be used to store incoming data compliant to the specified data model (data ingestion in Figure 1). To fully harness the analytic power of the platform, i.e., the metric computation phase in Figure 1, the other two elements of the metrics model are needed too. Next, we describe each element in detail (Section 3.1, Section 3.2 and Section 3.3) and compare our proposal with the literature (Section 5.1).
3.1. Data Model
The underlying idea of metrics is to measure monitored phenomena of interest for users, independent of their application domain, e.g., researchers, urban planners, software developers. An essential requirement in doing so is to capture the required data by means of flexible data models, since these phenomena may require the collection of data of diverse nature, concerning different aspects a user wants to monitor. Example of such aspects include application-environment interaction, user interface, user mobility, or any other relevant data that are necessary to quantify the context.
3.1.1. Context Matters
Because the interpretation of context varies depending on many factors (discipline, view or dimension being analysed, etc.), establishing a clear meaning of context is necessary to better understand what we mean by “quantifying the context”. Context is “any information that can be used to characterise the situation of an entity”, where an entity is “a person, place, or object that is considered relevant to the interaction between a user and an application, including the user and applications themselves” ([46], p. 5). One way to look at context is taking a social perspective. In this view, context emerges as a dynamic construct associated to the user’s current activity [47]. Another way to examine context is from a computational point of view, in which context is often seen as an informational representation of an entity, and as such, developers know the possible contexts beforehand, i.e., the possible range of potential situations, so that associate actions can be a priori codified into a system. As in most context-aware systems [33], we prefer the computational view of context. We take an informational representation of what might happen when monitoring a phenomenon, i.e., the recognition of a event of interest and foreseen actions in response to it. The metrics model allows application developers to design customised data structures to capture the bits of interest (contextual data) of the monitored phenomenon. Consequently, by defining custom functions over the captured data (Section 3.2), these data can be processed, along with other contextual data, to deliver actionable information (see Section 4).
For example, many location-aware games distinguish between collected data from different users, play sessions and, even applications, in case various (game) applications coexist at the same time. In the proposed metrics model, the meaning of user, session, and application is intentionally left to the application designer, who is in charge of defining how these bits of contextual data are best used to meet his/her needs. For example, a session can be defined as each time a player opens the application (e.g., for sports monitoring applications) or when a user performs a new search (e.g., in location-based recommender systems). Sessions can also be applied to groups of users, for example, when various users accomplish a certain goal (e.g., when a complete coverage is reached in participatory sensing applications). In this case, all users share the same session. Therefore, these contextual views can be adjusted in a way to favour data access, aggregation, partitioning, and retrieval at metrics computation time, thus being a determinant mechanism for selecting, contextualising or filtering potentially large volumes of input data.
Equally important are the spatio-temporal features of context. Ensuring temporal order of collected data is vital for phenomena related to mobility, for example. Monitoring the movement of users in location-aware applications to determine travelled distance or trajectory implies necessarily capturing contextual data in the form of spatio-temporal features of movement [48]. As distance can be distorted in case collected points are temporally shuffled, spatio-temporal features are key for input data consistency and ensuring reliable computations of spatial-aware metrics. Next, we describe how to specific data models to capture contextual data.
3.1.2. Variables and Dimensions
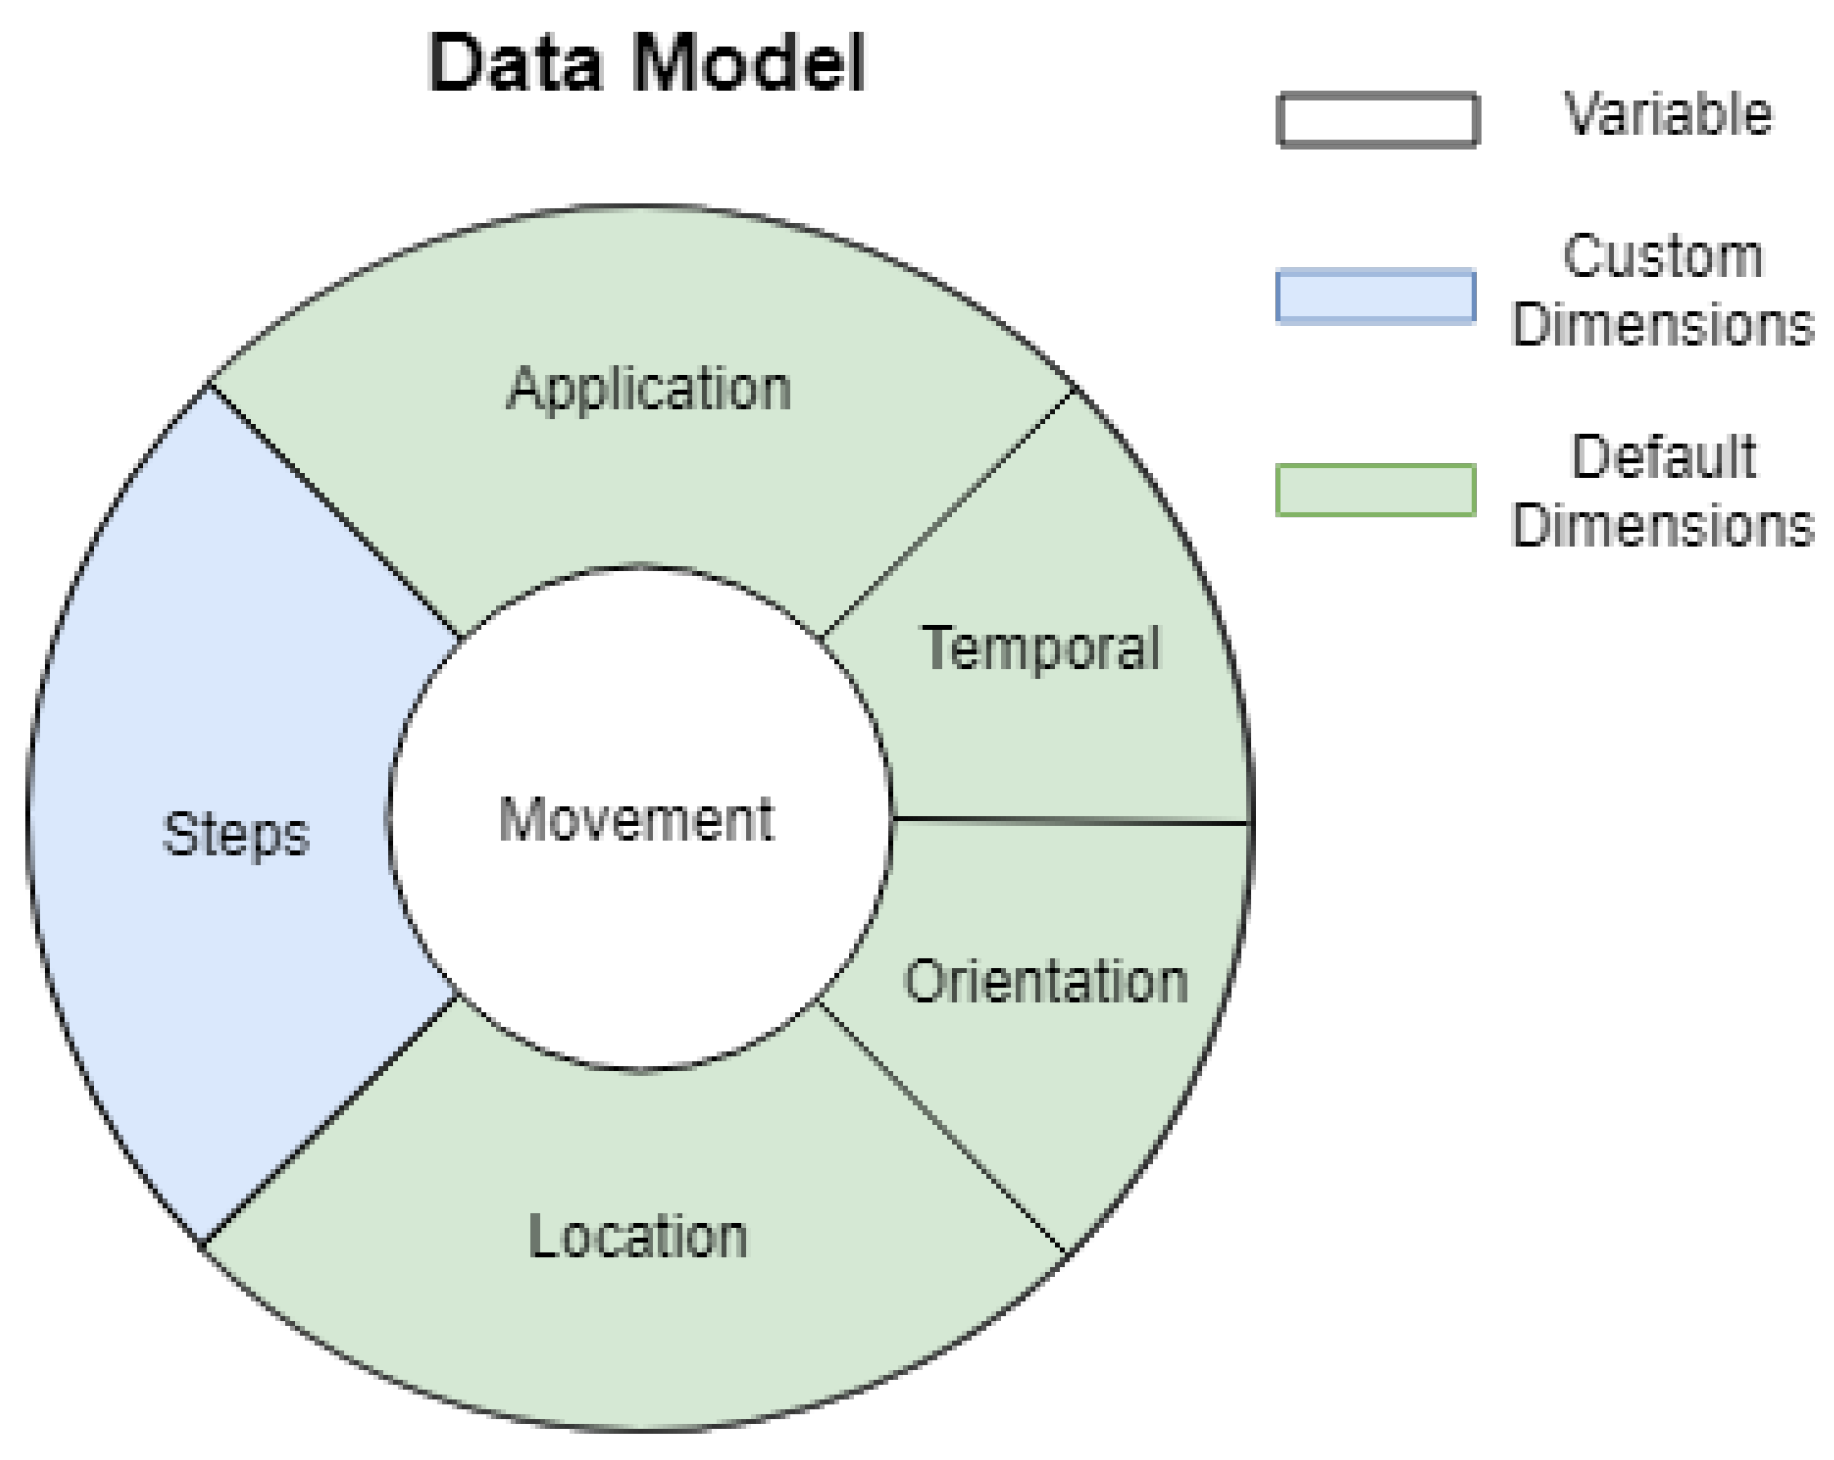
Each phenomenon can be explored or studied from distinct viewpoints, depending on what a user wants to monitor. In location-aware applications, one of the monitored phenomena is typically human location and movement, and the outputs of the desirable metrics must be comparable over space and time for being able to process and discover mobility patterns [48]. As any real-life phenomenon, human movement is a complex and multifaceted phenomenon that requires multidimensional data. Accordingly, the proposed data model is driven by variables and dimensions. A variable indicates the phenomenon of interest (e.g., movement), while a dimension defines the required data model to capture an aspect of that variable. For example, each dimension (orientation, temporal, location, steps) of the variable movement, as represented in Figure 2, refers to complementary aspects of the phenomenon of movement. Therefore, the proposed data model is composed of multidimensional variables.
While variables refer to high-level views of the phenomenon to be monitored, dimensions define the data structure of a variable. Dimensions can be classified into default and custom (Figure 2). Default dimensions are data structures already provided by the analytics platform and ready to be used in the definition of variables. Their intent is to handle contextual data, as for example spatio-temporal features, partition and/or filtering of collected data. Examples are the temporal, orientation and location dimensions to capture spatio-temporal features, and the application, session, and user dimensions (grouped under application in Figure 2), to enable data selection, filtering and contextualisation (see below). One key advantage of default dimensions is that their data is automatically collected by the analytics platform.
While default dimensions in terms of data structures are given as such and always included in new variables, custom dimensions are up to developers to define. Therefore, developers also need to specify (and implement) how to collect data for custom dimensions, because the platform cannot do so automatically. Nevertheless, it provides convenient methods to help developers collect and manage data according to the custom dimension’s data structure. Custom dimensions can be based on any combination of predefined data types (e.g., string, number, etc.), allowing more complex data structures such as nested or hierarchical data structures. Implementation details about dimension definition and data collection methods, and the supporting metrics SDK, are described in Section 4.2.
Default dimensions related to data selection and contextualisation (e.g., user, session, application) allow to efficiently filter out and select collected data during the analysis and processing phase. That is why we state that a dimension guides the definition of analytic functions, and not the other way around. The definition of dimensions (data model) for structuring collected data comes first, and this determines the type of analytic functions needed. This aspect is extremely important in stream processing because input streams are dynamic, while functions remain static, i.e., a continuous flow of input data is processed over and over by the same function [30]. As we explain next, a default dimension has associated default/predefined functions that are well suited to operate over its own dimension’s data model, providing handy methods and utilities for developers to handle, manage and process collected data. The following rules summarise the semantics of variables and dimensions, and set the relationships to the other two elements of the metrics model:
- A valid metrics model must contain at least one variable.
- A variable is composed of one or more dimensions.
- A dimension’s data model defines the data types and data structure of input (collected) and output (processed) data.
- A dimension’s data model is queryable.
- A dimension’s data model is customisable and extensible to allow characterisation of any phenomena of interest.
- A dimension can have associated default (or built-in) functions that operate over the dimension’s data model.
3.2. Analytics Functions
An analytics function takes captured data as input, structured according to the dimension’s data model, and computes output data, which are also structured according to the metrics’ output data model. Similar to default dimensions, default analytics functions help developers to handle dimensions’ data structure. Default dimensions come with default functions that remain at the developer’s disposal for creating custom functions. For example, default functions pertinent to the default dimensions application, session, and user are tasked with querying or filtering out input data. Other default functions are optimised to handle dimension’s data models, such as built-in functions related to the temporal dimension for filtering and aggregating temporal data (data between dates range, time intervals, etc.), and for spatial data filtering and aggregation as well as for computing topological operations (e.g,. data within an area, buffering, union, intersect), associated to the location dimension.
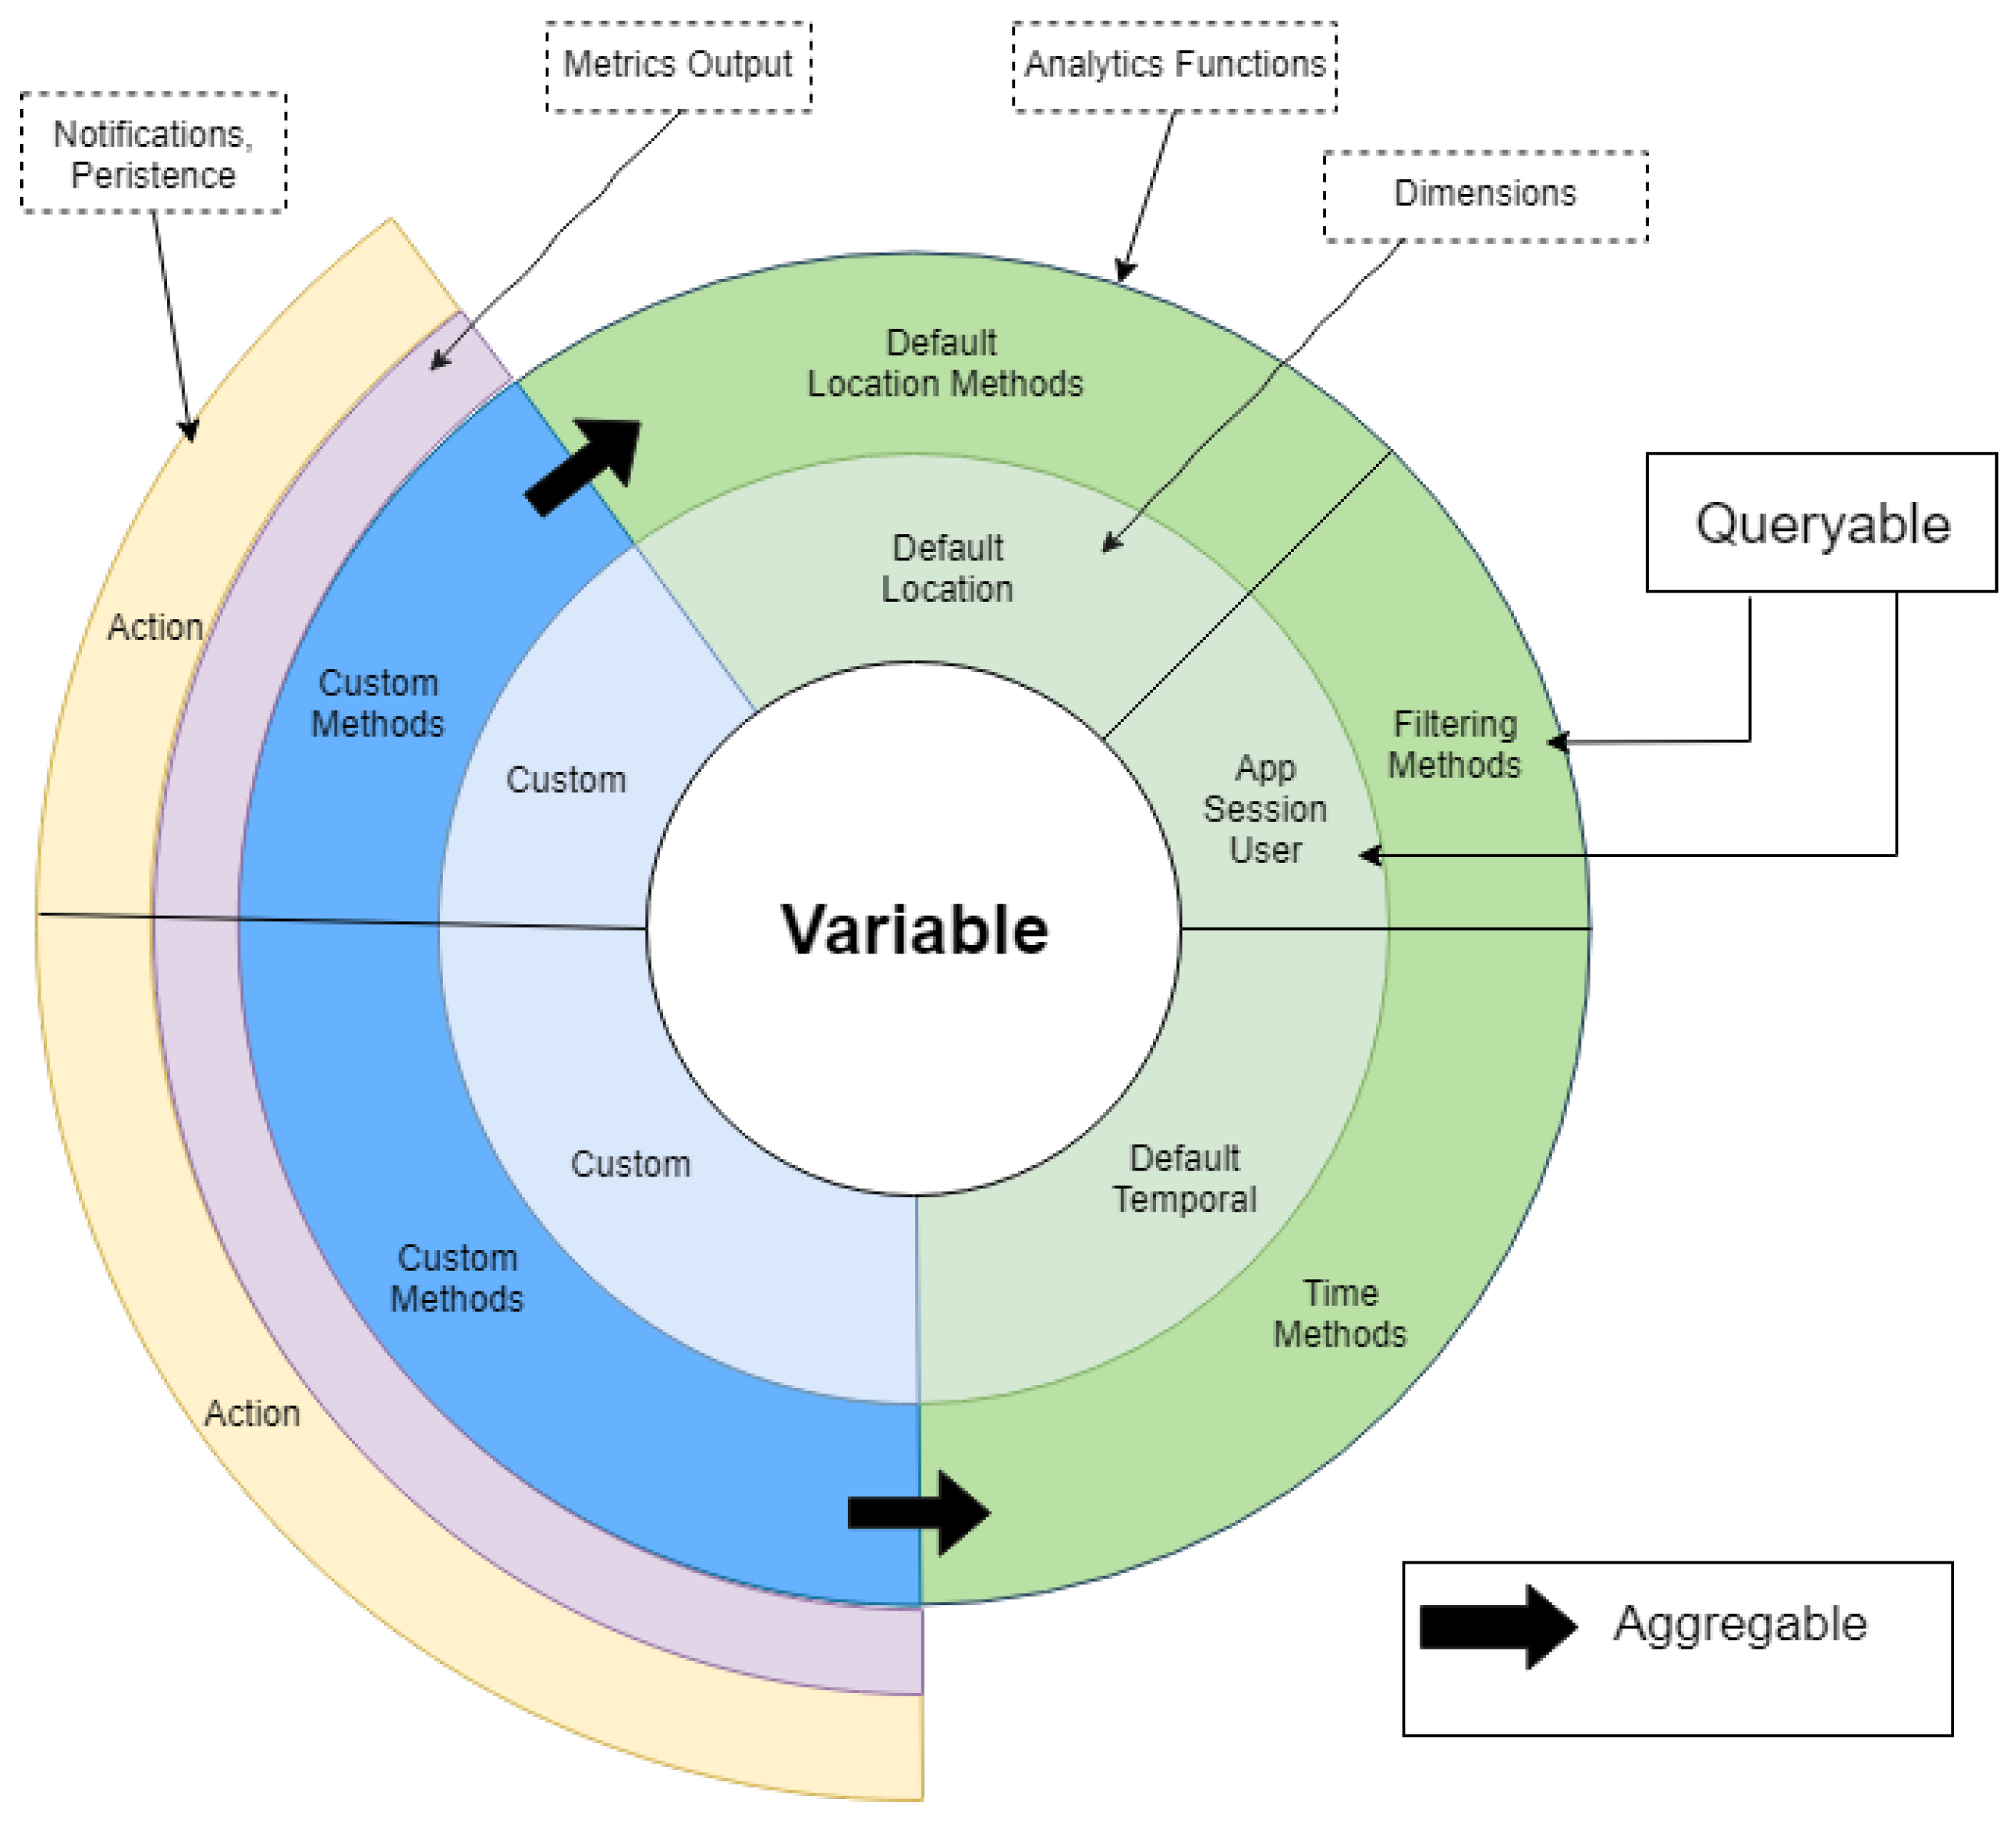
Returning to the example of human movement as the monitored phenomenon, the variable movement aggregates default dimensions (location, orientation, temporal, application, session, and user) and other custom dimensions to capture specific aspects of movement (e.g., number of steps) and/or application context (e.g., player progress in the game). While a dimension’s data model is queryable (i.e., filtering or selecting data subsets), functions are composable, meaning that custom functions can aggregate default functions to define more sophisticated computations, as the black arrows illustrate in Figure 3. For example, to compute the travelled distance based on the number of steps, the custom function will call existing spatial and temporal functions (from the respective location and temporal default dimensions) to calculate linear distance over a sequence of temporally ordered spatial points (steps). Thus, the metrics model represents an elegant but extremely powerful approach to reuse dimensions and associated analytics functions to characterise spatio-temporal phenomena without introducing new conceptual constructs or computational artefacts. In summary, when creating a custom analytics function, developers have at their disposal functionality available for:
- accessing and navigating through the data fields and nested structures of the dimensions’ data models, making input data of each declared variable accessible from the execution environment of an analytics function. This requires data access methods in place to get to both input data and output data, being the latter especially useful to get access to the history of metrics outputs, for example, to calculate statistics over historical data or compare current results to past results;
- contextualising input data through the application, session and user default dimensions; Slightly different combinations of operators from these default dimensions permit to conveniently select, query, and filter data relevant to the current execution context and needs of an analytics function (see Section 4.4);
- operating and filtering over temporal data through the temporal default dimension. Temporal filtering can be contextualised, for example, to retrieve “data belonging to variable movement for the current user and current session of the application over the last five minutes”. This functionality is cross-cutting to any declared variable as the proposed metrics model always includes the temporal dimension and associate functions;
- operating and filtering over spatial data through the location default dimension. This is important for enabling geospatially related functionality in the analytics platform. Built-in spatial functions are based on spatial algorithms and methods from external libraries (e.g., Turf.js as we will see in Section 4) to, for instance, calculate measurements (area, distance, centroid, etc.) and transformations (convex hull, simplification, etc.). Spatio-temporal operations for trajectory analysis are also included to compute average/max/min speed, travelled distance, number of points within a trajectory, spent time to travel it, among others;
- performing descriptive statistics measures of tendency that are traversal to any metrics definition such as average, maximum, minimum, as so on. These functions are not tied to any dimension but taken for granted as built-in operations embedded in the analytics platform; and
- composing and reusing existing analytics functions in the definition of new analytics functions.
Built on top of the variable and dimensions rules (Section 3.1), the following statements summarise the semantics of analytics functions in the context of the metrics model:
- An analytics function’s return type must conform to the data model representing output data.
- An analytics function is reusable and composable.
- An analytics function is customisable and extensible to allow computation of any phenomena of interest.
3.3. Actions
An action defines what to do with the result of the execution of an analytics function. An action’s input is the return value of an analytics function An explicit definition of a custom action is optional in the metrics model, but a default action is always data persistence, since the analytics platform always stores the results of the analytics function for future use.
Notification is another type of supported action. Using simple reactive rules (if-then rules), users can specify when an action is triggered [32]. For example, a user gets notified only if the output is greater than a given threshold. Notification actions are especially interesting because they allow the platform to be in continuous interaction with users, the physical environment and other systems that interact with it. Notification actions are also customisable, i.e., a developer can choose the delivery method (e.g., push, post), the target audience (i.e., the current user, current session or the entire application, i.e., broadcast notifications), and the content or payload to be sent out (e.g., containing the result of the calculation or informational messages).
As in the previous two elements of the metrics model, we add a new rule to complete the set of statements that characterise the proposed metrics model:
- A metrics model is the sum of variables-dimensions, analytics functions, and actions.
4. Workflow and Implementation of the Analytics Platform for Computing Spatio-Temporal Metrics
Building upon the metrics model at conceptual level, this section describes how to put it into practice. It explains the implementation details of the analytics platform, bringing a set of components, services, tools, and underlying big data processing and analytic systems (e.g., Spark, Kafka) together to realise an analytic platform for integrating and computing spatio-temporal metrics. The rest of the section deepens relevant features of the platform that are especially significant for developing large-scale, context-aware applications and architectures. Subsequent subsections expands specific parts of the conceptual architecture (Figure 1) initially described in Section 2. Section 4.1 refers to the definition of a metric according to the metrics model. Section 4.2 and Section 4.3 describe how the first element (data model) of the metrics model is being used for data collection and data ingestion into the analytics platform respectively. In Section 4.4 we describe the metrics computation phase which uses the three elements of the metrics model. Lastly, in Section 4.5, we highlight a supporting tool to retrieve and visualise the input and output data of metrics.
4.1. Metric Definition Specification
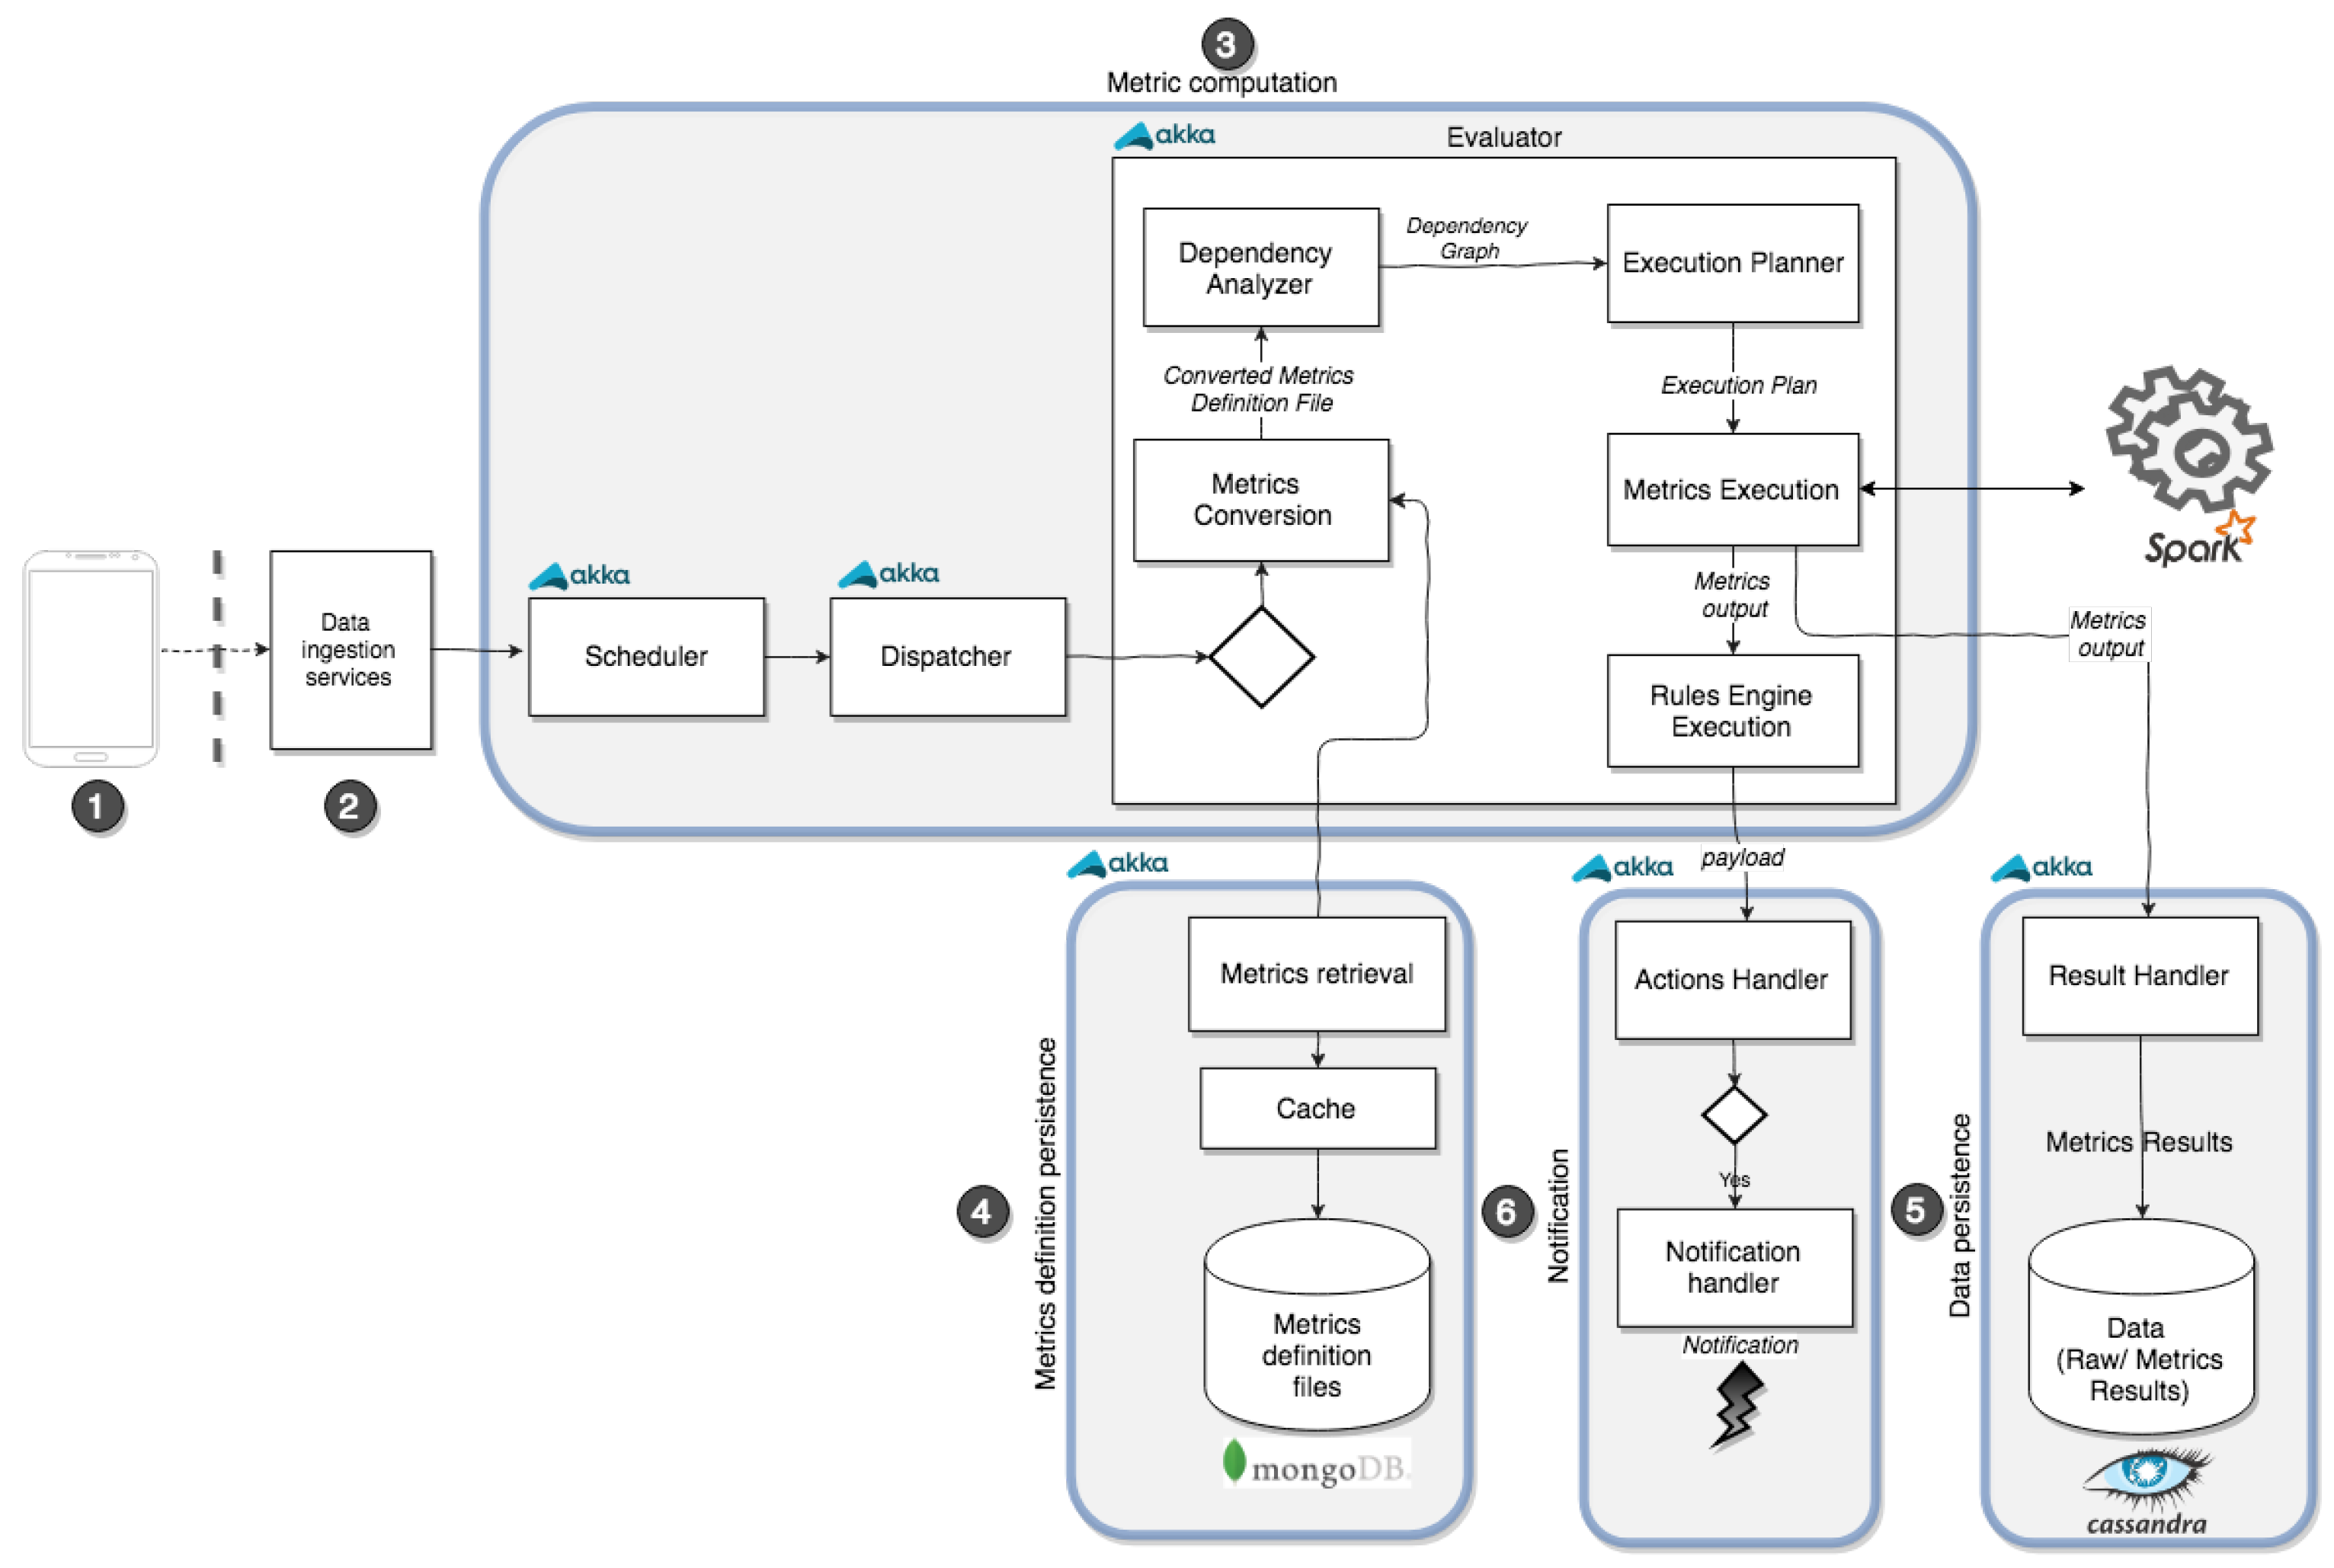
To facilitate the sharing, validation, reuse, and reproducibility of user-defined metrics by both client applications (e.g., data collectors, game clients, wearable-based apps) and the analytics platform, a way to specify the metrics model into a declarative format is needed. We have defined a JSON schema to specify the required multidimensionality of the metrics model, namely variables-dimensions, analytics functions and actions. For helping with the metrics specification, we have created the metrics definition tool for editing and producing metric definition files that comply with the specification schema of the metrics model.
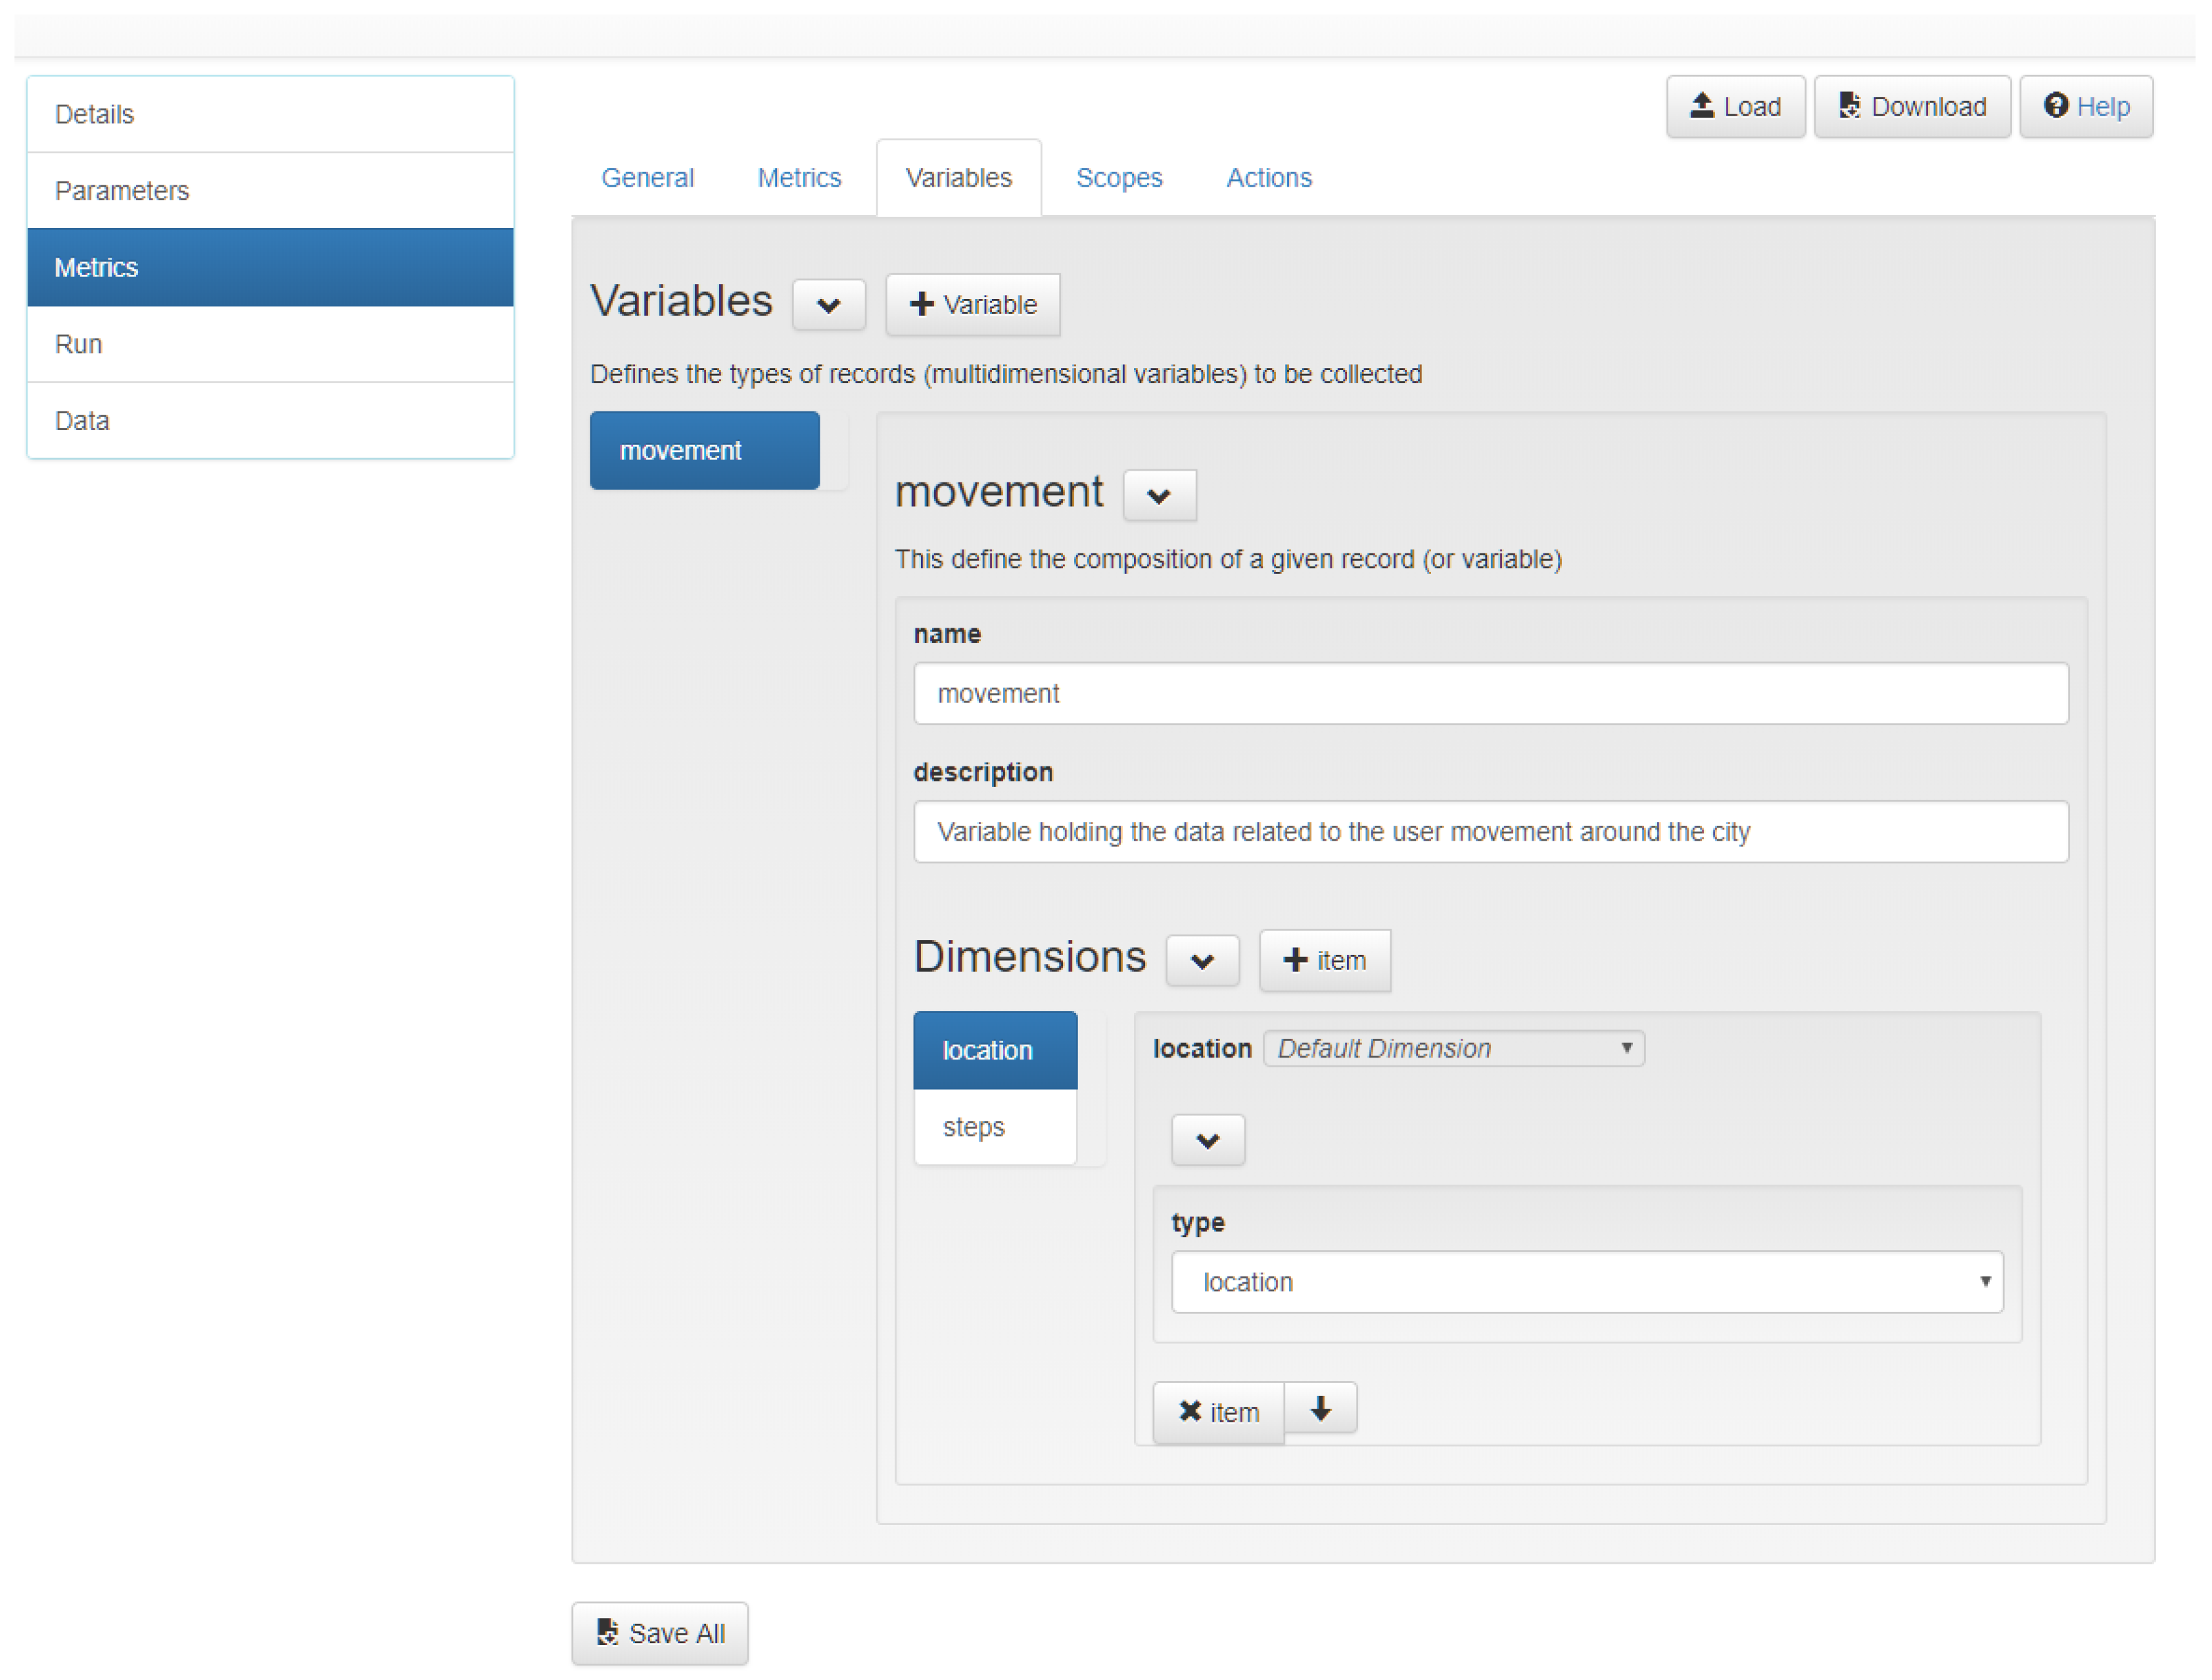
The metrics definition tool is part of a web-based application that plays a dual role. On one hand it is a one-stop catalogue to access all metrics definitions. This function is reflected in steps 1–2 in Figure 4. In step 1, a user sets up a few application-level, general configuration parameters. The client tool interacts with a set of RESTful web services for application management (step 2), which in turn store incoming data into a back-end MongoDB database (step 5). These convenient RESTful services are explained later in Section 4.2). On the other hand, the web-based application also allows users to define a new instance of the metrics model using the metrics definition tool, which is the focus of this section. This second functionality is reflected through steps 3–5 in Figure 4. In step 3, a user specifies the main elements of the metrics model. The metrics definition tool (Figure 5) helps users in this task. A resulting metrics definition file is then forwarded to public RESTful services for metrics management (step 4) and subsequent persistence into the back-end MongoDB database (step 5). As we described above, the metrics definition file and collected/processed data are stored separately. While metrics definition files (and other application-related configuration data) are stored in a MongoDB database, flows of input data and processed data (metrics results) are persisted into a Cassandra distributed database. The choice for each is motivated by different set of requirements. MongoDB presents high flexibility with respect to the model stored (in contrast to traditional relational databases, which pose a more rigid schema), which is what we pursue to store and access a variety of application-level data. On the other hand, Cassandra supports high throughput to handle and store streams of incoming data, which is the goal of the data ingestion phase (see Section 4.3). The difference in objectives of both databases are clearly identified in the experimental configuration, where we run a single instance of the MongoDB database, but three instances of the Cassandra database in order to cope with rapidly and massively incoming data.
The metrics definition tool’s options faithfully reflect the intention and structure of the metrics model (Section 3). It consists of a Variables tab for defining variables and dimensions; the Metrics tab for specifying the code of the custom analytics function; and the Action tab to specify the code corresponding to actions based on results of the analytical function—see Figure 5. Beside the three main elements of the model, additional functions are available to select and filter collected data for easing metrics computation. This is the case for the Scope tab, which permits users to pre-define queries over collected input data to generate subsets of data to be easily fed into the metrics computation process. Scopes are intended to define more sophisticated queries than the filtering methods accessible through userSession, session, and application as seen in Section 3.2.
The resulting JSON document completely specify and document metrics, and can be seen as a novel way to share and reuse metrics, as the contained dimensions (data models), analytics functions and actions are openly available so that these metrics definitions may be re-purposed, reproduced, or replicated in other applications and scenarios. This is not a minor contribution, but a fundamental one towards the establishment of comparable metrics for human mobility, for example, confirming recent open calls: “[there is a need for] measurable metrics for making comparisons over place and time.” ([49], p. 452).
4.2. Data Collection through Metrics SDK
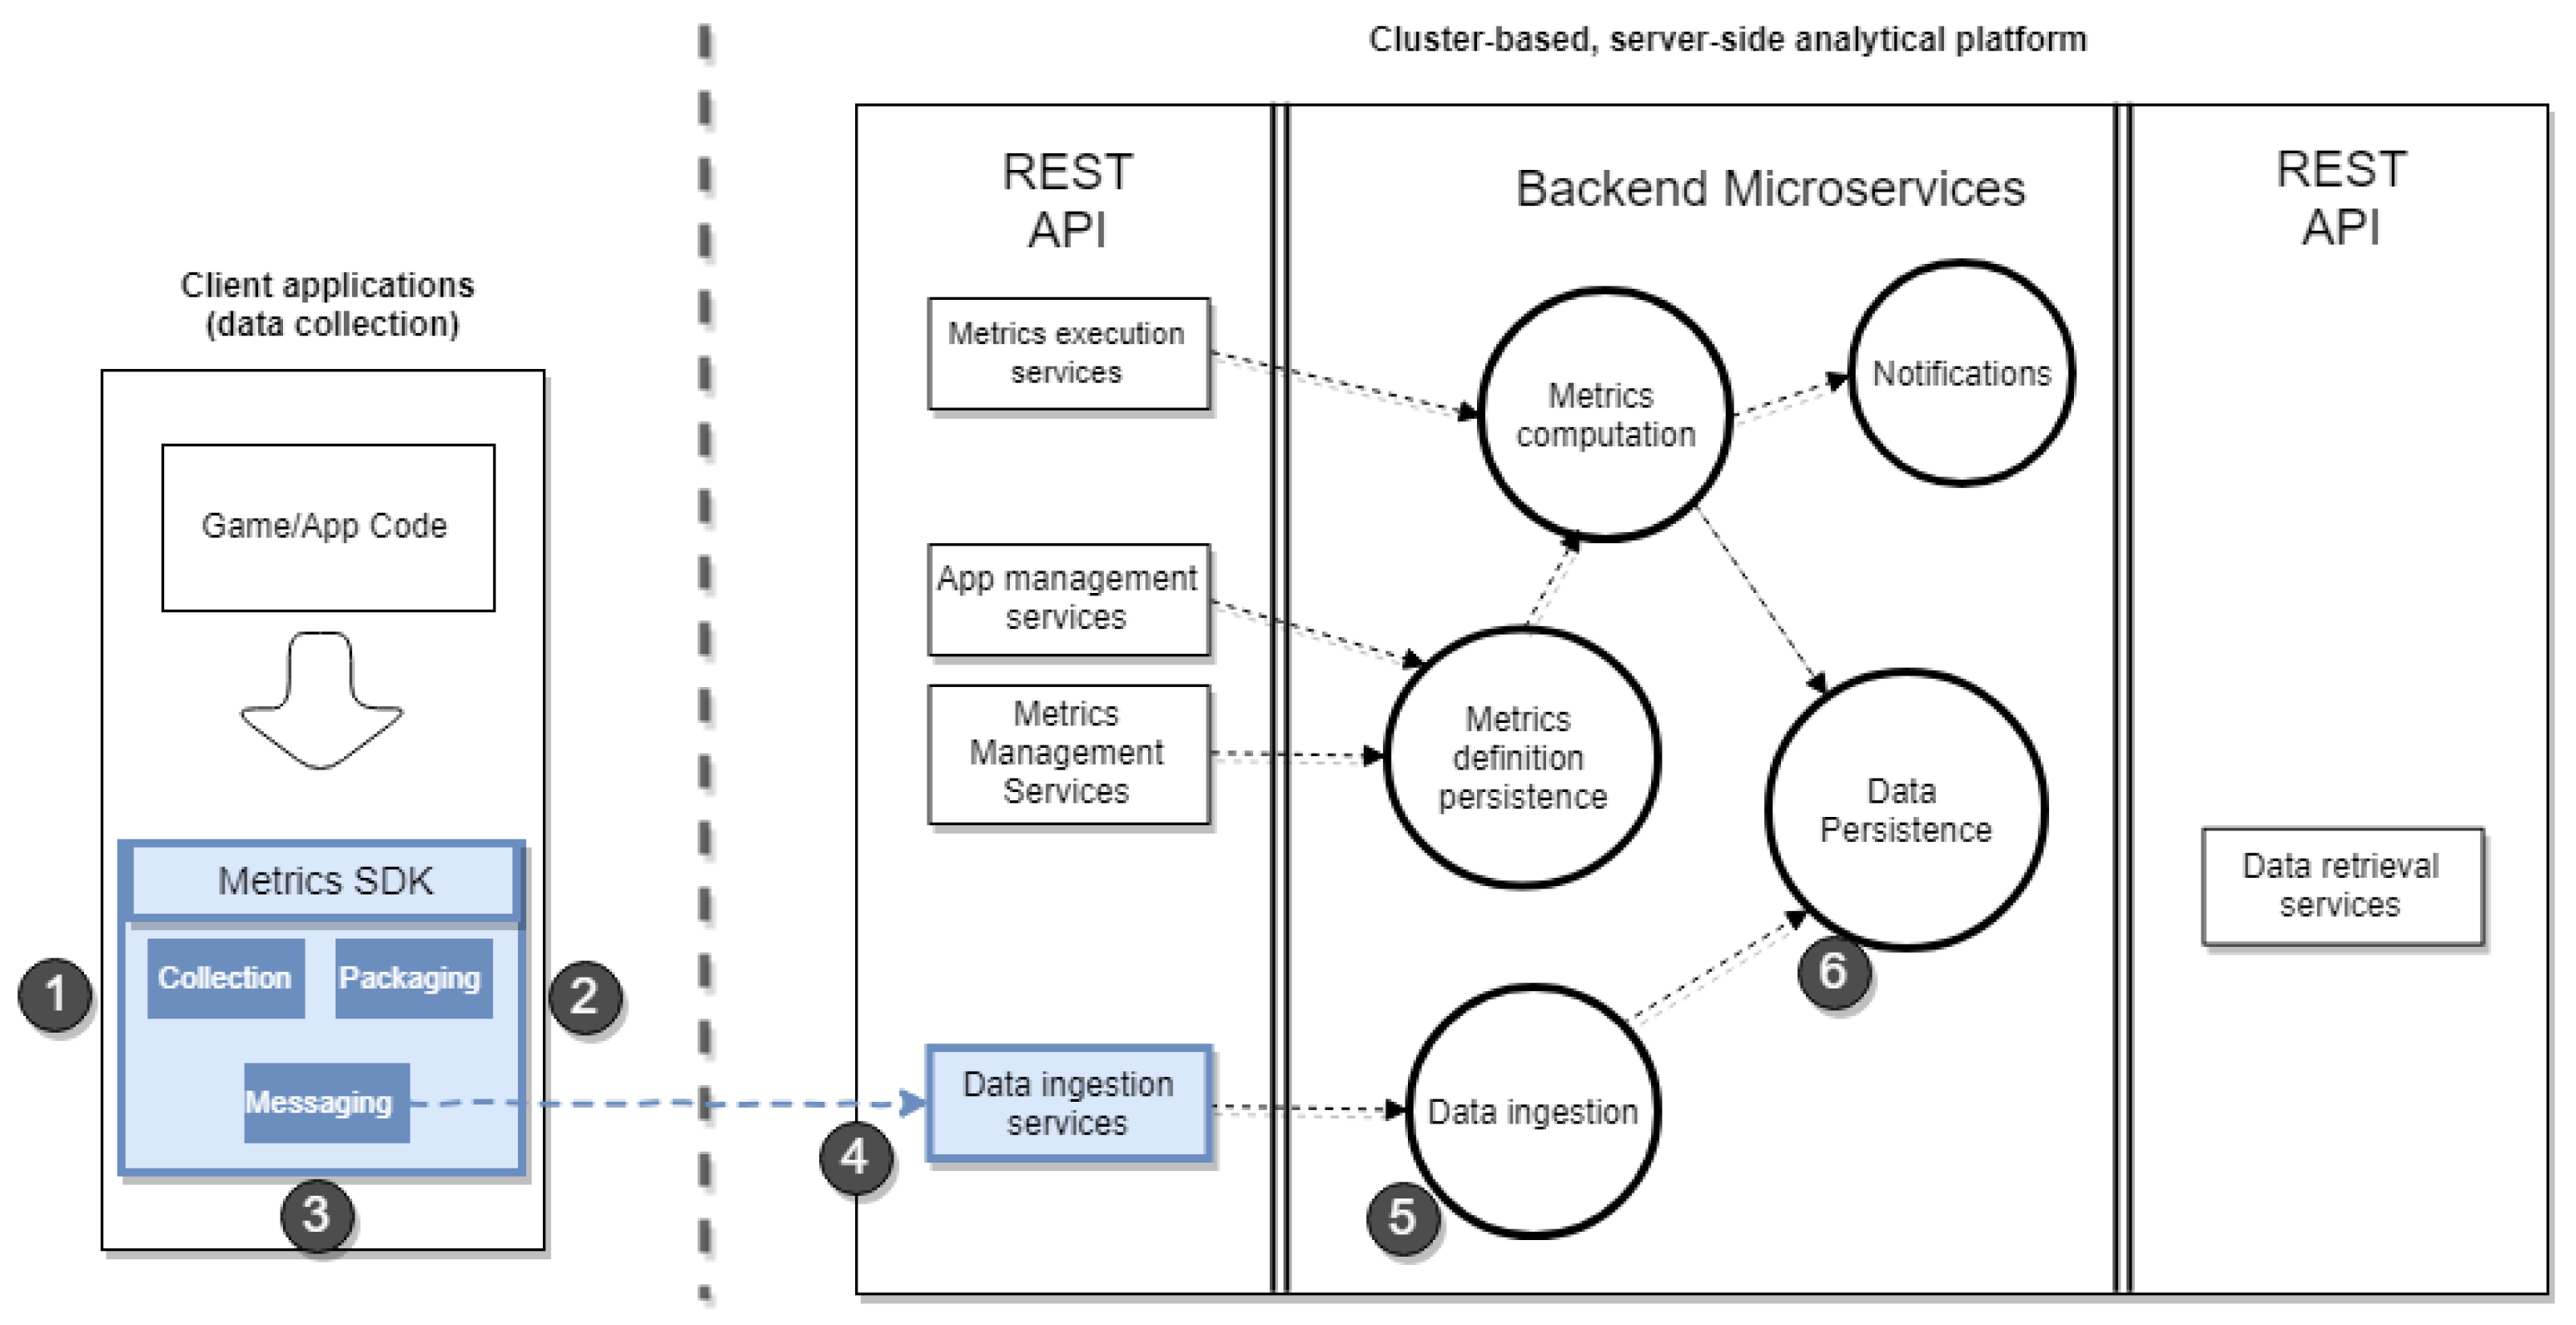
A fundamental role of a client application is to gather (contextual) data, validate it, package it according to the data structure of the metrics model, and transfer it to the server-side analytics platform. Figure 6 summarises the elements of the platform directly involved in the data collection task. Only steps 1–4 are concerned with data collection; steps 5 and 6 are involved in the data ingestion phase explained in Section 4.3.
Two main functional blocks for data collection are illustrated in Figure 6. The first one takes place in the client application and is represented by steps 1–3. Here, the Metrics SDK is central, which is a convenient API library to help developers integrate data collection functionality into their client applications. It provides methods to collect and validate data against the metrics model (step 1, Figure 6), and provides supporting methods to package and encode captured data into a JSON-formatted metrics messages according to the metrics schema (step 2), and transfer it to the server-side platform (step 3) by enabling client applications seamlessly interact with data ingestion RESTful services (step 4). In the concrete case of Android (At the time of writing, the Metric SDK only supports the Android platform, but as it encapsulates and abstracts the interaction with the supporting implementation language through RESTful services, it can be easily expanded to other platforms (e.g., iOS) and implementation languages), the Metrics SDK also takes care of persistence and re-trial of data collection requests in case of failure. All these tasks only require the first element of the metrics model (variables and dimensions) and the initial configuration setup of the client application (i.e. a valid specification of user, session and application as seen in Section 3.1). It is worth recalling here the distinction between default and custom dimensions (Section 3.1). In contrast to default dimensions, whose data structures are automatically filled by the Metrics SDK (e.g., GPS-based positioning, or other mobile phone sensor data), the data model of a custom dimension necessarily has to be populated by the developer (using custom code). For example, in the case of the movement variable, which contains the custom dimension steps, its value must be provided by the developer, for example, by implementing interaction with a step counter sensor [50]. These data collection and validation tasks should be viewed as initial steps of the flow to transform raw data into actionable information derived from metrics execution.
The second functional block refers to the REST API boxes illustrated in Figure 6. Client applications operate and interact with the analytics platform through a set of RESTful web services (Available at https://metrics-api.geotecuji.org/docs). These services are grouped into functional categories as follows. App(lications) management services and Metrics management services are used for managerial tasks, either for initial set-up or for managing new or existing metrics definition specifications respectively, as seen in Section 4.1. Metrics execution services give users full control to schedule metrics execution on demand (Section 4.4), since event-based scheduling can only be configured through the scheduler actor (Section 4.4), whereas Data retrieval services are public end points to allow third-party tools to download and/or access input and processed data for visualisation and reporting purposes (Section 4.5). Data ingestion services (step 4, Figure 6) are of interest for data collection. Technically, these services encapsulate the uploaded data into a payload message and forward it to the microservice for data ingestion (step 5), as explained next.
4.3. (Fast) Data Ingestion
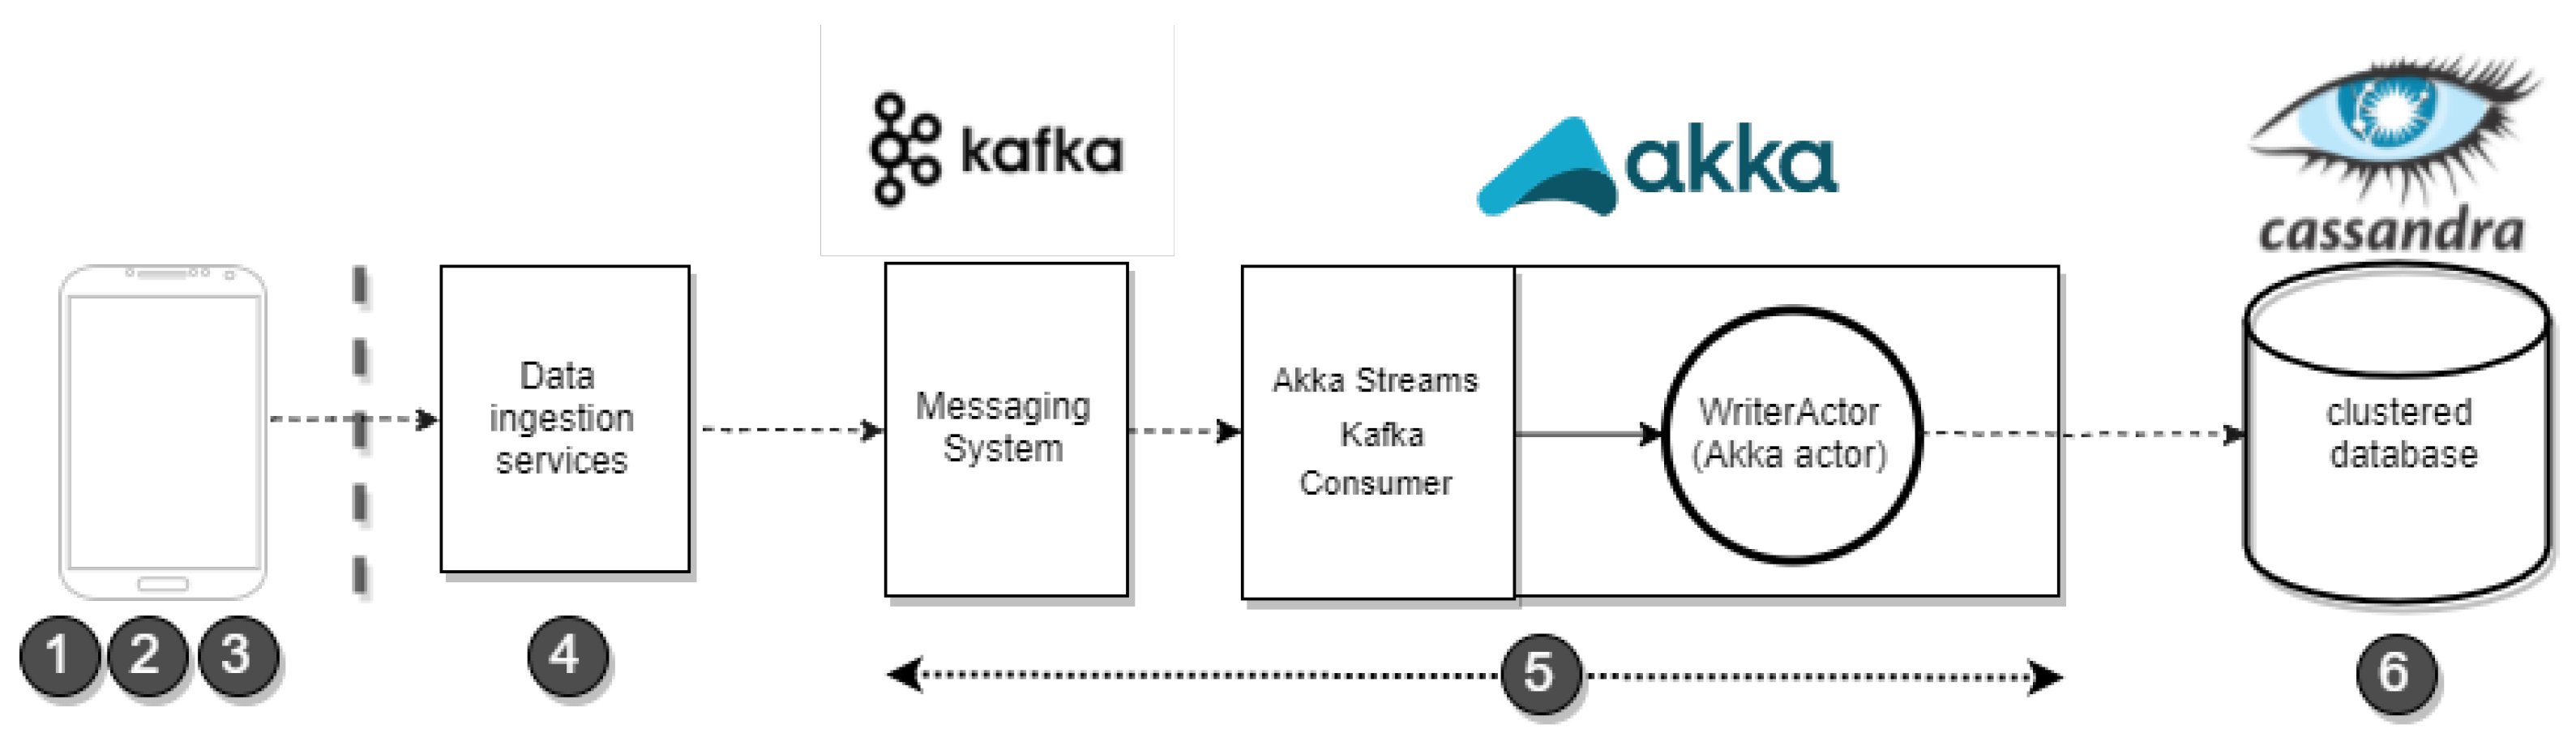
Steps 4–6 in Figure 6 cover the data ingestion phase to ensure streams of collected data reach and are properly stored in the back-end clustered database. In this section, we look into the data ingestion microservice (step 5, Figure 6) to examine the pair of contained components as depicted in the central part of Figure 7.
The first component is the (Kafka) messaging system, which ensures reliable handling (receive, buffer, route) of the incoming flow of data. The message system emits and exchanges messages, which contain the metrics data load, through a Kafka topic to which connector applications can subscribe in order to handle/process the data stream. One such connector application is the self-developed persistence component, which connects to the (Kafka) messaging system and persist the messages in the (Cassandra) database. It is implemented as an Akka actor-based application [51] and internally contains two main elements. The first element is an (Akka) Streams Kafka Consumer (https://doc.akka.io/docs/akka-stream-kafka/current/home.html (accessed on 9 January 2019)) that subscribes to the (Kafka) messaging system, and forwards messages (i.e., metrics data) to the second element, an (Akka) actor called WriterActor for performing data persistence into the back-end Cassandra database. This latter actor is aware of the database structure, and selects the appropriate table(s) for persistent storage. The first time this actor inserts data originating from an application, it retrieves the metrics definition specification with the application’s variable schema, and convert it to the appropriate Cassandra statements that permit the insertion of (JSON-encoded) data messages.
The aforementioned connector application furthermore doubles for other purposes besides data persistence, it also has the responsibility of notifying changes in the data belonging to different variables. For example, when data of a variable changes, the connector application emits notifications with messages (in a “data-changed” Kafka topic), which include the coordinates of the data changed (i.e., variable name, application, session and user). This allows (additional) data consumers, for example, for example to account for the data entering to the system or for overall system monitoring purposes.
The back-end database (step 6, Figure 7) stores both (collected) input data and output data (i.e., results of the analytical function). It consists of a Cassandra database configured as a cluster of (experimentally) 3 nodes (for replication), where each node holds both data related to variables and output data. The data is kept in separate tables for the different variables and analytics functions, and named in a way that avoids clashing between applications. Hereby, it allows to seamlessly scale up, adding additional nodes, as the stress on the data persistence increases with increasing amount of supported client applications, the number of variables, and/or the number of end users. Cassandra [52] is the distributed database management system of choice for fast data ingestion because of its high availability, reliability and performance traits for storing high volumes of data. Besides it also offers a good integration with big data processing frameworks like Apache Spark, as we discuss next.
4.4. Metrics Computation
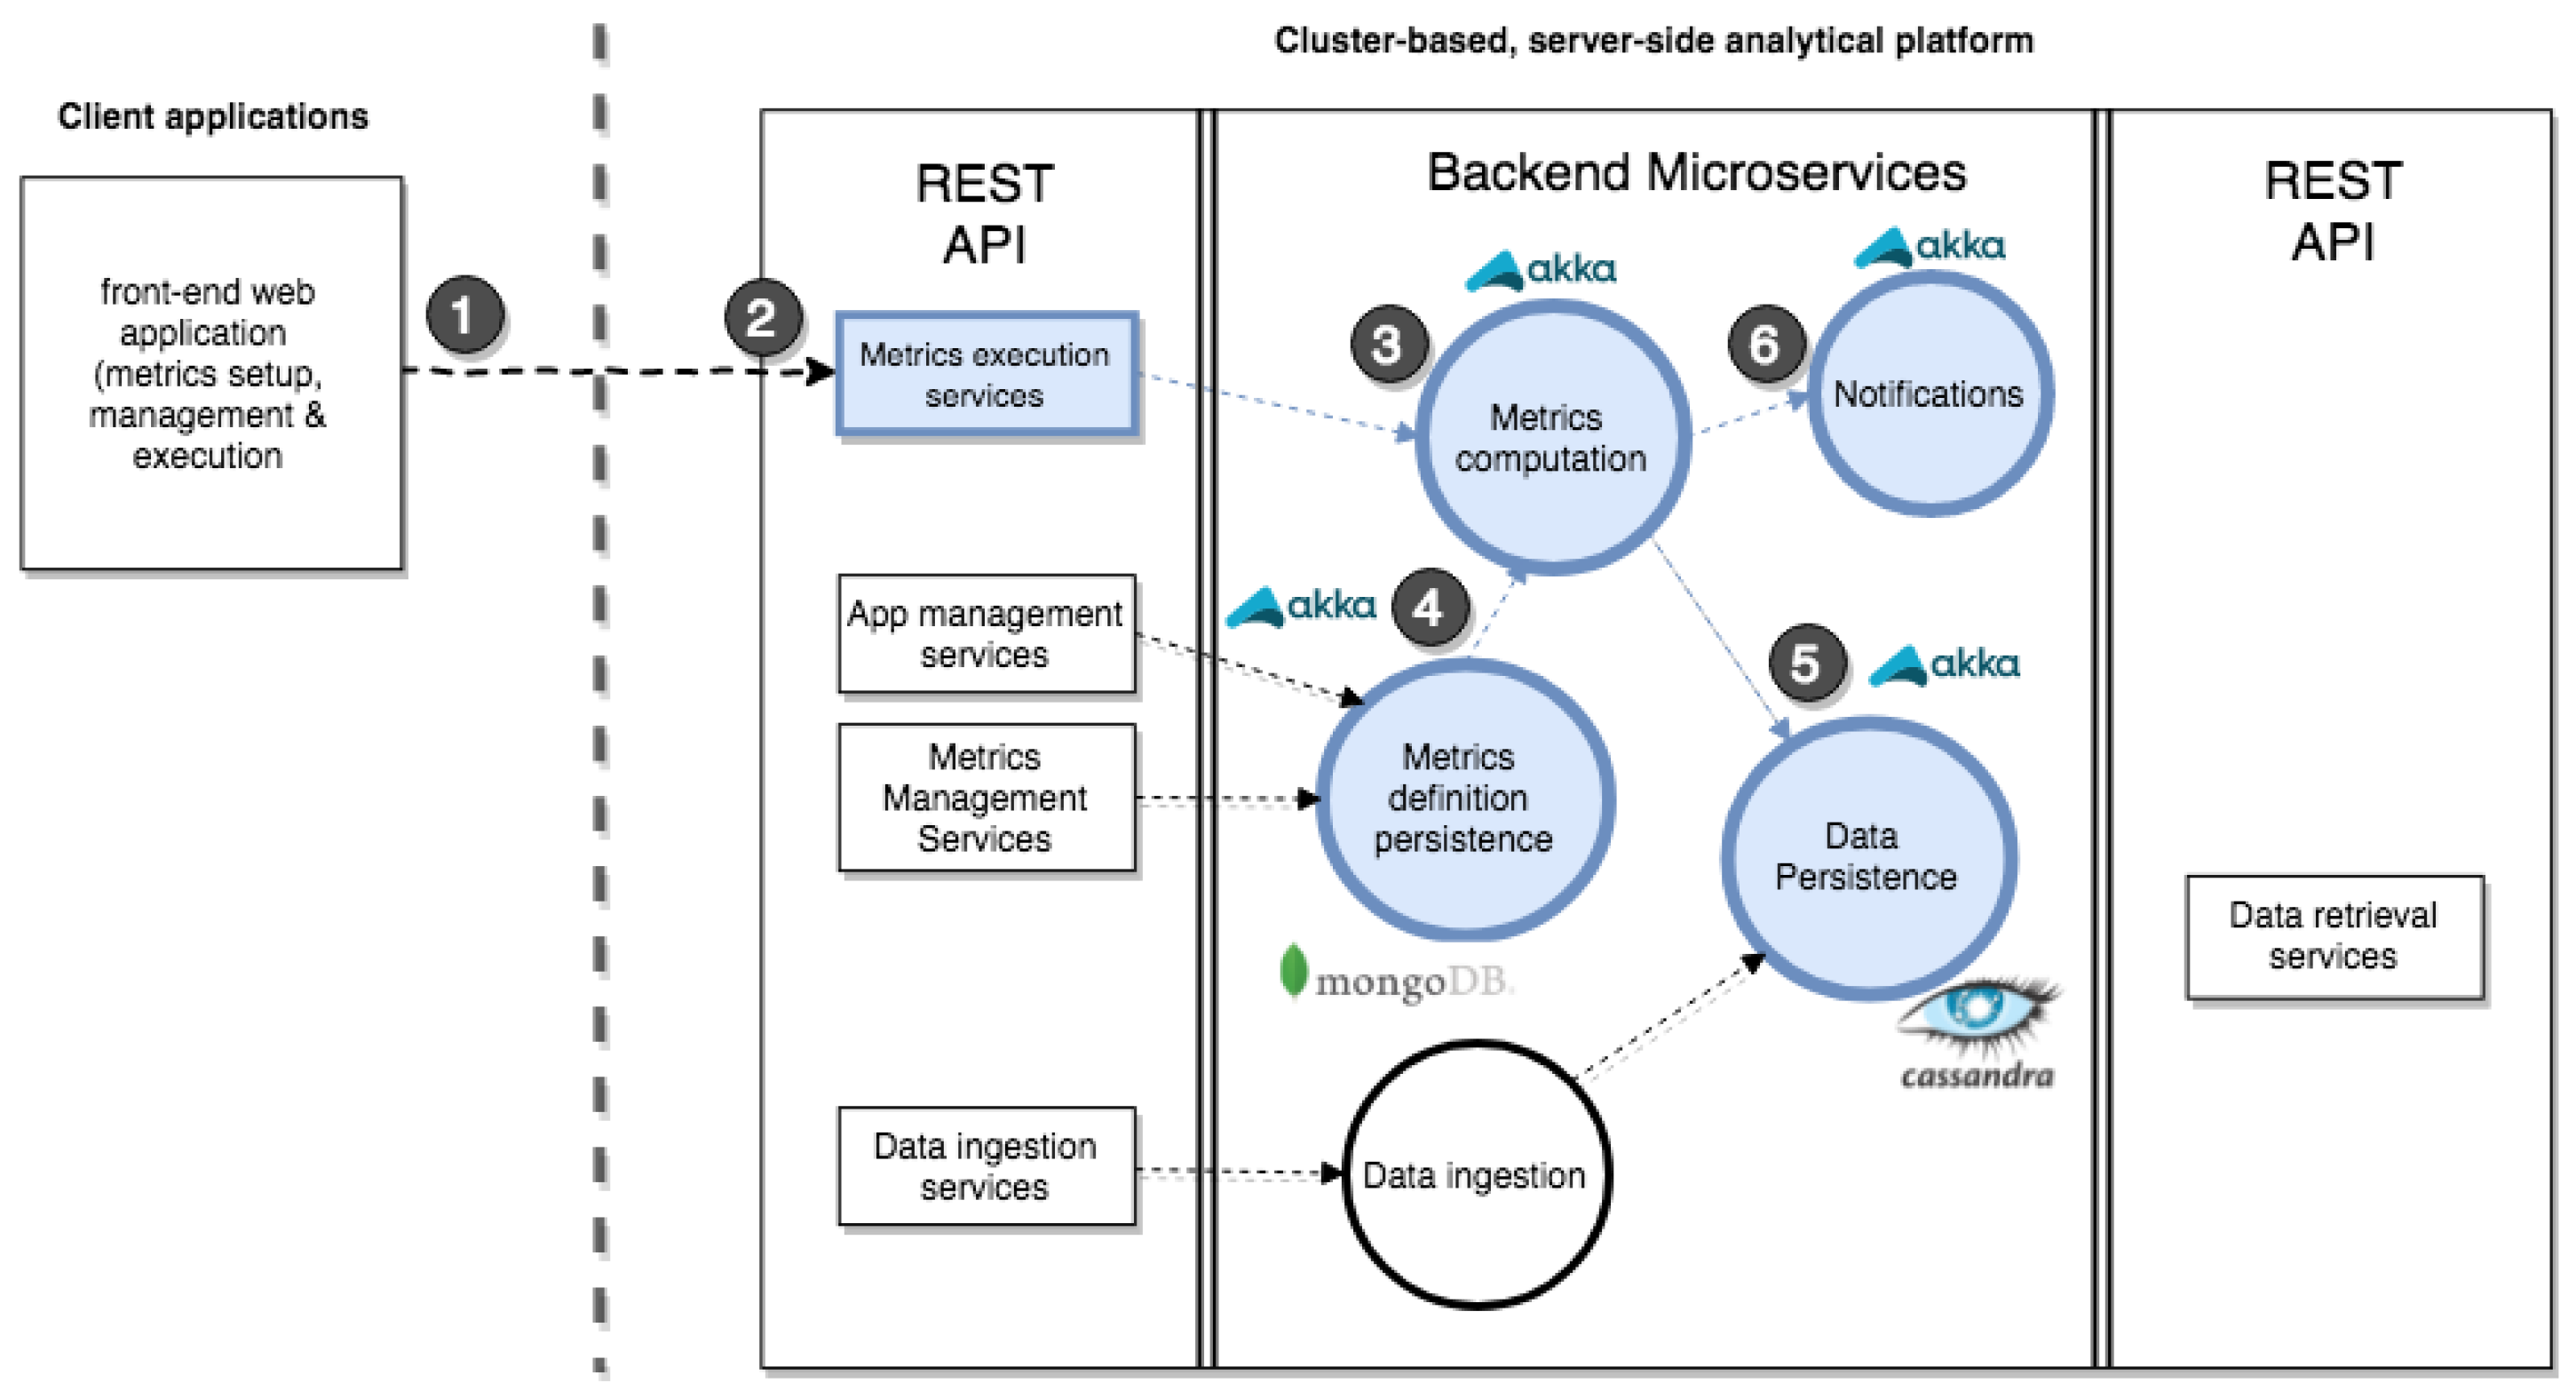
The metrics computation phase comprises a set microservices that work collaboratively. Figure 8 highlights the main microservices involved in this phase, for comparison with previous figures; Figure 9 shows the configuration of the metrics computation phase in more detail, whereby numbered elements correspond in both figures.
The scheduler is responsible for triggering metrics executions. It can be set programmatically through the Metrics execution services (step 2, Figure 9), or can also be called from the one-stop front end management application. The scheduler supports event-based and on demand scheduling. Event-based scheduling triggers metrics execution based on the occurrence of an event, e.g., arrival of (new) data in the database. In practical terms, a metrics execution is not performed every time an event occurs, but a minimum (configurable) time is set between executions to avoid degraded execution performance as a result of a sudden peak of events occurring simultaneously. On-demand scheduling allows to immediately execute a metrics based on a manual request. This way, client applications can force a metrics calculation, independent of event-based scheduling.
The dispatcher is a router aimed to send metrics execution tasks, as scheduled by the scheduler, to (a set of) evaluator(s). The dispatcher performs message buffering and load balancing tasks, selecting and‘dispatching evaluators to perform evaluation tasks based on the current load and statistical (historical) performance information.
The evaluator(s), the central element of the metrics computation box in Figure 9, is determinant to coordinate and carry out the execution of metrics according to the metrics model introduced in Section 3. It is implemented as a set of components (actors), which work together and are duplicable to allow distributed execution. The evaluator handles incoming metrics execution requests from the dispatcher. First, Metrics Conversion takes place: the relevant metrics definition specification are retrieved from persistent storage (or from cache, for efficiency), reflected in the step 4 in Figure 9, and the declarative metrics specifications are converted in executable (JavaScript) code. This is a partial conversion, because the metrics descriptions already contain executable code representing the analytics function and/or action function. Next, the Dependency Analyser takes the JavaScript code and analyses dependencies to generate a directed dependency graph, in which functions and datasets are nodes, and an edge represents a dependency between a function node and dataset node or between two function nodes (e.g., when a custom function composes or calls another custom function). This dependency information is useful, for example, in case of a variable-driven execution (e.g., executing all the functions depending on the variable movement). Prior to the metrics execution, the execution planner transforms the dependency graph into an execution plan, and runs it (using EclairJs (https://github.com/EclairJS/eclairjs) on the Spark platform).
Finally, once the results of metrics execution (more accurately: execution of analytics functions) are in place, two actions are carried out with the results. First, results are persisted by the data persistence (step 5, Figure 9): the result handler is devoted to insert data into or retrieve data from the corresponding back-end database. This handler abstracts from the concrete database implementation to prepare data manipulation statements (e.g., inserts, etc.), which are executed by specialised components (actors), allowing abstraction of a specific database parlance and distributed/redundant persistence.
Second, results are also passed to the rules engine execution component to check whether an action needs to be executed. Actions are specified as if-then rules (in the metrics definition specifications), based on the results of analytics functions execution. In case one or more rules trigger, the associated action(s) is executed by the Action Handler, and the notification handler is notified to carry out notification task(s) (step 6, Figure 9) based on the chosen notification configuration (see Section 3.3).
All aforementioned components are actor-based model microservices, implemented as Akka actors, and built upon Apache Spark to exploit its Resilient Distributed Dataset (RDD) model and inherent processing capabilities [53].
4.5. Metrics Output Visualisation
Visual analytics tools are key to support decision making processes [54]. The same is true for metrics evaluation. In the conceptual architecture of the analytics platform (Figure 1, data visualisation and reporting tools are situated in the end of the analytical pipeline, taking metrics outputs as input to potentially carry out in-depth analysis. These visualisation tools gain access to metrics outputs through the data retrieval services briefly introduced in Section 4.2. In this case, these RESTful services access the clustered database, which implies that both input and output data are available to this type of client applications.
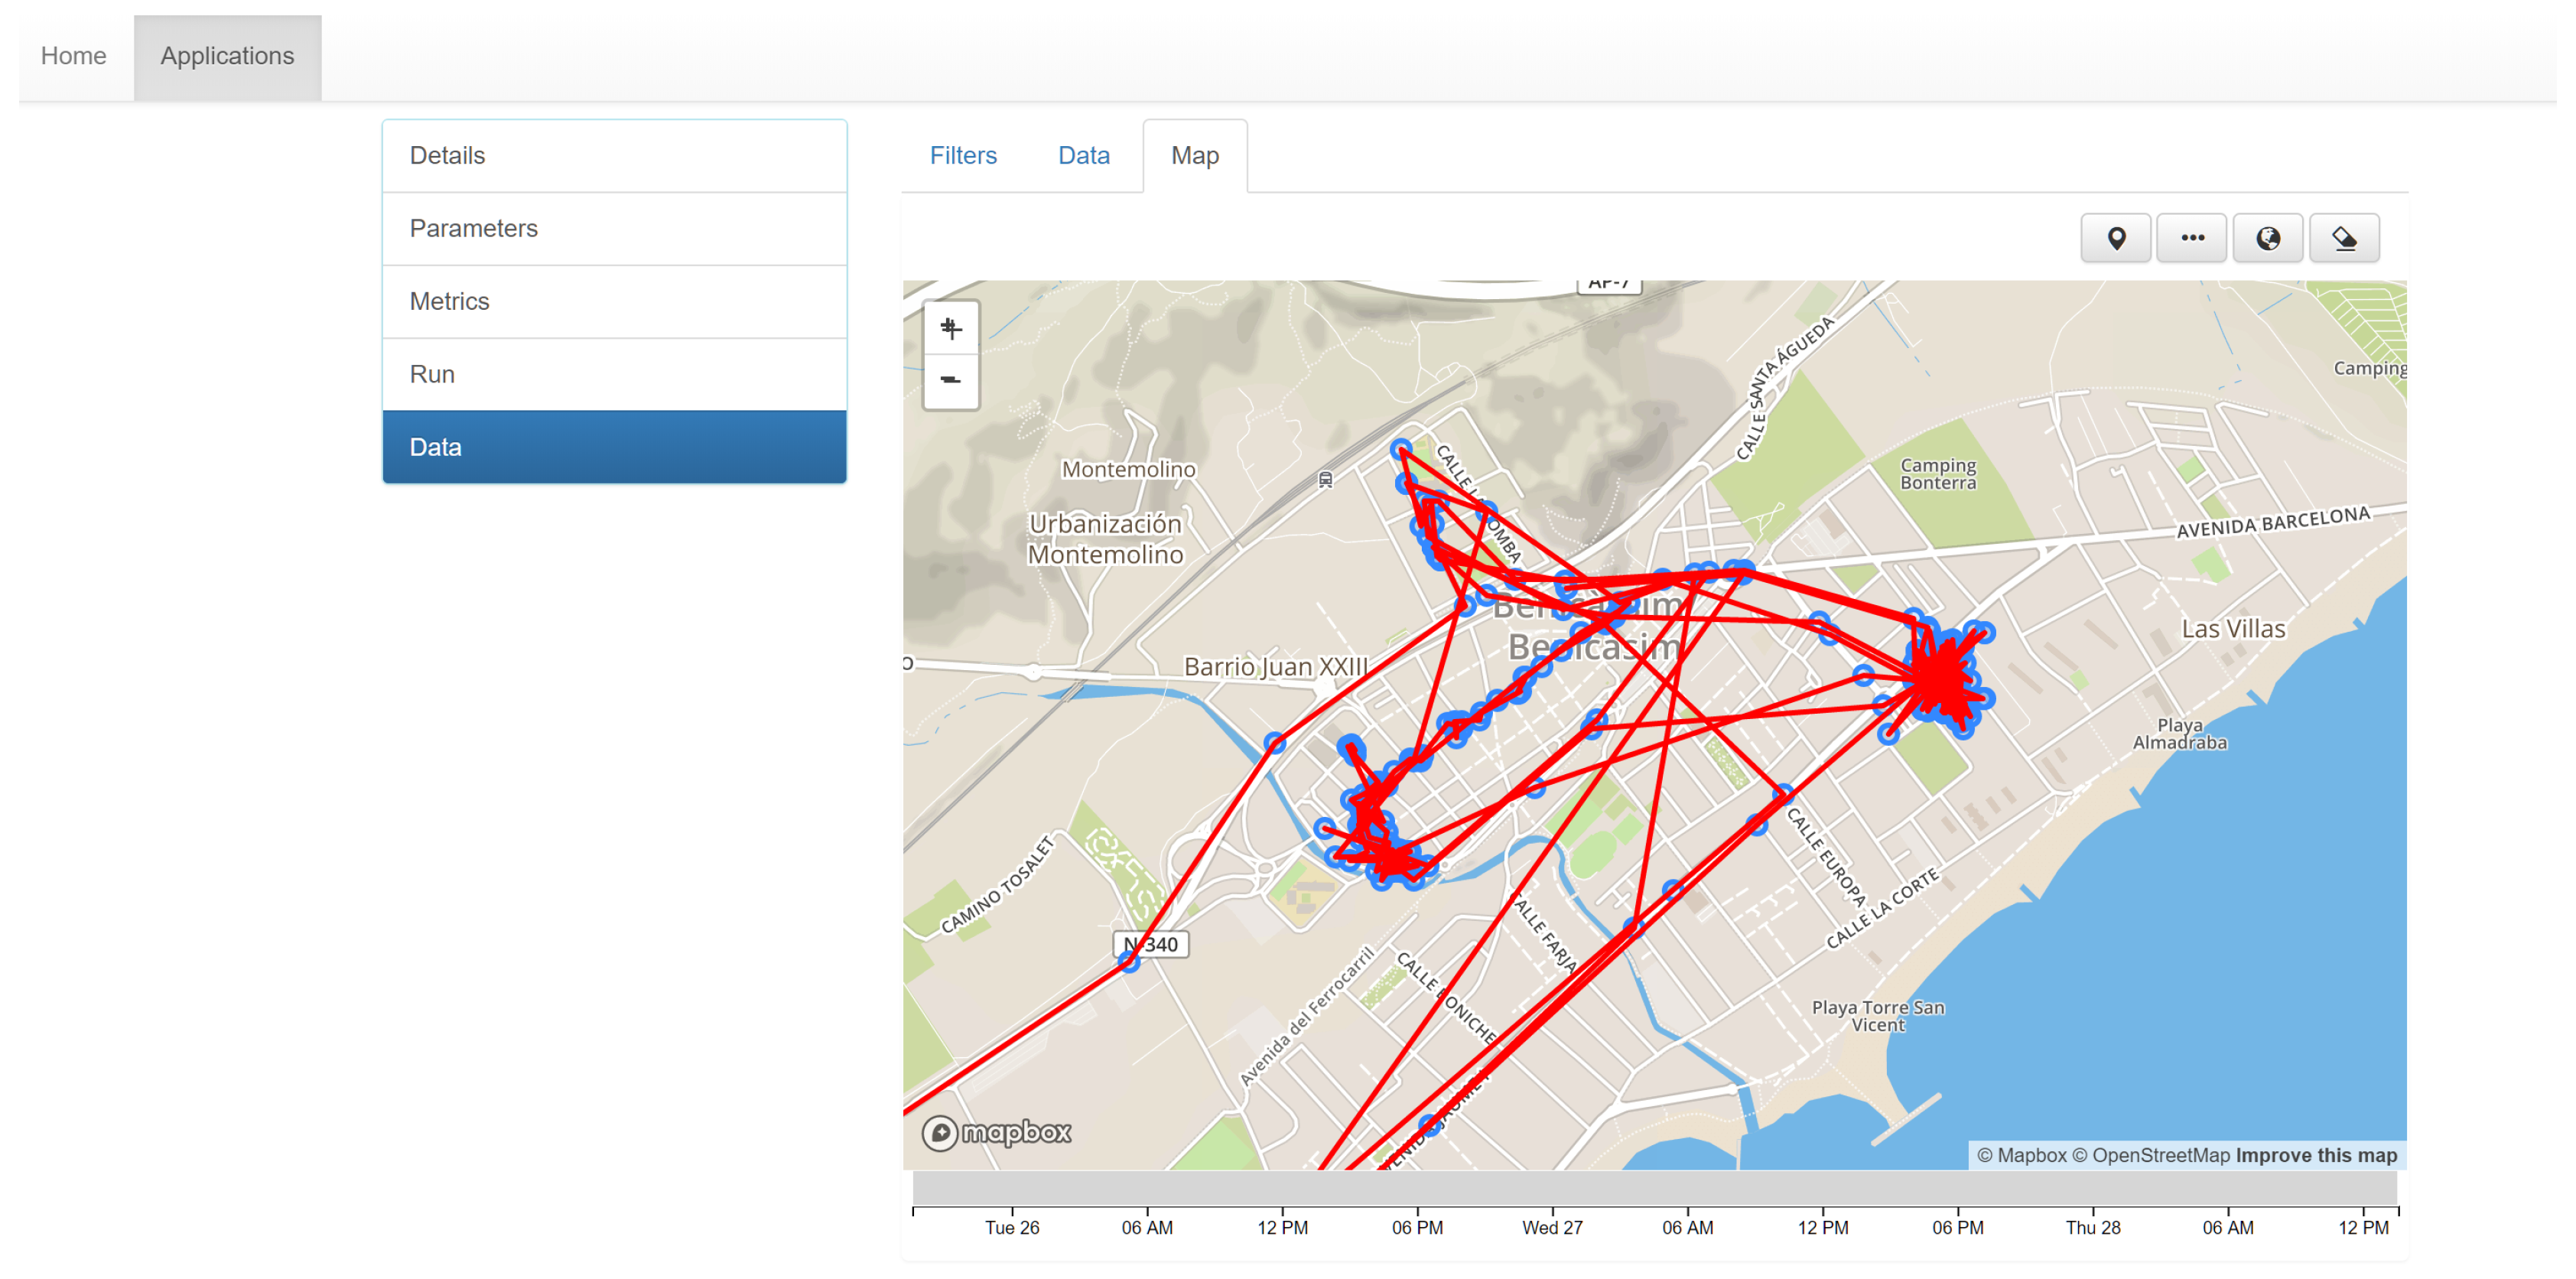
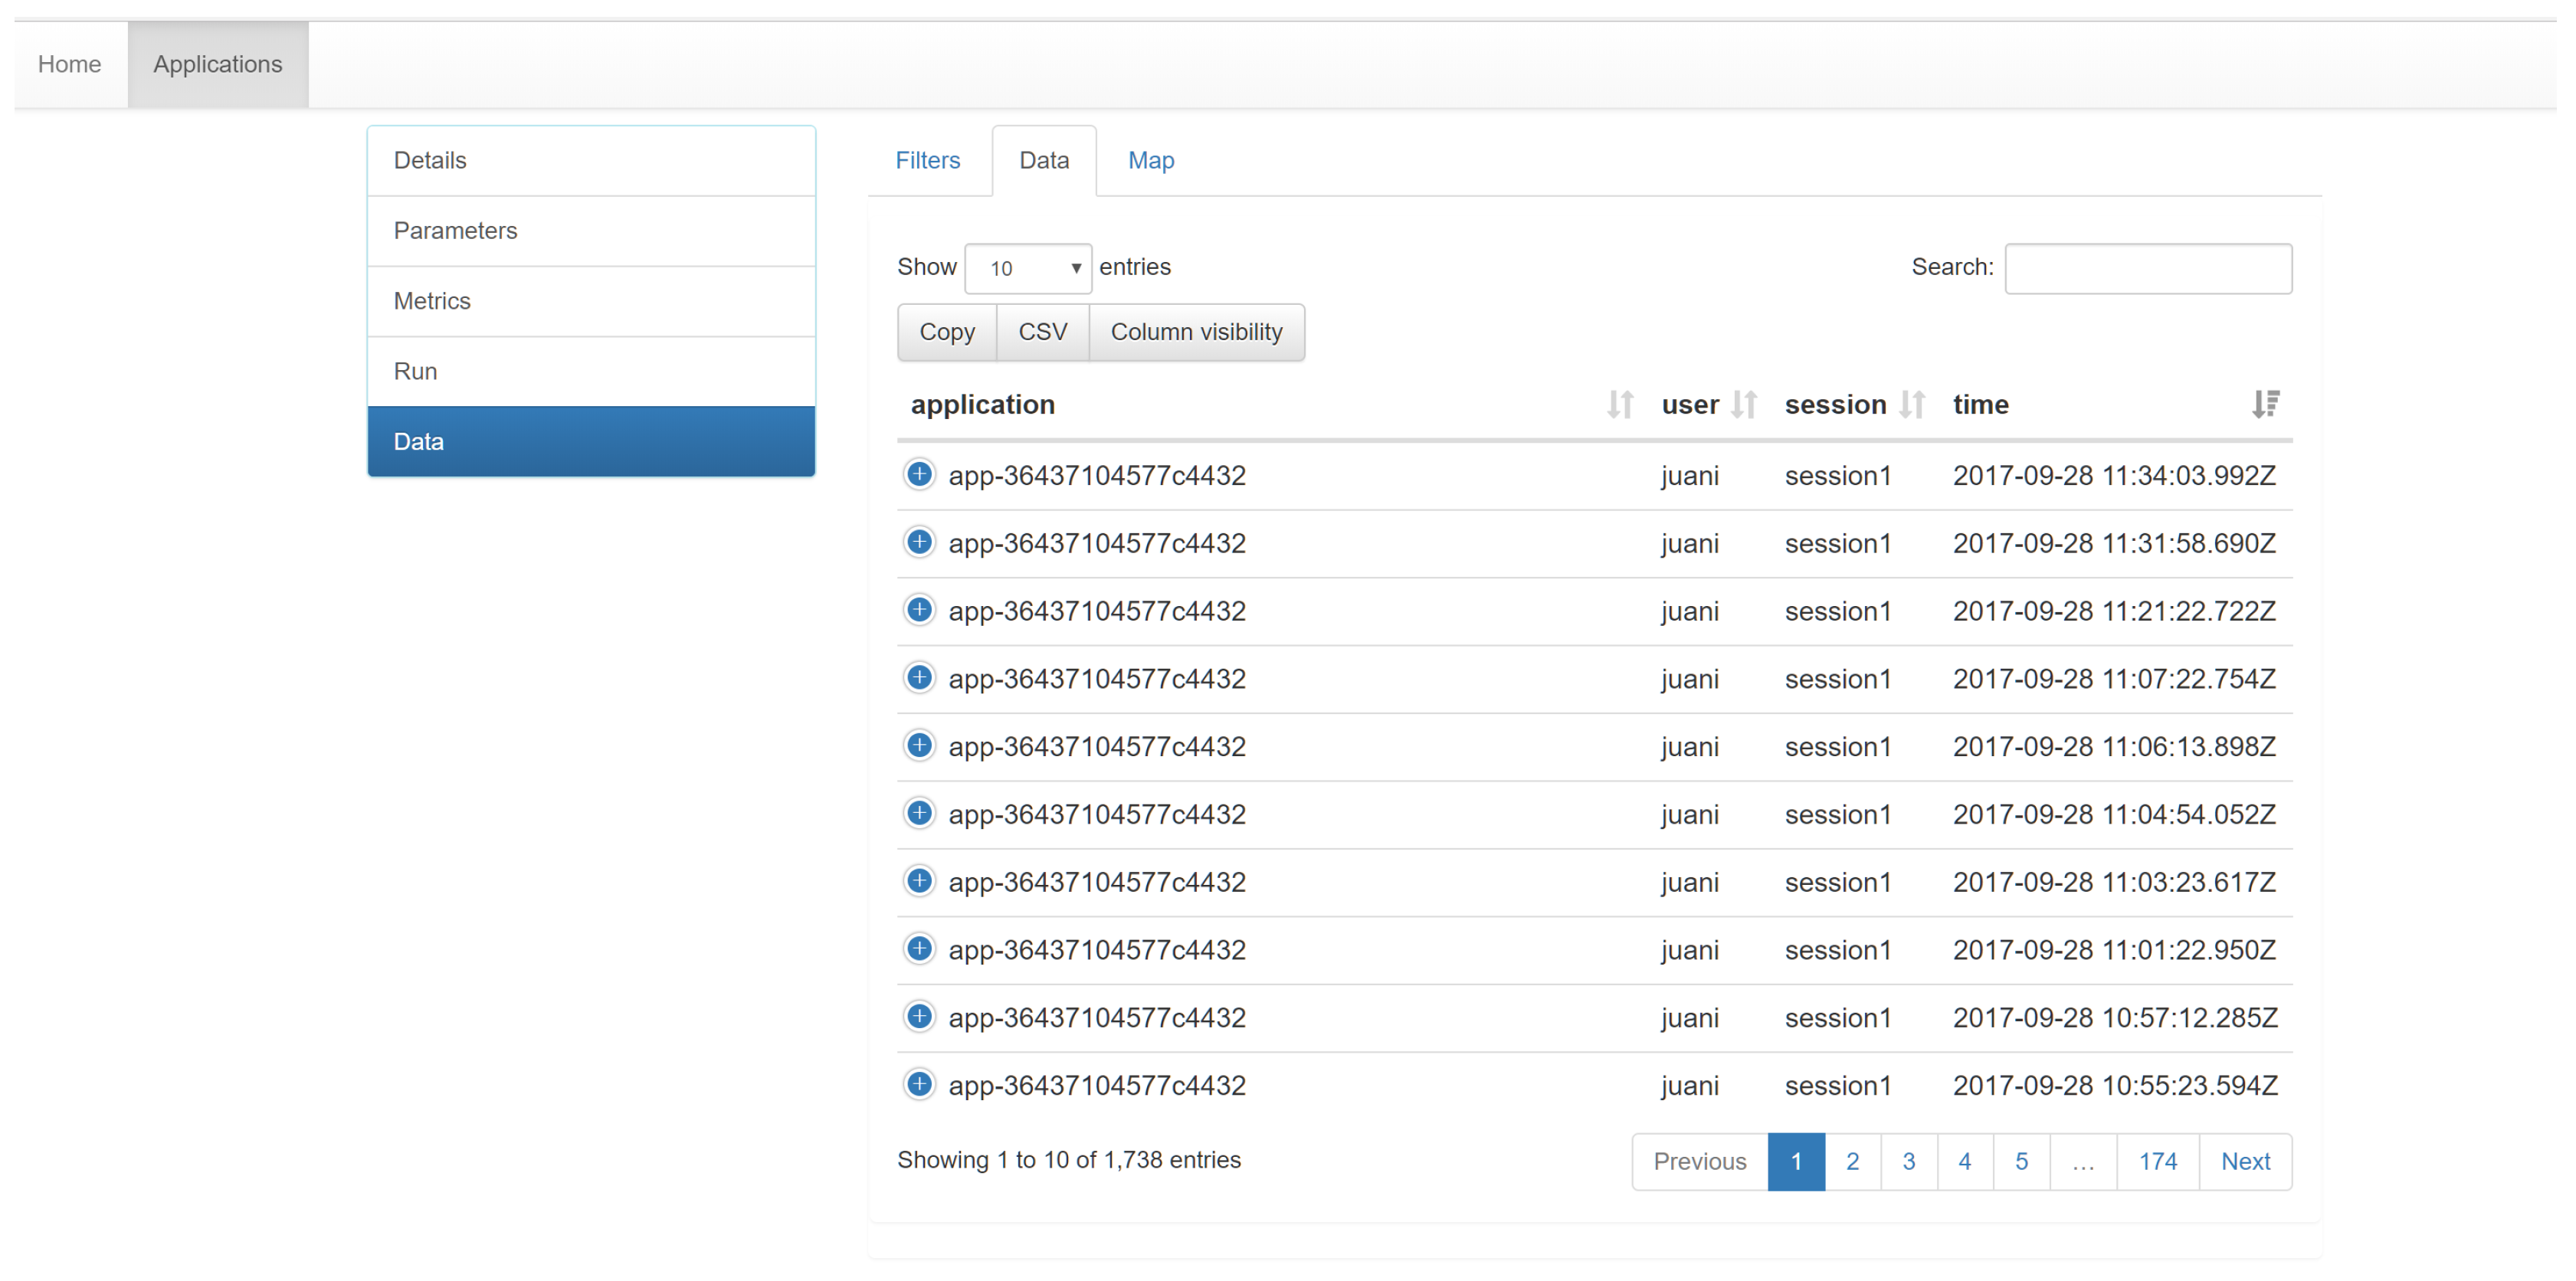
Rather than building sophisticated visual analytical tools, the focus has been in putting data accessible and easily reachable through public end points, so developers can download data and create custom visualisation with their preferred environments and tools. Notwithstanding, we still developed a default, generic visualisation tool. The tool supports both map-based (Figure 10) and tabular-based visualisations (Figure 11) of collected data and metrics outputs, permitting the download of data in various open formats (CSV, JSON, GeoJSON).
5. Applications and Discussion
5.1. Situating the Analytics Platform in Literature
In this section, we compare the innovative aspects of the proposed metrics model and the analytics platform with related literature. Indeed, context modelling and representation have been an extensively researched topic. For example, Kaenampornpan et al. [55] established conceptual key elements that have an influence on a user’s activities in a ubiquitous computing world. The focus is on modelling user’s activity into the context. This is also a defining characteristic of the proposed model, as the model is particularly designed to capture spatio-temporal features of contextual data, which are relevant in location-aware applications, activity theories and ubiquitous computing. Bolchini et al. [56] analysed 16 context models in relation to supported characteristics for context representation and formalisation. The focus of this review of approaches for context modelling and representation is indeed heavily biased towards semantic formalism and schema, much in line with the active research lines at that moment.
A more recent survey is the work of Alegre et al. [33], who extensively reviewed methodologies and techniques for developing context-aware systems. The authors proposed a two-axis classification based on the modalities of interaction with context-aware systems: active/passive vs. execution/configuration. Next, we take the active/passive configuration axis for delimiting the scope of the proposed conceptual model, while below we situate the analytical platform regarding to the active/passive execution axis. In an active configuration interaction, a system “is able to learn from the user preferences in order to autonomously evolve his rules for future behavior” ([33], p. 58). In the passive configuration, a user “is involved in the manual personalization of his/her preferences, likes, and expectations of the system” ([33], p. 58). The proposed model falls into the passive configuration type, which allows developers to interact with the context-aware system (see for example Section 4.1) to manually set up any aspect of the model, from the variables and dimensions to custom analytical functions and actions. Obviously, the configuration effort required is drastically reduced since a developer can reuse a wide range of default dimensions, analytical functions and actions already implemented and integrated in the analytics platform. Rather than being a pure passive configuration, the proposed conceptual model indeed defines a guided passive configuration interaction with the system, as the developer is supported in the configuration process by the platform’s built-in functionality (e.g., use of default dimensions, see Section 3.1).
According to the active/passive execution axis, active execution means that “the system acts autonomously depending on the context”, while in passive execution users “specify how the application should change in a specific situation” ([33], p. 58). The analytics platform belongs to the passive execution type, since developers (users) specify the analytics functions and actions that best fit the aspect that is being monitored and, therefore, the platform will take the actions that the developer want. As said above, between the two edges—active and passive—there is a wide range of possibilities. The proposed analytics platform tends to be a passive execution in terms of interactive levels but incorporates many active elements such as methods for automated data collection pertinent to default dimensions, see Section 4.2. In this way, no special developer knowledge is needed to manage and collect data associated with the defaults dimensions, as the analytics platform smoothly manage them. On the other hand, the passive nature of the platform provides other benefits, since developers understand better how the platform works, as they specify their own analytical functions, and, therefore, the confidence towards the platform also increases.
5.2. Cross-Domain Applications and Experimental Use Cases
The analytics platform is useful in application domains that exhibit some type of (real-time) context-aware behaviour. Although we focused in this article mainly on the implementation of the spatio-temporal features of the platform, it can be used for non-contextual features (i.e., tracking and acting upon repeated user actions or internal state changes) as well as contextual features (e.g., contextualizing a user in relation to other users; location-based features and interactions; user-related features such as heart rate, blood pressure; environment-related features, e.g., based on interaction with smart environment-embedded devices, etc.). In all these cases, the application developer only needs to set up the metrics by specifying the different components of the metrics model (Section 3): the data model composed of variables and dimensions, the analytics function(s), and action(s). Once set up, the data associated with the default dimensions of variables are automatically captured. For custom dimensions, the developers need to codify the required real-time captured data in order to be seamlessly integrated into the analytics platform and benefit from the built-in functionality of the platform, such as metrics computation, notifications, and data visualisation.
We currently have two running use cases: one in the area of location-aware games, and one in the area of psychological health (which is currently being deployed). The former is aimed at improving physical activity, and is context-aware in the sense that it tracks and uses the user’s location in combination with a city’s built environment (e.g, greenery, buildings, roads, etc.), to suggest the best places to work out. In this case, the role of the metrics model and the analytical platform is to track the user’s location and provide notifications upon entering what we consider beneficial environments (e.g., parks, open spaces, sports facilities) for exercises (details can be found in Miralles et al. [57]). Furthermore, custom metrics are defined to capture activity performance (e.g., using the phone’s accelerometer to measure speed of running).
The second use case, developed in cooperation with psychologists, consists of a Web and mobile application to improve therapy of patients suffering from agoraphobia. The experiment included tracking the patient’s movements in order to extract relevant data regarding his behavior in a period of 10 days. For this, a mobile application continuously track the patient’s position, sending data about its location in configurable intervals, initially of 5 min. Initially, the therapist configured the application with the patient’s home location in a map, including a threshold radius used to determine when the patient is at home. Subsequently, the patient was asked to indicate in the mobile application when he was at home, at which moment a set of reference WIFI fingerprints were collected (i.e., measures of the “visible” WIFI endpoints and their signal strength). During the tracking process, the data collected thus included the GPS coordinates, the experiment identifier, and a value called “coincidence” containing the result of evaluating a distance function that defined the level of similarity between the WIFI fingerprint gathered in real time and the reference WIFI fingerprints. We use this coincidence value for hinting the metrics function when the patient is at home or outside.
The metrics function evaluated the locations over a period of 10 days to determine valuable information about the patient’s behavior for the therapists. The therapists were interested in the patients’ behaviour at three different time frames, from 00:00 to 8:00, from 8:00 to 14:00 and from 14:00 to 00:00. Using these time frames, the data of interest included: number of times entering and leaving home, the time spent both inside and outside home, the maximum consecutive time spent by the patient both inside and outside its home, and the total distance walked by the patient while outside. In order to calculate the required values, two variables were defined: userConfig, containing the initial user and experiment configuration and userLocation, containing the location default dimension and the coincidence. The custom analytic function that calculates the required output values can be summarized, in natural language, in the following steps:
- Dividing the collected data in the specified time frames (e.g., from 8:00 to 14:00, etc.).
- For each time frame, process the sequence of patient’s locations to determine:
- 2.1.
- Whether the patient was inside or outside its home.
- 2.2.
- The output values, i.e., the information of interest for therapists (time inside/outside, distance walked, etc.). The number of times the patient enters and leave home is determined by counting the patient’s location changes from “outside” to “inside” and vice versa.
5.3. Current Issues, Weaknesses and Limitations
Next, we briefly overview current issues, weaknesses and limitations of the current implementation.
- Technology integration problems. The open source big data architecture technologies we used to implement the analytics platform (i.e., Akka, Kafka, Spark, Cassandra, Docker) are at the forefront of technological developments in the field and, therefore, constantly evolve, which imposes many integration challenges. Most of the problems are related to stability issues with publicly available Kafka images in our environment. Issues found in retrieving data as JSON in Cassandra due to an old JSON handling library (a fix was provided by the Cassandra maintainers, and we needed to update the libraries in our docker images). Besides, several compatibility issues arose during the implementation, as shared libraries between the different technologies (i.e., Spark client library and EclairJS library were not in the same version).
- Spark execution in local versus cluster mode. The analytical platform was developed with Spark deployed and running in local mode. Indeed, the Spark local mode is intended for testing and demonstration purposes, and its programming model admits that programs executed in local mode are able to seamlessly run in a cluster environment. However, given the complex technology stack we used, the configuration and setting up of the cluster mode was tedious, and we did experience difficulties switching from local to cluster mode. We are currently experimenting with and optimizing our cluster-based deployment.
- Data specification (schema) evolution. At this point we are not providing support for schema evolution. This means that once the variables with its dimensions are set and the supporting structures in the database are created, introducing modifications in such structure is currently not possible. Schema evolution is a complex matter by its own right; and having several running instances of metrics models depending on dynamic variations of variables and dimension further complicates things.
- Debugging. The execution of metrics is yet hard to debug. On one hand, the only support for debugging are the centralized logs of the platform, which can be accessed through the web-based visualisation tool (Section 4.5) during metrics trials. Therefore, developers can run on-demand, user defined metrics to test their functionality and check logs in case of failure. On the other hand, the development process of the platform’s code has been thoroughly debugged using a collection of test suits, which are not accessible for developers.
- Data-driven metrics execution. As mentioned in Section 4.4, the execution of analytical functions can be driven by data changes, in which case evaluators only need to execute such funCtions depending on (one or more) changes in data. This feature is foreseen in the implementation, but yet under development.
- Further code optimization. Although we are currently measuring performance of the different phases of the execution (data specification interpretation, metrics execution and actions execution), we are currently not storing data related to these measurements, which prevents us from pinpointing bottlenecks and further code optimisation. An implementation for persisting performance data in the analytical platform, and make them available to users through conveneite RESTful services is also in our plans.
6. Conclusions and Future Directions
In this article we presented an analytics platform that supports application developers to define data requirements, collect the required (client-generated) data, and define and execute metrics that capture relevant non-spatial, spatial and temporal aspects of the monitored phenomenon. The main features of the platform are the fact that it is not application domain specific, it is capable of handling spatial and non-spatial data, its cloud-based, distributed architecture specifically designed to handle large amounts of (streaming) data, perform analysis over the collected data, and realise real-time actions and notifications, and its use of open metrics specifications, which allow re-use and replication. In addition, we also discussed the platform’s usefulness—due to its genericity—across application domains, and shortly detailed two use cases we have developed on top of the platform, namely in location-based gaming for incentivising physical activity and psychological health.
The main takeaways of the analytics platform for computing spatio-temporal metrics are summarised as follows:
- The platform handles an extended metrics model for defining and computing spatio-temporal data, analytics functions and actions.
- The platform aims at supporting data intensive applications that require computations of spatio-temporal metrics by offering data handling, storage, analysis, interpretation and notification, as a service.
- The platform addresses the challenge of tapping into the growing amounts of contextual information streams, to provide meaningful contextual information at application level.
- The platform applies a big data oriented architecture, uses recommended programming styles (e.g., actor-based programming, publish/subscribe and reactive programming) and extensively uses big data technologies (Kafka, Akka, Spark, Cassandra).
While several smaller, technological improvements to the platform are foreseen (see Section 5), we foresee to continue the development of the analytics platform in two main lines. One is to truly support stream processing [58]. While data streams are partially covered during the data ingestion process, stream processing is a current limitation of the proposed analytics platform during the metrics computation phase. The other line is related to performance analytics tools. As mentioned in Section 5, data regarding the platform’s performance should be more rigorously collected. Performance data can be shown in visual real-time dashboards to give an overview of the system resource usage such as per-application usage and per-user usage, so that administrators can detect critical performance bottlenecks and possibly update the platform’s configuration to mitigate them such as adding nodes to the cluster.
Author Contributions
Conceptualization, L.E.R.-P., S.C. and C.G.; methodology, L.E.R.-P., S.C. and C.G.; software, L.E.R.-P.; validation, L.E.R.-P; investigation, L.E.R.-P., S.C. and C.G.; writing—original draft preparation, L.E.R.-P., S.C. and C.G.; writing—review and editing, L.E.R.-P., S.C. and C.G.; supervision, S.C. and C.G.
Funding
Sven Casteleyn and Carlos Granell are funded by the Ramón y Cajal Programme of the Spanish government (grant numbers RYC-2014-16606 and RYC-2014-16913, respectively).
Conflicts of Interest
The authors declare no conflict of interest.
Abbreviations
The following abbreviations are used in this manuscript:
| API | Application Programming Interface |
| CSV | Comma separated value |
| GeoJSON | Geo related schema and types for using in JSON |
| GPS | Global Positioning System |
| HTTP | Hypertext Transfer Protocol |
| JSON | JavaScript Object Notation |
| POST | Request method belonging to HTTP protocol |
| NoSQL | Non relational data bases |
| RDD | Resilient Distributed Dataset |
| REST | Representational State Transfer |
| SDK | Software Development Kit |
| WIFI | A trademarked term meaning IEEE 802.11x. |
References
- Chen, G.; Kotz, D. A Survey of Context-Aware Mobile Computing Research; Technical Report, Technical Report TR2000-381, Dept. of Computer Science; Dartmouth College: Hanover, NH, USA, 2000. [Google Scholar]
- Bellavista, P.; Corradi, A.; Fanelli, M.; Foschini, L. A survey of context data distribution for mobile ubiquitous systems. ACM Comput. Surv. 2012, 44, 1–45. [Google Scholar] [CrossRef]
- Pejovic, V.; Musolesi, M. Anticipatory mobile computing: A survey of the state of the art and research challenges. ACM Comput. Surv. 2015, 47, 1–29. [Google Scholar] [CrossRef]
- Rana, R.; Hume, M.; Reilly, J.; Jurdak, R.; Soar, J. Opportunistic and context-aware affect sensing on smartphones. IEEE Pervasive Comput. 2016, 15, 60–69. [Google Scholar] [CrossRef]
- Hoseini-Tabatabaei, S.A.; Gluhak, A.; Tafazolli, R. A survey on smartphone-based systems for opportunistic user context recognition. ACM Comput. Surv. 2013, 45, 1–51. [Google Scholar] [CrossRef] [Green Version]
- Varghese, B.; Buyya, R. Next generation cloud computing: New trends and research directions. Future Gener. Comput. Syst. 2018, 79, 849–861. [Google Scholar] [CrossRef] [Green Version]
- Bainomugisha, E.; Carreton, A.L.; van Cutsem, T.; Mostinckx, S.; de Meuter, W. A survey on reactive programming. ACM Comput. Surv. 2013, 45, 1–34. [Google Scholar] [CrossRef] [Green Version]
- Wan, J.; Zhang, D.; Zhao, S.; Yang, L.; Lloret, J. Context-aware vehicular cyber-physical systems with cloud support: Architecture, challenges, and solutions. IEEE Commun. Mag. 2014, 52, 106–113. [Google Scholar] [CrossRef]
- Solanas, A.; Patsakis, C.; Conti, M.; Vlachos, I.S.; Ramos, V.; Falcone, F.; Postolache, O.; Pérez-Martínez, P.A.; Di Pietro, R.; Perrea, D.N.; et al. Smart health: A context-aware health paradigm within smart cities. IEEE Commun. Mag. 2014, 52, 74–81. [Google Scholar] [CrossRef]
- Chang, J.; Yao, W.; Li, X. A context-aware s-Health Service System for Drivers. Sensors 2017, 17, 609. [Google Scholar] [CrossRef]
- Meehan, K.; Lunney, T.; Curran, K.; McCaughey, A. Context-aware intelligent recommendation system for tourism? In Proceedings of the 2013 IEEE International Conference on Pervasive Computing and Communications Workshops (PERCOM Workshops), San Diego, CA, USA, 18–22 March 2013; pp. 328–331. [Google Scholar]
- García, O.; Alonso, R.; Prieto, J.; Corchado, J. Energy Efficiency in Public Buildings through Context-Aware Social Computing. Sensors 2017, 17, 826. [Google Scholar] [CrossRef]
- Sagl, G.; Resch, B.; Blaschke, T. Contextual sensing: Integrating contextual information with human and technical geo-sensor information for smart cities. Sensors 2015, 15, 17013–17035. [Google Scholar] [CrossRef] [PubMed]
- Alirezaie, M.; Renoux, J.; Köckemann, U.; Kristoffersson, A.; Karlsson, L.; Blomqvist, E.; Tsiftes, N.; Voigt, T.; Loutfi, A. An ontology-based context-aware system for smart homes: E-care@ home. Sensors 2017, 17, 1586. [Google Scholar] [CrossRef] [PubMed]
- Andone, I.; Blaszkiewicz, K.; Böhmer, M.; Markowetz, A. Impact of location-based games on phone usage and movement: A case study on Pokémon GO. In Proceedings of the 19th International Conference on Human-Computer Interaction with Mobile Devices and Services, Vienna, Austria, 4–7 September 2017; p. 102. [Google Scholar]
- Karimi, H.A. Big Data: Techniques and Technologies in Geoinformatics; CRC Press: Boca Raton, FL, USA, 2017. [Google Scholar]
- De Smith, M.J.; Goodchild, M.F.; Longley, P. Geospatial Analysis: A Comprehensive Guide to Principles, Techniques and Software Tools, 6th ed.; The Winchelsea Press: Leicester, UK, 2018. [Google Scholar]
- Worboys, M.F.; Duckham, M. GIS: A Computing Perspective, 3rd ed.; CRC Press: Boca Raton, FL, USA, 2019. [Google Scholar]
- Granell, C.; Díaz, L.; Gould, M. Service-oriented applications for environmental models: Reusable geospatial services. Environ. Model. Softw. 2010, 25, 182–198. [Google Scholar] [CrossRef]
- Granell, C. Robust workflow systems + flexible geoprocessing services = Geo-enabled model web. In Geographical Information Systems: Trends and Technologies; CRC Press: Boca Raton, FL, USA, 2014; pp. 172–204. [Google Scholar]
- Yue, S.; Chen, M.; Wen, Y.; Lu, G. Service-oriented model-encapsulation strategy for sharing and integrating heterogeneous geo-analysis models in an open web environment. ISPRS J. Photogramm. Remote Sens. 2016, 114, 258–273. [Google Scholar] [CrossRef]
- Zhou, Y.; Zhang, Y.; Ge, Y.; Xue, Z.; Fu, Y.; Guo, D.; Shao, J.; Zhu, T.; Wang, X.; Li, J. An efficient data processing framework for mining the massive trajectory of moving objects. Comput. Environ. Urban Syst. 2017, 61, 129–140. [Google Scholar] [CrossRef]
- Guo, D.; Zhu, Y.; Yin, W. OSCAR: A framework to integrate spatial computing ability and data aggregation for emergency management of public health. GeoInformatica 2018, 22, 383–410. [Google Scholar] [CrossRef]
- Zhao, P.; Foerster, T.; Yue, P. The geoprocessing web. Comput. Geosci. 2012, 47, 3–12. [Google Scholar] [CrossRef]
- Hofer, B.; Granell, C.; Bernard, L. Innovation in geoprocessing for a Digital Earth. Int. J. Digit. Earth 2018, 11, 3–6. [Google Scholar] [CrossRef]
- Batty, M. Big data and the city. Built Environ. 2016, 42, 321–337. [Google Scholar] [CrossRef]
- Jiang, B. Geospatial analysis requires a different way of thinking: The problem of spatial heterogeneity. GeoJournal 2015, 80, 1–13. [Google Scholar] [CrossRef]
- Miller, H.J.; Goodchild, M.F. Data-driven geography. GeoJournal 2015, 80, 449–461. [Google Scholar] [CrossRef]
- Li, S.; Dragicevic, S.; Castro, F.A.; Sester, M.; Winter, S.; Coltekin, A.; Pettit, C.; Jiang, B.; Haworth, J.; Stein, A.; et al. Geospatial big data handling theory and methods: A review and research challenges. ISPRS J. Photogramm. Remote Sens. 2016, 115, 119–133. [Google Scholar] [CrossRef] [Green Version]
- Galić, Z. Spatio-Temporal Data Streams; Springer: New York, NY, USA, 2016. [Google Scholar]
- Karimi, H.A. Advanced Location-Based Technologies and Services; CRC Press: Boca Raton, FL, USA, 2013. [Google Scholar]
- Rodríguez-Pupo, L.E.; Casteleyn, S.; Granell, C. On metrics for location-aware games. ISPRS Int. J. Geo-Inf. 2017, 6, 299. [Google Scholar] [CrossRef]
- Alegre, U.; Augusto, J.C.; Clark, T. Engineering context-aware systems and applications: A survey. J. Syst. Softw. 2016, 117, 55–83. [Google Scholar] [CrossRef] [Green Version]
- Kulkarni, D.; Tripathi, A. A framework for programming robust context-aware applications. IEEE Trans. Softw. Eng. 2010, 36, 184–197. [Google Scholar] [CrossRef]
- Guo, B.; Zhang, D.; Imai, M. Toward a cooperative programming framework for context-aware applications. Pers. Ubiquitous Comput. 2011, 15, 221–233. [Google Scholar] [CrossRef]
- Forkan, A.; Khalil, I.; Tari, Z. CoCaMAAL: A cloud-oriented context-aware middleware in ambient assisted living. Future Gener. Comput. Syst. 2014, 35, 114–127. [Google Scholar] [CrossRef]
- Zhou, L.; Naixue, X.; Shu, L.; Vasilakos, A.; Yeo, S.S. Context-aware middleware for multimedia services in heterogeneous networks. IEEE Intell. Syst. 2010, 25, 40–47. [Google Scholar] [CrossRef]
- Arnaboldi, V.; Conti, M.; Delmastro, F. CAMEO: A novel context-aware middleware for opportunistic mobile social networks. Pervasive Mob. Comput. 2014, 11, 148–167. [Google Scholar] [CrossRef]
- Chen, C.P.; Zhang, C.Y. Data-intensive applications, challenges, techniques and technologies: A survey on Big Data. Inf. Sci. 2014, 275, 314–347. [Google Scholar] [CrossRef]
- Marz, N.; Warren, J. Big Data: Principles and Best Practices of Scalable Realtime Data Systems; Manning Publications Co.: New York, NY, USA, 2015. [Google Scholar]
- Herold, M.; Couclelis, H.; Clarke, K.C. The role of spatial metrics in the analysis and modeling of urban land use change. Comput. Environ. Urban Syst. 2005, 29, 369–399. [Google Scholar] [CrossRef]
- Sudhira, H.; Ramachandra, T.; Jagadish, K. Urban sprawl: metrics, dynamics and modelling using GIS. Int. J. App. Earth Obs. Geoinf. 2004, 5, 29–39. [Google Scholar] [CrossRef]
- Sedig, K.; Parsons, P.; Haworth, R. Player–Game Interaction and Cognitive Gameplay: A Taxonomic Framework for the Core Mechanic of Videogames. Informatics 2017, 4, 4. [Google Scholar] [CrossRef]
- El-Nasr, M.S.; Drachen, A.; Canossa, A. Game Analytics; Springer: London, UK, 2013. [Google Scholar]
- Nijholt, A. Playable Cities: The City as a Digital Playground; Springer: Singapore, 2017. [Google Scholar]
- Dey, A.K. Understanding and using context. Pers. Ubiquitous Comput. 2001, 5, 4–7. [Google Scholar] [CrossRef]
- Greenberg, S. Context as a dynamic construct. Hum.-Comput. Interact. 2001, 16, 257–268. [Google Scholar] [CrossRef]
- Andrienko, G.; Andrienko, N.; Bak, P.; Keim, D.; Wrobel, S. Visual Analytics of Movement; Springer Science & Business Media: Berlin/Heidelberg, Germany, 2013. [Google Scholar]
- Miller, H.J.; Tolle, K. Big data for healthy cities: Using location-aware technologies, open data and 3D urban models to design healthier built environments. Built Environ. 2016, 42, 441–456. [Google Scholar] [CrossRef]
- Nagpal, V. Android Sensor Programming By Example; Packt Publishing Ltd.: Birmingham, UK, 2016. [Google Scholar]
- Roestenburg, R.; Bakker, R.; Williams, R. Akka in Action; Manning Publications Co.: Shelter Island, NY, USA, 2015. [Google Scholar]
- Carpenter, J.; Hewitt, E. Cassandra: The Definitive Guide: Distributed Data at Web Scale; O’Reilly Media, Inc.: Sebastopol, CA, USA, 2016. [Google Scholar]
- Zaharia, M.; Xin, R.S.; Wendell, P.; Das, T.; Armbrust, M.; Dave, A.; Meng, X.; Rosen, J.; Venkataraman, S.; Franklin, M.J.; Ghodsi, A.; Gonzalez, J.; Shenker, S.; Stoica, I. Apache spark: A unified engine for Big Data processing. Commun. ACM 2016, 59, 56–65. [Google Scholar] [CrossRef]
- Andrienko, G.; Andrienko, N.; Demsar, U.; Dransch, D.; Dykes, J.; Fabrikant, S.I.; Jern, M.; Kraak, M.J.; Schumann, H.; Tominski, C. Space, time and visual analytics. Int. J. Geogr. Inf. Sci. 2010, 24, 1577–1600. [Google Scholar] [CrossRef] [Green Version]
- Kaenampornpan, M.; O’Neill, E.; Ay, B.B. An integrated context model: Bringing activity to context. In Proceedings of the Workshop on Advanced Context Modelling, Reasoning and Management, Nottingham, UK, 7 September 2004. [Google Scholar]
- Bolchini, C.; Curino, C.A.; Quintarelli, E.; Schreiber, F.A.; Tanca, L. A Data-oriented survey of context models. SIGMOD Rec. 2007, 36, 19–26. [Google Scholar] [CrossRef]
- Miralles, I.; Granell, C.; Rodríguez-Pupo, L.E.; Casteleyn, S.; Huerta, J. Games, Health and the City: Developing Location-Aware Games for Leveraging the Most Suitable Places for Physical Activity. In Proceedings of the Extended Abstracts Publication of the Annual Symposium on Computer-Human Interaction in Play, Amsterdam, The Netherlands, 15–18 October 2017; pp. 239–245. [Google Scholar] [CrossRef]
- Garofalakis, M.; Gehrke, J.; Rastogi, R. Data Stream Management: Processing High-Speed Data Streams; Springer: Berlin/Heidelberg, Germany, 2016. [Google Scholar]
Figure 1.
Layered architecture of the analytics platform for computing spatio-temporal metrics. The server-side platform is placed in the central part, whereby the client side applications are on either side and communicate with the server-side through stateless Application Programming Interfaces (APIs). Yellow denotes stream-processing methods, blue denotes batch-processing methods.

Figure 2.
Representation of the relationship between the variable Movement and default and custom dimensions.
Figure 2.
Representation of the relationship between the variable Movement and default and custom dimensions.

Figure 3.
Representation of the relationships between dimensions, analytics functions, and actions. Black arrows denote that custom functions may combine (compose) default methods. Actions are only connected to results of custom analytics functions.
Figure 3.
Representation of the relationships between dimensions, analytics functions, and actions. Black arrows denote that custom functions may combine (compose) default methods. Actions are only connected to results of custom analytics functions.

Figure 4.
Elements in blue are involved in the definition, set-up and storage of an instance of the metrics model using the metrics definition (front-end) tool available at https://gganalytics.geotecuji.org.
Figure 4.
Elements in blue are involved in the definition, set-up and storage of an instance of the metrics model using the metrics definition (front-end) tool available at https://gganalytics.geotecuji.org.

Figure 5.
Screenshot of the metrics definition tool (https://gganalytics.geotecuji.org) to specify variables and dimensions.
Figure 5.
Screenshot of the metrics definition tool (https://gganalytics.geotecuji.org) to specify variables and dimensions.

Figure 6.
Metrics SDK embedded in client applications is used for data collection and transferring to the server-side platform. Coloured in blue the elements involved in the data collection phase.
Figure 6.
Metrics SDK embedded in client applications is used for data collection and transferring to the server-side platform. Coloured in blue the elements involved in the data collection phase.

Figure 7.
Data flow, implemented tools and involved micro-services in the Data ingestion phase.

Figure 8.
Coloured in blue microservices involved in the metric computation phase.

Figure 9.
Data flow and involved micro-services in the Metrics computation phase.

Figure 10.
Map-based visualisation of collected trajectory data stored in the analytics platform.

Figure 11.
Tabular-based visualisation of the data in Figure 10.
Figure 11.
Tabular-based visualisation of the data in Figure 10.

© 2019 by the authors. Licensee MDPI, Basel, Switzerland. This article is an open access article distributed under the terms and conditions of the Creative Commons Attribution (CC BY) license (http://creativecommons.org/licenses/by/4.0/).
Share and Cite
MDPI and ACS Style
Rodríguez-Pupo, L.E.; Granell, C.; Casteleyn, S. An Analytics Platform for Integrating and Computing Spatio-Temporal Metrics. ISPRS Int. J. Geo-Inf. 2019, 8, 54. https://doi.org/10.3390/ijgi8020054
AMA Style
Rodríguez-Pupo LE, Granell C, Casteleyn S. An Analytics Platform for Integrating and Computing Spatio-Temporal Metrics. ISPRS International Journal of Geo-Information. 2019; 8(2):54. https://doi.org/10.3390/ijgi8020054
Chicago/Turabian StyleRodríguez-Pupo, Luis E., Carlos Granell, and Sven Casteleyn. 2019. "An Analytics Platform for Integrating and Computing Spatio-Temporal Metrics" ISPRS International Journal of Geo-Information 8, no. 2: 54. https://doi.org/10.3390/ijgi8020054
Note that from the first issue of 2016, this journal uses article numbers instead of page numbers. See further details here.