
High-Accuracy Recognition and Localization of Moving Targets in an Indoor Environment Using Binocular Stereo Vision


School of Environment and Spatial Informatics, China University of Mining and Technology, Xuzhou 221116, China
*
Author to whom correspondence should be addressed.
ISPRS Int. J. Geo-Inf. 2021, 10(4), 234; https://doi.org/10.3390/ijgi10040234
Submission received: 9 February 2021
/
Revised: 14 March 2021
/
Accepted: 4 April 2021
/
Published: 6 April 2021
Abstract
:To obtain effective indoor moving target localization, a reliable and stable moving target localization method based on binocular stereo vision is proposed in this paper. A moving target recognition extraction algorithm, which integrates displacement pyramid Horn–Schunck (HS) optical flow, Delaunay triangulation and Otsu threshold segmentation, is presented to separate a moving target from a complex background, called the Otsu Delaunay HS (O-DHS) method. Additionally, a stereo matching algorithm based on deep matching and stereo vision is presented to obtain dense stereo matching points pairs, called stereo deep matching (S-DM). The stereo matching point pairs of the moving target were extracted with the moving target area and stereo deep matching point pairs, then the three dimensional coordinates of the points in the moving target area were reconstructed according to the principle of binocular vision’s parallel structure. Finally, the moving target was located by the centroid method. The experimental results showed that this method can better resist image noise and repeated texture, can effectively detect and separate moving targets, and can match stereo image points in repeated textured areas more accurately and stability. This method can effectively improve the effectiveness, accuracy and robustness of three-dimensional moving target coordinates.
1. Introduction
With the development of indoor localization technology [1,2,3], moving target localization estimation based on computer vision technology [4,5,6] is becoming more and more widely used in indoor environments. Indoor localization technology [7] is used to obtain the location information of people and objects in indoor environments. Due to the difficultly of Global Navigation Satellite System (GNSS) to locate targets in non-line of sight environments, high-precision localization methods in outdoor environments, such as Global Positioning System (GPS), and cellular networks in indoor environments do not work. Therefore, indoor scene localization technology has become research hot spot in recent years [8,9]. However, the majority indoor localization technologies need plenty of additional basic measures and have a high construction cost. There are many problems involved in solving in indoor localization. Indoor localization technologies [10,11,12,13], such as Wireless Local Area Network (WLAN), Wi-Fi, Ultra Wide Band (UWB), Bluetooth, and Radio Frequency Identification Devices (RFID), all need signal transmitters and communication network settings in indoor scenes, which increases the labor intensity and results in high costs. Moreover, technologies based on radio signals need moving targets along with a corresponding signal sensor to receive and transmit signals. This means the technologies based on radio signals are active localization technologies and need the cooperation. Sometimes, moving targets do not carry a sensor; therefore, we propose a localization method based on computer vision to obtain the position of a moving target in a passive way, which does not require cooperation from a moving target. Target localization based on computer vision has many advantages, such as high efficiency, high accuracy, low costs, and no requirement of prior knowledge.
General vision target localization techniques include monocular vision localization [14], binocular vision localization [15,16,17] and omnidirectional vision localization [18]. Monocular vision localization has low accuracy and is not able to obtain depth information; meanwhile, omnidirectional vision localization has a complex structure, low image resolution, and serious distortion problems; compared to these two forms of localization, binocular vision localization [19] has advantages such as a simple structure and high accuracy and efficiency, so we chose the parallel structure of binocular vision to estimate target locations. Binocular vision localization, also called stereo vision localization, is a comprehensive technology that uses two cameras and processors to simulate human eyes to observe the surrounding scene information, and then analyzes and understands the acquired information. To be specific, by calculating the relative relationship between the position of the same spatial point in the two images acquired by the two cameras at the same time, the disparity values of the corresponding matching points in the left and right images are calculated, and then the known internal and external parameter matrices are used to reconstruct the triangulation principle coordinates of three-dimensional space points, thus obtaining the 3D coordinate values of space said points.
To obtain indoor moving target localization, we chose binocular stereo vision and followed three steps: (1) Finding and separating the moving target in the image sequence; (2) matching the moving target pixels in the stereo image pairs at the same time; (3) translating the two-dimensional pixel coordinates to three-dimensional world coordinates. To extract the moving target, at present, the main moving target detection algorithms are optical flow [20], the introduced-frame difference [21], and background subtraction [22]. Traditional moving target detection methods are extremely susceptible to the interference of background areas and changes of light and shadow, resulting in inaccurately detected moving target areas. In recent years, many methods based on the above three algorithms have been proposed to solve these problems, and the optical flow method has become the main target detection method because of its better precision and robustness. [23] proposed optical flow with motion occlusion detection based on triangulation, addressing the problem of motion occlusion of optical flow estimation. [24] presented a PatchMatch framework for optical flow by adopting a coarse-to-fine PatchMatch with generated sparse seeds to obtain sparse matching, thereby improving the computational efficiency of optical flow. Stereo matching often uses area- and feature-based matching. Area-based matching often uses three-dimensional information reconstruction because the detailed information is kept intact, but this takes a long time. [25] reconstructed the 3D surface by alternating between reprojection error minimization and mesh denoising for the recovery of 3D geometrical surfaces from calibrated 2D multi-view images, effectively preserving the fine-scale details of a reconstructed surface. Feature-based matching fuses ordinary feature point extraction and matching methods such as the Fast [26], Harris [27], Sift [28], and Surf [29] methods with the camera’s limit constraint principle to perform line-by-line stereo matching. Feature-based matching can only obtain sparse point pairs, meaning it is easy for it to result in mismatches, even potentially failing to detect feature points when matching repeating textured regions with non-rigid targets. Recently, [30] proposed a method that converts 2D Fourier transformation into 1D format and derives 1D Fourier transformation of the fast image matching model, which can effectively achieve large-scale and real-time detection, can improve the robustness of stereo matching, and can reduce the complexity of vehicle segmentation. [31] presented a novel super-pixel-based regression framework and introduced CRF with RRF into stereoscopic camera depth maps, making it more applicable to generate accurate data from an inexpensive stereo camera. [32,33] integrated a binocular stereo vision system into hardware and software.
We analyzed the factors that affect the accuracy of binocular localization and found the main affects to be the accuracy of target area extraction and stereo matching. Therefore, in this paper, a binocular moving target localization algorithm that fuses the improved Horn–Schunck (HS) large displacement pyramid optical flow method (O-DHS) and high-precision stereo deep matching (S-DM) is proposed. First, the combined improved large displacement HS pyramid optical flow method with Delaunay triangulation [34] fuses the Delaunay triangulation to obtain the precise optical flow field in the current frame image of the left camera frame images. Second, the Otsu [35] obtains the optical flow threshold value to obtain the moving target area range. These two steps solve the problem of the traditional HS optical flow not being able to obtain the optical flow vector field of the target when the movement is fast, and the moving target’s occluded area contains the optical flow value, which enlarges the area range of the moving target in the image. Then, according to the stereo deep matching algorithm, the left and right stereo image pairs are matched at the same time to obtain dense corresponding points, which solves the traditional matching algorithm problems regarding the matching being sparse, the low accuracy, and the high errors while matching non-rigid or targets with repeated textures. Finally, the target localization is calculated with the moving target area 3D point coordinates according to the centroid method, and the target area 3D points coordinates are reconstructed based on the target segmentation area and dense stereo matching points. The algorithm we propose can locate non-rigid moving targets more accurately with repeated areas or certain range deformation. In Section 3 and Section 4, the experimental results verify that the algorithm has higher accuracy and practicality than other algorithms.
2. Materials and Methods
2.1. Overview of the Methods
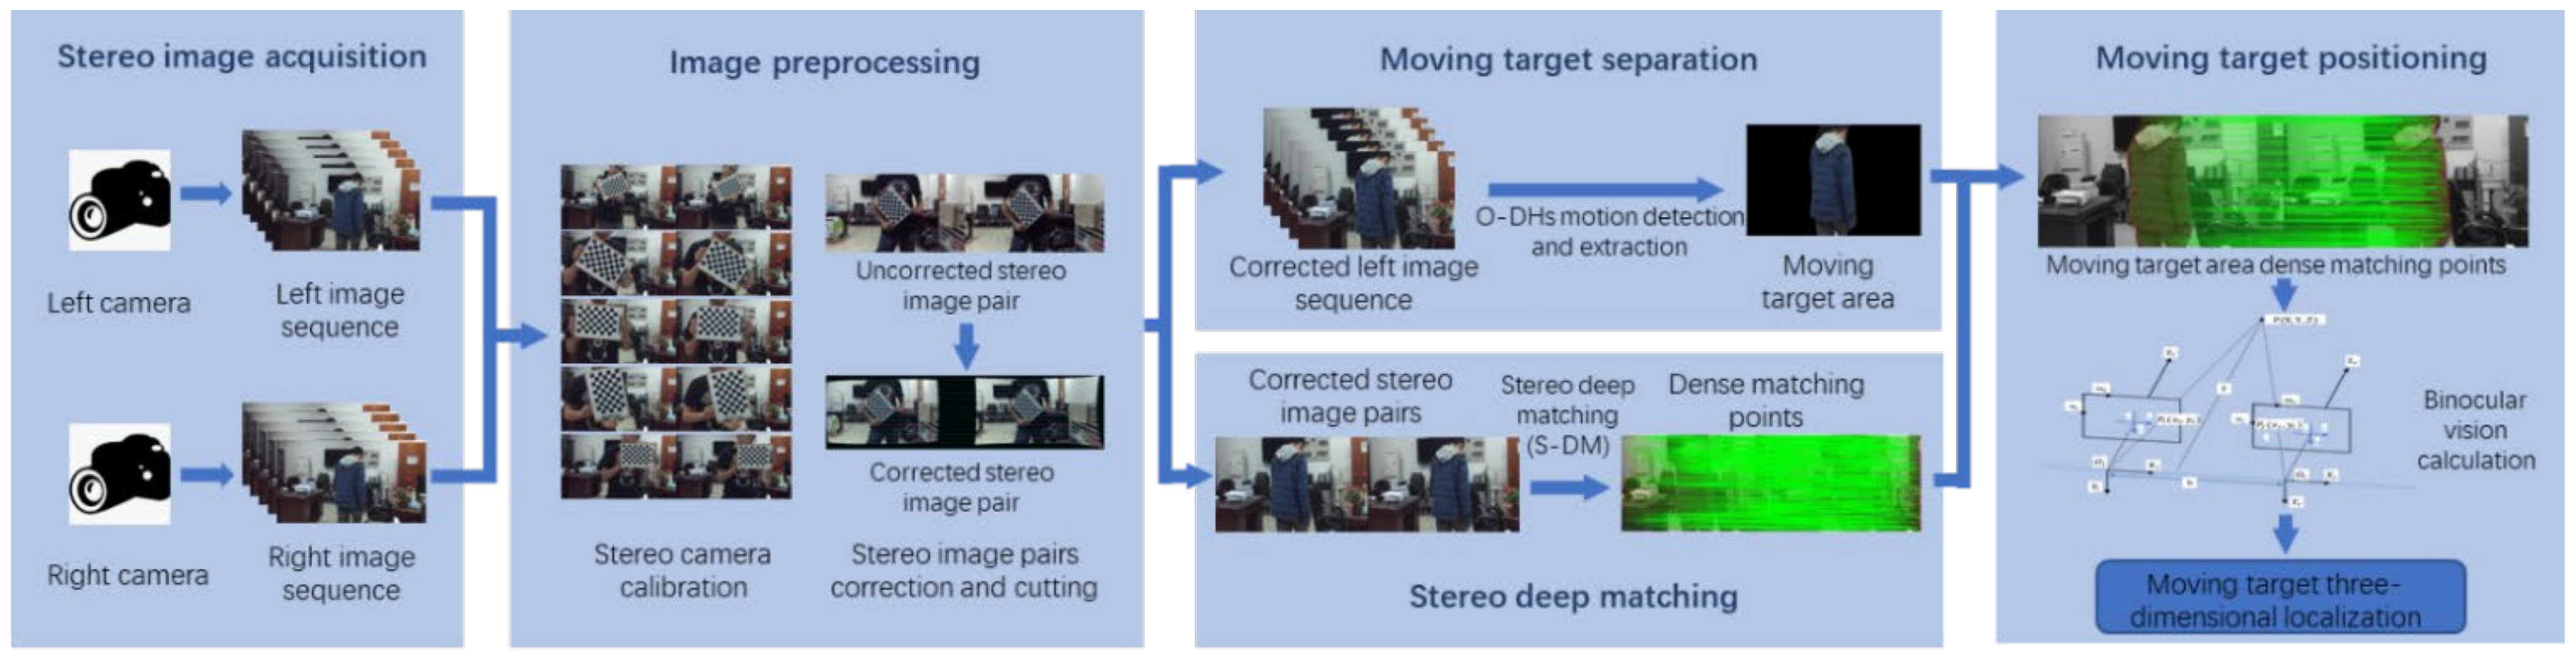
To obtain the localization information of the moving target, this paper first used the theory of binocular stereo imaging to find the corresponding relationship between the coordinate information in the stereo image pair and the three-dimensional coordinates. Then, by separating the moving target area range of stereo left image sequence and detecting the point-to-point stereo matching relationship of stereo image pairs, we could obtain the dense points’ 3D coordinates in the moving object area. At last, we calculated the moving target 3D locating according to the centroid method, which mainly included three aspects: (1) Analysis of the parallel binocular stereo vision model. We established a backward resection model based on the left and right image pairs at the same time and derived the conversion relationship between the pixel coordinates on the image plane of the stereo image pairs and the world coordinates on the real three-dimensional coordinate system. (2) Extraction of the moving target area (O-DHS). We detected the moving target area in the left camera image sequence by using the variational HS large displacement optical flow, and we used Delaunay triangulation to remove the occlusion area in the optical flow field to obtain a more accurate moving target optical flow field. Otsu was used to determine the optical flow threshold value to extract the moving foreground. (3) Dense stereo depth matching of stereo images (S-DM). To determine the matching relationship between the left and right images, the stereo deep matching algorithm was used to obtain the dense point matching relationship of the stereo image pairs, and the matching algorithm fused the deep matching and the stereo matching constraint principle. The algorithm framework of this paper is shown in Figure 1.
2.2. Binocular Visual Localization Measurement Method
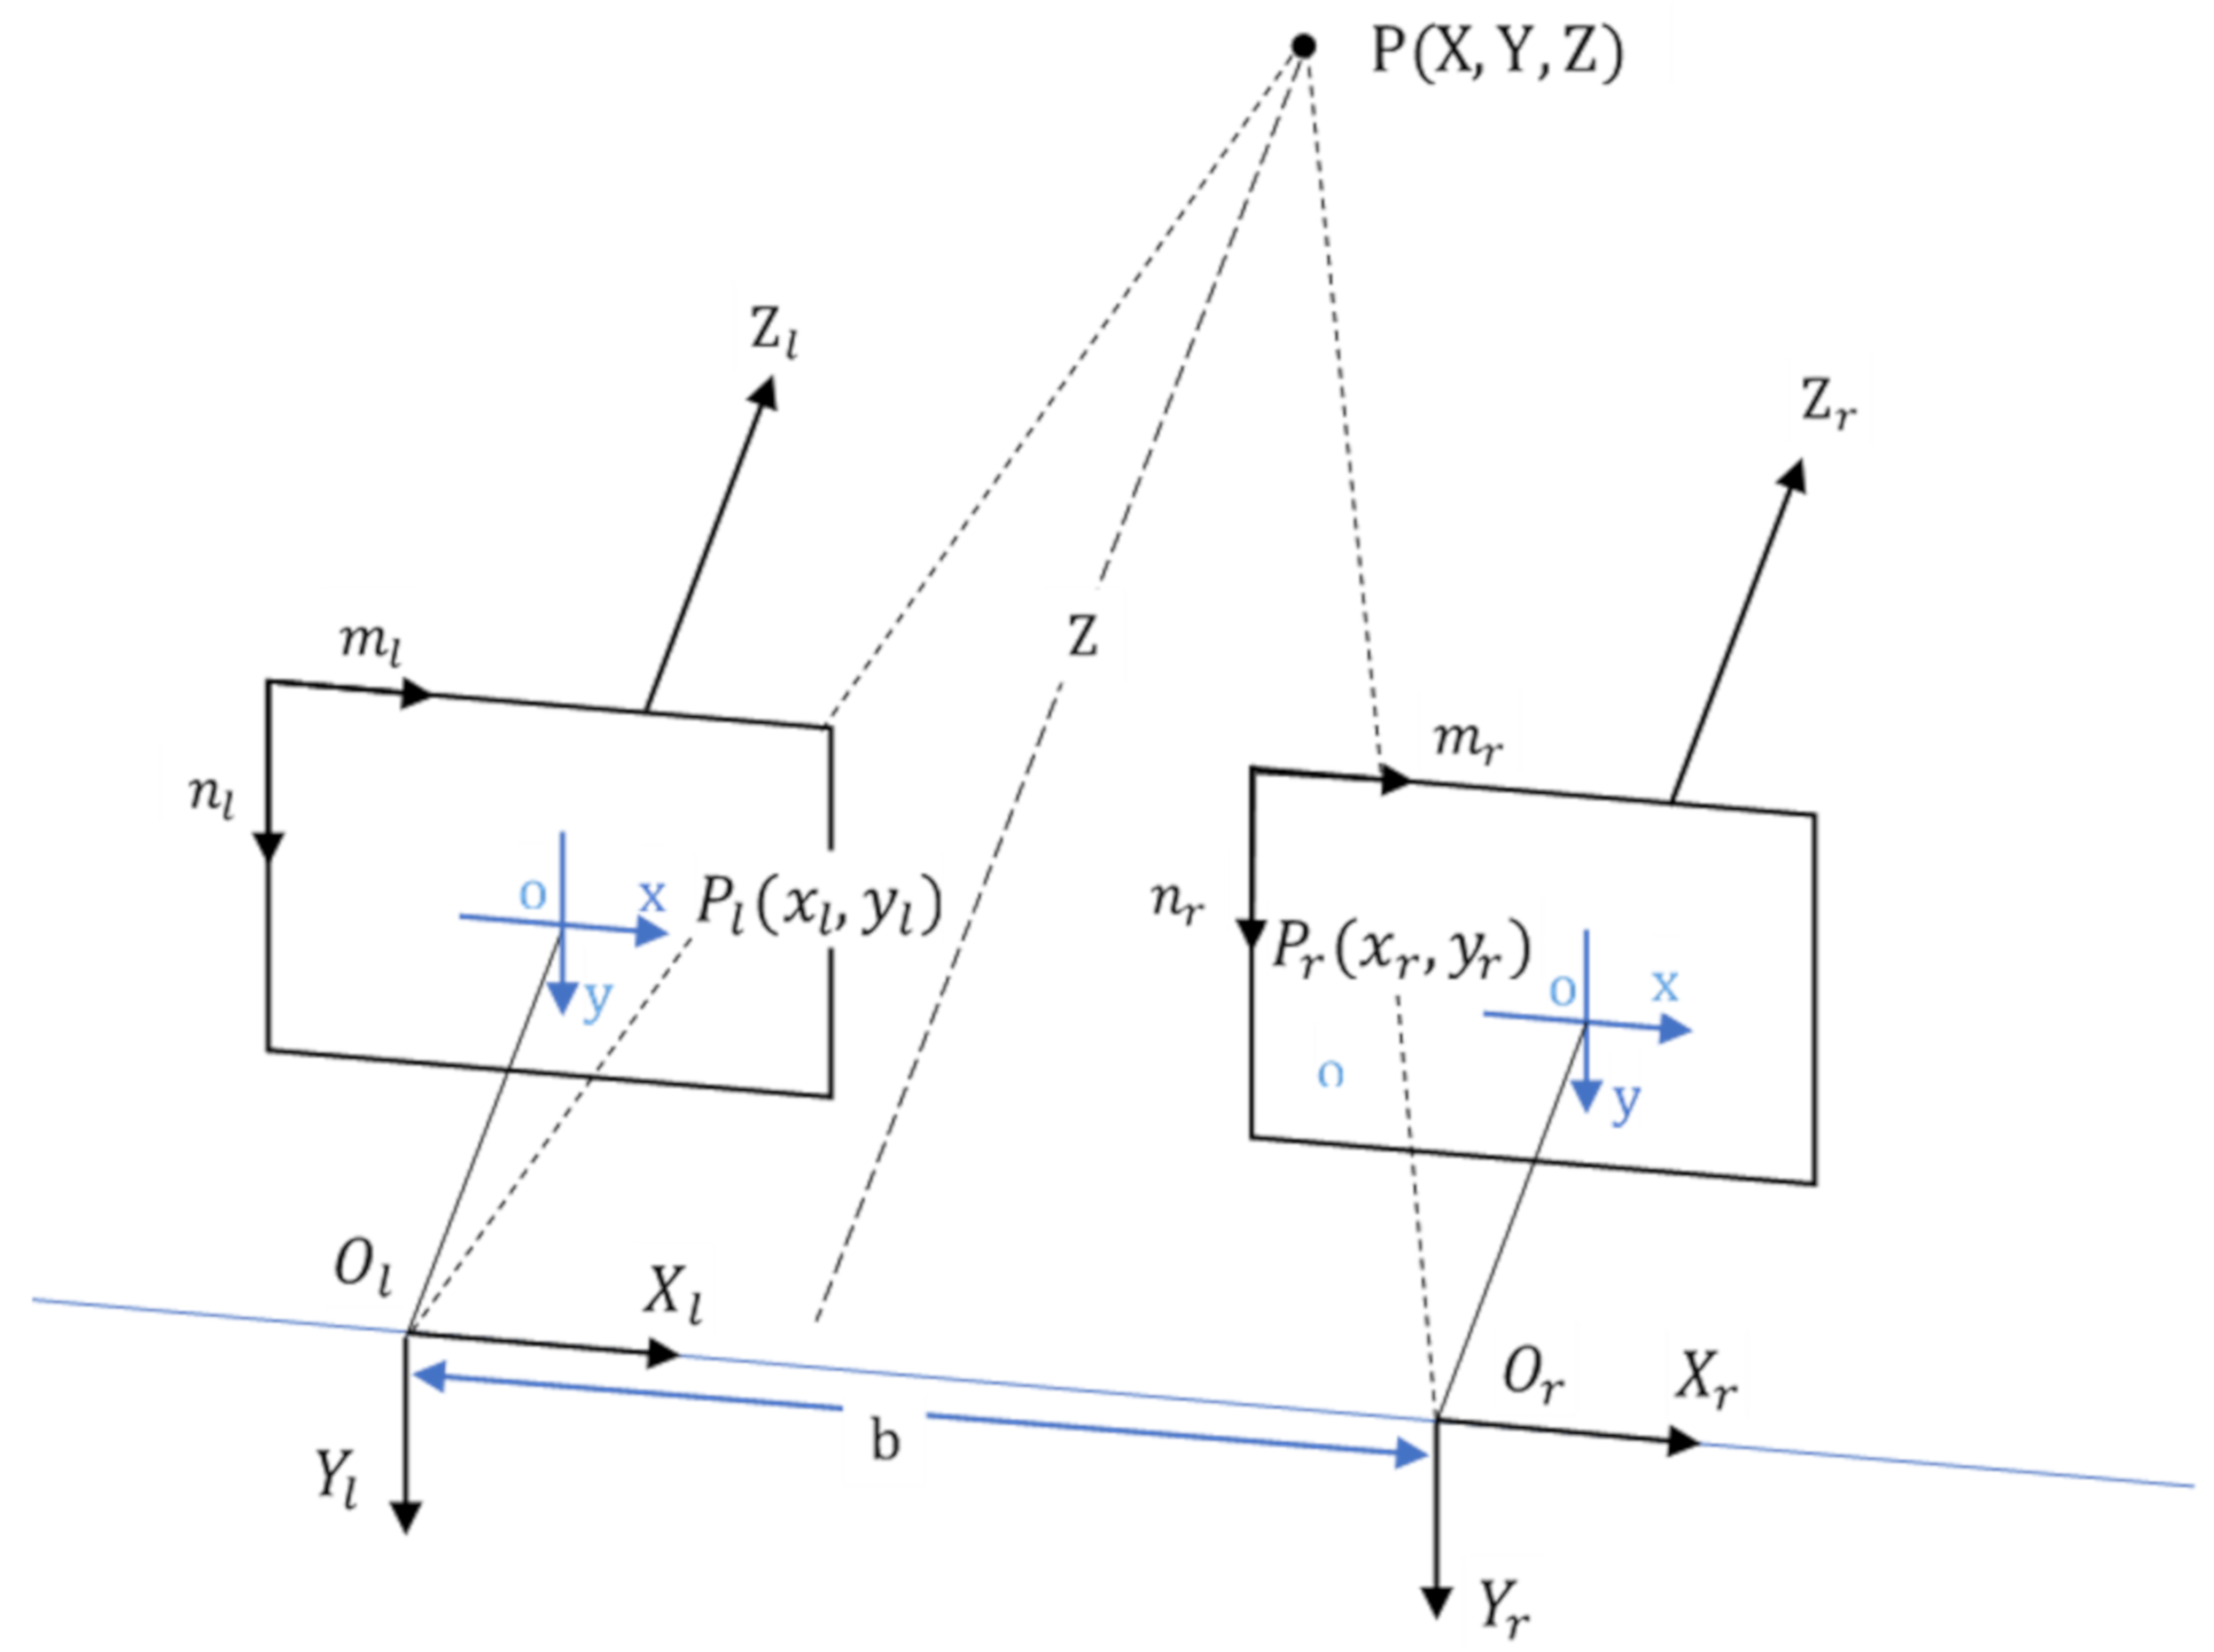
Binocular parallel stereo vision imitates the human perception of the depth of the surrounding environment with two eyes to obtain the three-dimensional information of a scene. According to the principle of triangulation, two cameras with coplanar imaging surfaces are used to image the same scene from different angles to obtain the disparity and to recover three-dimensional information. As shown in Figure 2, Ol and Or are defined as the optical center positions of the left and right cameras; OlXlYlZl and are the left and right camera coordinates; b is the distance between the two optical center points of Ol and Or, called the baseline distance; the focal length of the camera is f; the left camera coordinate system is used as the binocular camera coordinate system; P(X, Y, Z) is the three-dimensional space point coordinate of the binocular camera coordinate system; the projection point coordinates in the left and right camera imaging coordinate systems are Pl(xl,yl) and Pr(xr,yr).
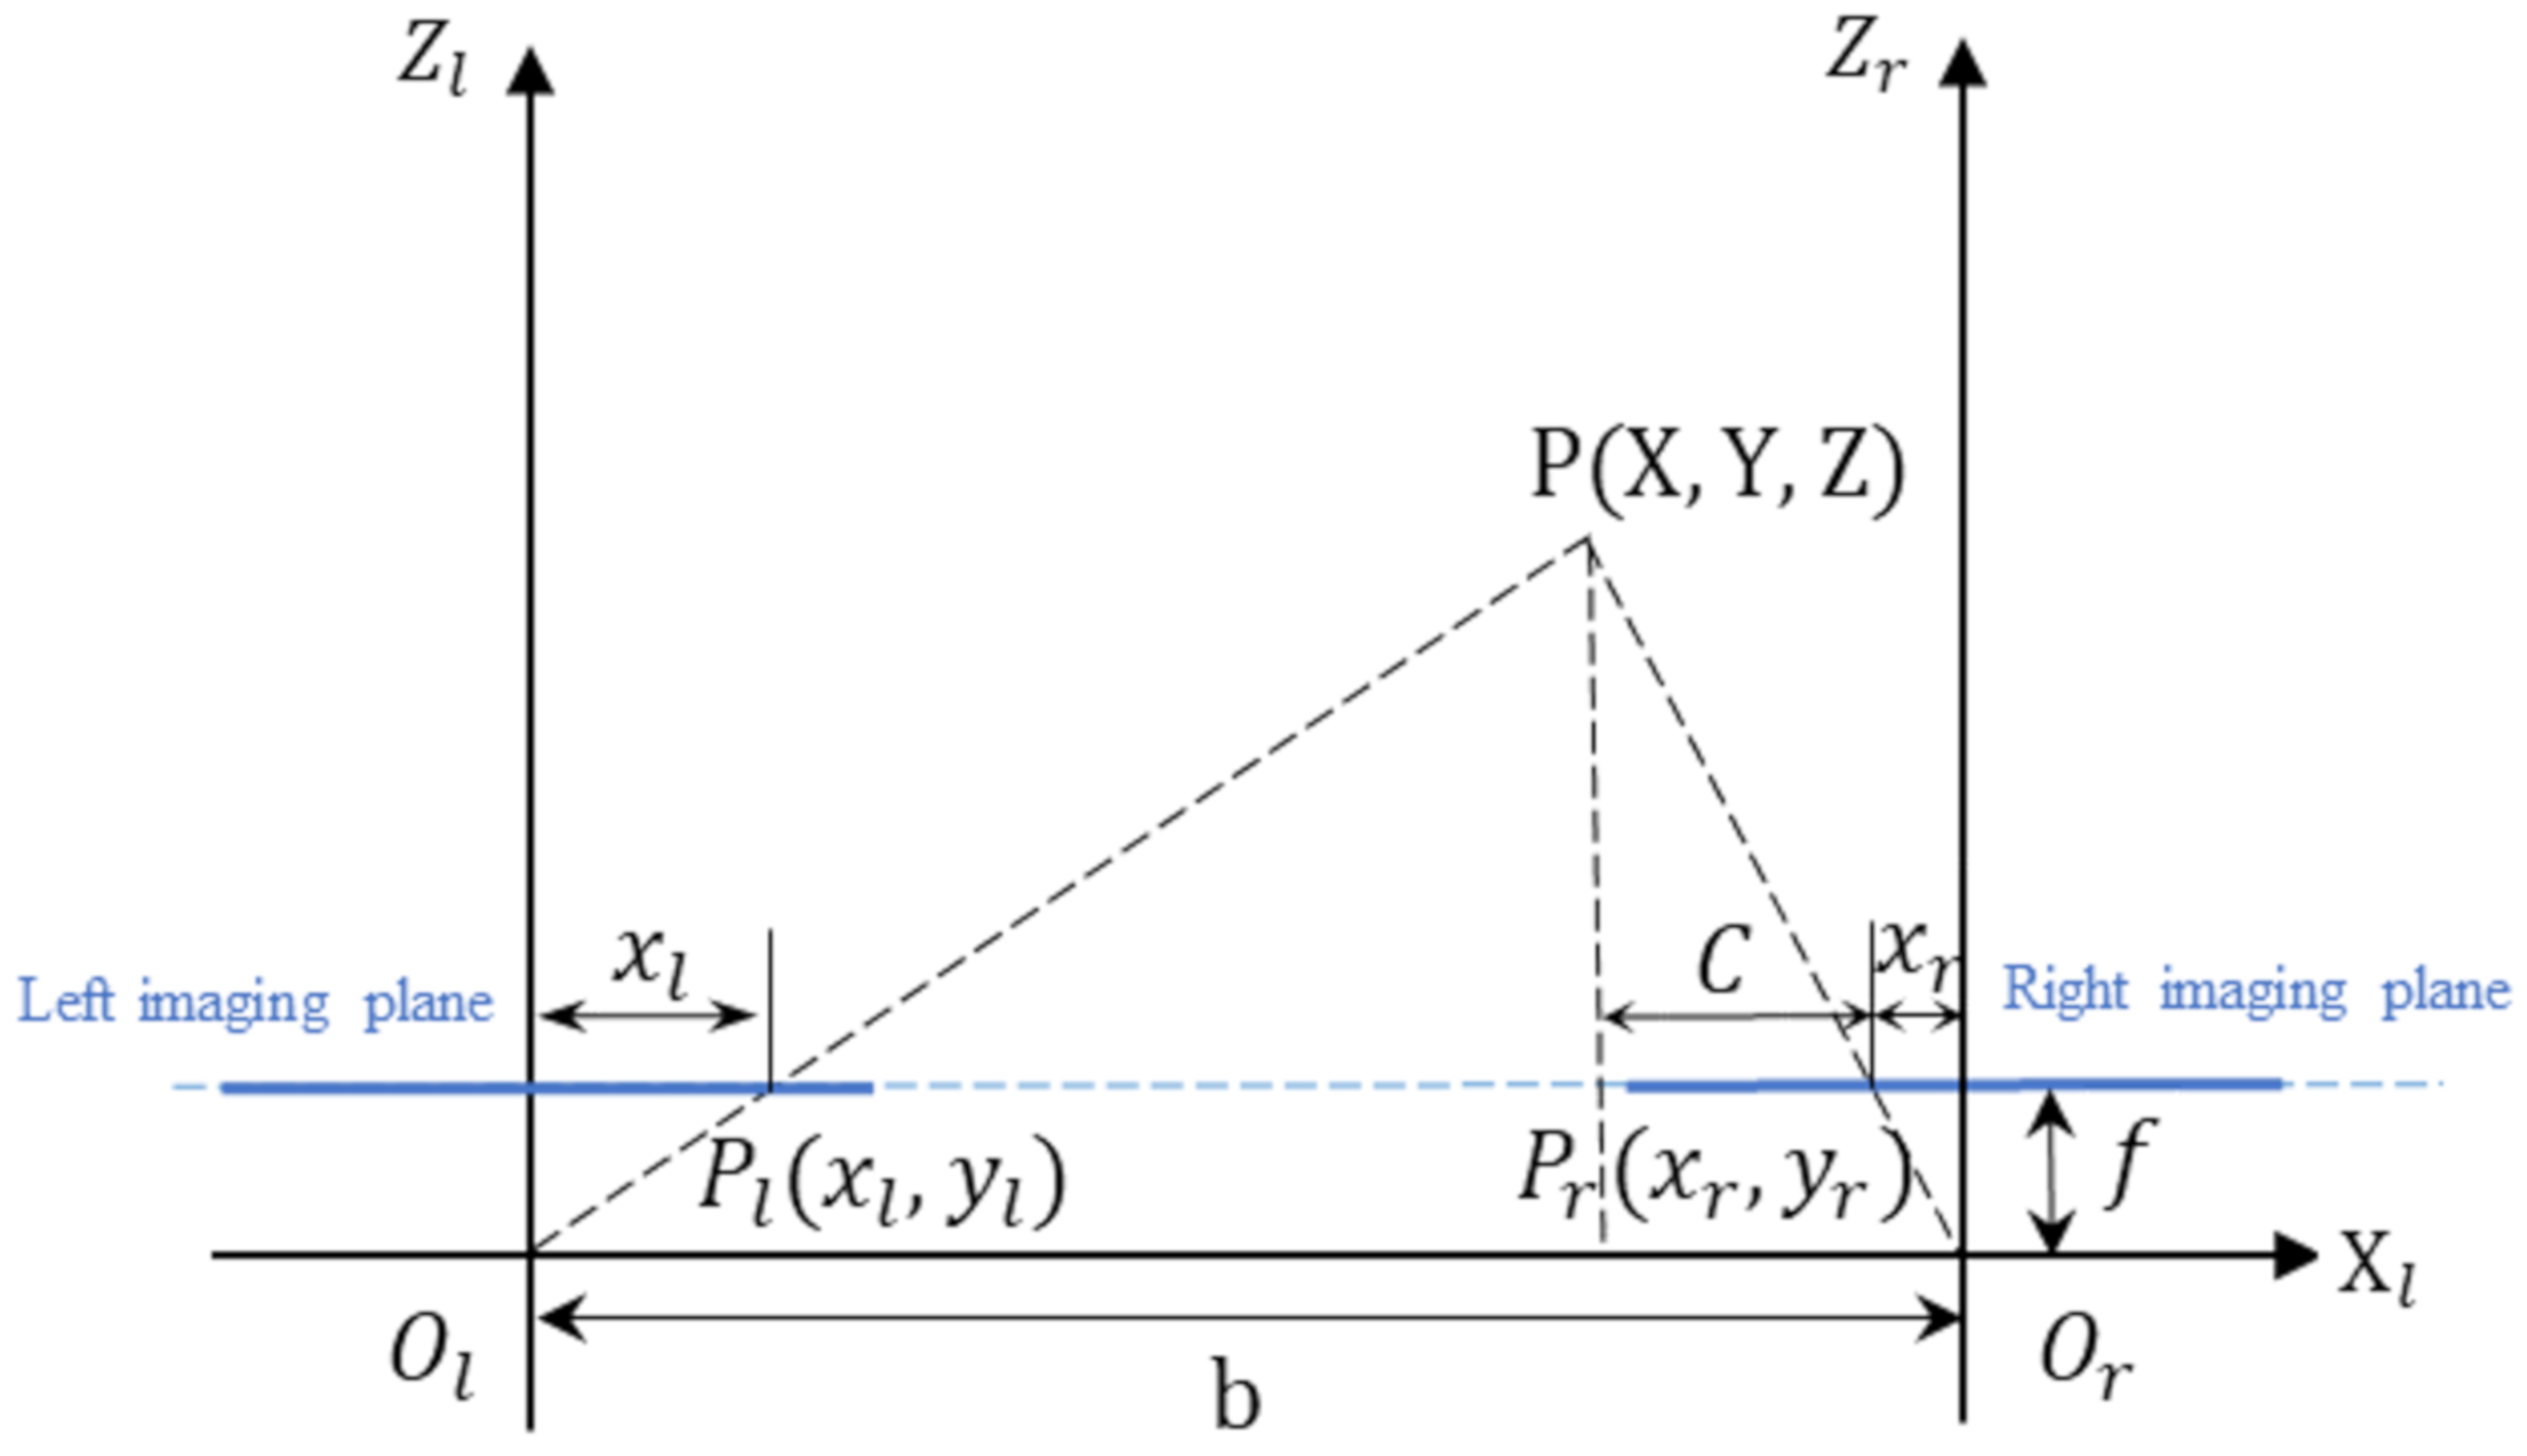
Projecting the model onto the XOZ projection surface, which is the vison model shown in Figure 2 project to the XOZ coordinate plane. (as shown in Figure 3), C is defined as the distance between the intersection point of vertical line from point P to the camera’s imaging plane and the projection point Pr of point P in right imaging plane. Based on similar triangles, we can obtain:
We can get , and substituting it into Equation (1), we can calculate :
Then, is defined as the disparity, so Equation (4) can be rewritten as:
This is then substituted into Equation (3):
Moreover, we can project the model onto the YOZ projection surface to calculate Y:
Therefore, in order to obtain the 3D coordinates of the target, the projection point coordinates and in the left and right camera imaging coordinate system need to be calculated, and the projection coordinates can be obtained by image pixel coordinate transformation.
According to the pinhole model, the transformation relationship between the camera coordinates and the image pixel coordinate is:
where is the scale factor; and represent the effective focal lengths in the X and Y directions; and represent the image center coordinates; , , , and are the internal parameters of the stereo color camera; R and T represent the position and orientation of the camera in the real world, which are external parameters of the stereo camera. The above parameter values can be obtained by stereo color camera calibration (see Section 4). Additionally, the coordinate plane is coincidental with the spatial plane. It is considered that the z value is 0, which can be simplified as:
Respectively substituting the pixel coordinates of the left and right images to obtain and and relating Equations (5)–(7) can enable calculation of the camera coordinate system’s three-dimensional coordinates (X, Y, and Z).
2.3. Motion Detection and Extraction
In this paper, the HS pyramid optical flow and Delaunay triangulation [36] fusion algorithms were used to detect the moving target in the adjacent frame images and acquired by the left camera. First, the data term of the traditional HS optical flow model was improved, the errors caused by lighting changes and image noise were reduced, and the calculation accuracy of the HS optical flow model was improved. Then, Delaunay triangulation (confirmed in Section 2.3.2) was used to determine whether the pixels have optical flow belonging to a background or target area. While regions all occur at the moving target area boundary, occlusion may not. Therefore, Delaunay triangulation was used to detect the occlusion area from the edge area of the image, thereby optimizing the optical flow of the occlusion area and improving the precision and accuracy of the HS optical flow field, so as to improve the accuracy and the accuracy of the moving target detection. Finally, Otsu was employed to obtain the optical flow threshold value to obtain the moving target area range. We called this method of detecting and extracting a moving target O-DHS.
2.3.1. HS Optical Flow Model Construction
(1) Data term
The spatial gradient is defined as , the partial derivatives of the spatial gradient respect to and directions are , , and the optical flow vector is . Knowing from assumption of constant brightness, . The data items can be defined as:
where is the occlusion coefficient, which is a binary function based on prior occlusion information, where means that the point is not occluded and means that the point is occluded (the occlusion determination is explained in detail in Section 2.3.2); is a non-square penalty function, where , and in this paper is 0.001. Because HS optical flow has a poor ability to suppress noise, Weickert [37] proposed to introduce local consistency of Lucas Kanade (LK) optical flow to reduce noise. The HS and LK models can be merged by convolution of the Gaussian function , and represents a Gaussian kernel function with radius . Gradient conservation is introduced to solve the problem of lighting changes that cannot be solved only by gray-scale conservation. The data term is:
where is the balancing gray term and the gradient term coefficient; let , , and , then the function is simplified as:
(2) Smoothness term
We adopted the isotropic smoothness strategy of the global smoothness term, which is:
, , and the weight coefficient of smoothness term is
(3) Multi-resolution multilayer refinement
To solve the problem of HS optical flow not being able to detect large moving targets, we introduced multi-resolution pyramid layering to refine optical flow, and downsampled continuous frame images from the bottom up by bilinear interpolation to build the pyramid. The number of layers from the bottom to top is ; the optical flow value , calculated at the k–1 layer of the pyramid, is the initial optical flow value of the next k layer, which is added it to the layer HS optical flow value to obtain the initial optical flow value of the next k+1 layer, up until the end of the bottom of the pyramid, resulting in the final optical flow value. The optical flow value at the top of the pyramid is defined as . The downsampling factor of the bilinear interpolation used in this paper was 0.95, and the number of layers was . The function is:
2.3.2. Delaunay Triangulation Occlusion Area Determination
In this paper, according to the Delaunay geometric occlusion detection method proposed by Kennedy et al. [37], the method introduced in [35] was applied to the occlusion detection of moving targets. We further applied it to the detection and extraction of moving targets by deleting the error detection optical flow value in the occlusion mixed in the moving target foreground area. This improved the accuracy of segmentation and extraction of moving targets, so we were able to improve the target localization accuracy.
For the pixel point position in , it is added to the optical flow at the point as the corresponding point of , so the gray difference between and is:
When , the gray of the corresponding positions of the consecutive frames are consistent, indicating that point p is not occluded, in Equations (11)–(13). When , Delaunay triangulation is constructed on gray difference map for occlusion determination. The specific method is: Taking each point in the previous frame image and the neighborhood coordinate points and to form a region triangle, Equation (16) is used to calculate the corresponding triangle optical flow value in , and then the gray change of this triangle area is calculated. The equation is:
where , , and represent the weights of the three points; we took . We compared the grayscale difference between the pixels in the neighborhood of around the triangle with the triangle to determine the occlusion of the points in the neighborhood. The specific judgment method is: , which means the point is occluded, , , which means the point is not occluded, and .
2.3.3. Moving Target Area Extraction
We used Otsu to determine the threshold of the moving target optical flow field; thus, the foreground area of the moving target could be separated from the background area in the image, and the coarse range of the moving target area was extracted. Because the image was affected by noise, the obtained optical flow field was not uniformly distributed, which caused the obtained binary foreground image to have uneven target edges, porosity, and unnecessary small foreground areas, except for the moving target. In order to obtain a moving foreground target with smooth edges, as shown in Figure 4, we analyzed the morphological operation of corrosion, expansion, opening operation, and closing operation, thereby determining that the moving target foreground area could be obtained by first closing and then opening operation.
2.4. Stereo Deep Matching
Deep matching (DM), proposed by Weinzaepfel et al. [38,39], is a dense fast image matching algorithm similar to a convolutional neural network structure. It describes the image local features by combining the optical flow algorithm with dense sampling, a pyramid structure, cross convolution, and max-pooling descriptor local features. It can match non-rigid deformation and regions with repeated textures and can obtain dense matching pairs. Compared to other algorithms, DM has the advantages of high computing efficiency and high accuracy. The DM algorithm uses the pixel block area around a point as a descriptor of this point, builds a correlation pyramid between the left and right images according to the similarity measure between the block areas of the two images of the left and right cameras to be matched at the same moment, and then establishes a matching relationship from the top of the pyramid to iterate to the bottom of the pyramid to obtain the match between the left and right camera image relationship, including two steps: (1) Calculation of the correlation tile area from the bottom up to establish the correlation pyramid; (2) top-down matching transfer. This paper used five constraints of stereo matching—Epipolar constraint, uniqueness constraint, consistency constraint, continuity constraint, and order constraint; these were integrated into the deep matching algorithm to match the stereo image pairs, and we called it stereo deep matching (S-DM).
2.4.1. Establishing an Association Pyramid
Since the HOG (Histogram of Oriented Gradient) [40] algorithm can better describe the local features of an image, HOG was used to describe the features of all pixels in the image. The pyramid structure can solve the problem of incomplete image feature information on a single scale. It is easier and more accurate to use small-scale images to process the matching of regions with repeated textures. Therefore, in order to obtain accurate and dense correspondence between left and right camera images, the associated pyramid uniting HOG and pyramids can accurately and comprehensively match left and right camera images.
Image and represent the images of the left and right cameras at the same time, and the number of rows and columns is L and R. Grayscale processing is performed on and . Image is divided into no overlap segments with a size of , and the segmented block images are called initial block images, so as to reduce the influence of the deformation regions in and caused by different angles or displacements. The initial block image of is divided into four same-size subregions, and the four subregions are in the range of , rotated internally and with the deformation of the proportion. The similarity can be regarded as the average of the similarity of the four quadrant units. Therefore, the similarity between and is:
where and are the initial blocks of the same row in left camera image and the right camera image ; and correspond to single quadrant feature descriptors; is a similarity metric function with a value range of .
Then, Gaussian smoothing is performed on the segmented initial block H with a parameter of to reduce the distortion caused by image compression. A histogram of the direction gradient of each block is calculated, which is divided into two steps: (a) Using the Laplacian operator to convolve block H to obtain the gradient value , calculating the gradient value in eight directions of non-negative projection to obtain the gradient value of each pixel in said eight directions. (b) In order to reduce the influence of light and local shadows of the image, is used for correcting. Then, Gaussian smoothing is used again to obtain a histogram of the gradient direction. By reducing the weight value in the smaller direction and increasing the weight value in the larger direction, the influence of the larger direction value can be increased. The similarity formula of the feature descriptor of the pixel is:
Then, the underlying association graph of the pyramid is calculated according to convolution. represents the histogram of the gradient direction, and is defined to represent the associated block image of the association graph. means that the center point of the block image is ; m means the size of the block is t represents the current number of iterations); represents the search area where the figure is located on the same horizontal line in the right image. The association graph can be obtained from the convolution of and according to Equation (19). For each point on the right imaging plane , represents the matching degree between and .
An association graph of the previous layer is obtained by aggregating the smaller block images at the bottom of the gold tower of the association graph into larger block image, which means that the block is aggregated by four block images size of . , . The aggregated association graph is:
The obtained aggregated correlation graph is subsampled to obtain a previous layer correlation graph, and the max-pooling method is used to pass the local maximum; then, the pyramid is decremented twice from the bottom up, which is .
As the number of iterations caused by subsampling increases, the spatial variation of the association graph decreases. To eliminate the effect of the two decreases in each iteration, a constant coefficient of 2 is added to the iterated function, as: . This causes the block area movement amount to be , that is, . Subsampling is: . is defined as the corresponding translation value, .
Because max-pooling only retains the maximum correlation value, in order to maintain the robustness of the larger correlation values during the iteration process, a non-linear mapping γ is introduced: , and the final correlation iteration function is:
2.4.2. Association Pyramid Matching Transfer
By using the possible associated block image on the upper layers of the pyramid as a cut-in block image, the matching correspondence is transmitted to the lower layer of the pyramid and returned to the lower layer association graph. The optimal matching of the same image on different pyramid levels is selected to form the lowest matching result. The cut-in block is composed of four subquadrants ; due to max-pooling sampling, corresponds to the block area in the next layer, and represents the displacement:
is defined as and as ; let represent the association score, with m representing the block being the size of , the center pixel coordinate being p or , and its matching degree being . Thus, is:
or
is defined as ; considering the matching situation at the cut-in block and then backtracking to the bottom of the pyramid, matching transfer has many overlapped blocks. Herein, we only backtracked the block with the highest association score, while those with a lower score were eliminated. According to Equation (23), the stereo deep matching is obtained as:
Finally, the matching result is filtered to find the best matching pairs. In detail, according to the matching results, the images and are returned with the center and with a 4 × 4 field size as the best matching pairs. , meaning that and are the best matching pair, where is the corresponding initial block in the left camera imaging plane corresponding to the associated block, so the matching result can expressed as:
2.4.3. Consistency Test
According to the consistency constraints of stereo matching, the source position in the left image compared to the target position in the right image should be the same as the position of back-matching from the right image to match the left image. Based on this, we took the right image as the source image and the left image as the target image, repeating Section 2.4.1 and Section 2.4.2 to determine the matching point pairs to select the same matching as the previous matching results, taking them as the final best matching results.
3. Results
3.1. Motion Detection and Extraction Accuracy Analysis
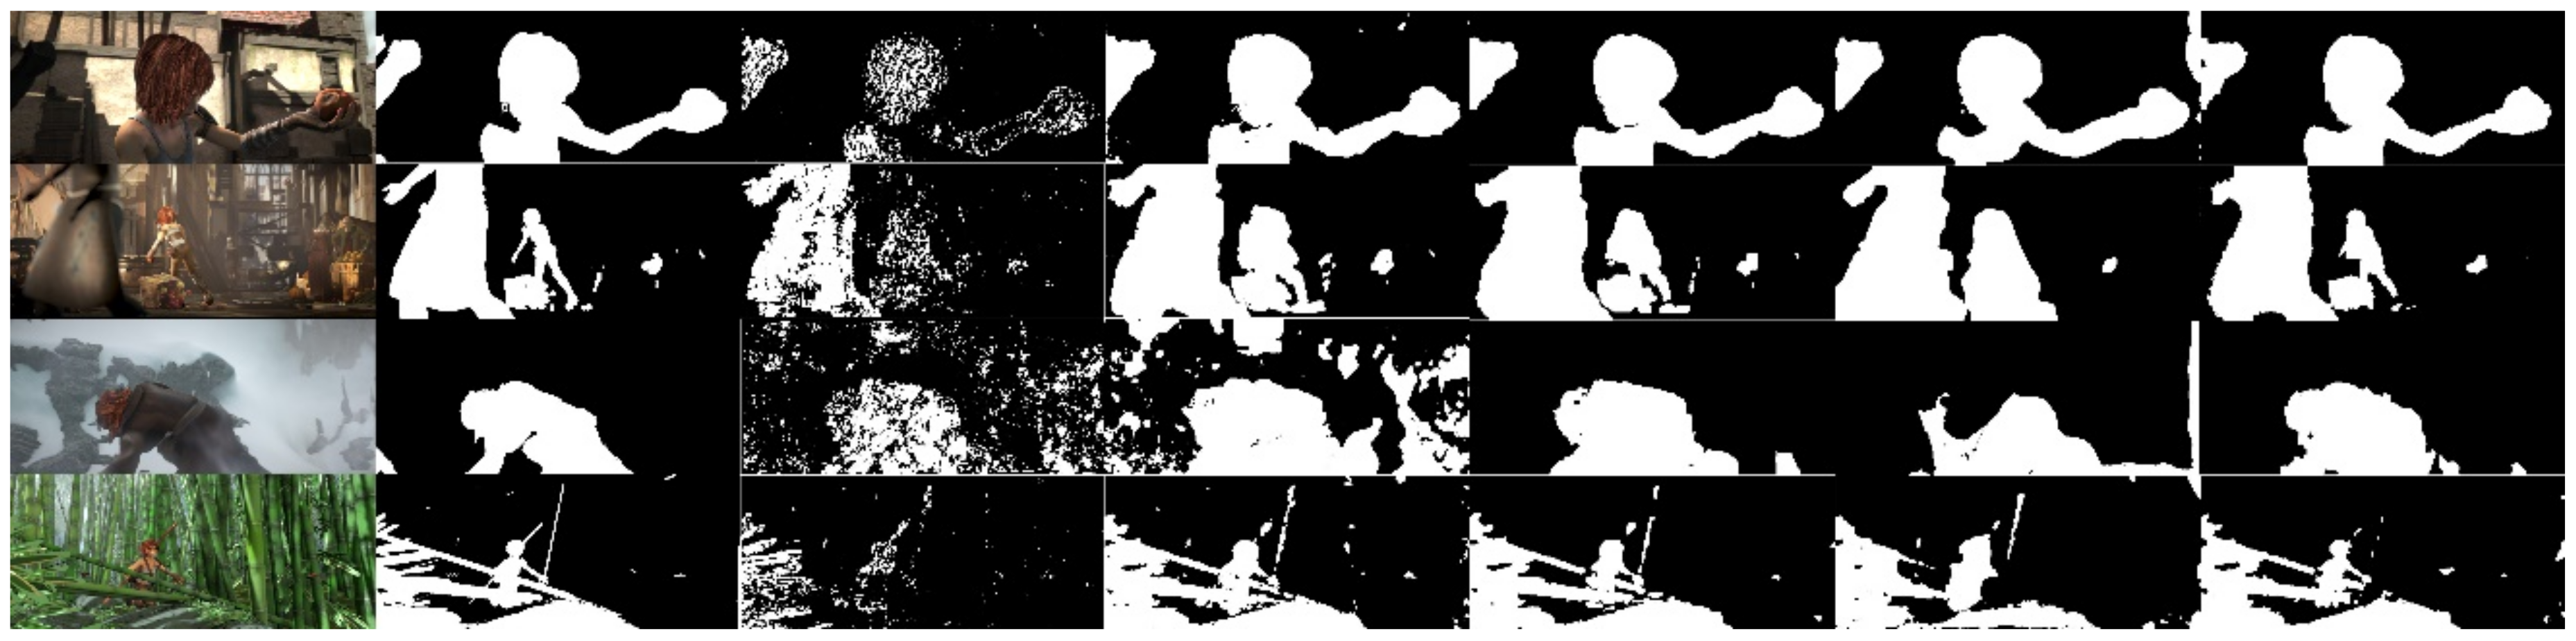
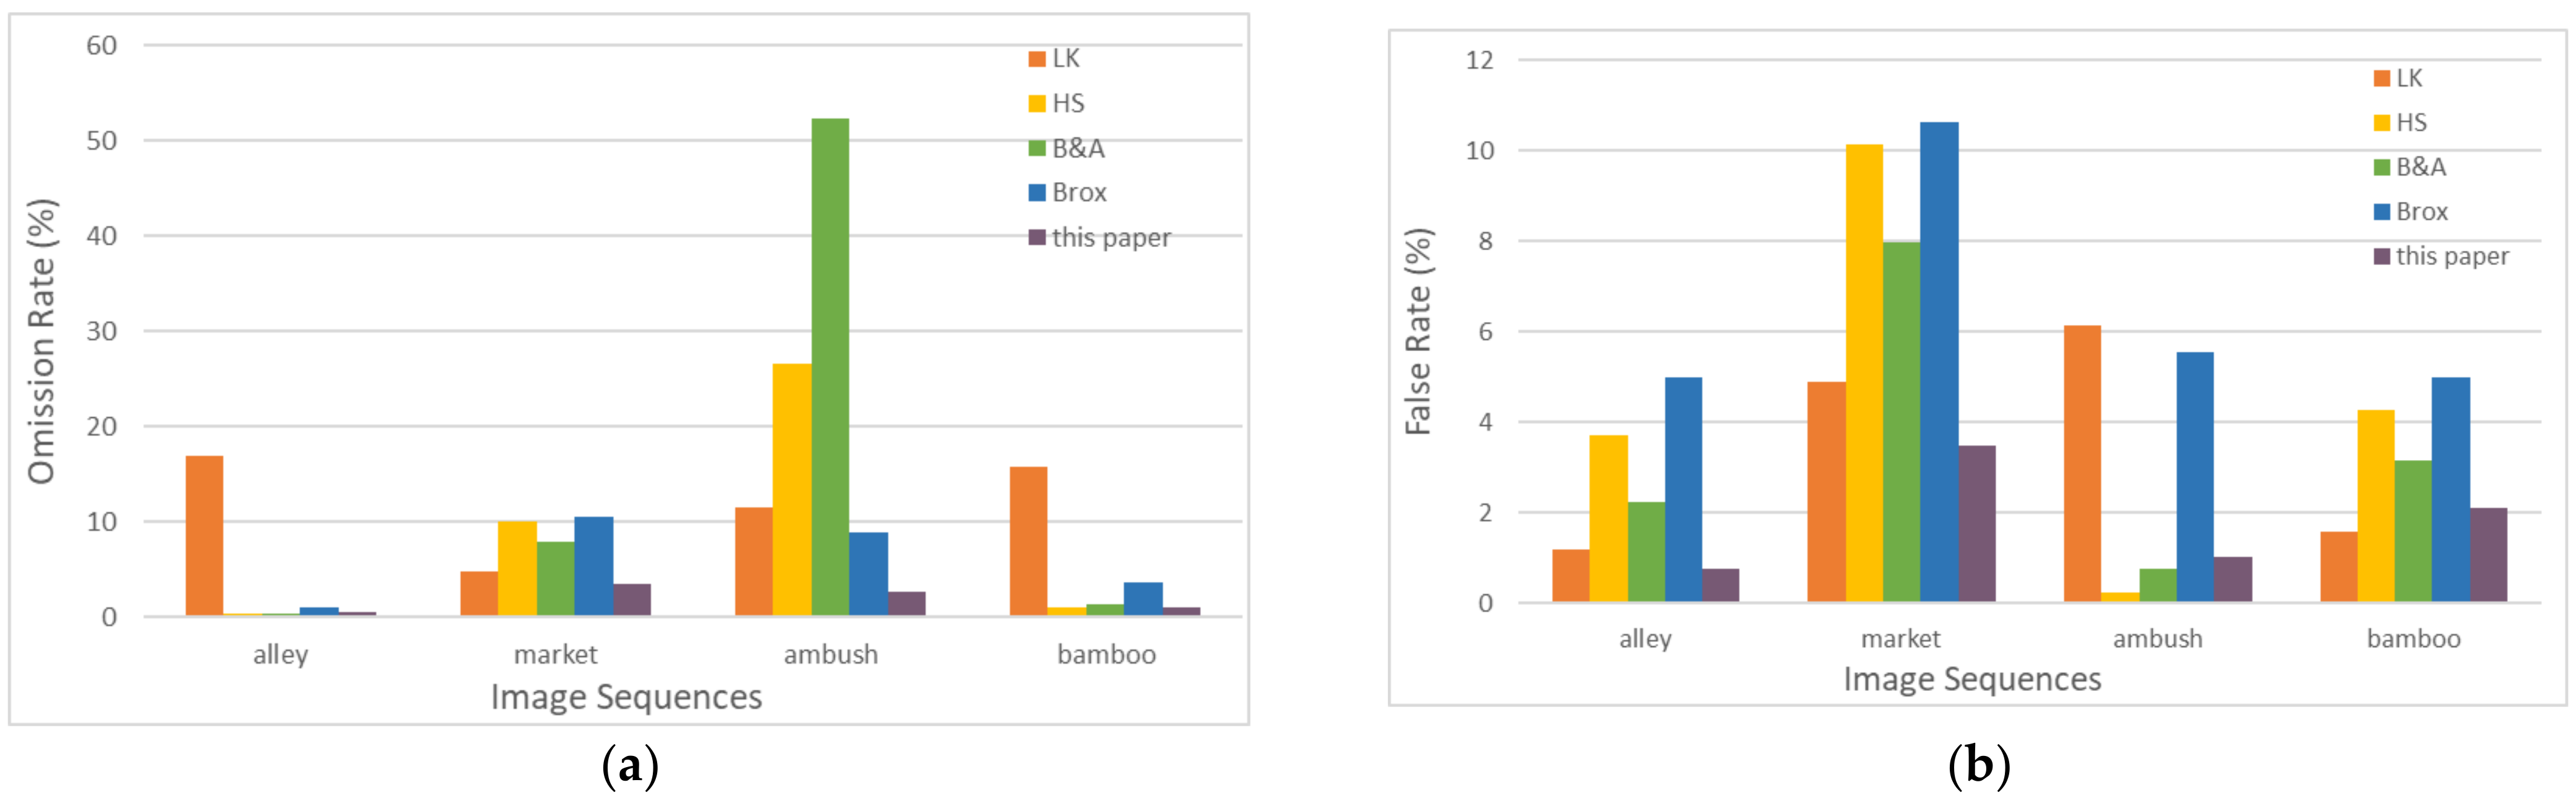
We took four sets of continuous frame images with a resolution of 326 × 1024, simulated in the MPI Sintel data set [41]. We compared the algorithm in this paper to LK [42], HS pyramid [43], Black and Anandan (B&A) [44], and Brox [45]. The detection results of common optical flow methods were compared to verify whether the algorithm has a certain precision. As shown in Figure 5, it can be seen that the HS large displacement optical flow method fused with Delaunay achieved better detection results. The omission rate and false rate of the foreground target were used as the evaluation index of the target detection performance. The omission rate is , representing the rate of the number of undetected moving target pixels to the total number of pixels. The false rate is , representing the rate of rate of the number of non-moving target pixels to the total number of pixels that are falsely detected. The comparison results of the omission rate and false rate are shown in Figure 6. In Figure 6a, the missed detection rate of our algorithm is lower than that of the other algorithms. In Figure 6b, the false rate of our algorithm for the ambush sequence is slightly higher than that of the HS pyramid and B&A optical flow methods, but the missed detection rate of the ambush sequence is significantly lower than that of the other algorithms, as is the false rate of our algorithm. In summary, the method of moving target detection and extraction in this paper is effective and is able to reduce the final target positioning error caused by the target region extraction error.
3.2. Stereo Deep Matching Analysis
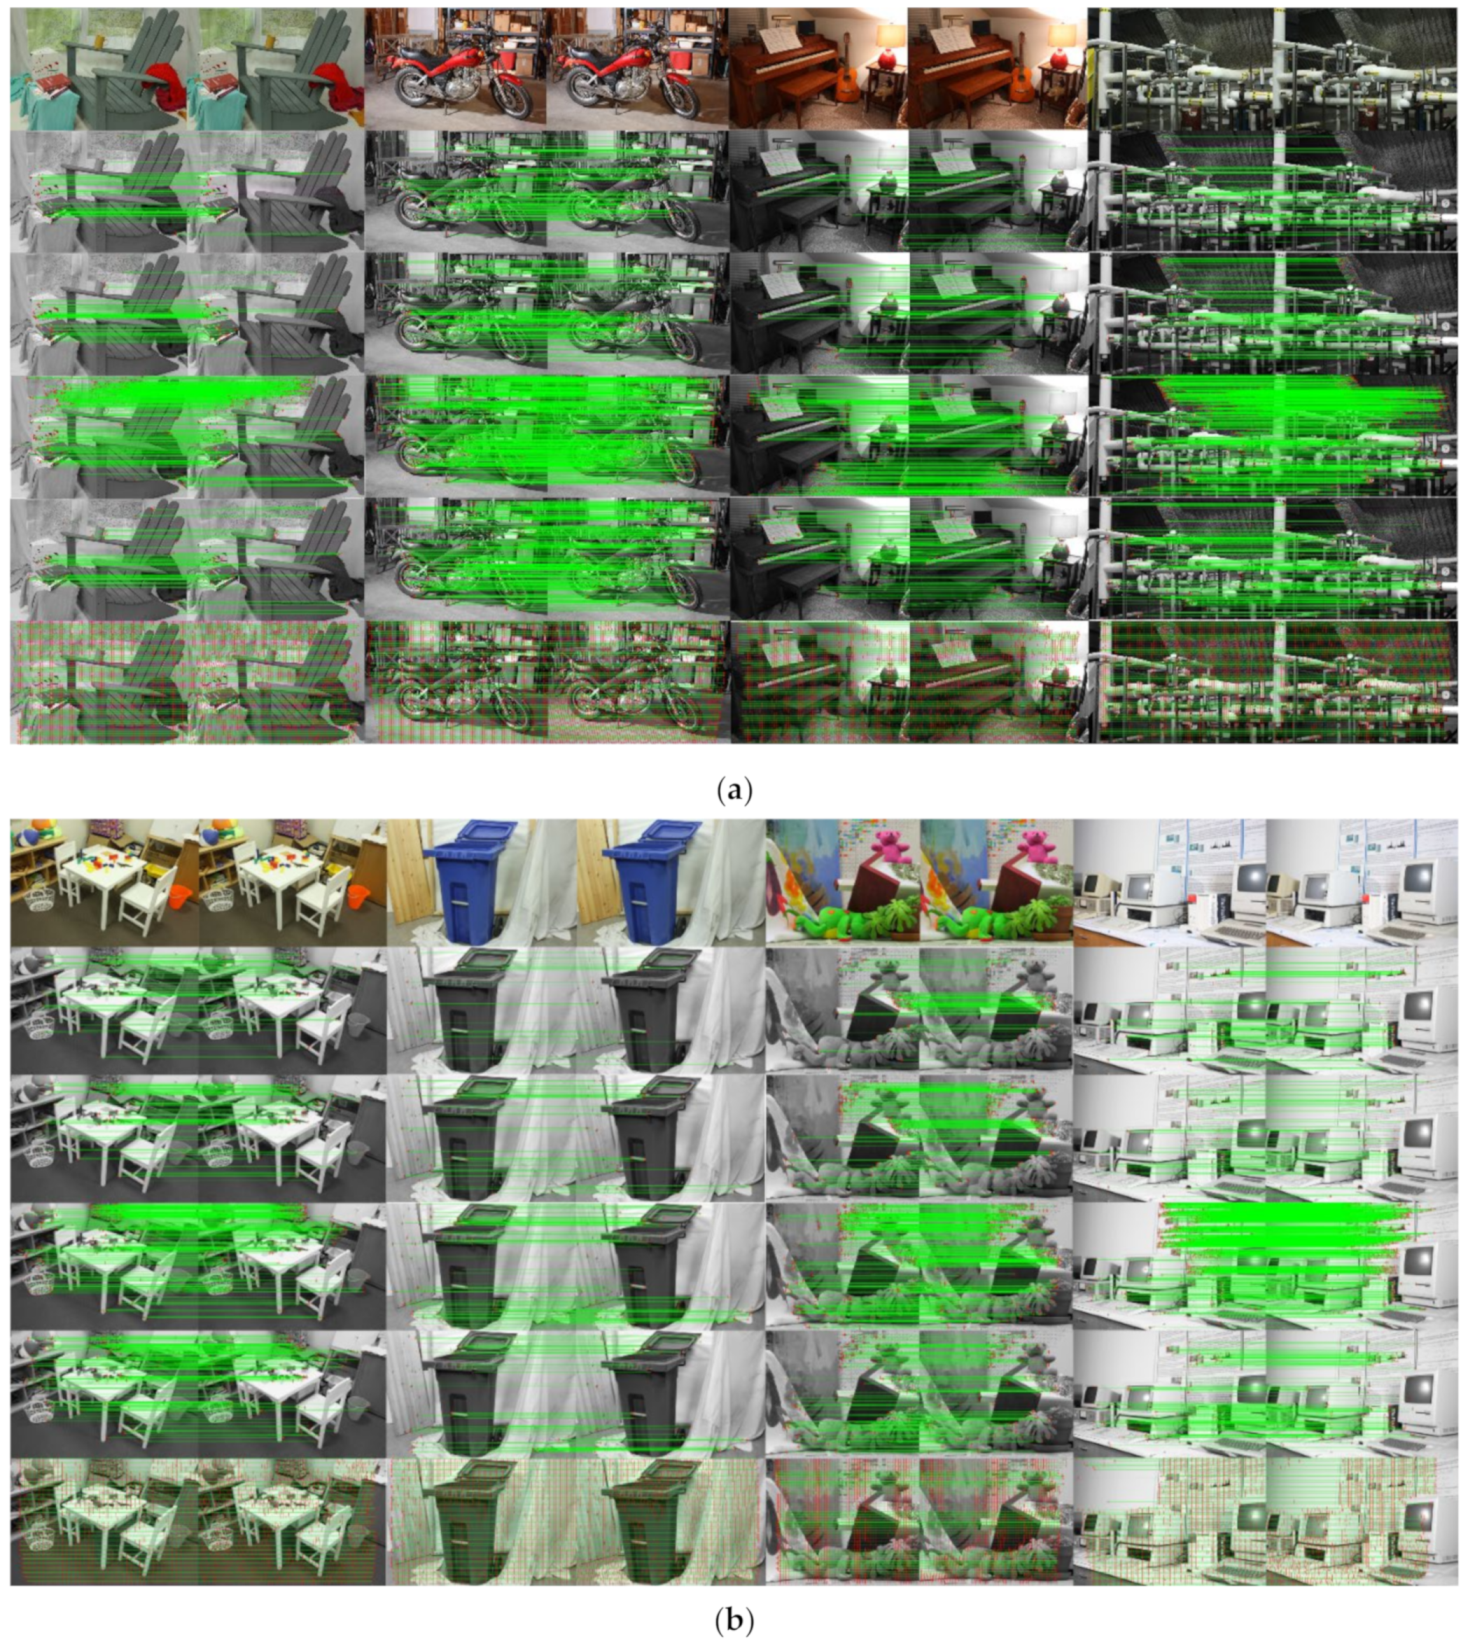
In order to verify the effectiveness of the stereo deep matching, we used 10 stereo image pairs from the general Middlebury Stereo Datasets from the 2014 datasets [46] for the training set to prove the accuracy. The results of a comparison against the S-Fast, S-Harris, S-Sift, and S-Surf methods (representing the Fast, Harris, Sift, and Surf matching methods after filtering and correction under stereo matching constraints) are shown in Figure 7. Comparing the number of matching points and the correct matching rate, the results are shown in Table 1. Accuracy means the proportion of correct matches to total detected matching points. It can be seen from the Figure 7 that the matching results of the other methods are concentrated in a certain area, while those of our method with the matching point pairs are densely and uniformly distributed throughout the image. Because the target localization adopts the average value of the coordinate position of the target area point, our method is better at improving the localization accuracy. As can be seen from the table, the number of matching points of our method is much higher than that of the other algorithms, and the accuracy is basically generally higher. The pipe matching accuracy is 2.96% lower than that of S-Fast, but the S-Fast matching only achieved 68 point pairs that are relatively concentrated, far lower than the 3406 point pairs of our method, and the accuracy of S-Fast in Play-Table is only 73.33%, which is 18.96% lower than ours. The accuracy in Teddy is 1.69% lower than that of F-Harris, but the accuracy of F-Harris in Pipes is only 45.33%. Therefore, compared to the other methods, the stereo deep matching in this paper has higher accuracy and stability, and the matching point pairs are evenly dense, which is more suitable for locating moving targets.
3.3. Experimental Results of the Real Stereo Images Pairs
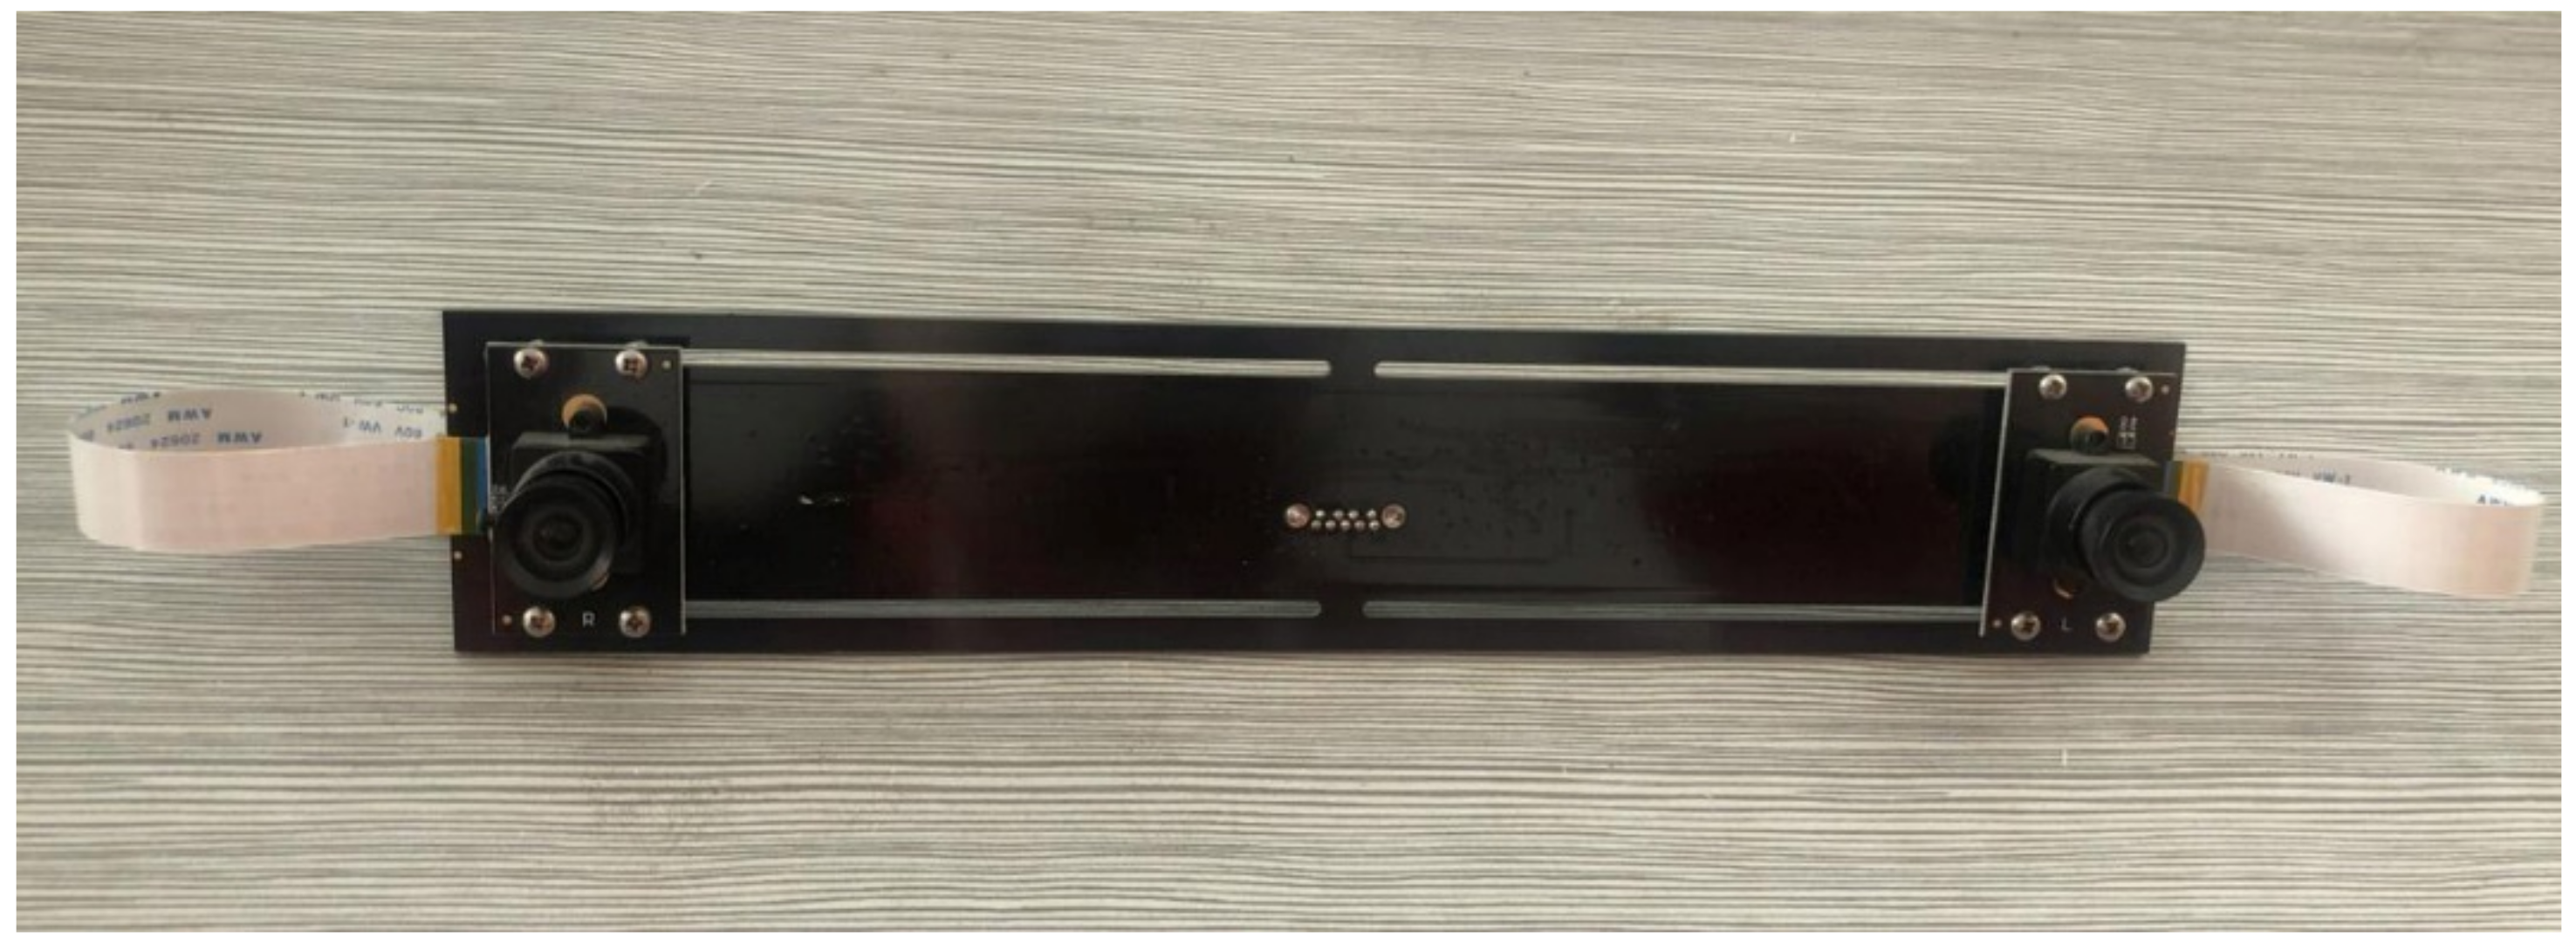
In this paper, the accuracy of localization was verified by calculating the position of the moving targets in the actual scenes, which mainly included comprehensive experiments of camera calibration, moving target detection and extraction, stereo image pairs, stereo deep matching, and target positioning. The initial image pair sequence was captured by 1280 × 720 pixels and 30 fps for pairs of left and right images and the parallel structure binocular camera consisted of two fixed-focus lenses. The image pairs data is captured by the stereo camera (shown in Figure 8). A Lenovo computer with an Intel Core i5 2.50 GHz processor processed the data, and the binocular camera communicated with the image processing computer through a usb3.0 line.
To obtain the correct localization, the binocular camera needs to be calibrated before stereo matching to rectify the image to be matched. In this paper, the binocular camera was calibrated using the MATLAB 2016b calibration toolbox to obtain the internal parameters , , , and and the external parameters R and t.
The experimental data were obtained using a binocular USB sensor with a resolution of 1280 × 720 to obtain the image sequence. First, the binocular camera was calibrated, and the internal parameter matrices of the left and right cameras were defined as and . Zhengyou Zhang’s calibration method measured the camera internal parameter matrix value of the binocular device in this experiment:
The translation matrix and translation vector were:
After calibration, the camera’s distortion parameters and the internal parameter matrix were used to correct the image.
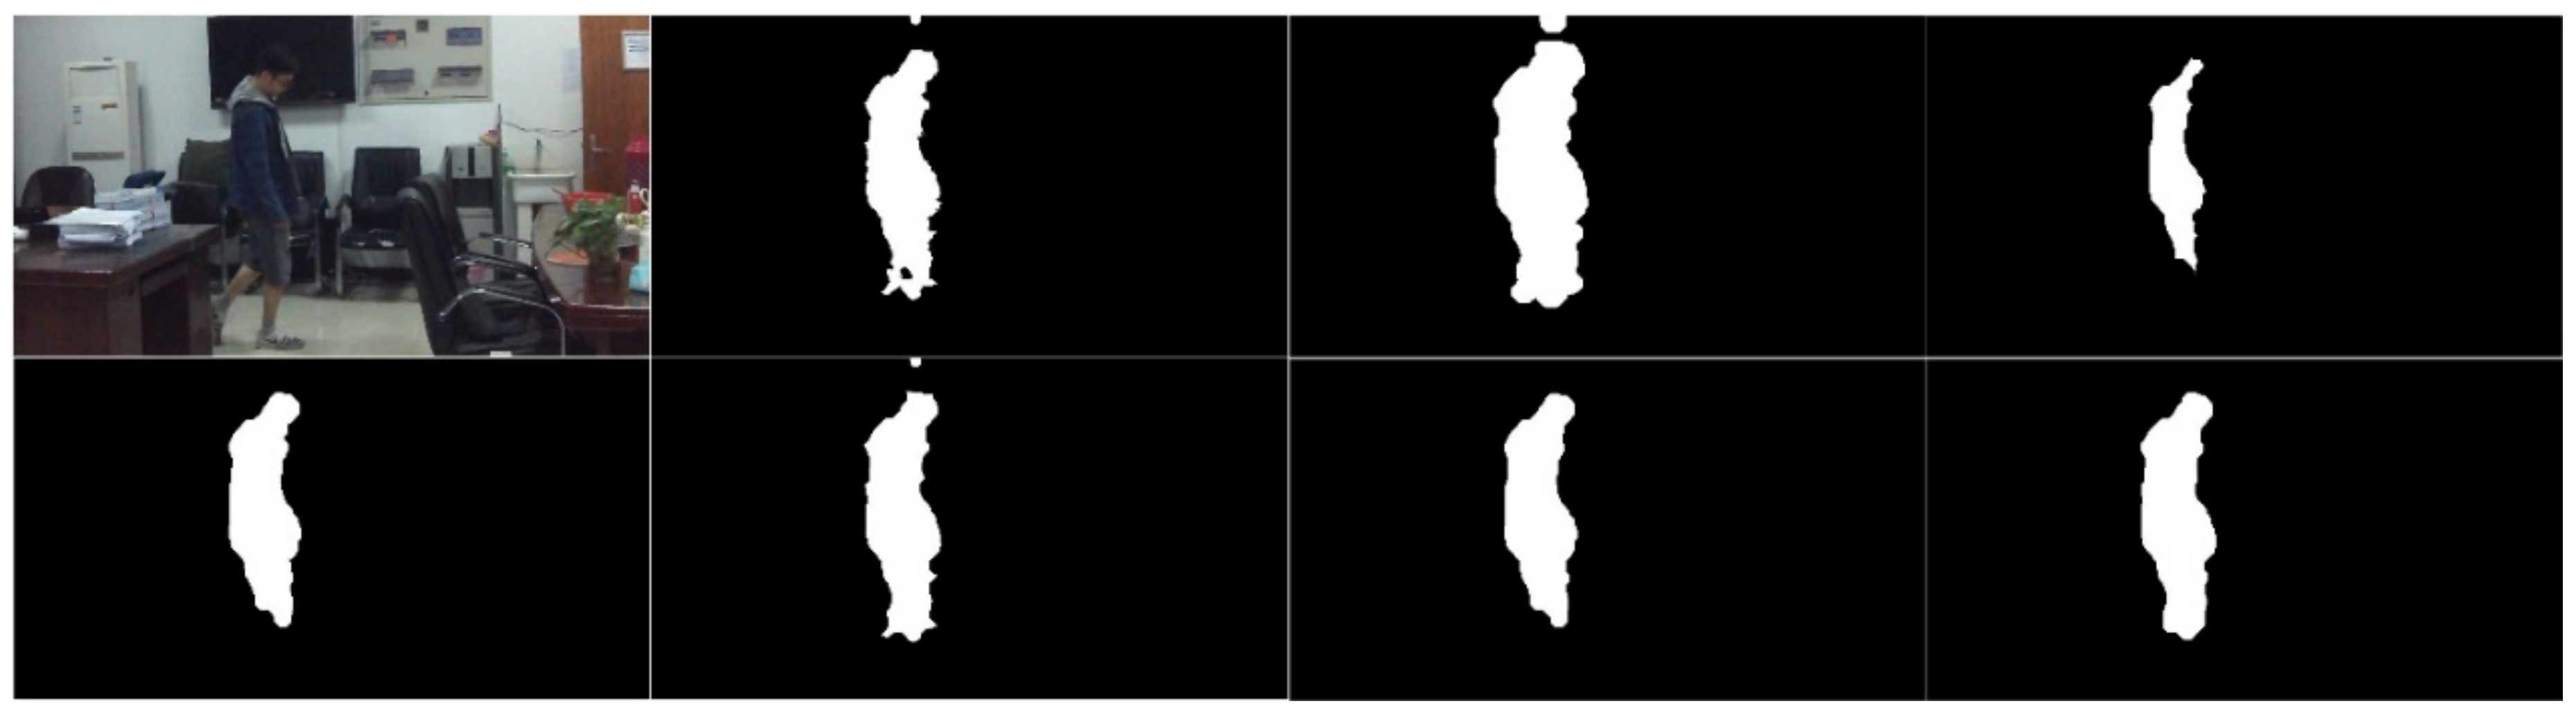
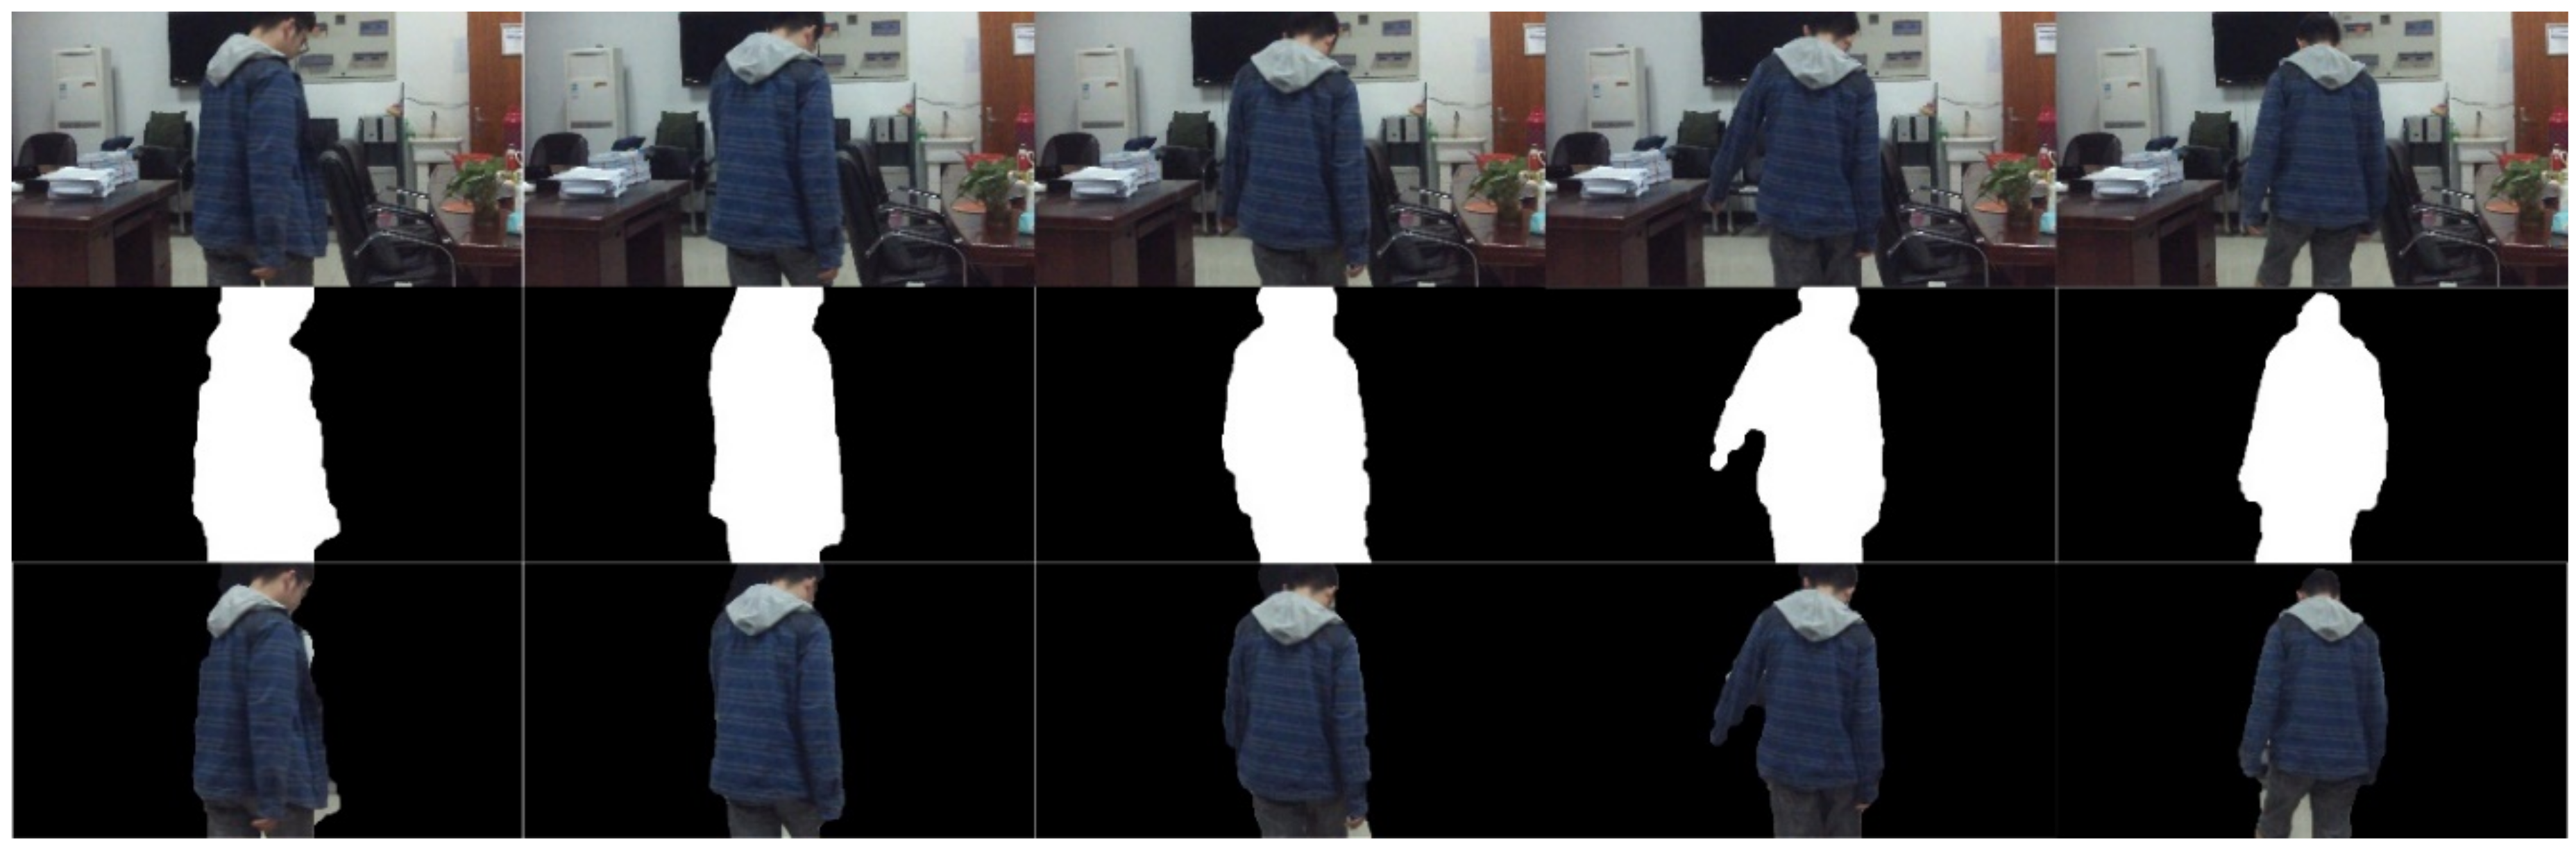
After pre-processing the acquired frame images, the optical flow field calculation of the improved large-shift HS optical flow method was combined with the Otsu binarization and first closing and then opening morphological operations to extract the target moving foreground. The target region extraction results are shown in Figure 9.
Then, stereo matching was performed on the corrected stereo image pair, and the moving target extraction area was combined to extract the stereo matching point pair of the moving target area. Then, the stereo matching results were compared to those of the Fast, Harris, Sift, and Surf stereo matching. As shown in Figure 10 and Table 2, Harris stereo matching did not detect matching point pairs in the moving target area in all 80–84 frame images; meanwhile, Fast stereo matching only detected one matching point in the 80th and 83rd image sequences, and the location of the detection point was in the upper half of the moving target area, which caused the measured y to be larger, and only two frames detected matching points in the target area. A large number of the matching point pairs detected by the Sift and Surf stereo matching algorithms were concentrated in a small area in the upper part of the target area. Most of the moving target areas could hardly detect the matching point pairs, which caused measurement errors. The error between the x and y values was large. The stereo matching algorithm in this paper achieved high robustness, even in the areas of repeated texture of the moving target, and the detected stereo matching point pairs of the target area were evenly distributed within the range of the moving target area, thereby obtaining more accurate coordinate values.
Finally, the three-dimensional coordinates of the stereo matching point pair were calculated according to the method in Section 2.2, and the center coordinates of the moving target area were obtained as the three-dimensional coordinate values of the target according to the centroid method. The left camera’s optical center point was the origin, parallel to the binocular camera baseline axis; the direction of the right camera was the positive x-axis direction, while the vertical binocular camera’s baseline axis was the y-axis positive direction, and the vertical camera plane was the z-axis positive direction, defining the three-dimensional coordinate value of the moving target. The results are shown in Table 3, the x and z values of actual coordinate were obtained by buried points, and the y values by setting the camera height to be consistent with a person’s center of gravity. The calculated coordinate was the three-dimensional coordinate value of the moving target obtained by the stereo matching point pair obtained by each stereo matching algorithm, while the actual coordinate was the coordinate obtained from the actual measurement. Additionally, the processing times are showing in Table 4. The experimental results proved that compared to the other matching algorithms, the robustness and accuracy are higher and can meet the requirement of actual localization.
4. Discussion and Conclusions
In this paper, a binocular parallel structure optical camera was used to acquire binocular image data for measuring the 3D localization information of moving objects. According to the image correction data, the range of the moving target area was detected by using the continuous frame image of the left camera, which overcame the problem of the distance extracted from the shadow area of the target detection being larger than the real distance. Finally, according to the principle of the stereo vision 3D coordinate measurement and the related calibration parameters, the matching points of the moving object region were calculated. Using the lattice data, the three-dimensional coordinate of moving objects was calculated by the heart shape method. The experiments showed that the proposed algorithm can realize the three-dimensional localization of moving targets with high precision and robustness.
The goal of our research was to improve the segmentation accuracy and stereo matching accuracy of moving targets to enhance the localization accuracy. The low localization accuracy of binocular parallel vision cameras was solved. Although our algorithm proved to be more accurate in indoor environments, its actual implementation may need more research. First of all, the algorithm was not effective because the extraction of the optical flow field based on the HS method takes a long time. We will explore how to improve the efficiency of producing high-precision optical flow fields in subsequent studies. Second, we plan to build a stereo vision system for moving target orientation based on our algorithm. Finally, we plan to conduct orientation studies in complex indoor environments such as shopping malls, museums and galleries.
Author Contributions
Conceptualization, Zhigang Yan; Data curation, Jing Ding; Formal analysis, Jing Ding; Methodology, Jing Ding; Resources, Zhigang Yan; Validation, Jing Ding; Writing—original draft, Jing Ding; Writing—review & editing, Xuchen We. All authors have read and agreed to the published version of the manuscript.
Funding
This research was supported by National Natural Science Foundation of China (NSFC) (grant number 41971370) and the National Key R&D Program of China (grant number 2017YFE0119600).
Data Availability Statement
The general Middlebury Stereo Dataset is provided in https://vision.middlebury.edu/stereo/data/. The MPI Sintel Flow Dataset can be found in http://sintel.is.tue.mpg.de/. The data used to support the findings of this study are available from the corresponding author upon request.
Acknowledgments
The authors wish to thank the anonymous reviewers for their valuable suggestions.
Conflicts of Interest
The authors declare no conflict of interest.
References
- Zafari, F.; Gkelias, A.; Leung, K.K. A Survey of Indoor Localization Systems and Technologies. IEEE Commun. Surv. Tutorials 2019, 21, 2568–2599. [Google Scholar] [CrossRef] [Green Version]
- Yassin, A.; Nasser, Y.; Awad, M.; Al-Dubai, A.; Liu, R.; Yuen, C.; Raulefs, R.; Aboutanios§, E. Recent Advances in Indoor Localization: A Survey on Theoretical Approaches and Applications. IEEE Commun. Surv. Tutorials 2017, 19, 1327–1346. [Google Scholar] [CrossRef] [Green Version]
- Furfari, F. What is next for indoor localisation? Taxonomy, protocols, and patterns for advanced location based services. In Proceedings of the 2019 International Conference on Indoor Positioning and Indoor Navigation (IPIN), Pisa, Italy, 30 September–3 October 2019. [Google Scholar]
- Kim, J.; Jun, H. Vision-based location positioning using augmented reality for indoor navigation. IEEE Trans. Consum. Electron. 2008, 54, 954–962. [Google Scholar] [CrossRef]
- Teuliere, C.; Marchand, E.; Eck, L. 3-D Model-Based Tracking for UAV Indoor Localization. IEEE Trans. Cybern. 2014, 45, 869–879. [Google Scholar] [CrossRef] [PubMed] [Green Version]
- Barsocchi, P. Evaluating AAL solutions through competitive benchmarking: The localization competition. IEEE Pervasive Comput. Mag. 2013, 12, 72–79. [Google Scholar] [CrossRef]
- Daoudagh, S.P.; Barsocchi, B.; Eda, M. A Privacy-By-Design Architecture for Indoor Localization Systems. In Proceedings of the Quality of Information and Communications Technology: 13th International Conference, QUATIC 2020, Faro, Portugal, 9–11 September 2020; Springer Nature: Berlin/Heidelberg, Germany, 2020. [Google Scholar]
- Manzo, M. Graph-Based Image Matching for Indoor Localization. Mach. Learn. Knowl. Extr. 2019, 1, 46. [Google Scholar] [CrossRef] [Green Version]
- Potortì, F. Evaluation of indoor localisation systems: Comments on the ISO/IEC 18305 standard. In Proceedings of the 2018 International Conference on Indoor Positioning and Indoor Navigation (IPIN), Nantes, France, 24–27 September 2018. [Google Scholar]
- Zampella, F.; Ruiz, A.R.J.; Granja, F.S. Indoor Positioning Using Efficient Map Matching, RSS Measurements, and an Improved Motion Model. IEEE Trans. Veh. Technol. 2015, 64, 1304–1317. [Google Scholar] [CrossRef]
- Potortì, F.; Crivello, A.; Girolami, M.; Barsocchi, P.; Traficante, E. Localising crowds through Wi-Fi probes. Ad Hoc Networks 2018, 75–76, 87–97. [Google Scholar] [CrossRef]
- Wang, D.; Wang, T.; Zhao, F.; Zhang, X. Improved Graph-Based Semi-Supervised Learning for Fingerprint-Based Indoor Localization. In Proceedings of the 2018 IEEE Global Communications Conference (GLOBECOM), Abu Dhabi, United Arab Emirates, 9–13 December 2018; pp. 1–6. [Google Scholar]
- Potorti, F.; Park, S.; Crivello, A.; Palumbo, F.; Girolami, M.; Barsocchi, P.; Lee, S.; Torres-Sospedra, J.; Ruiz, A.R.J.; Perez-Navarro, A.; et al. The IPIN 2019 Indoor Localisation Competition—Description and Results. IEEE Access 2020, 8, 206674–206718. [Google Scholar] [CrossRef]
- Lee, T.-J.; Kim, C.-H.; Cho, D.-I.D. A Monocular Vision Sensor-Based Efficient SLAM Method for Indoor Service Robots. IEEE Trans. Ind. Electron. 2018, 66, 318–328. [Google Scholar] [CrossRef]
- Wang, C.; Zou, X.; Tang, Y.; Luo, L.; Feng, W. Localisation of litchi in an unstructured environment using binocular stereo vision. Biosyst. Eng. 2016, 145, 39–51. [Google Scholar] [CrossRef]
- Zheng, L.-W.; Chang, Y.-H.; Li, Z.-Z. A study of 3D feature tracking and localization using a stereo vision system. In Proceedings of the 2010 International Computer Symposium (ICS2010), Tainan, Taiwan, 16–18 December 2010; pp. 402–407. [Google Scholar]
- Zhang, Y.; Su, Y.; Yang, J.; Ponce, J.; Kong, H. When Dijkstra Meets Vanishing Point: A Stereo Vision Approach for Road Detection. IEEE Trans. Image Process. 2018, 27, 2176–2188. [Google Scholar] [CrossRef]
- Shi, Q.; Li, C.; Wang, C.; Luo, H.; Huang, Q.; Fukuda, T. Design and implementation of an omnidirectional vision system for robot perception. Mechatronics 2017, 41, 58–66. [Google Scholar] [CrossRef]
- Yang, L.; Wang, B.; Zhang, R.; Zhou, H.; Wang, R. Analysis on location accuracy for the binocular stereo vision system. IEEE Photonics J. 2017, 10, 1–16. [Google Scholar] [CrossRef]
- Wedel, T.; Pock, C.; Zach, H.; Bischof, D.C. An improved algorithm for TV-L1 optical flow. In Statistical and Geometrical Approaches to Visual Motion Analysis; Springer: Berlin/Heidelberg, Germany, 2009. [Google Scholar]
- Schuster, G.M.; Katsaggelos, A.K. A theory for the optimal bit allocation between displacement vector field and displaced frame difference. IEEE J. Sel. Areas Commun. 1997, 15, 1739–1751. [Google Scholar] [CrossRef]
- Fathy, M.; Siyal, M.Y. An image detection technique based on morphological edge detection and background differencing for real-time traffic analysis. Pattern Recognit. Lett. 1995, 16, 1321–1330. [Google Scholar] [CrossRef]
- Zhang, C.; Chen, Z.; Wang, M.; Li, M.; Jiang, S. Robust Non-Local TV-L1 Optical Flow Estimation with Occlusion Detection. IEEE Trans. Image Process. 2017, 26, 4055–4067. [Google Scholar] [CrossRef]
- Chen, J.; Cai, Z.; Lai, J.; Xie, X. Efficient Segmentation-Based PatchMatch for Large Displacement Optical Flow Estimation. IEEE Trans. Circuits Syst. Video Technol. 2018, 29, 3595–3607. [Google Scholar] [CrossRef]
- Li, Z.; Wang, K.; Zuo, W.; Meng, D.; Zhang, L. Detail-preserving and content-aware variational multi-view stereo reconstruction. IEEE Trans. Image Process. 2015, 25, 864–877. [Google Scholar] [CrossRef] [Green Version]
- Dollar, P.; Appel, R.; Belongie, S.; Perona, P. Fast Feature Pyramids for Object Detection. IEEE Trans. Pattern Anal. Mach. Intell. 2014, 36, 1532–1545. [Google Scholar] [CrossRef] [Green Version]
- Harris, C.; Stephens, M. A combined corner and edge detector. In Proceedings of the Alvey Vision Conference, Manchester, UK, 15–17 September 1988; Volume 15, pp. 147–151. [Google Scholar]
- Lowe, D.G. Distinctive Image Features from Scale-Invariant Keypoints. Int. J. Comput. Vis. 2004, 60, 91–110. [Google Scholar] [CrossRef]
- Bay, H.; Tuytelaars, T.; Van Gool, L. Surf: Speeded up robust features. In European Conference on Computer Vision; Springer: Berlin/Heidelberg, Germany, 2006; pp. 404–417. [Google Scholar]
- Chen, J.; Xu, W.; Xu, H.; Lin, F.; Sun, Y.; Shi, X. Fast Vehicle Detection Using a Disparity Projection Method. IEEE Trans. Intell. Transp. Syst. 2017, 19, 2801–2813. [Google Scholar] [CrossRef]
- Basaru, R.R.; Child, C.; Alonso, E.; Slabaugh, G. Data-driven recovery of hand depth using CRRF on stereo images. IET Comput. Vis. 2018, 12, 666–678. [Google Scholar] [CrossRef]
- Ttofis, C.; Kyrkou, C.; Theocharides, T. A low-cost real-time embedded stereo vision system for accurate disparity estimation based on guided image filtering. IEEE Trans. Comput. 2015, 65, 2678–2693. [Google Scholar] [CrossRef]
- Yang, Y.; Meng, X.; Gao, M. Vision System of Mobile Robot Combining Binocular and Depth Cameras. J. Sensors 2017, 2017, 1–11. [Google Scholar] [CrossRef]
- Zhang, C.; Chen, Z.; Wang, M.; Li, M.; Jiang, S. Motion Occlusion Detecting from Image Sequence Based on Optical Flow and Delaunay Triangulation. Acta Electron. Sin. 2018, 46, 479–485. [Google Scholar]
- Otsu, N. A threshold selection method from gray-level histograms. IEEE Trans. Syst. Man Cybern. 1979, 9, 62–66. [Google Scholar] [CrossRef] [Green Version]
- Kennedy, R.; Taylor, C.J. Optical flow with geometric occlusion estimation and fusion of multiple frames. In International Workshop on Energy Minimization Methods in Computer Vision and Pattern Recognition; Springer: Cham, Switzerland, 2015; pp. 364–377. [Google Scholar]
- Weickert, J.; Weickert, J. Theoretical Foundations of Anisotropic Diffusion in Image Processing; Springer Science and Business Media LLC: Berlin, Germany, 1996. [Google Scholar]
- Revaud, J.; Weinzaepfel, P.; Harchaoui, Z.; Schmid, C. DeepMatching: Hierarchical Deformable Dense Matching. Int. J. Comput. Vis. 2016, 120, 300–323. [Google Scholar] [CrossRef] [Green Version]
- Weinzaepfel, P.; Revaud, J.; Harchaoui, Z.; Schmid, C. DeepFlow: Large displacement optical flow with deep matching. In Proceedings of the IEEE International Conference on Computer Vision, Sydney, Australia, 2–8 December 2013; pp. 1385–1392. [Google Scholar]
- Dalal, N.; Triggs, B. Histograms of oriented gradients for human detection. In Proceedings of the 2005 IEEE Computer Society Conference on Computer Vision and Pattern Recognition CVPR, San Diego, CA, USA, 20–25 June 2005. [Google Scholar]
- Butler, D.J.; Wulff, J.; Stanley, G.B.; Black, M.J. A naturalistic open source movie for optical flow evaluation. In European Conference on Computer Vision; Springer: Berlin/Heidelberg, Germany, 2012; pp. 611–625. [Google Scholar]
- Bouguet, J.Y. Pyramidal implementation of the affine lucas kanade feature tracker description of the algorithm. Intel Corp. 2001, 5, 1–10. [Google Scholar]
- Horn, B.K.P.; Schunck, B.G. Determining optical flow. Artif. Intell. 1981, 17, 185–203. [Google Scholar] [CrossRef] [Green Version]
- Black, M.J.; Anandan, P. The robust estimation of multiple motions: Parametric and piecewise-smooth flow fields. Comput. Vis. Image Underst. 1996, 63, 75–104. [Google Scholar] [CrossRef]
- Brox, T.; Bruhn, A.; Papenberg, N. High accuracy optical flow estimation based on a theory for warping. In European Conference on Computer Vision; Springer: Berlin/Heidelberg, Germany, 2004; pp. 25–36. [Google Scholar]
- Scharstein, D.; Hirschmüller, H.; Kitajima, Y.; Krathwohl, G.; Nešić, N.; Wang, X.; Westling, P. High-resolution stereo datasets with subpixel-accurate ground truth. In German Conference on Pattern Recognition; Springer: Cham, Switzerland, 2014; pp. 31–42. [Google Scholar]
Figure 1.
Moving target recognition and localization method framework. O-DHS—Otsu Delaunay Horn–Schunck method.
Figure 1.
Moving target recognition and localization method framework. O-DHS—Otsu Delaunay Horn–Schunck method.

Figure 2.
The binocular stereo vision localization model.

Figure 3.
XOZ projection surface of the binocular stereo localization model.

Figure 4.
From left to right, top to bottom: Current frame image, moving target foreground area extracted by the optical flow method with Otsu binarization, target foreground area extracted by expansion operation, corrosion operation, open operation, closed operation, first open then close operation, and first close then open operation.

Figure 5.
The MPI image sequence motion foreground extraction results, from top to bottom, are alley, market, ambush, and bamboo image sequence, and from left to right are the current frame image, the real motion foreground target area, LK, HS pyramid, Black and Anandan (B&A), Brox, and our motion extraction res ults.

Figure 6.
The MPI image sequence motion foreground target detection result error comparison results: (a) A comparison of the omission rate; (b) a comparison of the false rate.
Figure 6.
The MPI image sequence motion foreground target detection result error comparison results: (a) A comparison of the omission rate; (b) a comparison of the false rate.

Figure 7.
Middlebury Stereo Datasets stereo matching results. (a) From left to right are the Adirondack, Motorcycle, Piano and Pipes stereo image pairs; (b) from left to right are the PlayTable, Recycle, Teddy and Vintage stereo image pairs; (a,b) from top to bottom are the stereo image pair, stereo-Fast, stereo-Harris, stereo-Sift, stereo-Surf, and stereo deep matching results.

Figure 8.
Parallel structure of the binocular camera.

Figure 9.
The target area extraction results of 80~84 frames. From top to bottom are the corrected images, the moving target binarized image extracted by the target detection method in this paper, the superimposed display of the binarized image, and the corrected image.
Figure 9.
The target area extraction results of 80~84 frames. From top to bottom are the corrected images, the moving target binarized image extracted by the target detection method in this paper, the superimposed display of the binarized image, and the corrected image.

Figure 10.
Matching results of the stereo point pairs in the moving target area of the 80~84 frames. From top to bottom are the corrected stereo image pairs of the 80~84 frames of (a) S-Fast, (b) S-Harris, (c) S-Sift, (d) S-Surf and (e) our target matching results.
Figure 10.
Matching results of the stereo point pairs in the moving target area of the 80~84 frames. From top to bottom are the corrected stereo image pairs of the 80~84 frames of (a) S-Fast, (b) S-Harris, (c) S-Sift, (d) S-Surf and (e) our target matching results.


Table 1.
Stereo matching results.
| Method | Adirondack | Motorcycle | Piano | Pipes | ||||
| Sum * | Accuracy ** | Sum | Accuracy | Sum | Accuracy | Sum | Accuracy | |
| S-Fast | 70 | 85.71% | 179 | 92.74% | 52 | 80.77% | 68 | 89.71% |
| S-Harris | 71 | 85.92% | 198 | 93.94% | 81 | 86.42% | 225 | 45.33% |
| S-Sift | 416 | 74.51% | 800 | 85.75% | 359 | 75.21% | 735 | 79.73% |
| S-Surf | 100 | 76.00% | 428 | 89.50% | 115 | 78.26% | 200 | 74.50% |
| Ours | 3357 | 95.17% | 4101 | 93.47% | 3393 | 88.71% | 3406 | 86.76% |
| Method | Play Table | Recycle | Teddy | Vintage | ||||
| Sum | Accuracy | Sum | Accuracy | Sum | Accuracy | Sum | Accuracy | |
| S-Fast | 75 | 73.33% | 29 | 82.76% | 76 | 89.47% | 100 | 95.00% |
| S-Harris | 96 | 87.5% | 53 | 90.57% | 132 | 95.45% | 87 | 91.95% |
| S-Sift | 192 | 77.42% | 158 | 75.95% | 368 | 81.52% | 1139 | 71.38% |
| S-Surf | 102 | 80.73% | 82 | 76.83% | 145 | 86.21% | 173 | 90.75% |
| Ours | 2840 | 92.29% | 3137 | 94.52% | 1970 | 93.76% | 2690 | 91.82% |
* Sum, number of detected matching points; ** Accuracy, accuracy rate.
Table 2.
The number of detected matching point pairs in the moving target area.
| Method | Number of Moving Target Matching Points | ||||
|---|---|---|---|---|---|
| No.80 | No.81 | N0.82 | No.83 | No.84 | |
| S-Fast | 1 | / | / | 1 | / |
| S-Harris | / | / | / | / | / |
| S-Sift | 20 | 33 | 32 | 18 | 29 |
| S-Surf | 25 | 24 | 24 | 22 | 32 |
| Ours | 1510 | 1562 | 1566 | 1553 | 1313 |
Table 3.
The experimental results of the three-dimensional coordinates of the moving objects and error comparison.
Table 3.
The experimental results of the three-dimensional coordinates of the moving objects and error comparison.
| Frame Number | Moving Target Coordinates (cm) (x, y, z) | |||
|---|---|---|---|---|
| Method | Calculated Coordinate | Actual Coordinate | Error | |
80 | S-Fast | (−3.89, −15.65, 93.08) | (−2.50, 0.00, 92.00) | (−1.39, −15.65, 1.08) |
| S-Harris | / | / | ||
| S-Sift | (−1.65, −12.28, 92.45) | (0.85, −12.28, 0.45) | ||
| S-Surf | (−1.15, −11.85, 85,67) | (1.35, −11.85, −6.33) | ||
| Ours | (−2.56, 0.16, 92.53) | (−0.06, 0.16, 0.53) | ||
81 | S-Fast | / | (−2.00, 0.00, 94.00) | / |
| S-Harris | / | / | ||
| S-Sift | (−2.20, −10.05, 91.31) | (−0.20, −10.05, −2.69) | ||
| S-Surf | (−2.43, −9.34, 95.33) | (−0.43, −9.34, 1.33) | ||
| Ours | (−1.98, −0.72, 93.43) | (0.02, −0.72, 0.47) | ||
82 | S-Fast | / | (−0.50, 0.00, 96.00) | / |
| S-Harris | / | / | ||
| S-Sift | (1.24, −11.68, 94.57) | (1.74, −11.68, 1.43) | ||
| S-Surf | (−0.31, −12.42, 94.30) | (0.19, −12.42, −1.70) | ||
| Ours | (−0.54, −0.17, 96.03) | (−0.04, −0.17, 0.03) | ||
83 | S-Fast | (−5.14, −13.84, 97.27) | (−5.14, −13.84, −0.73) | |
| S-Harris | / | / | ||
| S-Sift | (−0.79, −9.77, 96.25) | (0.00, 0.00, 98.00) | (−0.79, −9.77, −1.75) | |
| S-Surf | (2.91, −11.21, 96.20) | (2.91, −11.21, −1.80) | ||
| Ours | (0.02, −0.60, 97.63) | (0.02, −0.60, −0.39) | ||
84 | S-Fast | / | (−1.50, 0.00, 102.00) | / |
| S-Harris | / | / | ||
| S-Sift | (−0.94, −8.28, 100.98) | (0.56, −8.28, −1.02) | ||
| S-Surf | (−0.79, −9.81, 97.21) | (0.71, −9.81, −4.79) | ||
| Ours | (−1.21, 0.10, 102.42) | (0.29, 0.10, 0.42) | ||
Table 4.
Processing time.
| Frame Number | Time/s |
|---|---|
| 80 | 17.417424 |
| 81 | 17.641515 |
| 82 | 17.245382 |
| 83 | 17.139895 |
| 84 | 17.298870 |
Publisher’s Note: MDPI stays neutral with regard to jurisdictional claims in published maps and institutional affiliations. |
© 2021 by the authors. Licensee MDPI, Basel, Switzerland. This article is an open access article distributed under the terms and conditions of the Creative Commons Attribution (CC BY) license (https://creativecommons.org/licenses/by/4.0/).
Share and Cite
MDPI and ACS Style
Ding, J.; Yan, Z.; We, X. High-Accuracy Recognition and Localization of Moving Targets in an Indoor Environment Using Binocular Stereo Vision. ISPRS Int. J. Geo-Inf. 2021, 10, 234. https://doi.org/10.3390/ijgi10040234
AMA Style
Ding J, Yan Z, We X. High-Accuracy Recognition and Localization of Moving Targets in an Indoor Environment Using Binocular Stereo Vision. ISPRS International Journal of Geo-Information. 2021; 10(4):234. https://doi.org/10.3390/ijgi10040234
Chicago/Turabian StyleDing, Jing, Zhigang Yan, and Xuchen We. 2021. "High-Accuracy Recognition and Localization of Moving Targets in an Indoor Environment Using Binocular Stereo Vision" ISPRS International Journal of Geo-Information 10, no. 4: 234. https://doi.org/10.3390/ijgi10040234
Note that from the first issue of 2016, this journal uses article numbers instead of page numbers. See further details here.