
Design and Conceptual Proposal of an Intelligent Clinical Decision Support System for the Diagnosis of Suspicious Obstructive Sleep Apnea Patients from Health Profile
 , , , , and
Abstract
:1. Introduction
2. Materials and Methods
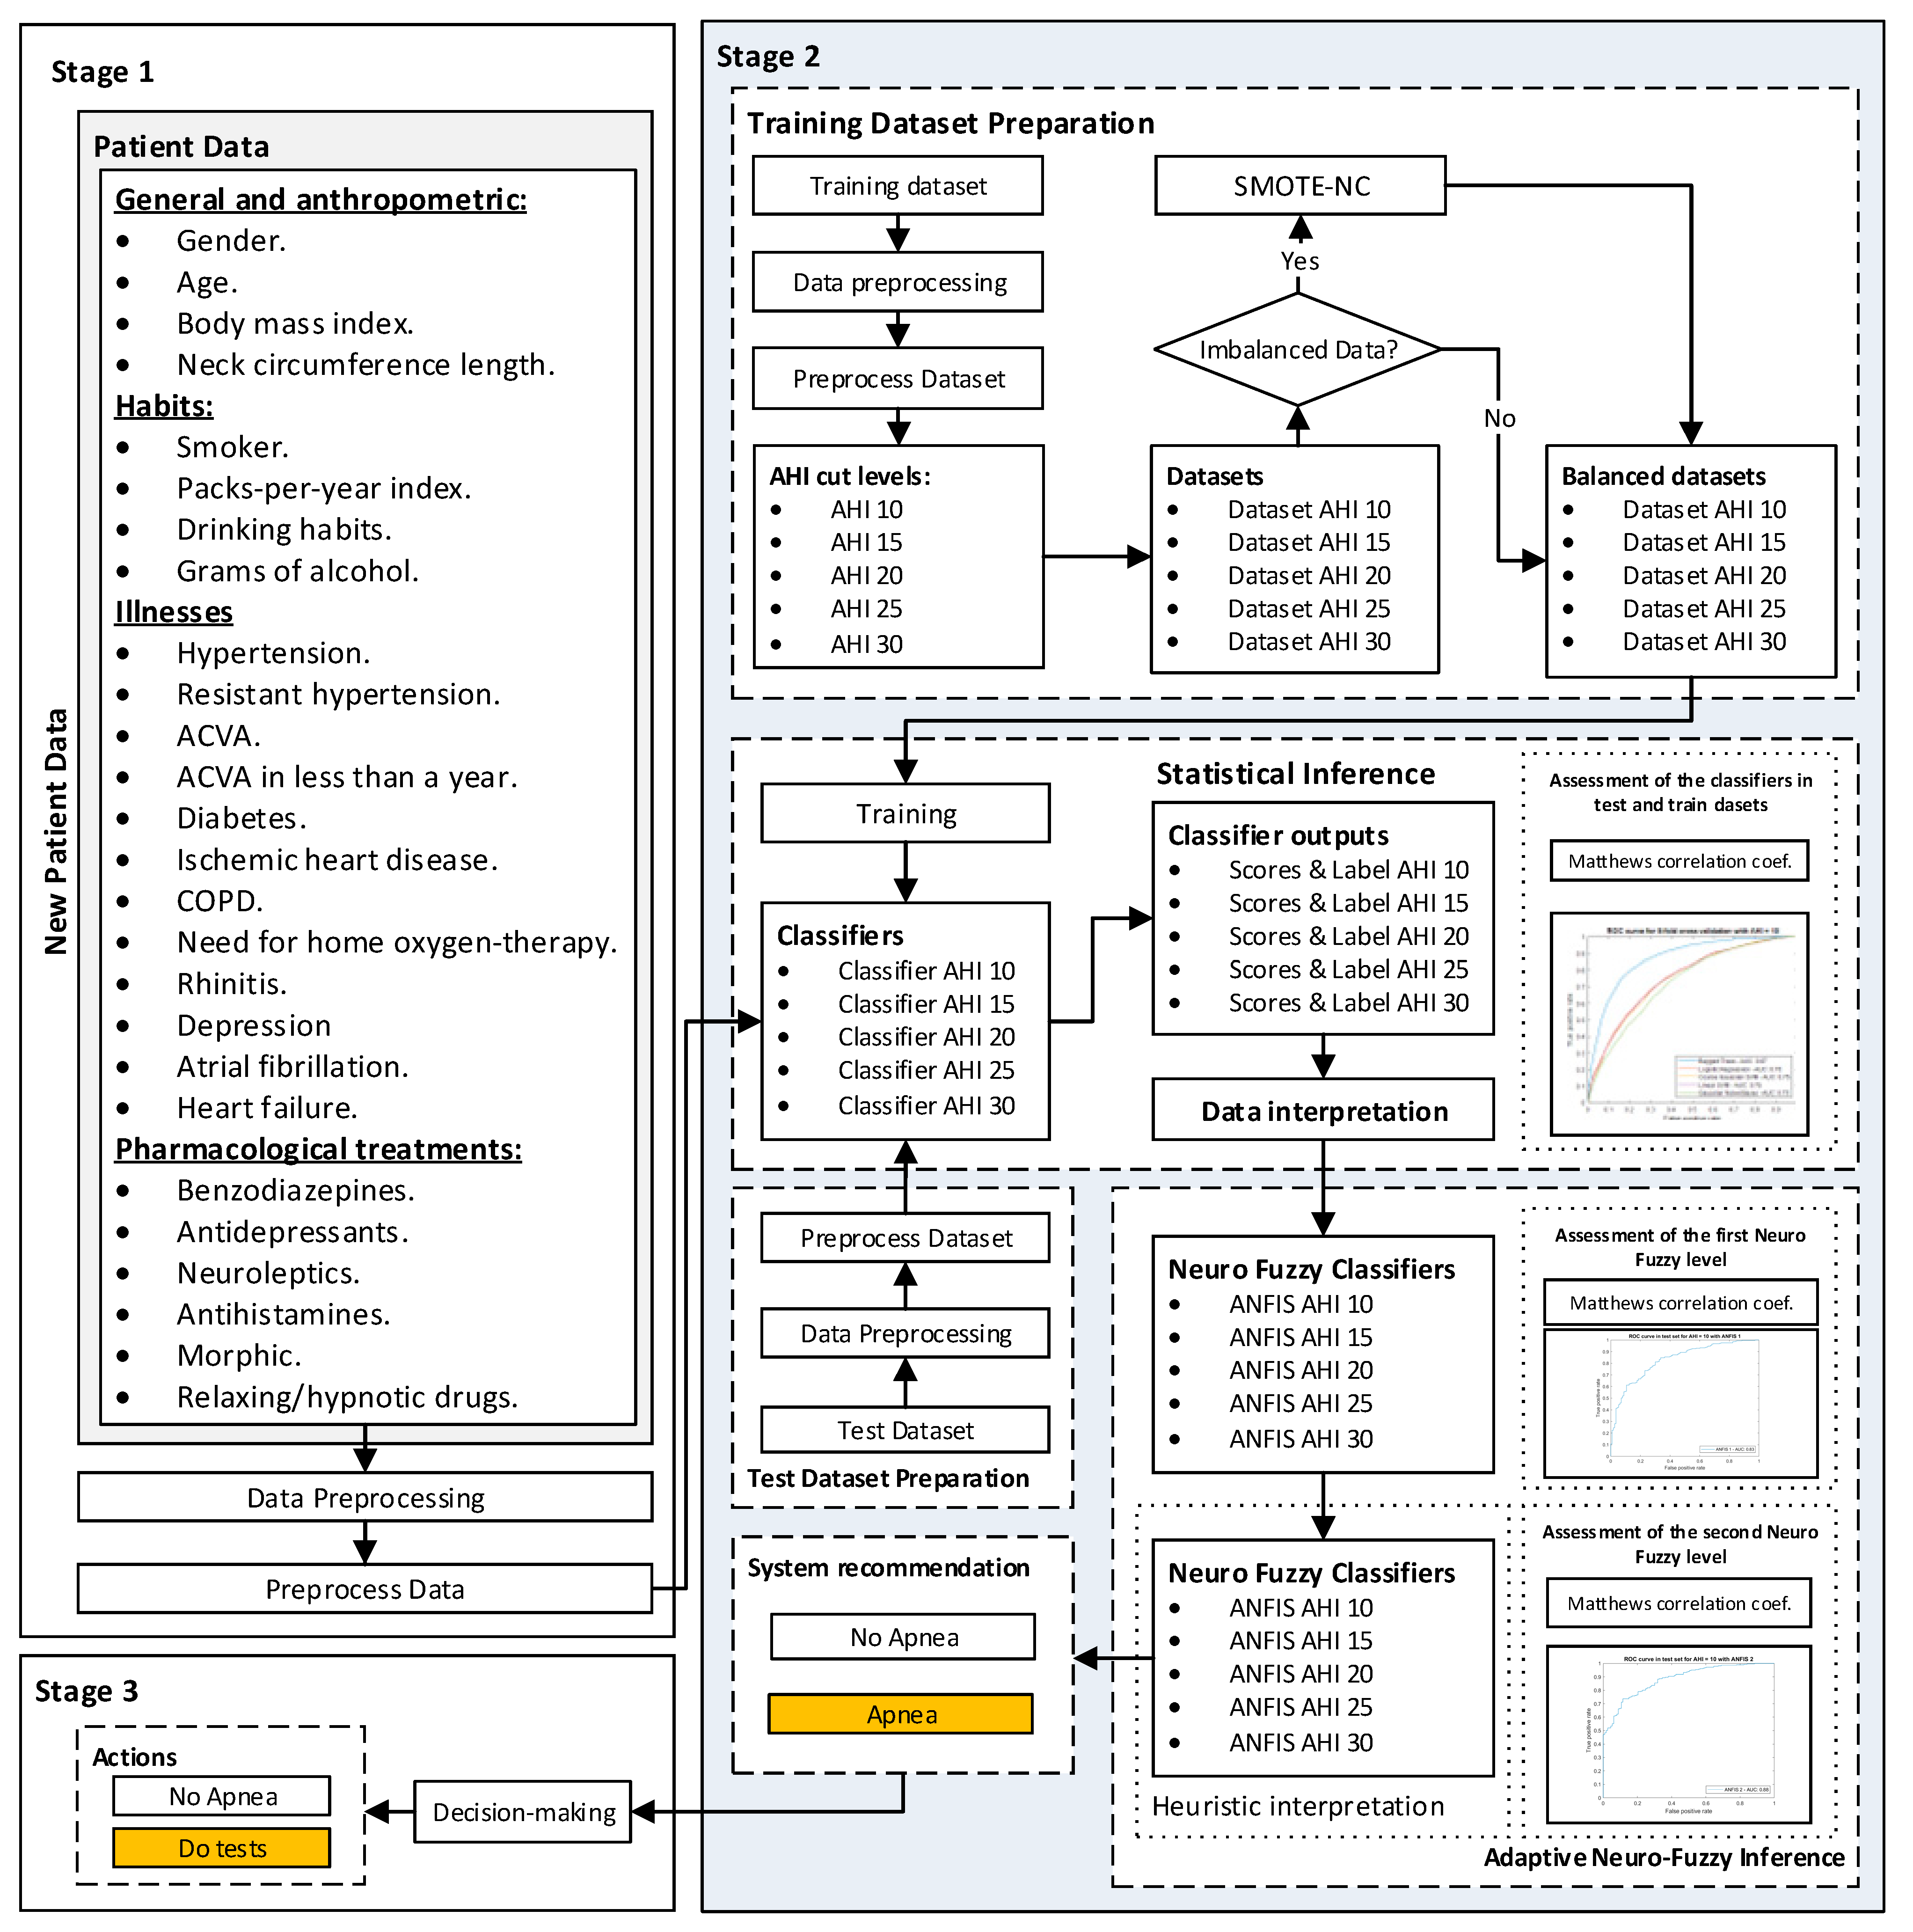
2.1. Definition of the System
2.1.1. Database Use
2.1.2. Conceptual Design and Description of the System
Stage 1: Collection of Patient Information
Stage 2: Data Processing
Stage 3: Generation of Alerts and Decision-Making
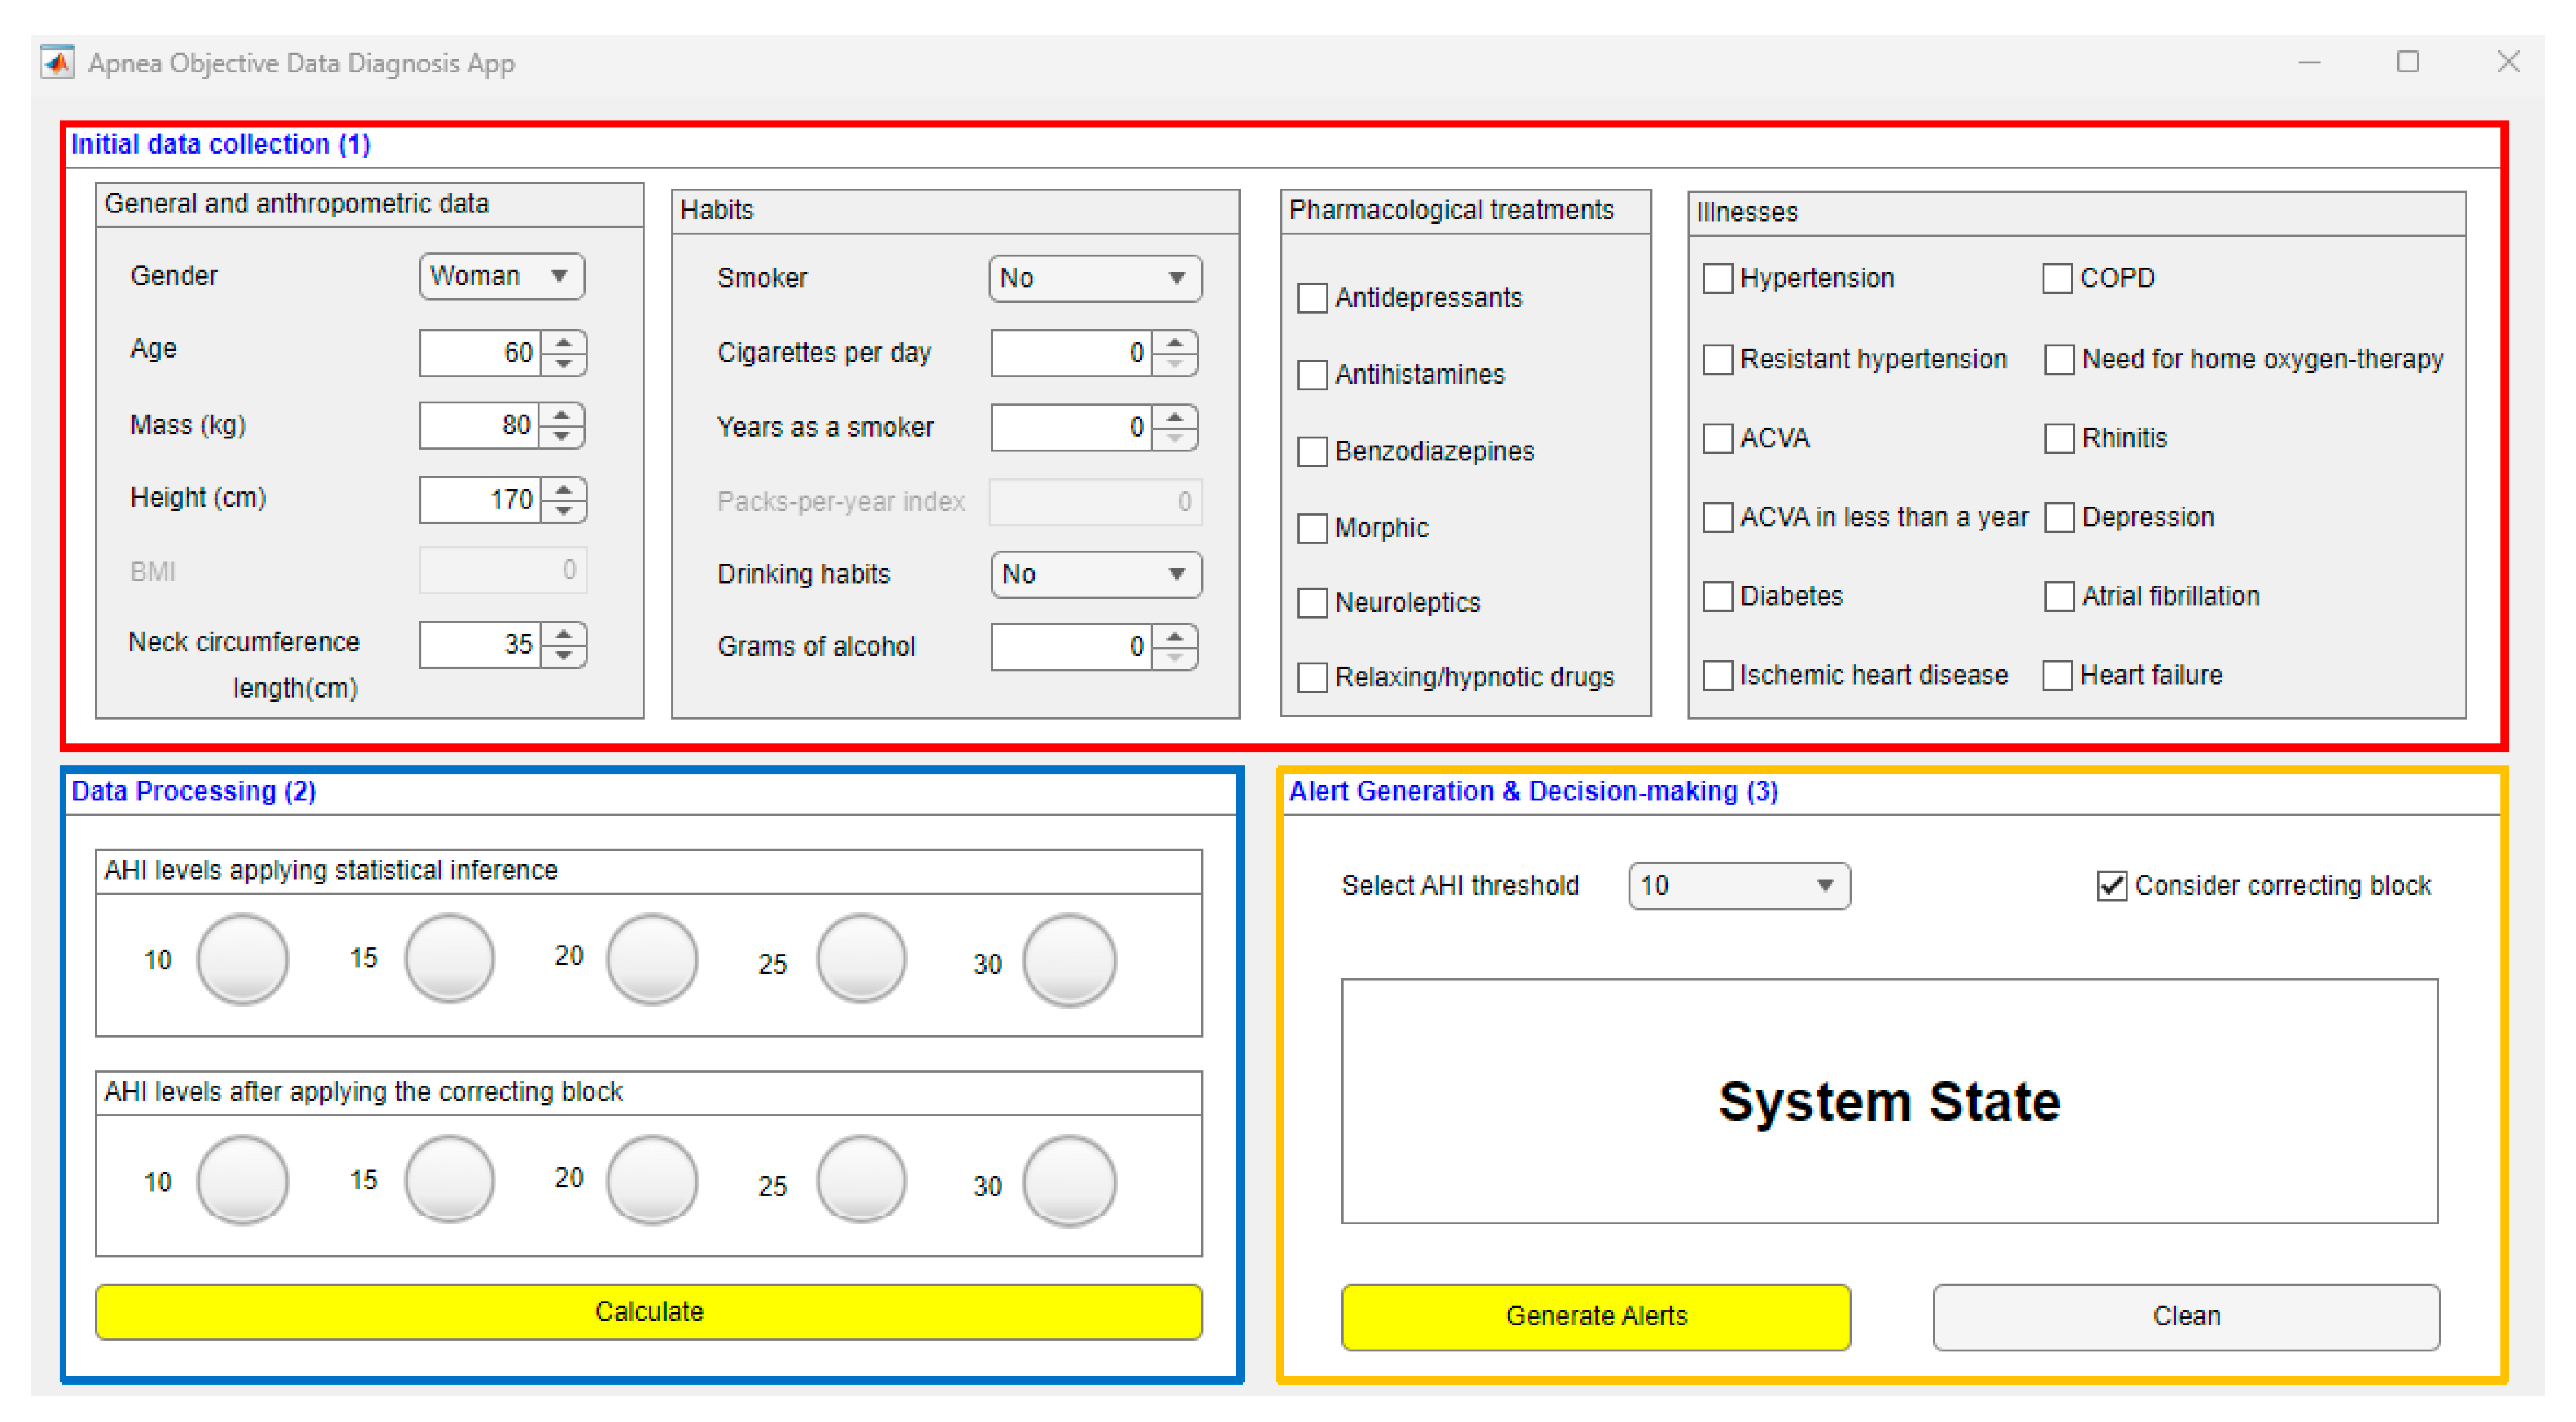
2.2. Implementation of the System
2.2.1. Data Collection
2.2.2. Data Processing
Preparation of the Training Dataset
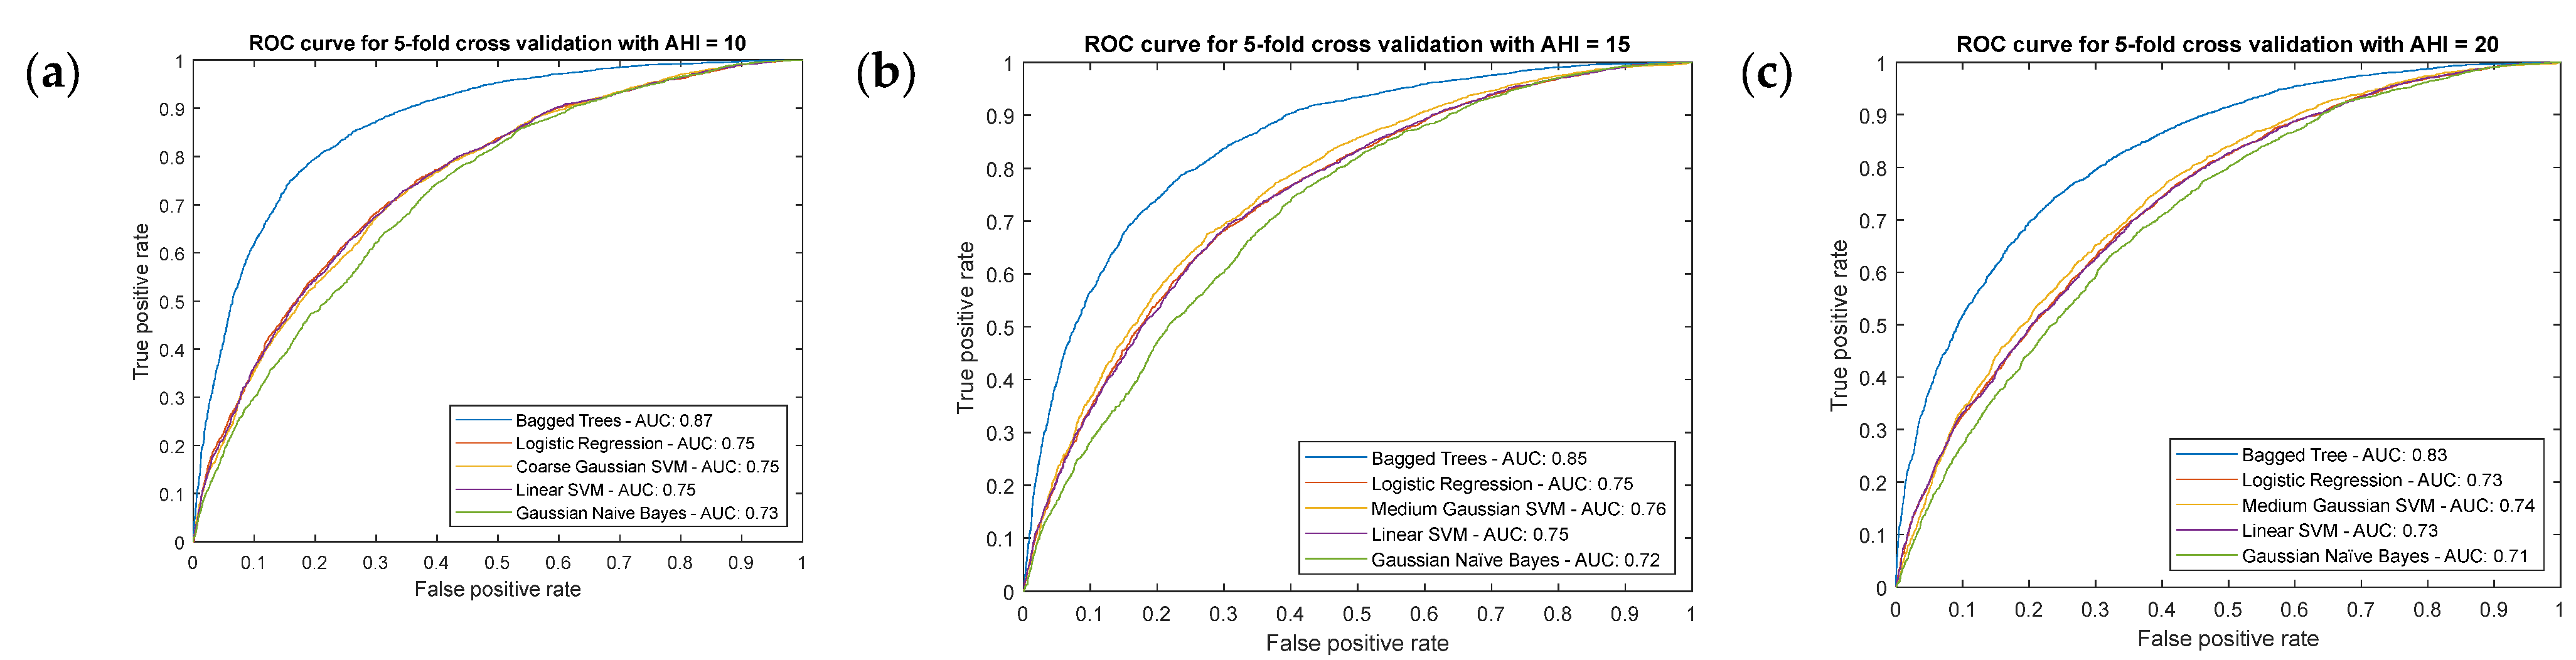
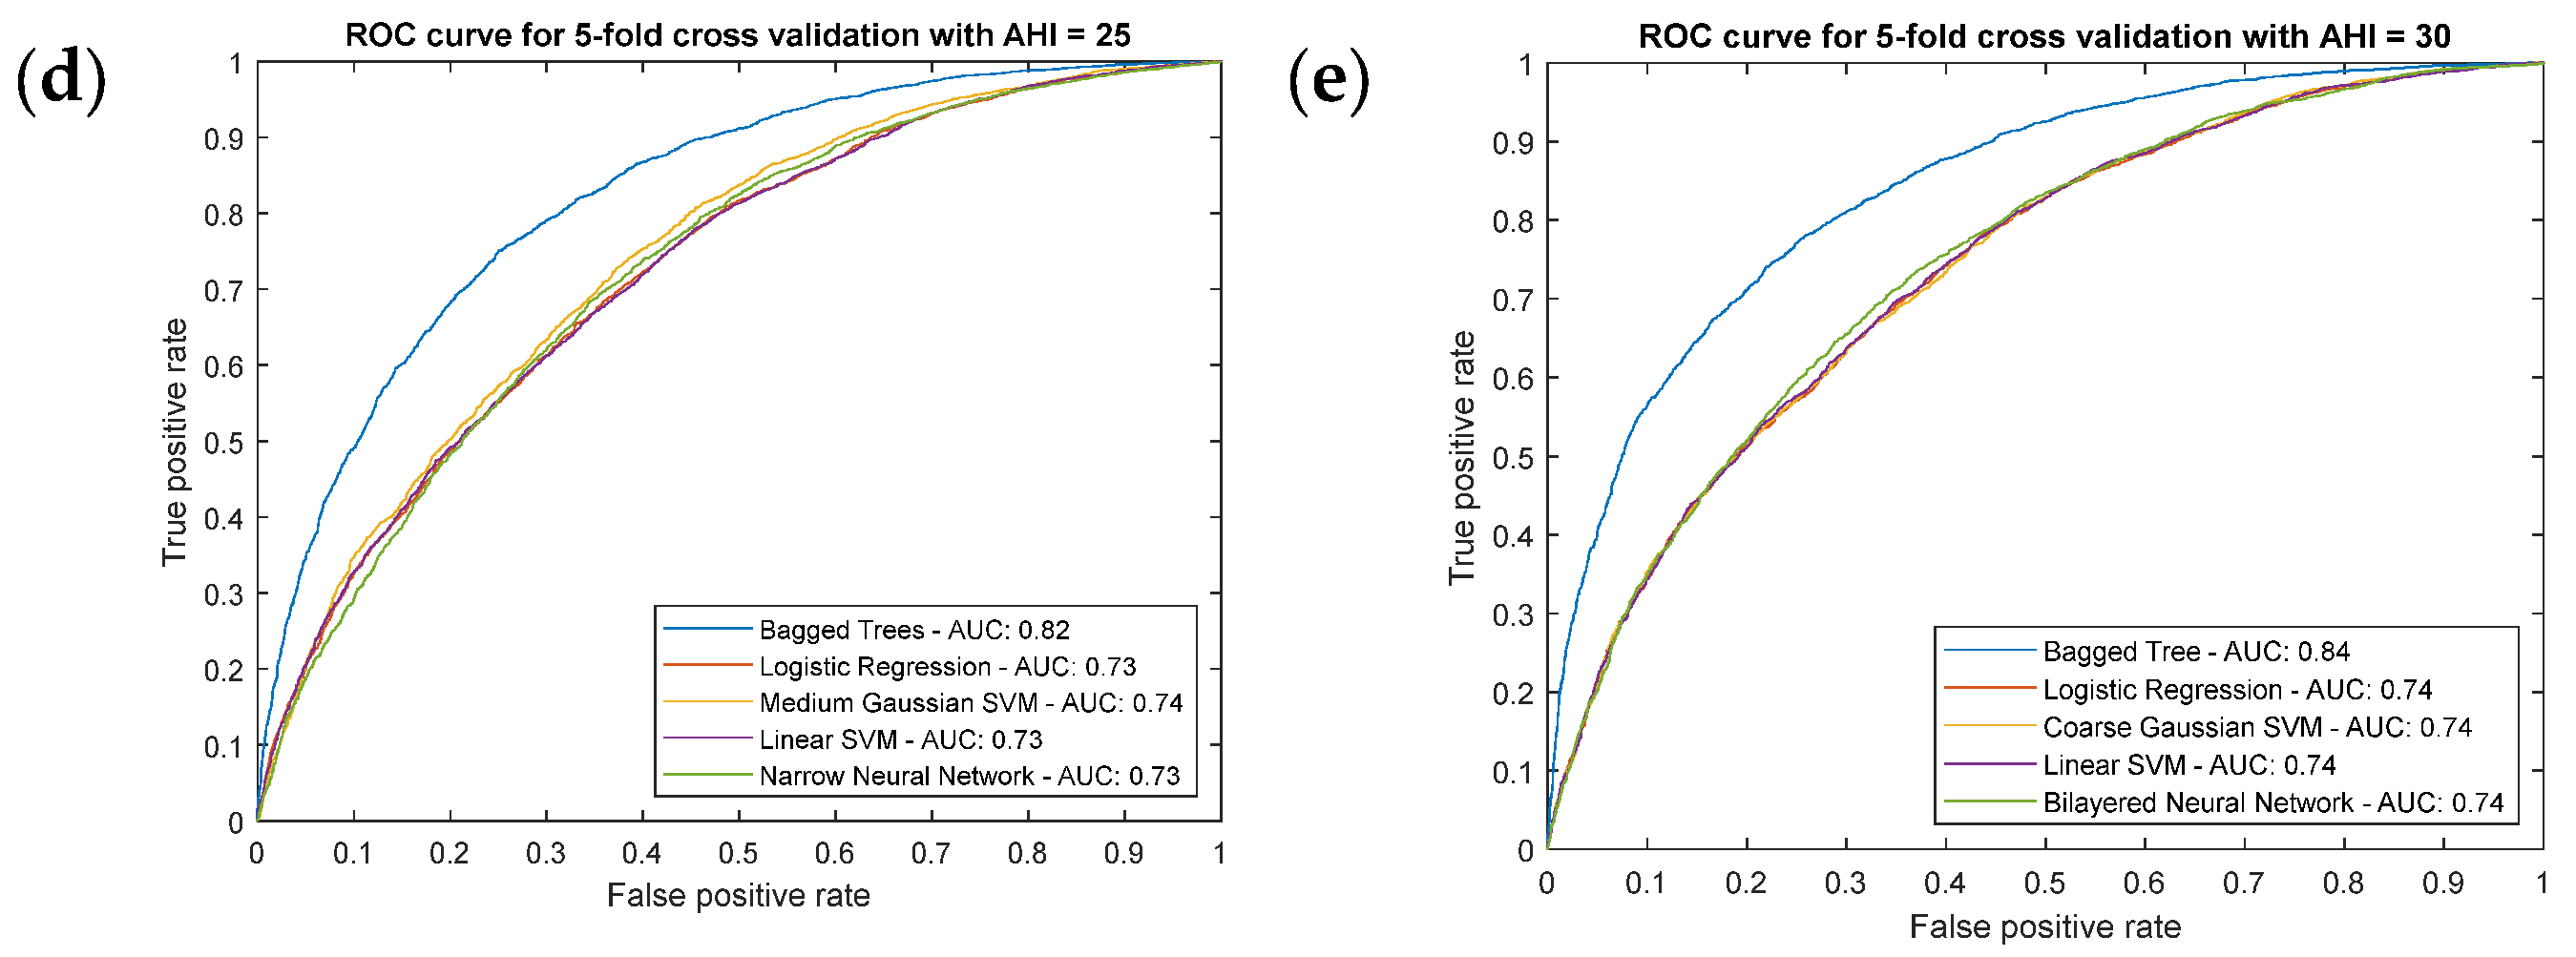
Statistical Inference Algorithms
Correcting Approach—Proof Test of the System
- First Level of the Correcting Block—First ANFIS
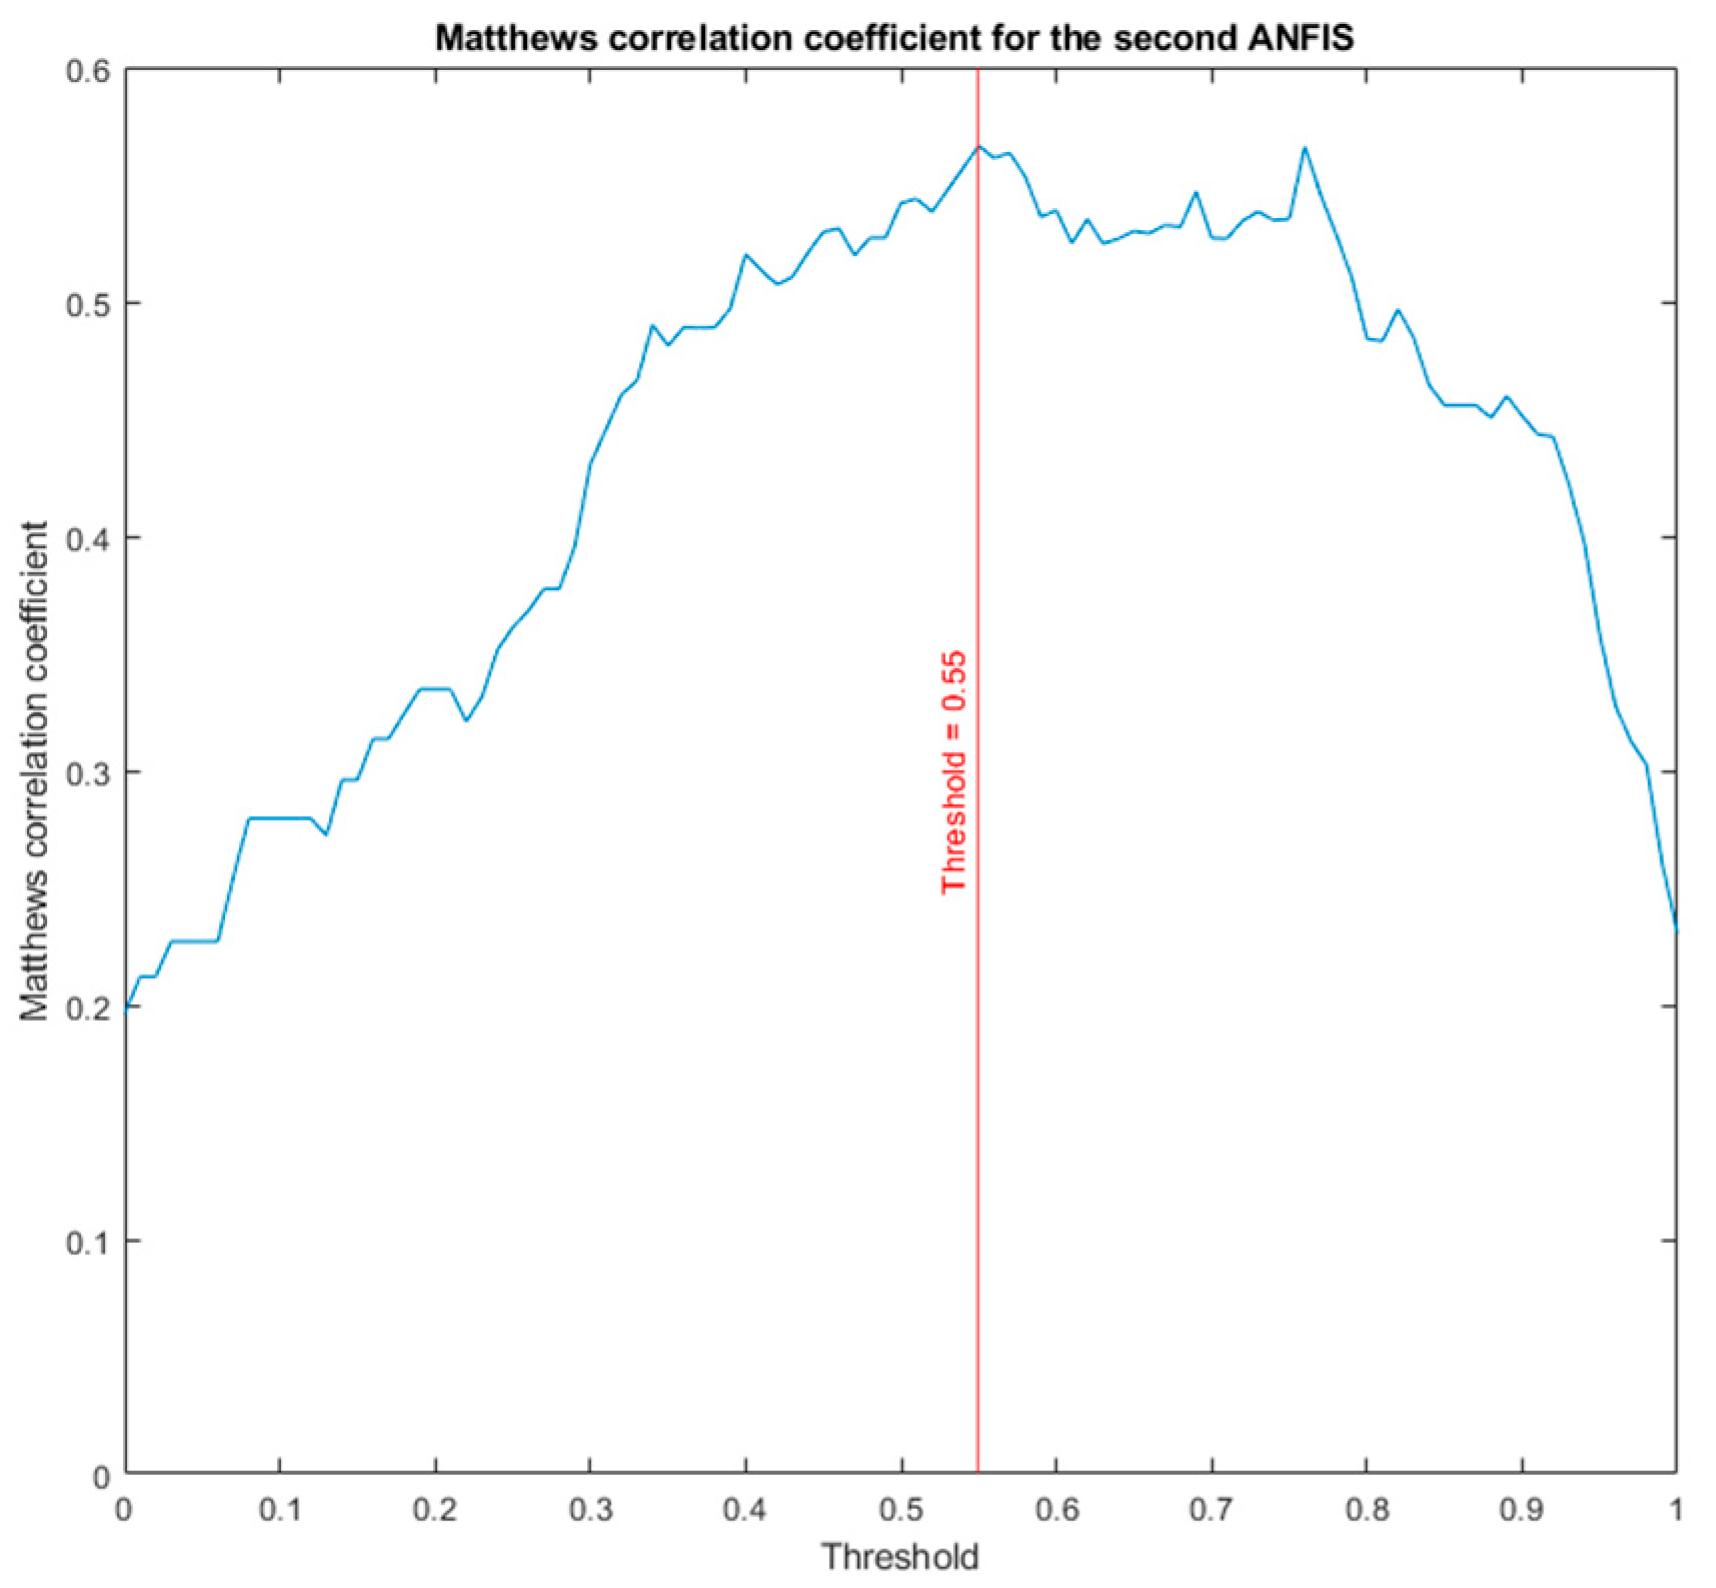
- Second Level of the Correcting Block—Second ANFIS with Heuristic Algorithm
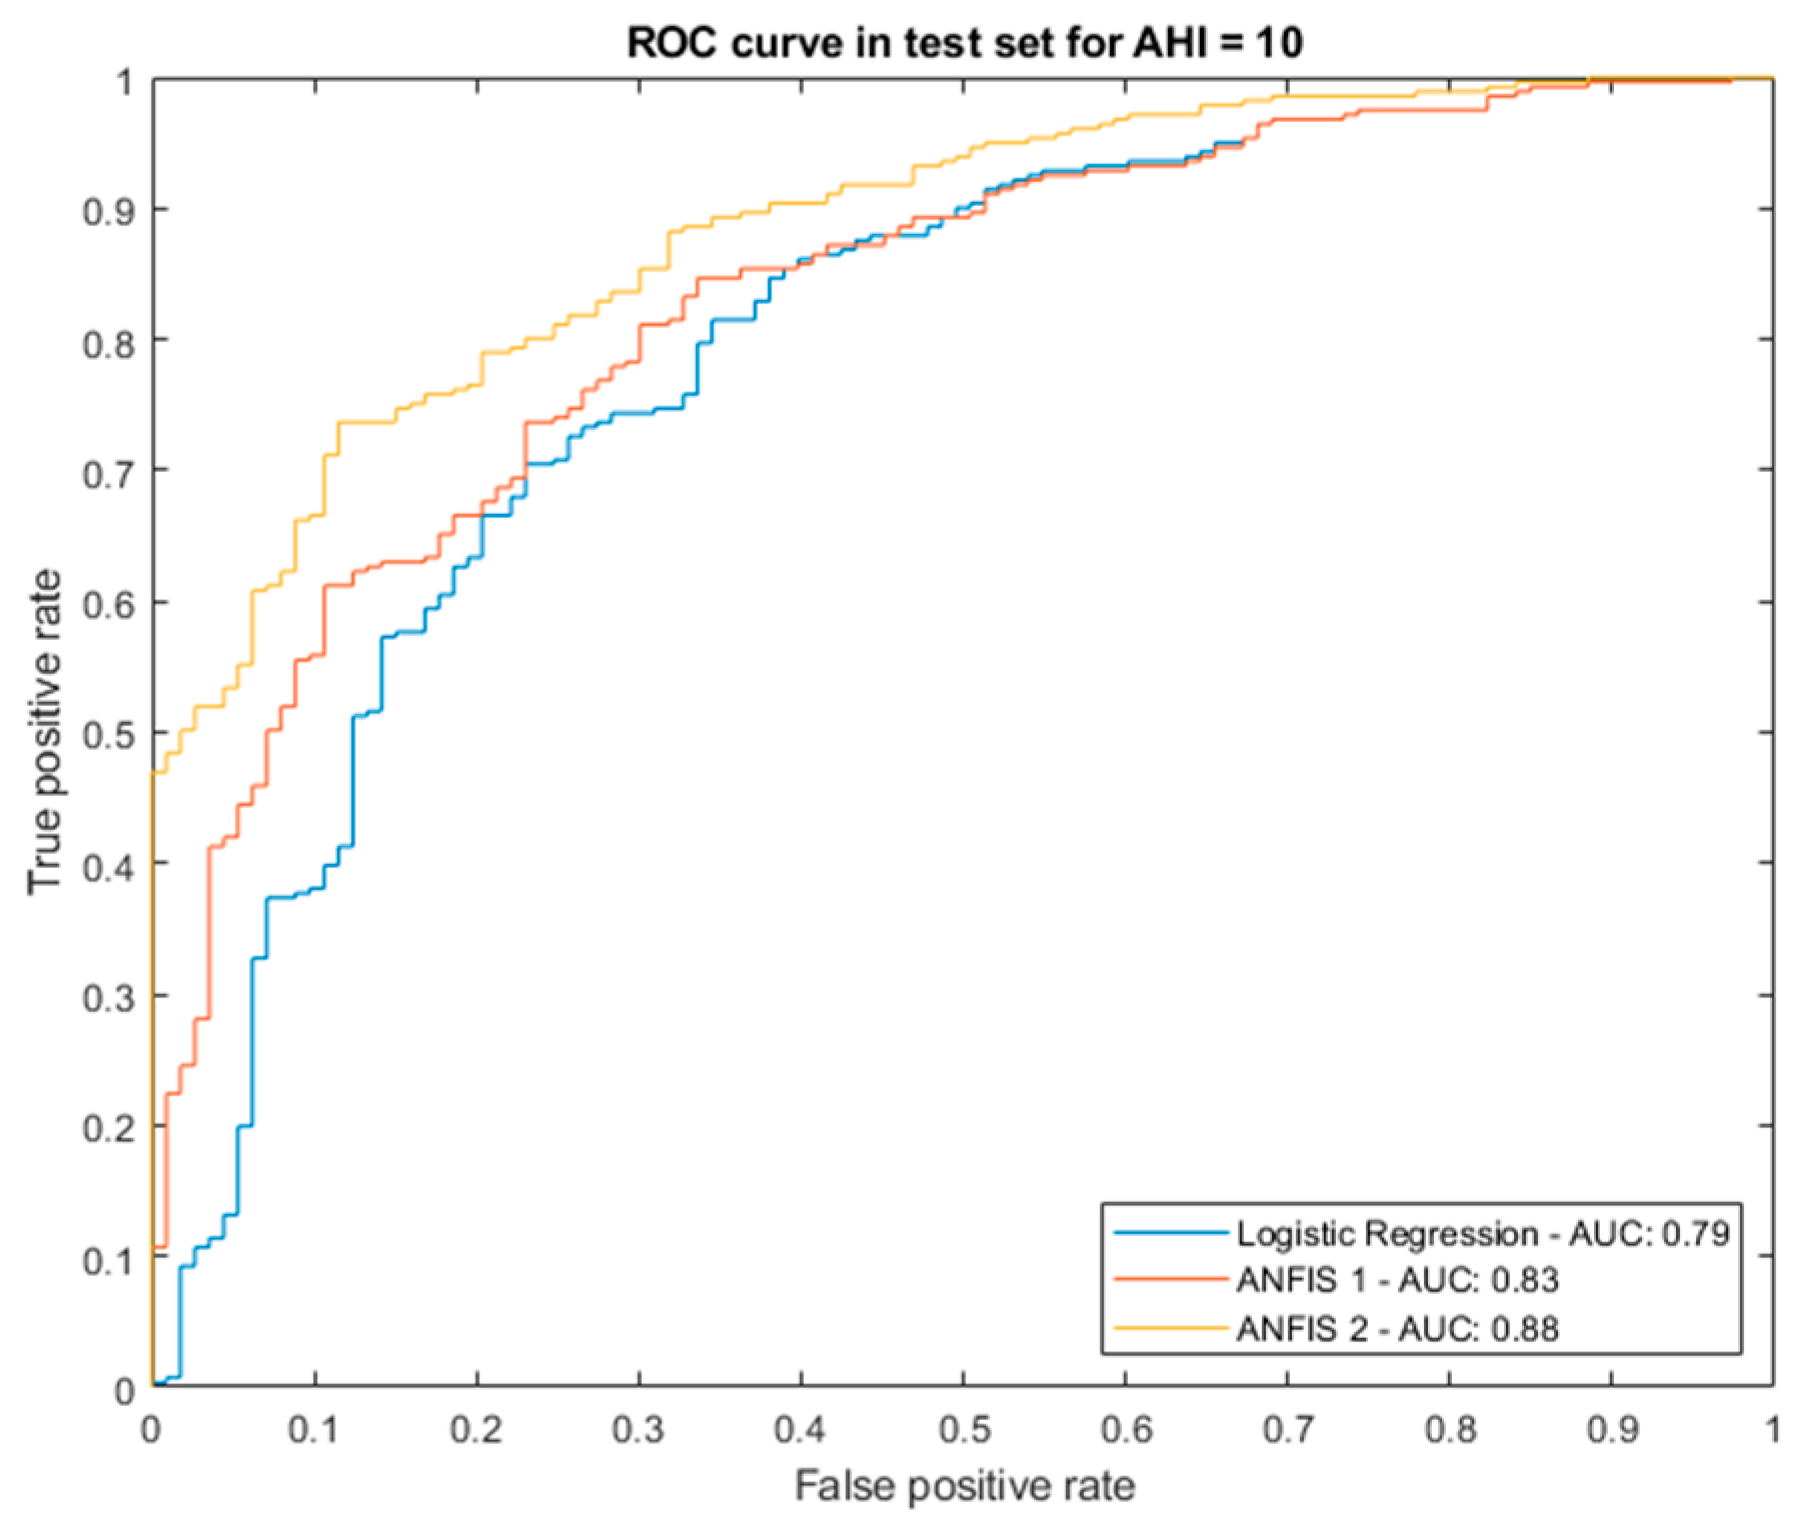
- Proof test results
2.2.3. Generation of Alerts and Decision Making
3. Case study
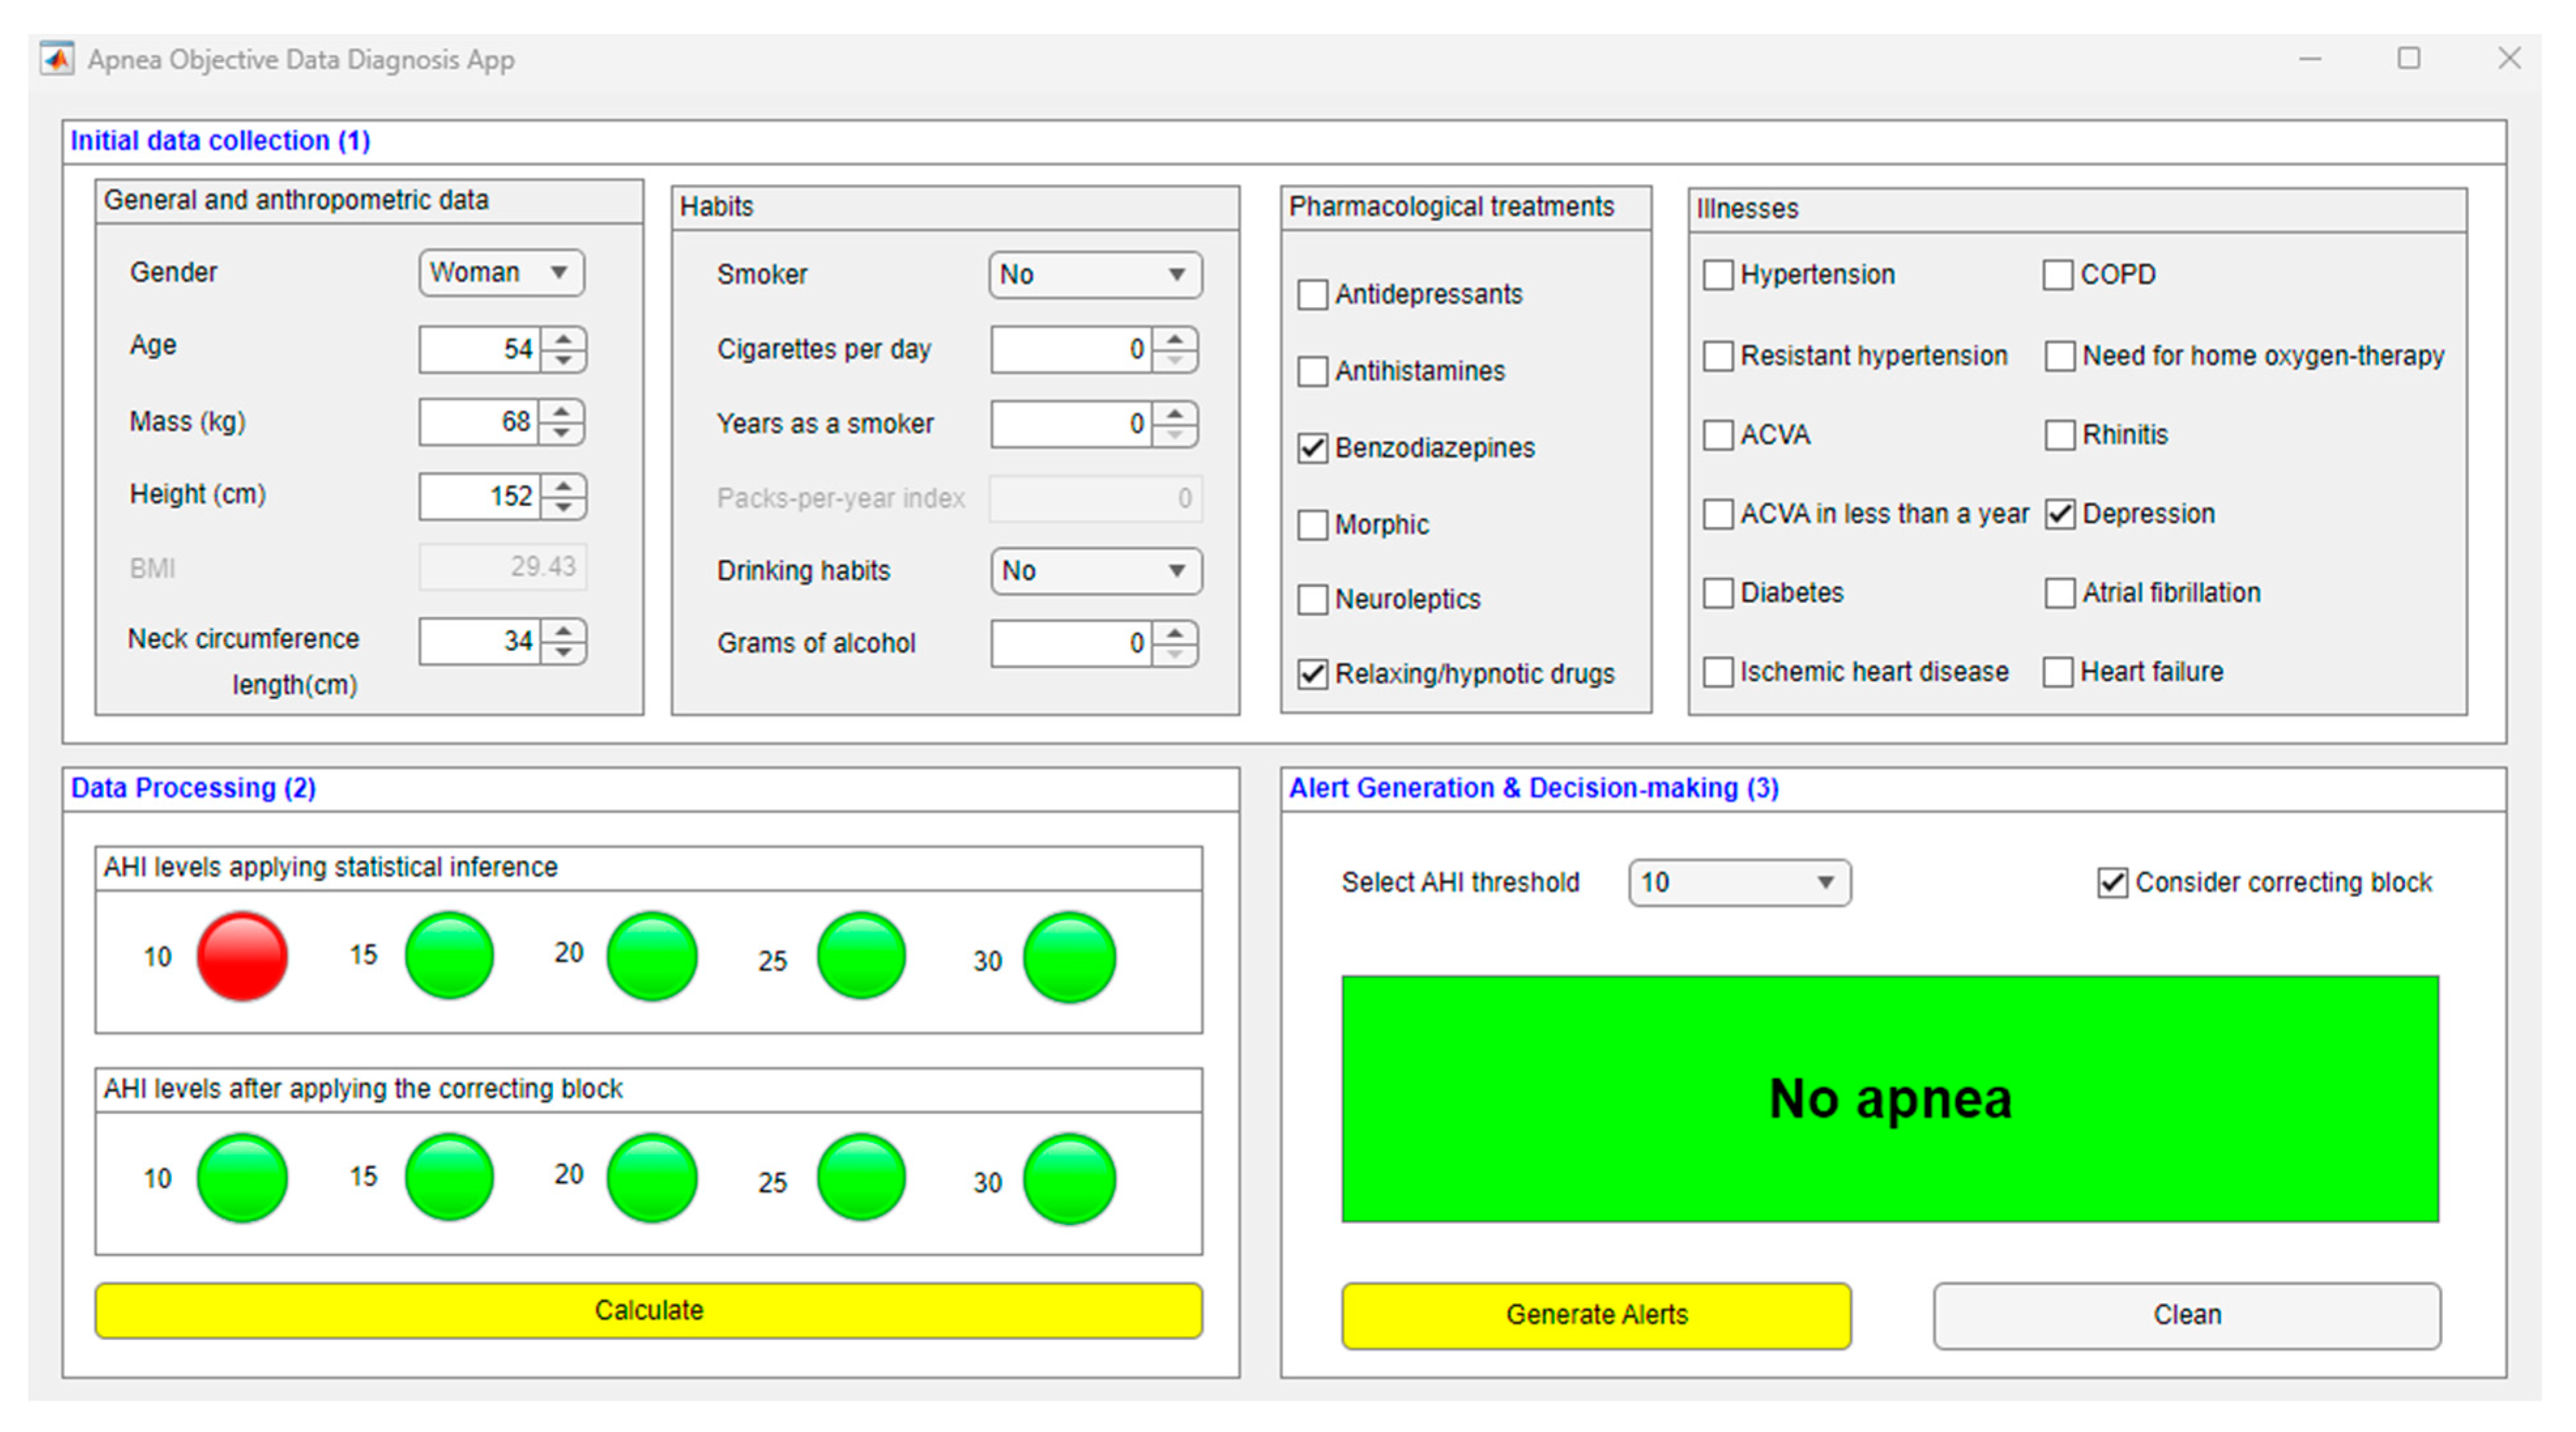
3.1. Compilation of Patient Information
3.2. Data Processing
3.3. Generation of Alerts and Decision-Making
3.4. Expansion of the Results
4. Discussion
Relevance in the Field of Study
- Internal architecture: aiming to analyze the reliability of the model from the point of view of its ability to manage uncertainty.
- Scalability: aiming to determine the model’s ability to add or remove blocks from the system.
- Inference: aiming to analyze the system’s ability to use symbolic reasoning supported by the complete formalization of a knowledge base.
- Learning: aiming to assess the system’s ability to incorporate learning approaches that are common in the field of Machine Learning.
5. Conclusions
Author Contributions
Funding
Institutional Review Board Statement
Informed Consent Statement
Data Availability Statement
Acknowledgments
Conflicts of Interest
References
- Benjafield, A.v.; Ayas, N.T.; Eastwood, P.R.; Heinzer, R.; Ip, M.S.M.; Morrell, M.J.; Nunez, C.M.; Patel, S.R.; Penzel, T.; Pépin, J.L.D.; et al. Estimation of the Global Prevalence and Burden of Obstructive Sleep Apnoea: A Literature-Based Analysis. Lancet Respir. Med. 2019, 7, 687–698. [Google Scholar] [CrossRef] [PubMed] [Green Version]
- Ramachandran, A.; Karuppiah, A. A Survey on Recent Advances in Machine Learning Based Sleep Apnea Detection Systems. Healthcare 2021, 9, 914. [Google Scholar] [CrossRef] [PubMed]
- Douglas, N.J.; Thomas, S.; Jan, M.A. Clinical Value of Polysomnography. Lancet 1992, 339, 347–350. [Google Scholar] [CrossRef] [PubMed]
- Rundo, J.V.; Downey, R. Polysomnography. In Handbook of Clinical Neurology; Elsevier: Amsterdam, The Netherlands, 2019; Volume 160, pp. 381–392. [Google Scholar]
- Kapur, V.K.; Auckley, D.H.; Chowdhuri, S.; Kuhlmann, D.C.; Mehra, R.; Ramar, K.; Harrod, C.G. Clinical Practice Guideline for Diagnostic Testing for Adult Obstructive Sleep Apnea: An American Academy of Sleep Medicine Clinical Practice Guideline. J. Clin. Sleep Med. 2017, 13, 479–504. [Google Scholar] [CrossRef]
- Punjabi, N.M. The Epidemiology of Adult Obstructive Sleep Apnea. Proc. Am. Thorac. Soc. 2008, 5, 136–143. [Google Scholar] [CrossRef]
- Mostafa, S.S.; Mendonça, F.; Ravelo-García, A.G.; Morgado-Dias, F. A Systematic Review of Detecting Sleep Apnea Using Deep Learning. Sensors 2019, 19, 4934. [Google Scholar] [CrossRef] [Green Version]
- Ly, W.K.; Thurnheer, R.; Bloch, K.E.; Laube, I.; Gugger, M.; Heitz, M. Respiratory Polygraphy in Sleep Apnoea Diagnosis. Swiss Med. Wkly. 2007, 137, 97–102. [Google Scholar]
- Alonso Álvarez, M.d.l.L.; Terán Santos, J.; Cordero Guevara, J.; Martínez, M.G.; Rodríguez Pascual, L.; Viejo Bañuelos, J.L.; Marañón Cabello, A. Fiabilidad de La Poligrafía Respiratoria Domiciliaria Para El Diagnóstico Del Síndrome de Apneas-Hipopneas Durante El Sueño. Análisis de Costes. Arch. Bronconeumol. 2008, 44, 22–28. [Google Scholar] [CrossRef]
- Calleja, J.M.; Esnaola, S.; Rubio, R.; Durán, J. Comparison of a Cardiorespiratory Device versus Polysomnography for Diagnosis of Sleep Apnoea. Eur. Respir. J. 2002, 20, 1505–1510. [Google Scholar] [CrossRef] [Green Version]
- Pevernagie, D.A.; Gnidovec-Strazisar, B.; Grote, L.; Heinzer, R.; McNicholas, W.T.; Penzel, T.; Randerath, W.; Schiza, S.; Verbraecken, J.; Arnardottir, E.S. On the Rise and Fall of the Apnea−hypopnea Index: A Historical Review and Critical Appraisal. J. Sleep Res. 2020, 29, e13066. [Google Scholar] [CrossRef]
- Prisant, L.M.; Dillard, T.A.; Blanchard, A.R. Obstructive Sleep Apnea Syndrome. J. Clin. Hypertens. 2006, 8, 746–750. [Google Scholar] [CrossRef] [PubMed]
- Koch, A.L.; Brown, R.H.; Woo, H.; Brooker, A.C.; Paulin, L.M.; Schneider, H.; Schwartz, A.R.; Diette, G.B.; Wise, R.A.; Hansel, N.N.; et al. Obstructive Sleep Apnea and Airway Dimensions in Chronic Obstructive Pulmonary Disease. Ann. Am. Thorac. Soc. 2020, 17, 116–118. [Google Scholar] [CrossRef] [PubMed]
- Chiu, H.Y.; Chen, P.Y.; Chuang, L.P.; Chen, N.H.; Tu, Y.K.; Hsieh, Y.J.; Wang, Y.C.; Guilleminault, C. Diagnostic Accuracy of the Berlin Questionnaire, STOP-BANG, STOP, and Epworth Sleepiness Scale in Detecting Obstructive Sleep Apnea: A Bivariate Meta-Analysis. Sleep Med. Rev. 2017, 36, 57–70. [Google Scholar] [CrossRef] [PubMed]
- El-Sayed, I.H. Comparison of Four Sleep Questionnaires for Screening Obstructive Sleep Apnea. Egypt. J. Chest Dis. Tuberc. 2012, 61, 433–441. [Google Scholar] [CrossRef] [Green Version]
- Mencar, C.; Gallo, C.; Mantero, M.; Tarsia, P.; Carpagnano, G.E.; Foschino Barbaro, M.P.; Lacedonia, D. Application of Machine Learning to Predict Obstructive Sleep Apnea Syndrome Severity. Health Inform. J. 2020, 26, 298–317. [Google Scholar] [CrossRef]
- Ustun, B.; Westover, M.B.; Rudin, C.; Bianchi, M.T. Clinical Prediction Models for Sleep Apnea: The Importance of Medical History over Symptoms. J. Clin. Sleep Med. 2016, 12, 161–168. [Google Scholar] [CrossRef] [Green Version]
- Parikh, R.; Mathai, A.; Parikh, S.; Sekhar, G.C.; Thomas, R. Understanding and Using Sensitivity, Specificity and Predictive Values. Indian J. Ophthalmol. 2008, 56, 45. [Google Scholar] [CrossRef]
- Ramesh, J.; Keeran, N.; Sagahyroon, A.; Aloul, F. Towards Validating the Effectiveness of Obstructive Sleep Apnea Classification from Electronic Health Records Using Machine Learning. Healthcare 2021, 9, 1450. [Google Scholar] [CrossRef]
- Huang, W.C.; Lee, P.L.; Liu, Y.T.; Chiang, A.A.; Lai, F. Support Vector Machine Prediction of Obstructive Sleep Apnea in a Large-Scale Chinese Clinical Sample. Sleep 2020, 43, zsz295. [Google Scholar] [CrossRef]
- Hoo, Z.H.; Candlish, J.; Teare, D. What Is an ROC Curve? Emerg. Med. J. 2017, 34, 357–359. [Google Scholar] [CrossRef] [Green Version]
- Li, Q.; Cai, W.; Wang, X.; Zhou, Y.; Feng, D.D.; Chen, M. Medical Image Classification with Convolutional Neural Network. In Proceedings of the 2014 13th International Conference on Control Automation Robotics & Vision (ICARCV), Singapore, 10–12 December 2014; pp. 844–848. [Google Scholar] [CrossRef]
- Anwar, S.M.; Majid, M.; Qayyum, A.; Awais, M.; Alnowami, M.; Khan, M.K. Medical Image Analysis Using Convolutional Neural Networks: A Review. J. Med. Syst. 2018, 42, 1–13. [Google Scholar] [CrossRef] [PubMed] [Green Version]
- Marques, G.; Agarwal, D.; de la Torre Díez, I. Automated Medical Diagnosis of COVID-19 through EfficientNet Convolutional Neural Network. Appl. Soft. Comput. 2020, 96, 106691. [Google Scholar] [CrossRef] [PubMed]
- Cen, L.; Yu, Z.L.; Kluge, T.; Ser, W. Automatic System for Obstructive Sleep Apnea Events Detection Using Convolutional Neural Network. In Proceedings of the 2018 40th Annual International Conference of the IEEE Engineering in Medicine and Biology Society (EMBC), Honolulu, HI, USA, 18–21 July 2018; pp. 3975–3978. [Google Scholar] [CrossRef]
- Dey, D.; Chaudhuri, S.; Munshi, S. Obstructive Sleep Apnoea Detection Using Convolutional Neural Network Based Deep Learning Framework. Biomed. Eng. Lett. 2018, 8, 95–100. [Google Scholar] [CrossRef] [PubMed]
- Cerqueiro-Pequeño, J.; Casal-Guisande, M.; Comesaña-Campos, A.; Bouza-Rodríguez, J.B. Conceptual Design of a New Methodology Based on Intelligent Systems Applied to the Determination of the User Experience in Ambulances. In Proceedings of the Ninth International Conference on Technological Ecosystems for Enhancing Multiculturality (TEEM’21), Barcelona, Spain, 26–29 October 2021; pp. 290–296. [Google Scholar] [CrossRef]
- Choi, E.; Schuetz, A.; Stewart, W.F.; Sun, J. Using Recurrent Neural Network Models for Early Detection of Heart Failure Onset. J. Am. Med. Inform. Assoc. 2017, 24, 361–370. [Google Scholar] [CrossRef] [PubMed] [Green Version]
- Lipton, Z.C.; Kale, D.C.; Elkan, C.; Wetzel, R. Learning to Diagnose with LSTM Recurrent Neural Networks. In Proceedings of the 4th International Conference on Learning Representations, ICLR 2016-Conference Track Proceedings, San Juan, Puerto Rico, 2–4 May 2016. [Google Scholar] [CrossRef]
- Sha, Y.; Wang, M.D. Interpretable Predictions of Clinical Outcomes with an Attention-Based Recurrent Neural Network. In Proceedings of the ACM-BCB 2017-Proceedings of the 8th ACM International Conference on Bioinformatics, Computational Biology, and Health Informatics, Boston, MA, USA, 20–23 August 2017; pp. 233–240. [Google Scholar] [CrossRef]
- Elmoaqet, H.; Eid, M.; Glos, M.; Ryalat, M.; Penzel, T. Deep Recurrent Neural Networks for Automatic Detection of Sleep Apnea from Single Channel Respiration Signals. Sensors 2020, 20, 5037. [Google Scholar] [CrossRef]
- Cheng, M.; Sori, W.J.; Jiang, F.; Khan, A.; Liu, S. Recurrent Neural Network Based Classification of ECG Signal Features for Obstruction of Sleep Apnea Detection. In Proceedings of the 2017 IEEE International Conference on Computational Science and Engineering and IEEE/IFIP International Conference on Embedded and Ubiquitous Computing, CSE and EUC 2017, Guangzhou, China, 21–24 July 2017; Volume 2, pp. 199–202. [Google Scholar] [CrossRef]
- Ghaheri, A.; Shoar, S.; Naderan, M.; Hoseini, S.S. The Applications of Genetic Algorithms in Medicine. Oman. Med. J. 2015, 30, 406. [Google Scholar] [CrossRef]
- Maulik, U. Medical Image Segmentation Using Genetic Algorithms. IEEE Trans. Inf. Technol. Biomed. 2009, 13, 166–173. [Google Scholar] [CrossRef]
- Reddy, G.T.; Reddy, M.P.K.; Lakshmanna, K.; Rajput, D.S.; Kaluri, R.; Srivastava, G. Hybrid Genetic Algorithm and a Fuzzy Logic Classifier for Heart Disease Diagnosis. Evol. Intell. 2020, 13, 185–196. [Google Scholar] [CrossRef]
- Veloso, R.; Portela, F.; Santos, M.F.; Silva, Á.; Rua, F.; Abelha, A.; Machado, J. A Clustering Approach for Predicting Readmissions in Intensive Medicine. Procedia Technol. 2014, 16, 1307–1316. [Google Scholar] [CrossRef] [Green Version]
- Paul, R.; Hoque, A.S.M.L. Clustering Medical Data to Predict the Likelihood of Diseases. In Proceedings of the 2010 5th International Conference on Digital Information Management, ICDIM 2010, Thunder Bay, ON, Canada, 5–8 July 2010; pp. 44–49. [Google Scholar] [CrossRef]
- Alashwal, H.; el Halaby, M.; Crouse, J.J.; Abdalla, A.; Moustafa, A.A. The Application of Unsupervised Clustering Methods to Alzheimer’s Disease. Front. Comput. Neurosci. 2019, 13, 31. [Google Scholar] [CrossRef]
- Keenan, B.T.; Kim, J.; Singh, B.; Bittencourt, L.; Chen, N.H.; Cistulli, P.A.; Magalang, U.J.; McArdle, N.; Mindel, J.W.; Benediktsdottir, B.; et al. Recognizable Clinical Subtypes of Obstructive Sleep Apnea across International Sleep Centers: A Cluster Analysis. Sleep 2018, 41, zsx214. [Google Scholar] [CrossRef] [PubMed]
- Yadollahpour, A.; Nourozi, J.; Mirbagheri, S.A.; Simancas-Acevedo, E.; Trejo-Macotela, F.R. Designing and Implementing an ANFIS Based Medical Decision Support System to Predict Chronic Kidney Disease Progression. Front. Physiol. 2018, 9, 1753. [Google Scholar] [CrossRef] [PubMed]
- Hosseini, M.S.; Zekri, M. Review of Medical Image Classification Using the Adaptive Neuro-Fuzzy Inference System. J. Med. Signals Sens. 2012, 2, 49. [Google Scholar] [CrossRef]
- Hamdan, H.; Garibaldi, J.M. Adaptive Neuro-Fuzzy Inference System (ANFIS) in Modelling Breast Cancer Survival. In Proceedings of the 2010 IEEE World Congress on Computational Intelligence, WCCI 2010, Barcelona, Spain, 18–23 July 2010. [Google Scholar] [CrossRef]
- Polat, K.; Yosunkaya, Ş.; Güneş, S. Pairwise ANFIS Approach to Determining the Disorder Degree of Obstructive Sleep Apnea Syndrome. J. Med. Syst. 2008, 32, 379–387. [Google Scholar] [CrossRef] [PubMed]
- Kumari, R.; Srivastava, S. Machine Learning: A Review on Binary Classification. Int J. Comput. Appl. 2017, 160, 11–15. [Google Scholar] [CrossRef]
- Duda, R.O.; Hart, P.E.; Stork, D.G. Pattern Classification; Wiley: Hoboken, NJ, USA, 2000. [Google Scholar]
- Boughorbel, S.; Jarray, F.; El-Anbari, M. Optimal Classifier for Imbalanced Data Using Matthews Correlation Coefficient Metric. PLoS ONE 2017, 12, e0177678. [Google Scholar] [CrossRef]
- Chicco, D.; Jurman, G. The Advantages of the Matthews Correlation Coefficient (MCC) over F1 Score and Accuracy in Binary Classification Evaluation. BMC Genom. 2020, 21, 1–13. [Google Scholar] [CrossRef] [PubMed] [Green Version]
- Guilford, J.P. Psychom. Methods; McGraw-Hill: New York, NY, USA, 1954. [Google Scholar]
- Casal-Guisande, M.; Comesaña-Campos, A.; Cerqueiro-Pequeño, J.; Bouza-Rodríguez, J.-B. Design and Development of a Methodology Based on Expert Systems, Applied to the Treatment of Pressure Ulcers. Diagnostics 2020, 10, 614. [Google Scholar] [CrossRef] [PubMed]
- Comesaña-Campos, A.; Casal-Guisande, M.; Cerqueiro-Pequeño, J.; Bouza-Rodríguez, J.B. A Methodology Based on Expert Systems for the Early Detection and Prevention of Hypoxemic Clinical Cases. Int J. Environ. Res. Public Health 2020, 17, 8644. [Google Scholar] [CrossRef]
- Cerqueiro-Pequeño, J.; Comesaña-Campos, A.; Casal-Guisande, M.; Bouza-Rodríguez, J.-B. Design and Development of a New Methodology Based on Expert Systems Applied to the Prevention of Indoor Radon Gas Exposition Risks. Int J. Environ. Res. Public Health 2020, 18, 269. [Google Scholar] [CrossRef]
- Casal-Guisande, M.; Comesaña-Campos, A.; Dutra, I.; Cerqueiro-Pequeño, J.; Bouza-Rodríguez, J.-B. Design and Development of an Intelligent Clinical Decision Support System Applied to the Evaluation of Breast Cancer Risk. J. Pers. Med. 2022, 12, 169. [Google Scholar] [CrossRef] [PubMed]
- Casal-Guisande, M.; Bouza-Rodríguez, J.-B.; Cerqueiro-Pequeño, J.; Comesaña-Campos, A. Design and Conceptual Development of a Novel Hybrid Intelligent Decision Support System Applied towards the Prevention and Early Detection of Forest Fires. Forests 2023, 14, 172. [Google Scholar] [CrossRef]
- Collins, G.S.; Reitsma, J.B.; Altman, D.G.; Moons, K.G.M. Transparent Reporting of a Multivariable Prediction Model for Individual Prognosis Or Diagnosis (TRIPOD): The TRIPOD Statement. Ann. Intern. Med. 2015, 162, 55–63. [Google Scholar] [CrossRef] [PubMed] [Green Version]
- Hevner, A.R.; March, S.T.; Park, J.; Ram, S. Design Science in Information Systems Research. MIS Q. Manag. Inf. Syst. 2004, 28, 75–105. [Google Scholar] [CrossRef] [Green Version]
- Hevner, A.R.; Chatterjee, S. Design Research in Information Systems: Theory and Practice; Springer: New York, NY, USA, 2010; ISBN 978-1-4419-6107-5. [Google Scholar]
- App Designer. Available online: https://www.mathworks.com/products/matlab/app-designer.html (accessed on 18 October 2022).
- Classification Learner. Available online: https://www.mathworks.com/help/stats/classificationlearner-app.html (accessed on 18 October 2022).
- Fuzzy Logic Toolbox-MATLAB. Available online: https://www.mathworks.com/products/fuzzy-logic.html (accessed on 1 November 2022).
- Imbalanced-Learn. Available online: https://imbalanced-learn.org/dev/index.html (accessed on 18 October 2022).
- Agresti, A. Categorical Data Analysis; John Wiley & Sons, Inc.: Hoboken, NJ, USA, 2002; ISBN 0471360937. [Google Scholar]
- Powers, D.; Xie, Y. Statistical Methods for Categorical Data Analysis; Emerald Group Publishing: Bingley, UK, 2008. [Google Scholar]
- Tabachnick, B.G.; Fidell, L.S.; Ullman, J.B. Using Multivariate Statistics; Pearson: Boston, MA, USA, 2007; Volume 5. [Google Scholar]
- Chawla, N.v.; Bowyer, K.W.; Hall, L.O.; Kegelmeyer, W.P. SMOTE: Synthetic Minority Over-Sampling Technique. J. Artif. Intell. Res. 2002, 16, 321–357. [Google Scholar] [CrossRef]
- Mohammed, A.J.; Hassan, M.M.; Kadir, D.H. Improving Classification Performance for a Novel Imbalanced Medical Dataset Using Smote Method. Int. J. Adv. Trends Comput. Sci. Eng. 2020, 9, 3161–3172. [Google Scholar] [CrossRef]
- Wasserman, L. All of Statistics: A Concise Course in Statistical Inference; Springer: New York, NY, USA, 2004; Volume 26, ISBN 978-0-387-21736-9. [Google Scholar]
- Refaeilzadeh, P.; Tang, L.; Liu, H. Cross-Validation. In Encyclopedia of Database Systems; Springer: Boston, MA, USA, 2009; pp. 532–538. [Google Scholar] [CrossRef]
- Casal-Guisande, M.; Comesaña-Campos, A.; Pereira, A.; Bouza-Rodríguez, J.-B.; Cerqueiro-Pequeño, J. A Decision-Making Methodology Based on Expert Systems Applied to Machining Tools Condition Monitoring. Mathematics 2022, 10, 520. [Google Scholar] [CrossRef]


| Descriptor | N (%)/Mean ± SD | |
|---|---|---|
| Male | Female | |
| Number of patients | 2930 (63.70%) | 1670 (36.30%) |
| Age | 55.16 ± 13.32 | 55.12 ± 13.68 |
| BMI | 31.62 ± 5.68 | 34.91 ± 8.47 |
| Neck perimeter | 42.72 ± 3.86 | 38.11 ± 4.00 |
| Hypertension | 709 (24.20%) | 360 (21.56%) |
| Resistant hypertension | 17 (0.58%) | 8 (0.48%) |
| ACVA | 29 (0.99%) | 6 (0.36%) |
| ACVA less than a year before | 10 (0.34%) | 1 (0.06%) |
| Diabetes | 207 (7.06%) | 119 (7.13%) |
| Ischemic heart disease | 112 (3.82%) | 21 (1.26%) |
| COPD | 38 (1.30%) | 12 (0.72%) |
| Need for home oxygen-therapy | 5 (0.17%) | 5 (0.30%) |
| Rhinitis | 75 (2.56%) | 44 (2.63%) |
| Depression | 98 (3.34%) | 158 (9.46%) |
| Atrial fibrillation | 82 (2.80%) | 36 (2.16%) |
| Heart failure | 34 (1.16%) | 16 (0.96%) |
| Benzodiazepines | 89 (3.04%) | 111 (6.65%) |
| Antidepressants | 78 (2.66%) | 115 (6.89%) |
| Neuroleptics | 14 (0.48%) | 5 (0.30%) |
| Antihistamines | 5 (0.17%) | 10 (0.60%) |
| Morphic | 4 (0.14%) | 5 (0.30%) |
| Relaxing/hypnotic drugs | 143 (4.88%) | 183 (10.96%) |
| Data | Data Type | Comments |
|---|---|---|
| Gender | Categorical | Male/Female |
| Age | Numerical | - |
| Height | Numerical | It is not fed to the algorithm, but only used for BMI calculation |
| Body mass | Numerical | It is not fed to the algorithm, but only used for BMI calculation |
| Body mass index (BMI) | Numerical | Derived datum, calculated from height and body mass |
| Neck circumference length (NCL) | Numerical | - |
| Data | Data Type | Comments |
|---|---|---|
| Smoker | Categorical | Yes/No/Former smoker |
| Cigarettes per day | Numerical | It is not fed to the algorithm, but only used for packs-per-year index calculation |
| Years as a smoker | Numerical | It is not fed to the algorithm, but only used for packs-per-year index calculation |
| Packs-per-year index | Numerical | Derived datum, calculated from cigarettes per day and years as a smoker |
| Drinking habits | Categorical | Yes/No/Casual |
| Grams of alcohol | Numerical | Grams of alcohol per day |
| Illnesses | ||
|---|---|---|
| Data | Data type | Comments |
| Hypertension | Categorical | Yes/No |
| Resistant hypertension | Categorical | Yes/No |
| ACVA | Categorical | Yes/No |
| ACVA in less than a year | Categorical | Yes/No |
| Diabetes | Categorical | Yes/No |
| Ischemic heart disease | Categorical | Yes/No |
| COPD | Categorical | Yes/No |
| Need for home oxygen-therapy | Categorical | Yes/No |
| Rhinitis | Categorical | Yes/No |
| Depression | Categorical | Yes/No |
| Atrial fibrillation | Categorical | Yes/No |
| Heart failure | Categorical | Yes/No |
| Pharmacological treatments | ||
| Data | Data type | Comments |
| Benzodiazepines | Categorical | Yes/No |
| Antidepressants | Categorical | Yes/No |
| Neuroleptics | Categorical | Yes/No |
| Antihistamines | Categorical | Yes/No |
| Morphic | Categorical | Yes/No |
| Relaxing/hypnotic drugs | Categorical | Yes/No |
| AHI = 10 Dataset | ||
|---|---|---|
| AHI < 10 | AHI ≥ 10 | Total |
| 1261 | 3339 | 4600 |
| AHI = 15 Dataset | ||
| AHI < 15 | AHI ≥ 15 | Total |
| 1773 | 2827 | 4600 |
| AHI = 20 Dataset | ||
| AHI < 20 | AHI ≥ 20 | Total |
| 2240 | 2360 | 4600 |
| AHI = 25 Dataset | ||
| AHI < 25 | AHI ≥ 25 | Total |
| 2603 | 1997 | 4600 |
| AHI = 30 Dataset | ||
| AHI < 30 | AHI ≥ 30 | Total |
| 2907 | 1693 | 4600 |
| Model Type | Variants |
|---|---|
| Decision Trees | Fine, Medium, and Coarse Tree models |
| Logistic Regression | - |
| Naïve Bayes | Gaussian and Kernel Naïve Bayes |
| Support Vector Machines | Linear, Quadratic, Cubic, Fine Gaussian, Medium Gaussian, and Coarse Gaussian Support Vector Machine |
| Ensembles | Bagged Trees and RUSBoosted Trees |
| Neural Networks | Narrow, Medium, Wide, Two-layer, and Three-layer Neural Networks |
| ANFIS 1 | ||
|---|---|---|
| Input Data | Range | Output Data |
| Score 1 (μ1) | 0–1 | Prediction |
 | mf1 = −17.24 · μ1 + 37.24 · μ2 + 0.87 · μ3 − 19.78 · μ4 + 20 mf2 = 4.90 · μ1 − 15.37 · μ2 − 3.96 · μ3 + 9.71 · μ4 − 10.47 mf3 = −26.76 · μ1 + 43.10 · μ2 + 15.22 · μ3 + 78.11 · μ4 + 16.34 mf4 = −31.48 · μ1 − 38 − 35 · μ2 − 69.45 · μ3 + 2.06 · μ4 − 69.83 mf5 = 10.29 · μ1 − 60.59 · μ2 − 1.13 · μ3 + 38.80 · μ4 − 50.30 mf6 = −3.47 · μ1 − 7.01 · μ2 + 1.64 · μ3 − 2.84 · μ4 − 10.48 mf7 = −81.79 · μ1 + 59.12 · μ2 − 19.80 · μ3 + 33.90 · μ4 − 26.67 mf8 = 48.23 · μ1 − 20.29 · μ2 + 28.65 · μ3 − 35.24 · μ4 + 27.94 mf9 = 12.99 · μ1 − 19.31 · μ2 − 0.36 · μ3 + 7.85 · μ4 − 6.32 mf10 = 0.01 · μ1 + 2.87 · μ2 − 1.54 · μ3 − 1.46 · μ4 + 2.97 mf11 = 97.50 · μ1 − 104.10 · μ2 − 6.24 · μ3 − 39.17 · μ4 − 6.59 mf12 = −15.13 · μ1 − 11.65 · μ2 − 27.04 · μ3 − 7.19 · μ4 − 26.79 mf13 = −17.24 · μ1 + 37.24 · μ2 + 0.87 · μ3 − 19.79 · μ4 + 20 mf14 = −4.89 · μ1 − 15.37 · μ2 − 3.96 · μ3 + 9.71 · μ4 − 10.47 mf15 = −25.76 · μ1 + 43.10 · μ2 + 15.22 · μ3 + 78.11 · μ4 + 16.34 mf16 = −31.48 · μ1 − 38.35 · μ2 − 69.45 · μ3 + 2.06 · μ4 − 69.83 | |
| Score 2 (μ2) | 0–1 | |
 | ||
| Predicted Label (μ3) | 0–1 | Initial configuration |
 | Fuzzy structure: Sugeno-type. Antecedents membership function type: bell-shaped. Consequents membership function type: linear. And method: PROD. Or method: MAX. Implication method: MIN. Aggregation method: MAX. Deffuzification method: Weighted average of all rule outputs. Number of fuzzy rules: 16. | |
| Score 1 deviation (μ4) | 0–0.48 | |
 | ||
| Summary of rules | ||
 | ||
| ANFIS 2 | ||
|---|---|---|
| Input Data | Range | Output Data |
| Score 1 (μ1) | 0–1 | Subset of 128 output mf’s |
 | mf1 = 1.05 · μ1 − 2.79 · μ2 − 1.08 · μ3 + 1.84 · μ4 + 52.66 · μ5 − 54.87 · μ6 + 0.12 · μ7 − 1.74 mf2 = 1.21 · μ1 + 0.74; μ2 − 1.13 · μ3 − 1.47 · μ4 + 10.89 · μ5 − 7.08 · μ6 + 2.06 · μ7 + 1.95 mf3 = 4.96 · μ1 + 0.78 · μ2 + 1.48 · μ3 + 2.42 · μ4 + 55.01 · μ5 − 50.63 · μ6 − 1.46 · μ7 + 5.74 mf4 = −12.02 · μ1 − 13.02 · μ2 + 0.26 · μ3 − 0.70 · μ4 − 5.95 · μ5 − 14.74 · μ6 − 25.75 · μ7 − 25.34 mf5 = −3 · μ1 − 4.78 · μ2 + 0.93 · μ3 + 3.23 · μ4 + 26.66 · μ5 − 35.17 · μ6 + 0.50 · μ7 − 7.78 mf6 = 5.06 · μ1 + 3.27 · μ2 + 1.33 · μ3 + 1.67 · μ4 − 33.29 · μ5 − 36.44 · μ6 + 8.81 · μ7 + 8.33 mf128 = 3.02 · μ1 + 4.11 · μ2 + 7.17 · μ3 + 0.62 · μ4 + 6.18 · μ5 + 1.29 · μ6 + 6.79 · μ7 + 7.13 | |
| Score 2 (μ2) | 0–1 | |
 | ||
| Predicted Label (μ3) | 0–1 | Initial configuration |
 | Fuzzy structure: Sugeno-type. Antecedents membership function type: bell-shaped. Consequents membership function type: linear. And method: PROD. Or method: MAX Implication method: MIN. Aggregation method: MAX. Deffuzification method: Weighted average of all rule outputs. Number of fuzzy rules: 128. | |
| Score 1 deviation (μ4) | 0–0.48 | |
 | ||
| Score ANFIS 1 (μ5) | 0–1 | Subset of the 128 fuzzy rules |
 |
| |
| Score ANFIS 1 deviation (μ6) | 0–0.73 | |
 | ||
| Correcting factor (μ7) | 0–1 | |
 | ||
| Models | Metrics | Model Validation | Model Testing | First ANFIS | Second ANFIS |
|---|---|---|---|---|---|
| Bagged Trees | AUC | 0.87 | 0.76 | 0.79 | 0.84 |
| MCC | - | 0.35 | 0.43 | 0.52 | |
| Logistic Regression | AUC | 0.75 | 0.79 | 0.83 | 0.88 |
| MCC | - | 0.42 | 0.50 | 0.57 | |
| Coarse Gaussian SVM | AUC | 0.75 | 0.81 | 0.82 | 0.86 |
| MCC | - | 0.45 | 0.48 | 0.56 | |
| Linear SVM | AUC | 0.75 | 0.80 | 0.82 | 0.86 |
| MCC | - | 0.45 | 0.49 | 0.55 | |
| Gaussian Naïve Bayes | AUC | 0.73 | 0.78 | 0.81 | 0.86 |
| MCC | - | 0.34 | 0.49 | 0.54 |
| Models | Metrics | Model Validation | Model Testing | First ANFIS | Second ANFIS |
|---|---|---|---|---|---|
| Bagged Trees | AUC | 0.85 | 0.76 | 0.78 | 0.85 |
| MCC | - | 0.40 | 0.45 | 0.54 | |
| Logistic Regression | AUC | 0.75 | 0.76 | 0.80 | 0.86 |
| MCC | - | 0.35 | 0.47 | 0.59 | |
| Medium Gaussian SVM | AUC | 0.76 | 0.78 | 0.80 | 0.88 |
| MCC | - | 0.41 | 0.47 | 0.62 | |
| Linear SVM | AUC | 0.75 | 0.76 | 0.78 | 0.84 |
| MCC | - | 0.37 | 0.44 | 0.56 | |
| Gaussian Naïve Bayes | AUC | 0.72 | 0.75 | 0.77 | 0.84 |
| MCC | - | 0.35 | 0.42 | 0.56 |
| Models | Metrics | Model Validation | Model Testing | First ANFIS | Second ANFIS |
|---|---|---|---|---|---|
| Bagged Trees | AUC | 0.83 | 0.74 | 0.77 | 0.85 |
| MCC | - | 0.30 | 0.41 | 0.54 | |
| Logistic Regression | AUC | 0.73 | 0.76 | 0.79 | 0.85 |
| MCC | - | 0.39 | 0.47 | 0.55 | |
| Medium Gaussian SVM | AUC | 0.74 | 0.77 | 0.79 | 0.83 |
| MCC | - | 0.39 | 0.46 | 0.54 | |
| Linear SVM | AUC | 0.73 | 0.76 | 0.77 | 0.84 |
| MCC | - | 0.40 | 0.47 | 0.54 | |
| Gaussian Naïve Bayes | AUC | 0.71 | 0.73 | 0.78 | 0.84 |
| MCC | - | 0.34 | 0.46 | 0.57 |
| Models | Metrics | Model Validation | Model Testing | First ANFIS | Second ANFIS |
|---|---|---|---|---|---|
| Bagged Trees | AUC | 0.82 | 0.74 | 0.76 | 0.81 |
| MCC | - | 0.33 | 0.41 | 0.51 | |
| Logistic Regression | AUC | 0.73 | 0.75 | 0.76 | 0.82 |
| MCC | - | 0.37 | 0.41 | 0.47 | |
| Medium Gaussian SVM | AUC | 0.74 | 0.77 | 0.78 | 0.83 |
| MCC | - | 0.42 | 0.44 | 0.51 | |
| Linear SVM | AUC | 0.73 | 0.75 | 0.75 | 0.81 |
| MCC | - | 0.35 | 0.43 | 0.49 | |
| Narrow Neural Network | AUC | 0.73 | 0.72 | 0.74 | 0.81 |
| MCC | - | 0.29 | 0.38 | 0.47 |
| Models | Metrics | Model Validation | Model Testing | First ANFIS | Second ANFIS |
|---|---|---|---|---|---|
| Bagged Trees | AUC | 0.84 | 0.73 | 0.75 | 0.81 |
| MCC | - | 0.30 | 0.39 | 0.49 | |
| Logistic Regression | AUC | 0.74 | 0.77 | 0.79 | 0.83 |
| MCC | - | 0.37 | 0.43 | 0.50 | |
| Coarse Gaussian SVM | AUC | 0.74 | 0.77 | 0.79 | 0.86 |
| MCC | - | 0.39 | 0.44 | 0.55 | |
| Linear SVM | AUC | 0.74 | 0.77 | 0.78 | 0.84 |
| MCC | - | 0.35 | 0.43 | 0.51 | |
| Two-layer NeuralNetwork | AUC | 0.74 | 0.73 | 0.76 | 0.84 |
| MCC | - | 0.33 | 0.39 | 0.52 |
| Threshold Level | Sensitivity | Specificity |
|---|---|---|
| AHI 10 | 0.89 | 0.67 |
| AHI 15 | 0.87 | 0.74 |
| AHI 20 | 0.87 | 0.65 |
| AHI 25 | 0.70 | 0.81 |
| AHI 30 | 0.76 | 0.80 |
| Data | Values |
|---|---|
| Gender | Woman |
| Age | 54 |
| Weight | 68 kg |
| Size | 152 cm |
| Neck circumference length | 34 cm |
| Habits | - |
| Drug treatments | Benzodiazepines and relaxing/hypnotic drugs |
| Illnesses | Depression |
| No. | Gender | Age | BMI | NCL | Habits | Drug Treatments | Illnesses | AHI | Results | ||||
|---|---|---|---|---|---|---|---|---|---|---|---|---|---|
| 1 | Woman | 70 | 26.40 | 34 cm |
| - |
| 9.70 | Statistical inference | ||||
| 10 | 15 | 20 | 25 | 30 | |||||||||
| Correcting block | |||||||||||||
| 10 | 15 | 20 | 25 | 30 | |||||||||
| 2 | Man | 71 | 38.20 | 41 cm |
| - |
| 38 | Statistical inference | ||||
| 10 | 15 | 20 | 25 | 30 | |||||||||
| Correcting block | |||||||||||||
| 10 | 15 | 20 | 25 | 30 | |||||||||
| 3 | Man | 48 | 38.93 | 47 cm |
| - |
| 80 | Statistical inference | ||||
| 10 | 15 | 20 | 25 | 30 | |||||||||
| Correcting block | |||||||||||||
| 10 | 15 | 20 | 25 | 30 | |||||||||
| 4 | Woman | 34 | 44.29 | 40 cm | - | - | - | 4.50 | Statistical inference | ||||
| 10 | 15 | 20 | 25 | 30 | |||||||||
| Correcting block | |||||||||||||
| 10 | 15 | 20 | 25 | 30 | |||||||||
| 5 | Man | 41 | 28.09 | 36 cm |
| - Relaxing/hypnotic drugs- Antidepressants |
| 23.40 | Statistical inference | ||||
| 10 | 15 | 20 | 25 | 30 | |||||||||
| Correcting block | |||||||||||||
| 10 | 15 | 20 | 25 | 30 | |||||||||
| 6 | Man | 39 | 30.16 | 41 cm |
| - | - | 8 | Statistical inference | ||||
| 10 | 15 | 20 | 25 | 30 | |||||||||
| Correcting block | |||||||||||||
| 10 | 15 | 20 | 25 | 30 | |||||||||
| 7 | Man | 68 | 30.12 | 41 cm | - | - | - | 26.70 | Statistical inference | ||||
| 10 | 15 | 20 | 25 | 30 | |||||||||
| Correcting block | |||||||||||||
| 10 | 15 | 20 | 25 | 30 | |||||||||
| 8 | Woman | 66 | 30.70 | 34 cm | - | - |
| 19.70 | Statistical inference | ||||
| 10 | 15 | 20 | 25 | 30 | |||||||||
| Correcting block | |||||||||||||
| 10 | 15 | 20 | 25 | 30 | |||||||||
| 9 | Man | 62 | 30.49 | 46 cm |
| - | - | 24.30 | Statistical inference | ||||
| 10 | 15 | 20 | 25 | 30 | |||||||||
| Correcting block | |||||||||||||
| 10 | 15 | 20 | 25 | 30 | |||||||||
| 10 | Man | 32 | 32.98 | 41 cm |
| - | - | 26.10 | Statistical inference | ||||
| 10 | 15 | 20 | 25 | 30 | |||||||||
| Correcting block | |||||||||||||
| 10 | 15 | 20 | 25 | 30 | |||||||||
| 11 | Man | 74 | 29.36 | 42 cm | - | - |
| 37.70 | Statistical inference | ||||
| 10 | 15 | 20 | 25 | 30 | |||||||||
| Correcting block | |||||||||||||
| 10 | 15 | 20 | 25 | 30 | |||||||||
| 12 | Woman | 48 | 21.93 | 33 cm |
| - | - | 0.90 | Statistical inference | ||||
| 10 | 15 | 20 | 25 | 30 | |||||||||
| Correcting block | |||||||||||||
| 10 | 15 | 20 | 25 | 30 | |||||||||
| 13 | Man | 59 | 52.81 | 39 cm |
| - | - | 24.60 | Statistical inference | ||||
| 10 | 15 | 20 | 25 | 30 | |||||||||
| Correcting block | |||||||||||||
| 10 | 15 | 20 | 25 | 30 | |||||||||
| 14 | Woman | 69 | 32.07 | 36 cm | - | - |
| 27.70 | Statistical inference | ||||
| 10 | 15 | 20 | 25 | 30 | |||||||||
| Correcting block | |||||||||||||
| 10 | 15 | 20 | 25 | 30 | |||||||||
| 15 | Man | 44 | 29.76 | 37 cm | - | - | - | 4.90 | Statistical inference | ||||
| 10 | 15 | 20 | 25 | 30 | |||||||||
| Correcting block | |||||||||||||
| 10 | 15 | 20 | 25 | 30 | |||||||||
| 16 | Woman | 73 | 24.35 | 34 cm | - |
| - | 17.60 | Statistical inference | ||||
| 10 | 15 | 20 | 25 | 30 | |||||||||
| Correcting block | |||||||||||||
| 10 | 15 | 20 | 25 | 30 | |||||||||
| 17 | Man | 39 | 28.73 | 42 cm |
|
| - | 0 | Statistical inference | ||||
| 10 | 15 | 20 | 25 | 30 | |||||||||
| Correcting block | |||||||||||||
| 10 | 15 | 20 | 25 | 30 | |||||||||
| 18 | Man | 48 | 29.03 | 43 cm |
| - | - | 61.90 | Statistical inference | ||||
| 10 | 15 | 20 | 25 | 30 | |||||||||
| Correcting block | |||||||||||||
| 10 | 15 | 20 | 25 | 30 | |||||||||
| 19 | Woman | 52 | 33.33 | 37 cm | - | - | - | 3.40 | Statistical inference | ||||
| 10 | 15 | 20 | 25 | 30 | |||||||||
| Correcting block | |||||||||||||
| 10 | 15 | 20 | 25 | 30 | |||||||||
| 20 | Man | 29 | 41.40 | 37 cm |
| - | - | 6 | Statistical inference | ||||
| 10 | 15 | 20 | 25 | 30 | |||||||||
| Correcting block | |||||||||||||
| 10 | 15 | 20 | 25 | 30 | |||||||||
| Methods/Systems | Internal Architecutre | Scalability | Inference | Learning |
|---|---|---|---|---|
| Corrado Mencar et al. [16], Ramesh et al. [19] and Wen-Chi Huang et al. [20] | The authors’ proposals are based on the use of Machine Learning techniques, highlighting the use of Support Vector Machines in all of them. A probabilistic management of uncertainty is carried out. | The systems are not scalable. | The systems use statistical inference instead of symbolic reasoning. | The proposed system incorporates new knowledge in the process of training the architecture. |
| Berk Ustun et al. [17] | The authors’ proposal is based on the use of Machine Learning techniques. They highlight the use of Supersparse Linear Integer Models. A probabilistic management of uncertainty is performed. | The system is not scalable. | The system uses statistical inference instead of symbolic reasoning. | The system incorporates new knowledge in the process of training the architecture. |
| Our proposal | The proposed system manages uncertainty both from a probabilistic and a non-probabilistic point of view. | The proposed system is scalable, since it is possible to modify the calculation engines. | The system uses statistical as well as symbolic inferential approaches, although it does not fully formalize a knowledge base. | The system can incorporate new knowledge as it is being used. |
Disclaimer/Publisher’s Note: The statements, opinions and data contained in all publications are solely those of the individual author(s) and contributor(s) and not of MDPI and/or the editor(s). MDPI and/or the editor(s) disclaim responsibility for any injury to people or property resulting from any ideas, methods, instructions or products referred to in the content. |
© 2023 by the authors. Licensee MDPI, Basel, Switzerland. This article is an open access article distributed under the terms and conditions of the Creative Commons Attribution (CC BY) license (https://creativecommons.org/licenses/by/4.0/).
Share and Cite
Casal-Guisande, M.; Torres-Durán, M.; Mosteiro-Añón, M.; Cerqueiro-Pequeño, J.; Bouza-Rodríguez, J.-B.; Fernández-Villar, A.; Comesaña-Campos, A. Design and Conceptual Proposal of an Intelligent Clinical Decision Support System for the Diagnosis of Suspicious Obstructive Sleep Apnea Patients from Health Profile. Int. J. Environ. Res. Public Health 2023, 20, 3627. https://doi.org/10.3390/ijerph20043627
Casal-Guisande M, Torres-Durán M, Mosteiro-Añón M, Cerqueiro-Pequeño J, Bouza-Rodríguez J-B, Fernández-Villar A, Comesaña-Campos A. Design and Conceptual Proposal of an Intelligent Clinical Decision Support System for the Diagnosis of Suspicious Obstructive Sleep Apnea Patients from Health Profile. International Journal of Environmental Research and Public Health. 2023; 20(4):3627. https://doi.org/10.3390/ijerph20043627
Chicago/Turabian StyleCasal-Guisande, Manuel, María Torres-Durán, Mar Mosteiro-Añón, Jorge Cerqueiro-Pequeño, José-Benito Bouza-Rodríguez, Alberto Fernández-Villar, and Alberto Comesaña-Campos. 2023. "Design and Conceptual Proposal of an Intelligent Clinical Decision Support System for the Diagnosis of Suspicious Obstructive Sleep Apnea Patients from Health Profile" International Journal of Environmental Research and Public Health 20, no. 4: 3627. https://doi.org/10.3390/ijerph20043627