
Overview of the Role of Spatial Factors in Indoor SARS-CoV-2 Transmission: A Space-Based Framework for Assessing the Multi-Route Infection Risk

Abstract
:1. Introduction
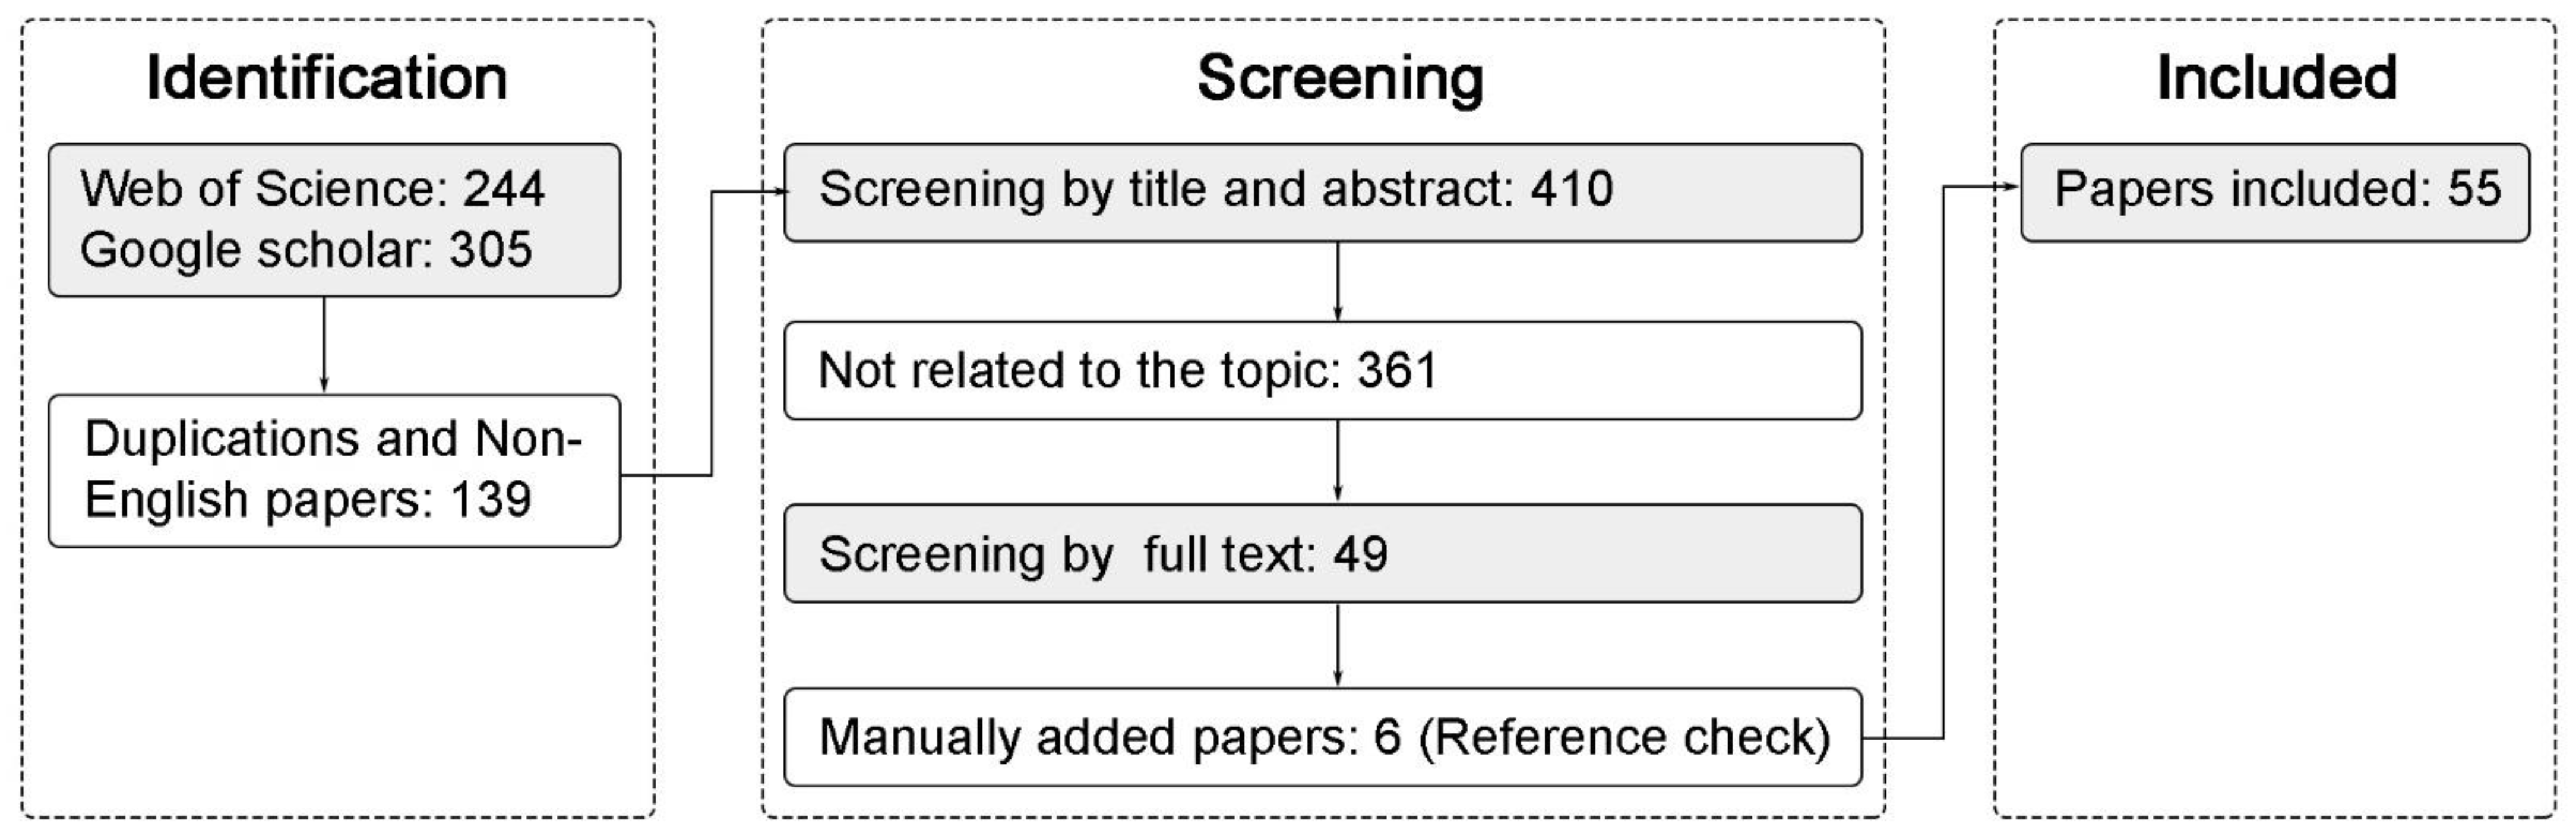
2. Methodology and General Result
3. Multi-Route Transmission of SARS-CoV-2
3.1. The Emission of Infectious Respiratory Fluids
3.2. Evaporation, Deposition and Dispersion
3.3. Exposure and Infection
3.4. Classification of SARS-CoV-2 Transmission Routes
- Immediate physical contact, including face, hands, and other exposed skin;
- Personal fomite contact, including clothes, glasses, hats, ties, telephones, and other items passed by hand;
- Face-to-face contact, including being coughed or sneezed on or talking within 1 m.
- Having been within 1.5 m without face-to-face contact,
- Contact contaminated surfaces, such as door handles, elevator buttons, and water dispenser buttons;
- Inhalation of contaminated aerosols.
4. The Role of Spatial Factors on SARS-CoV-2 Transmission
4.1. Distribution of SARS-CoV-2 in Indoor Spaces
4.2. Spatial Factors Involved in SARS-CoV-2 Transmission
4.3. Spatial Effects on Virus Droplet-Based and Surface-Based Transmission
4.3.1. (SL-BHH/BHO-VS) Spatial Layout Affects Human-To-Human and Human-To-Building Interactions
4.3.2. (SP-BHO-VS) Touchless Design for Public Facilities Helps Reduce Exposure to Fomites
4.4. Spatial Effects on Virus Air-Based Transmission
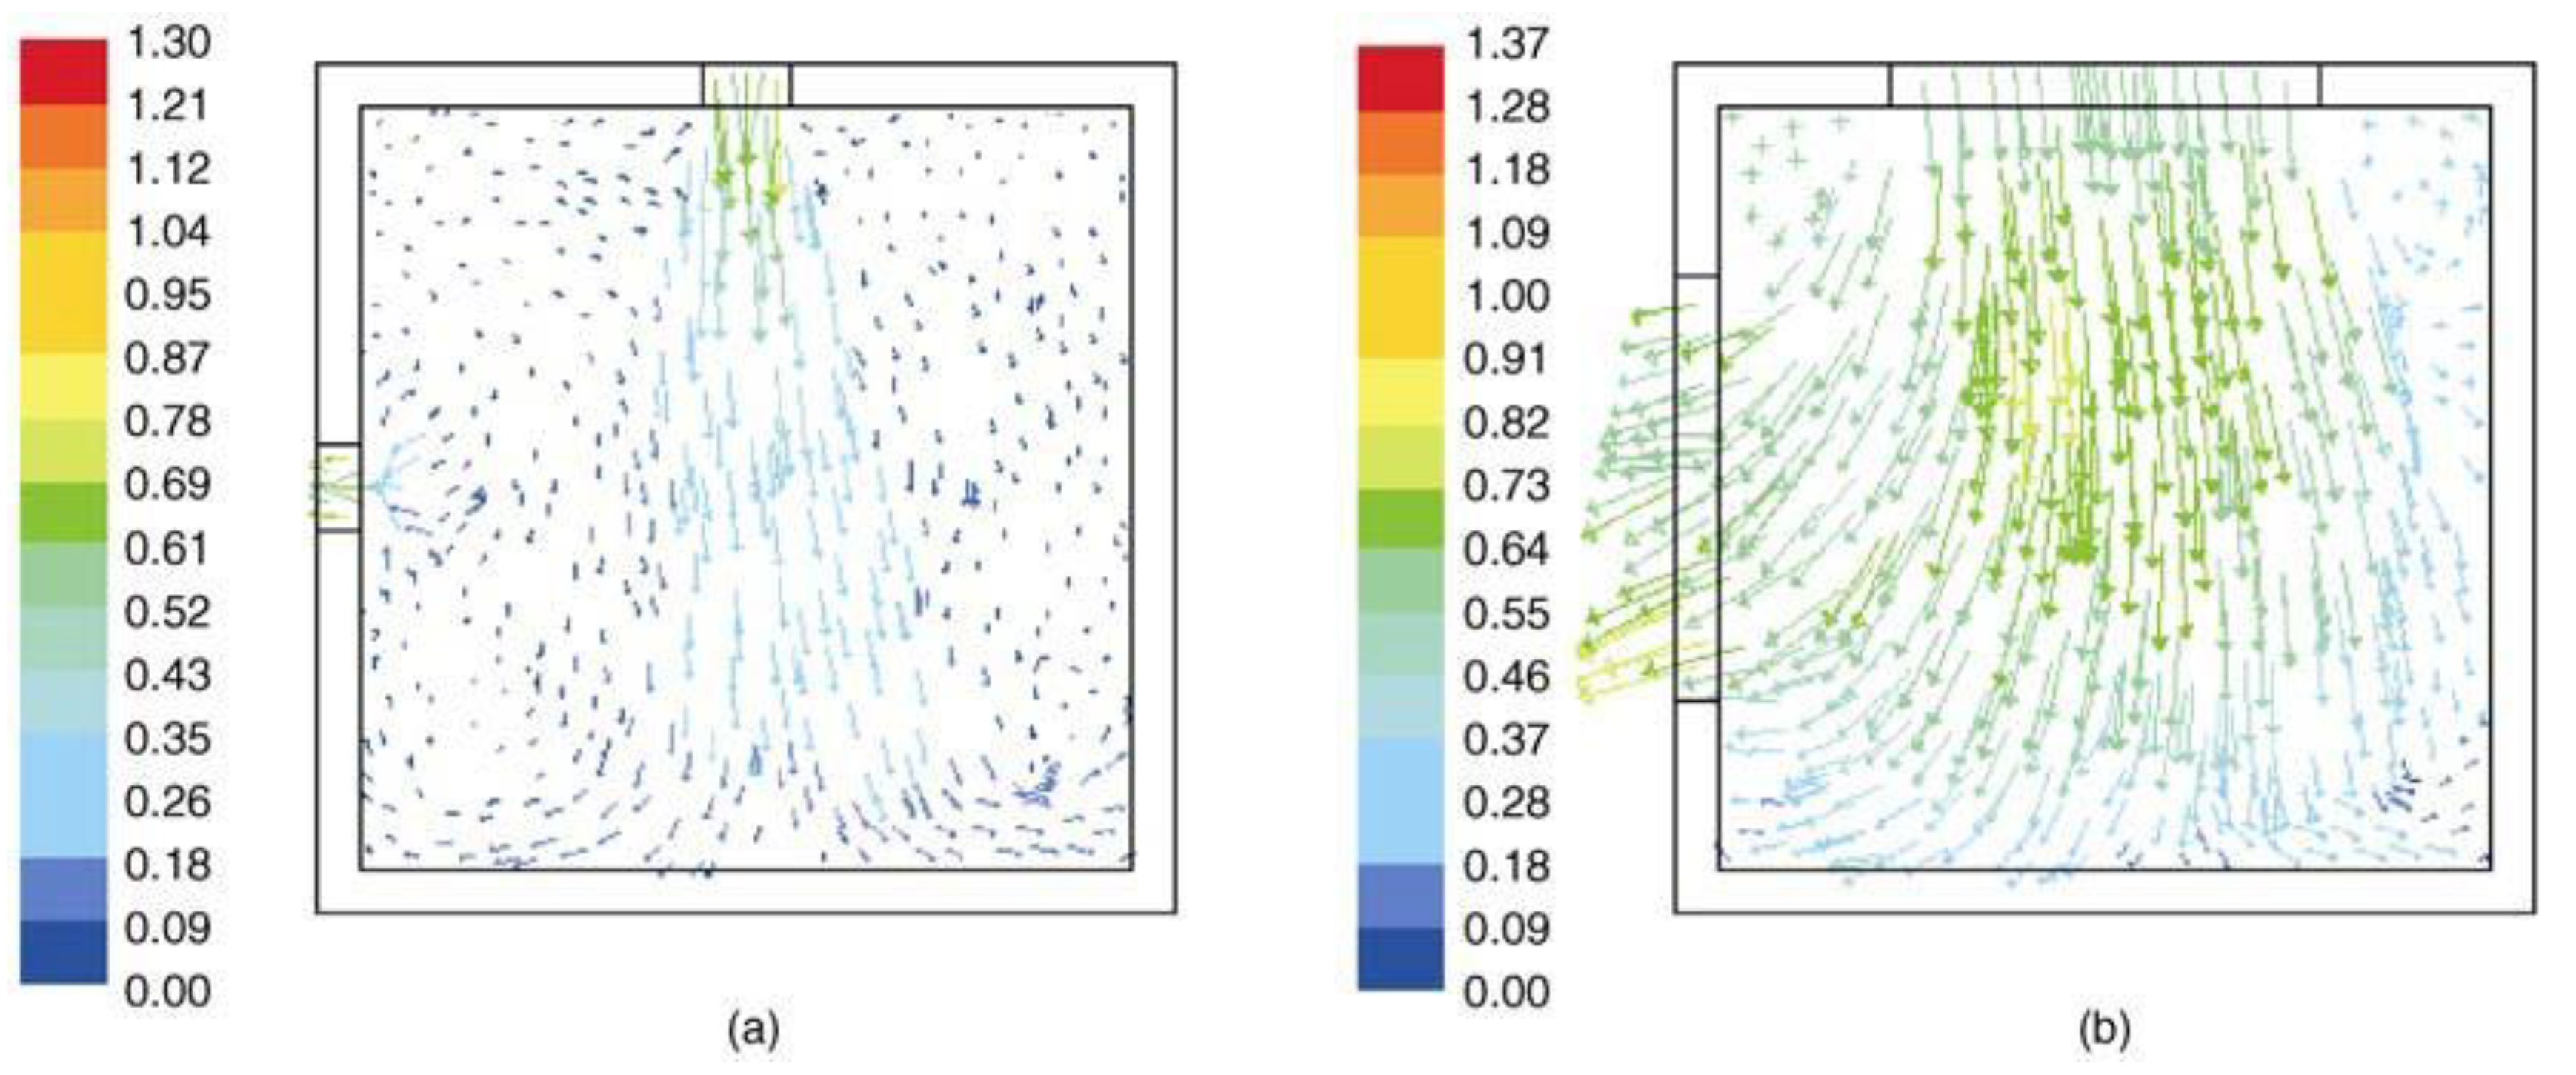
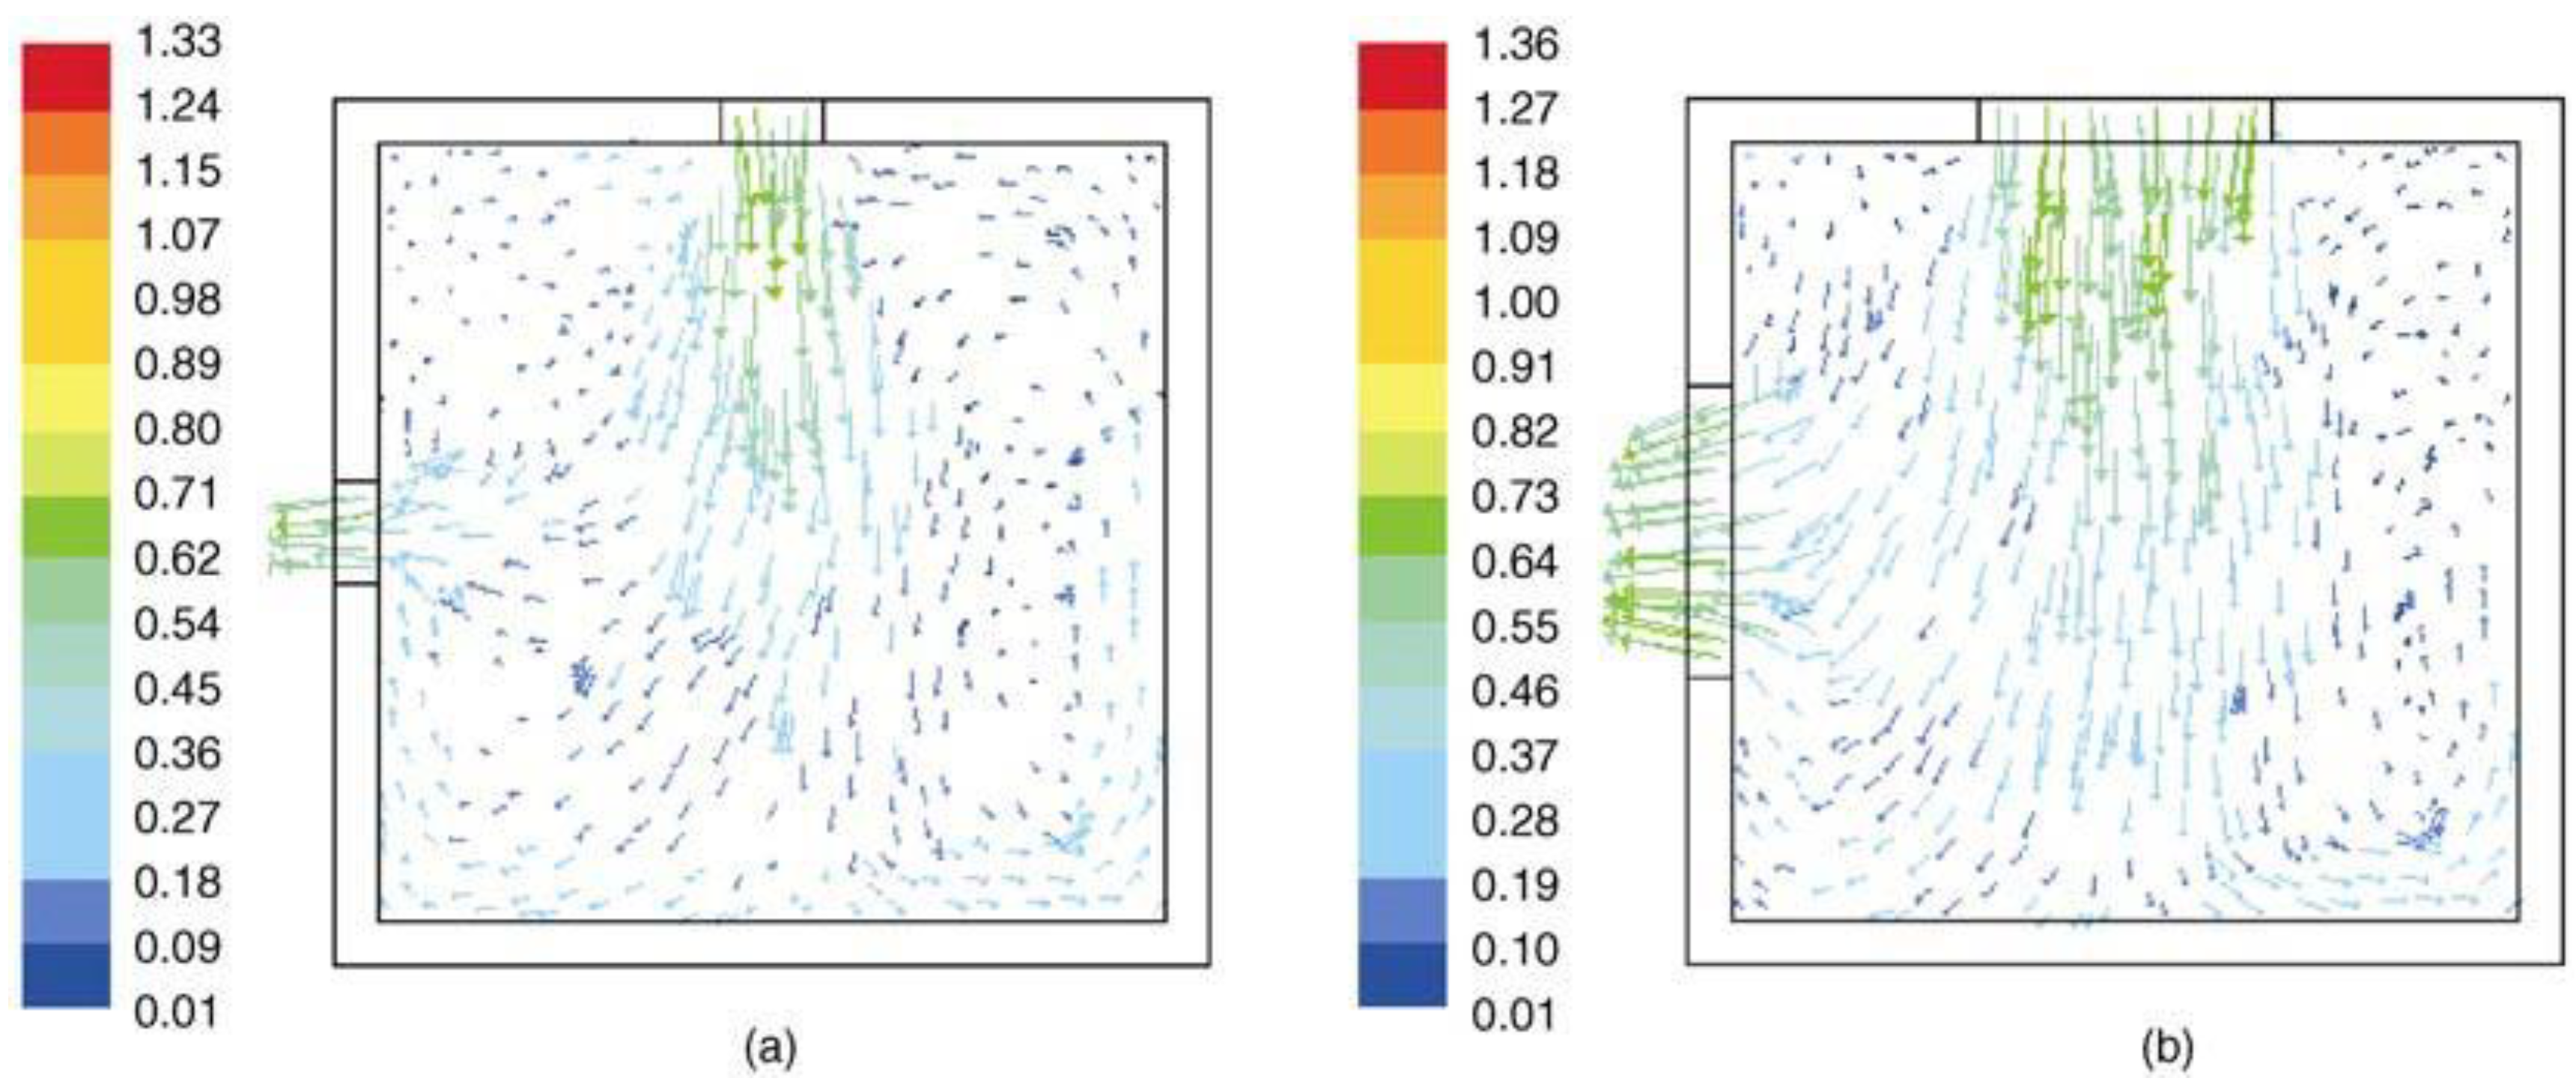
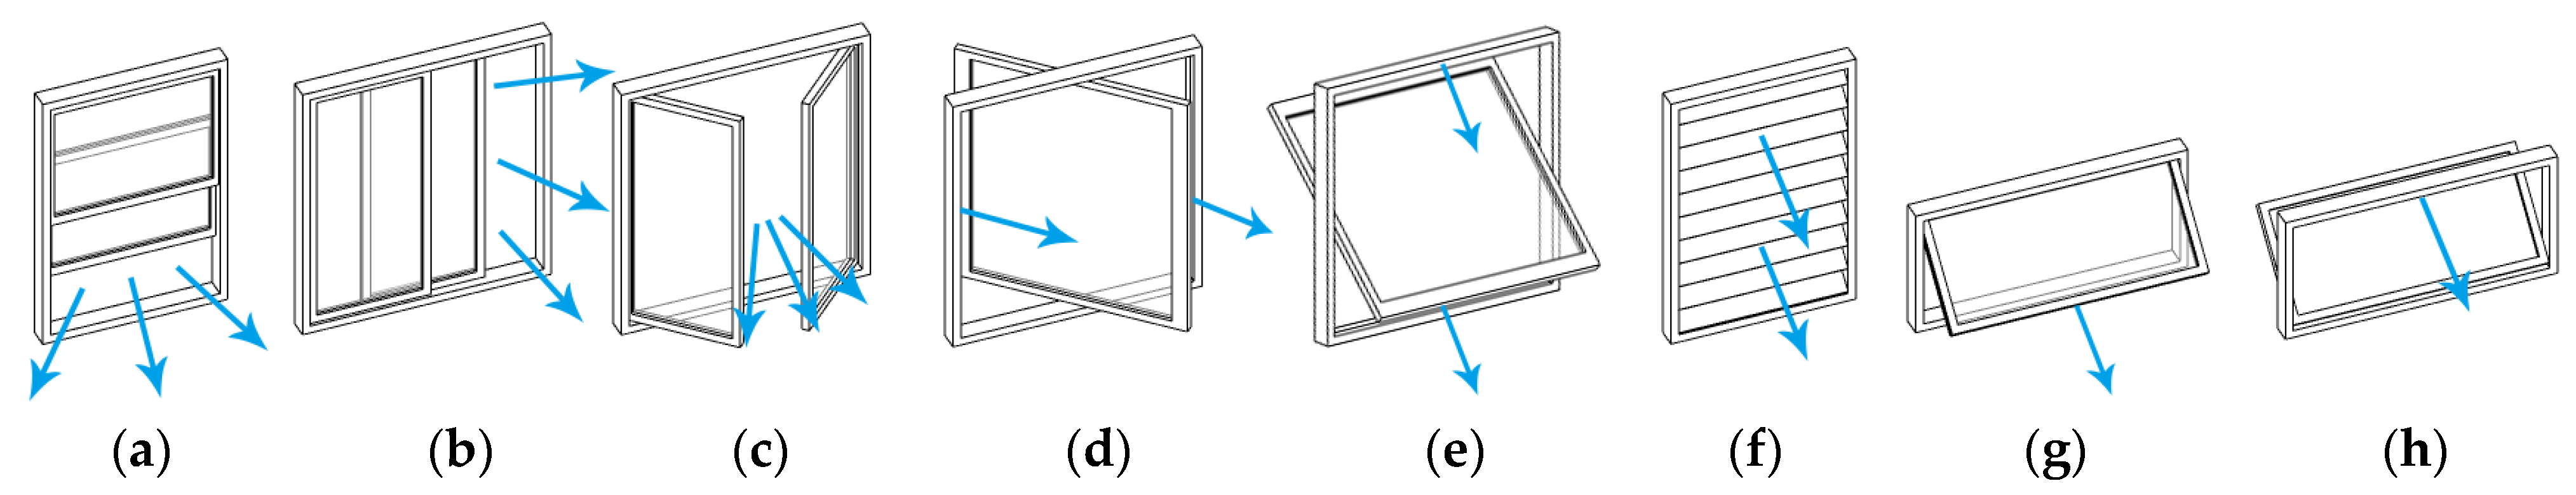
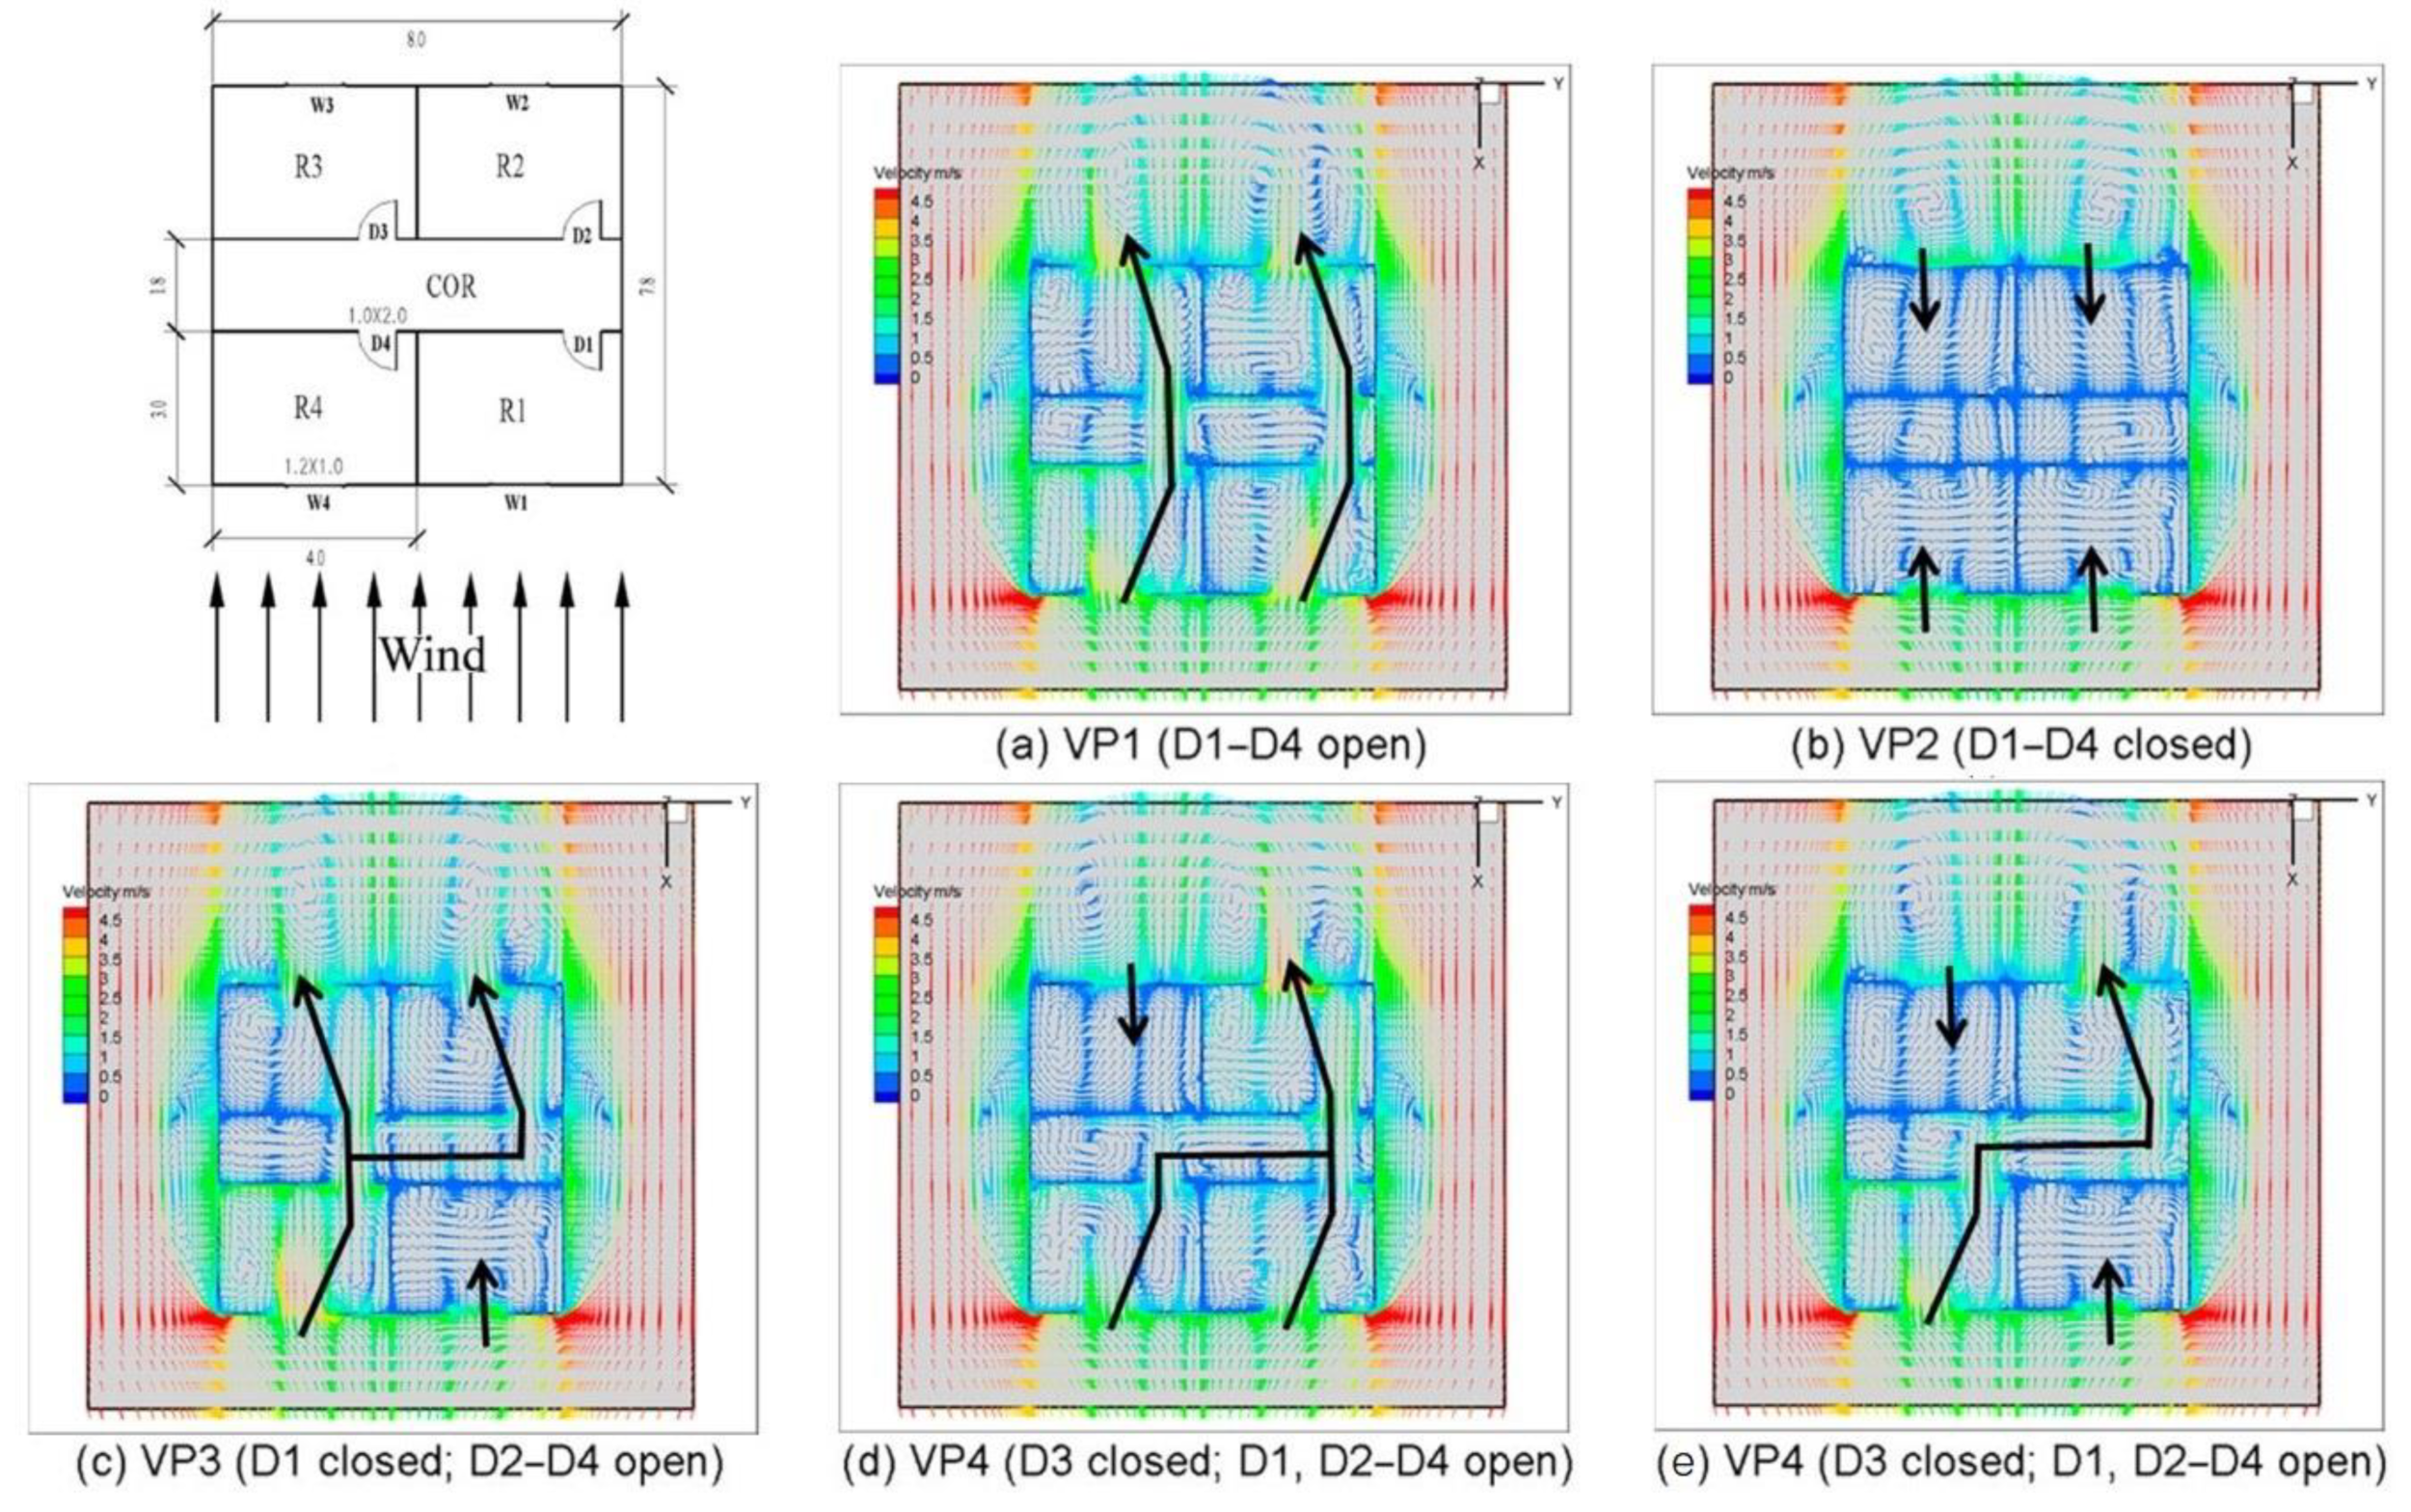
4.4.1. (SO-EA-VS) Opening Design Determines Airflow Field Due to Natural Ventilation
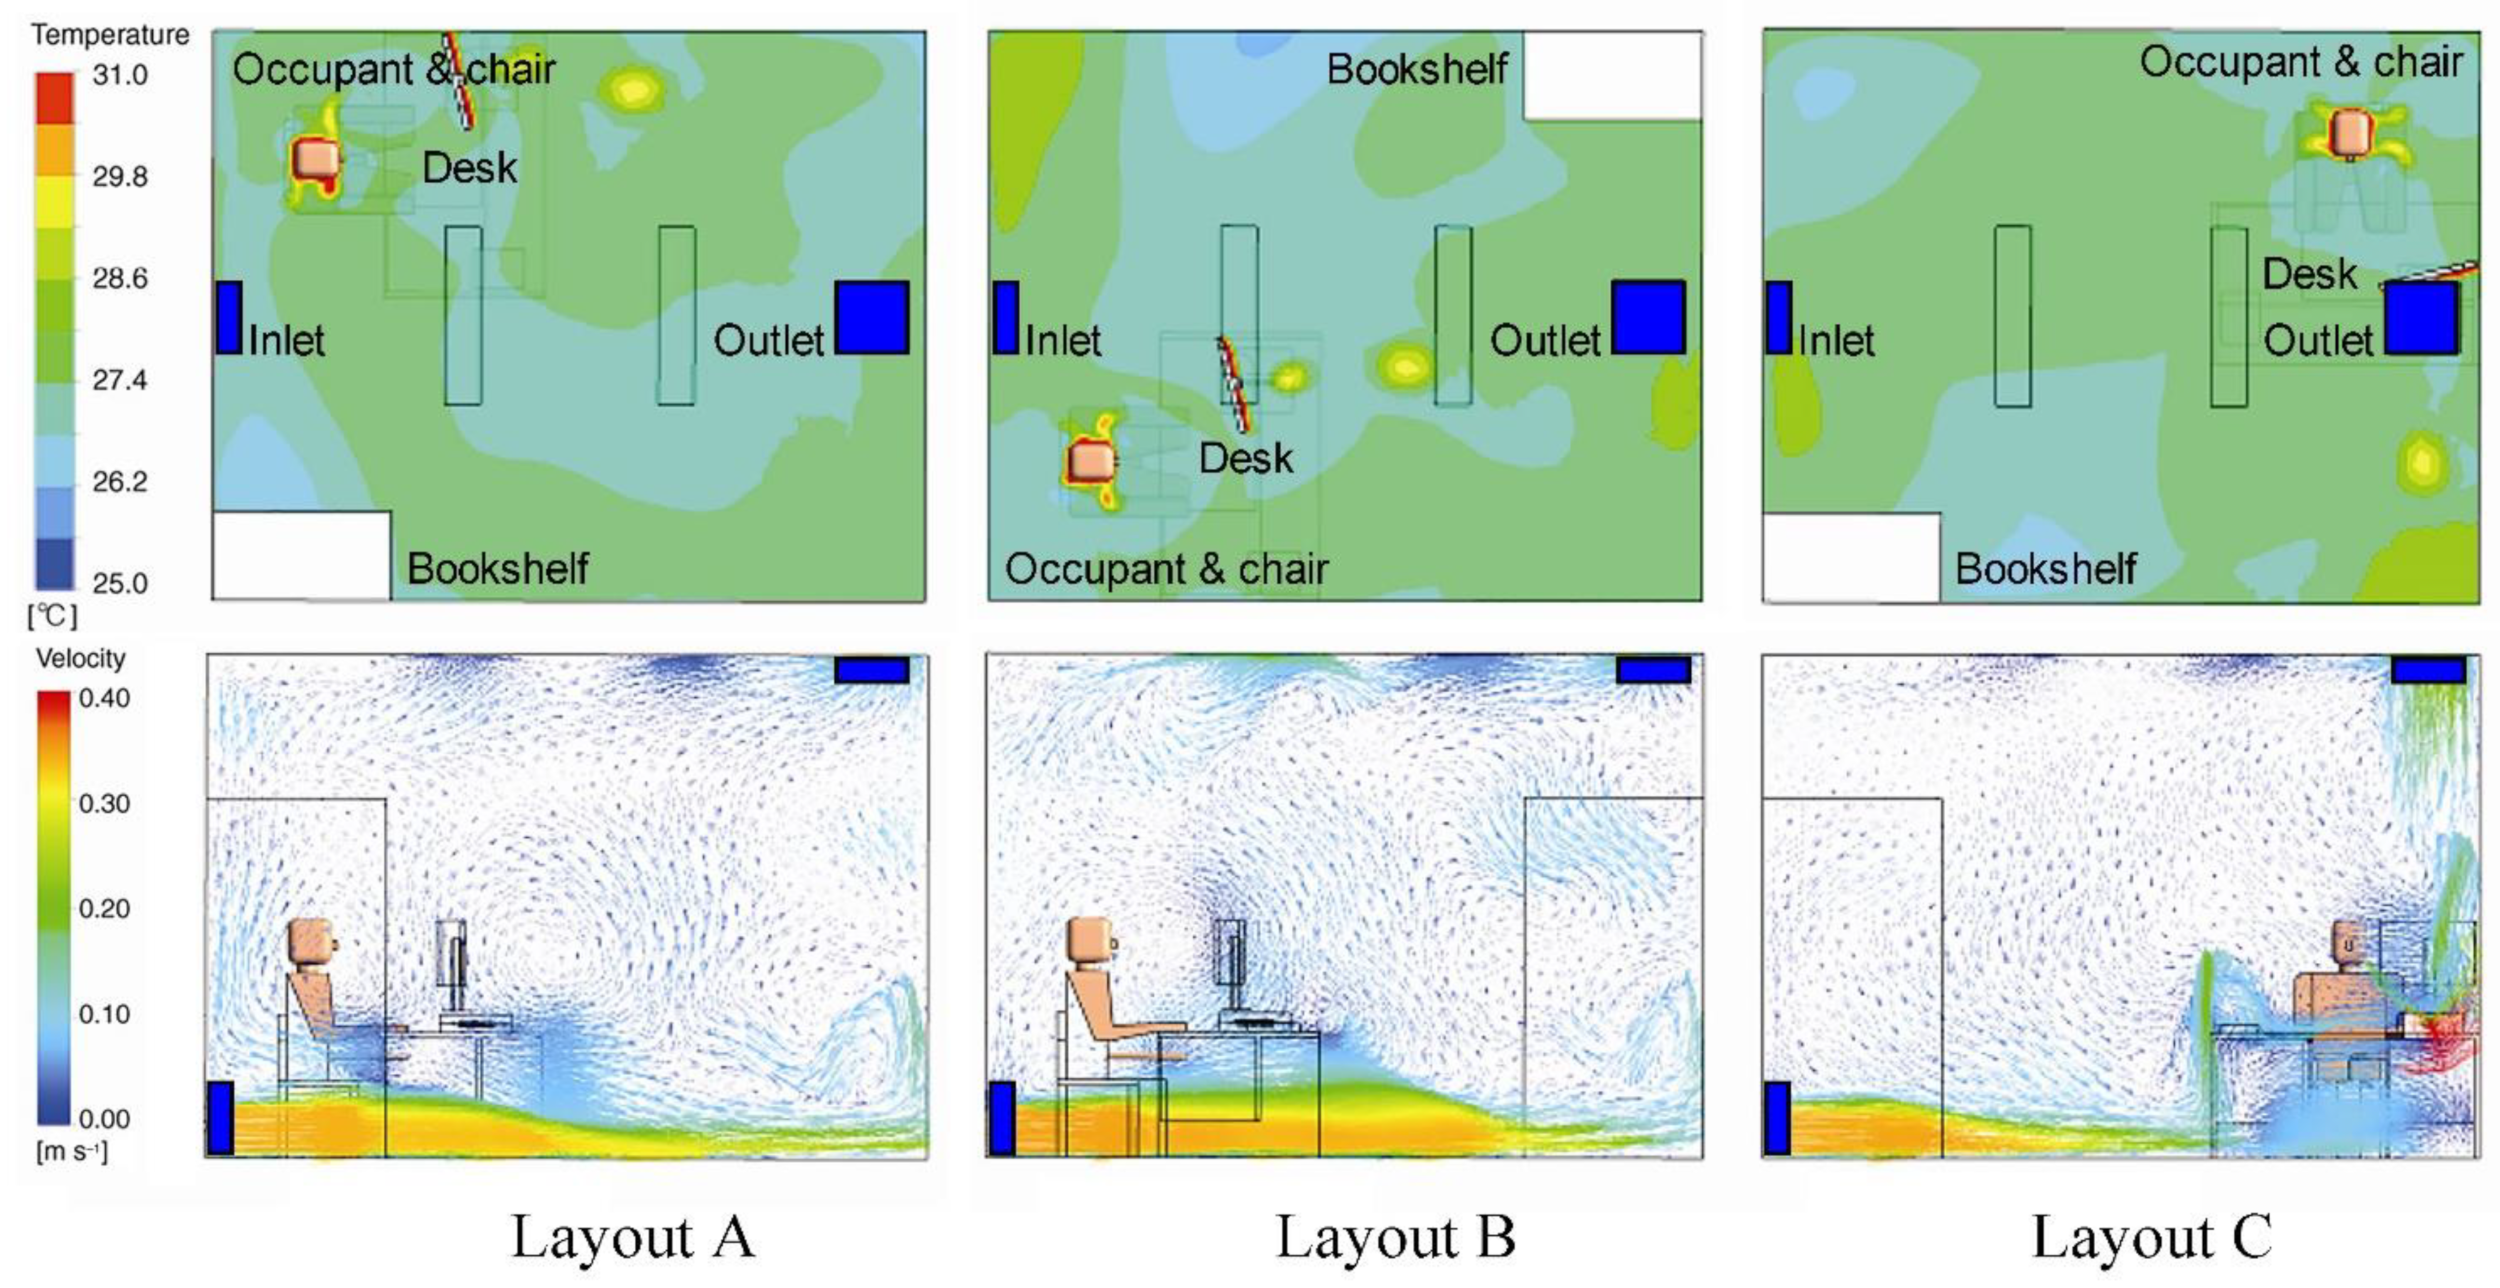
4.4.2. (SL-EA-VS) Physical Layout Affects the Distribution of Virus Concentration
4.5. Spatial Effects on Virus Viability
4.5.1. (SP-VV) Virus Viability Varies with Surface Material of Indoor Public Facilities
4.5.2. (SO-ETRH-VV) Window Openings and Physical Layout Change Indoor AT and RH
4.5.3. (SO-EL-VV) Daylighting Introduced by Windows Accelerates Virus Decay
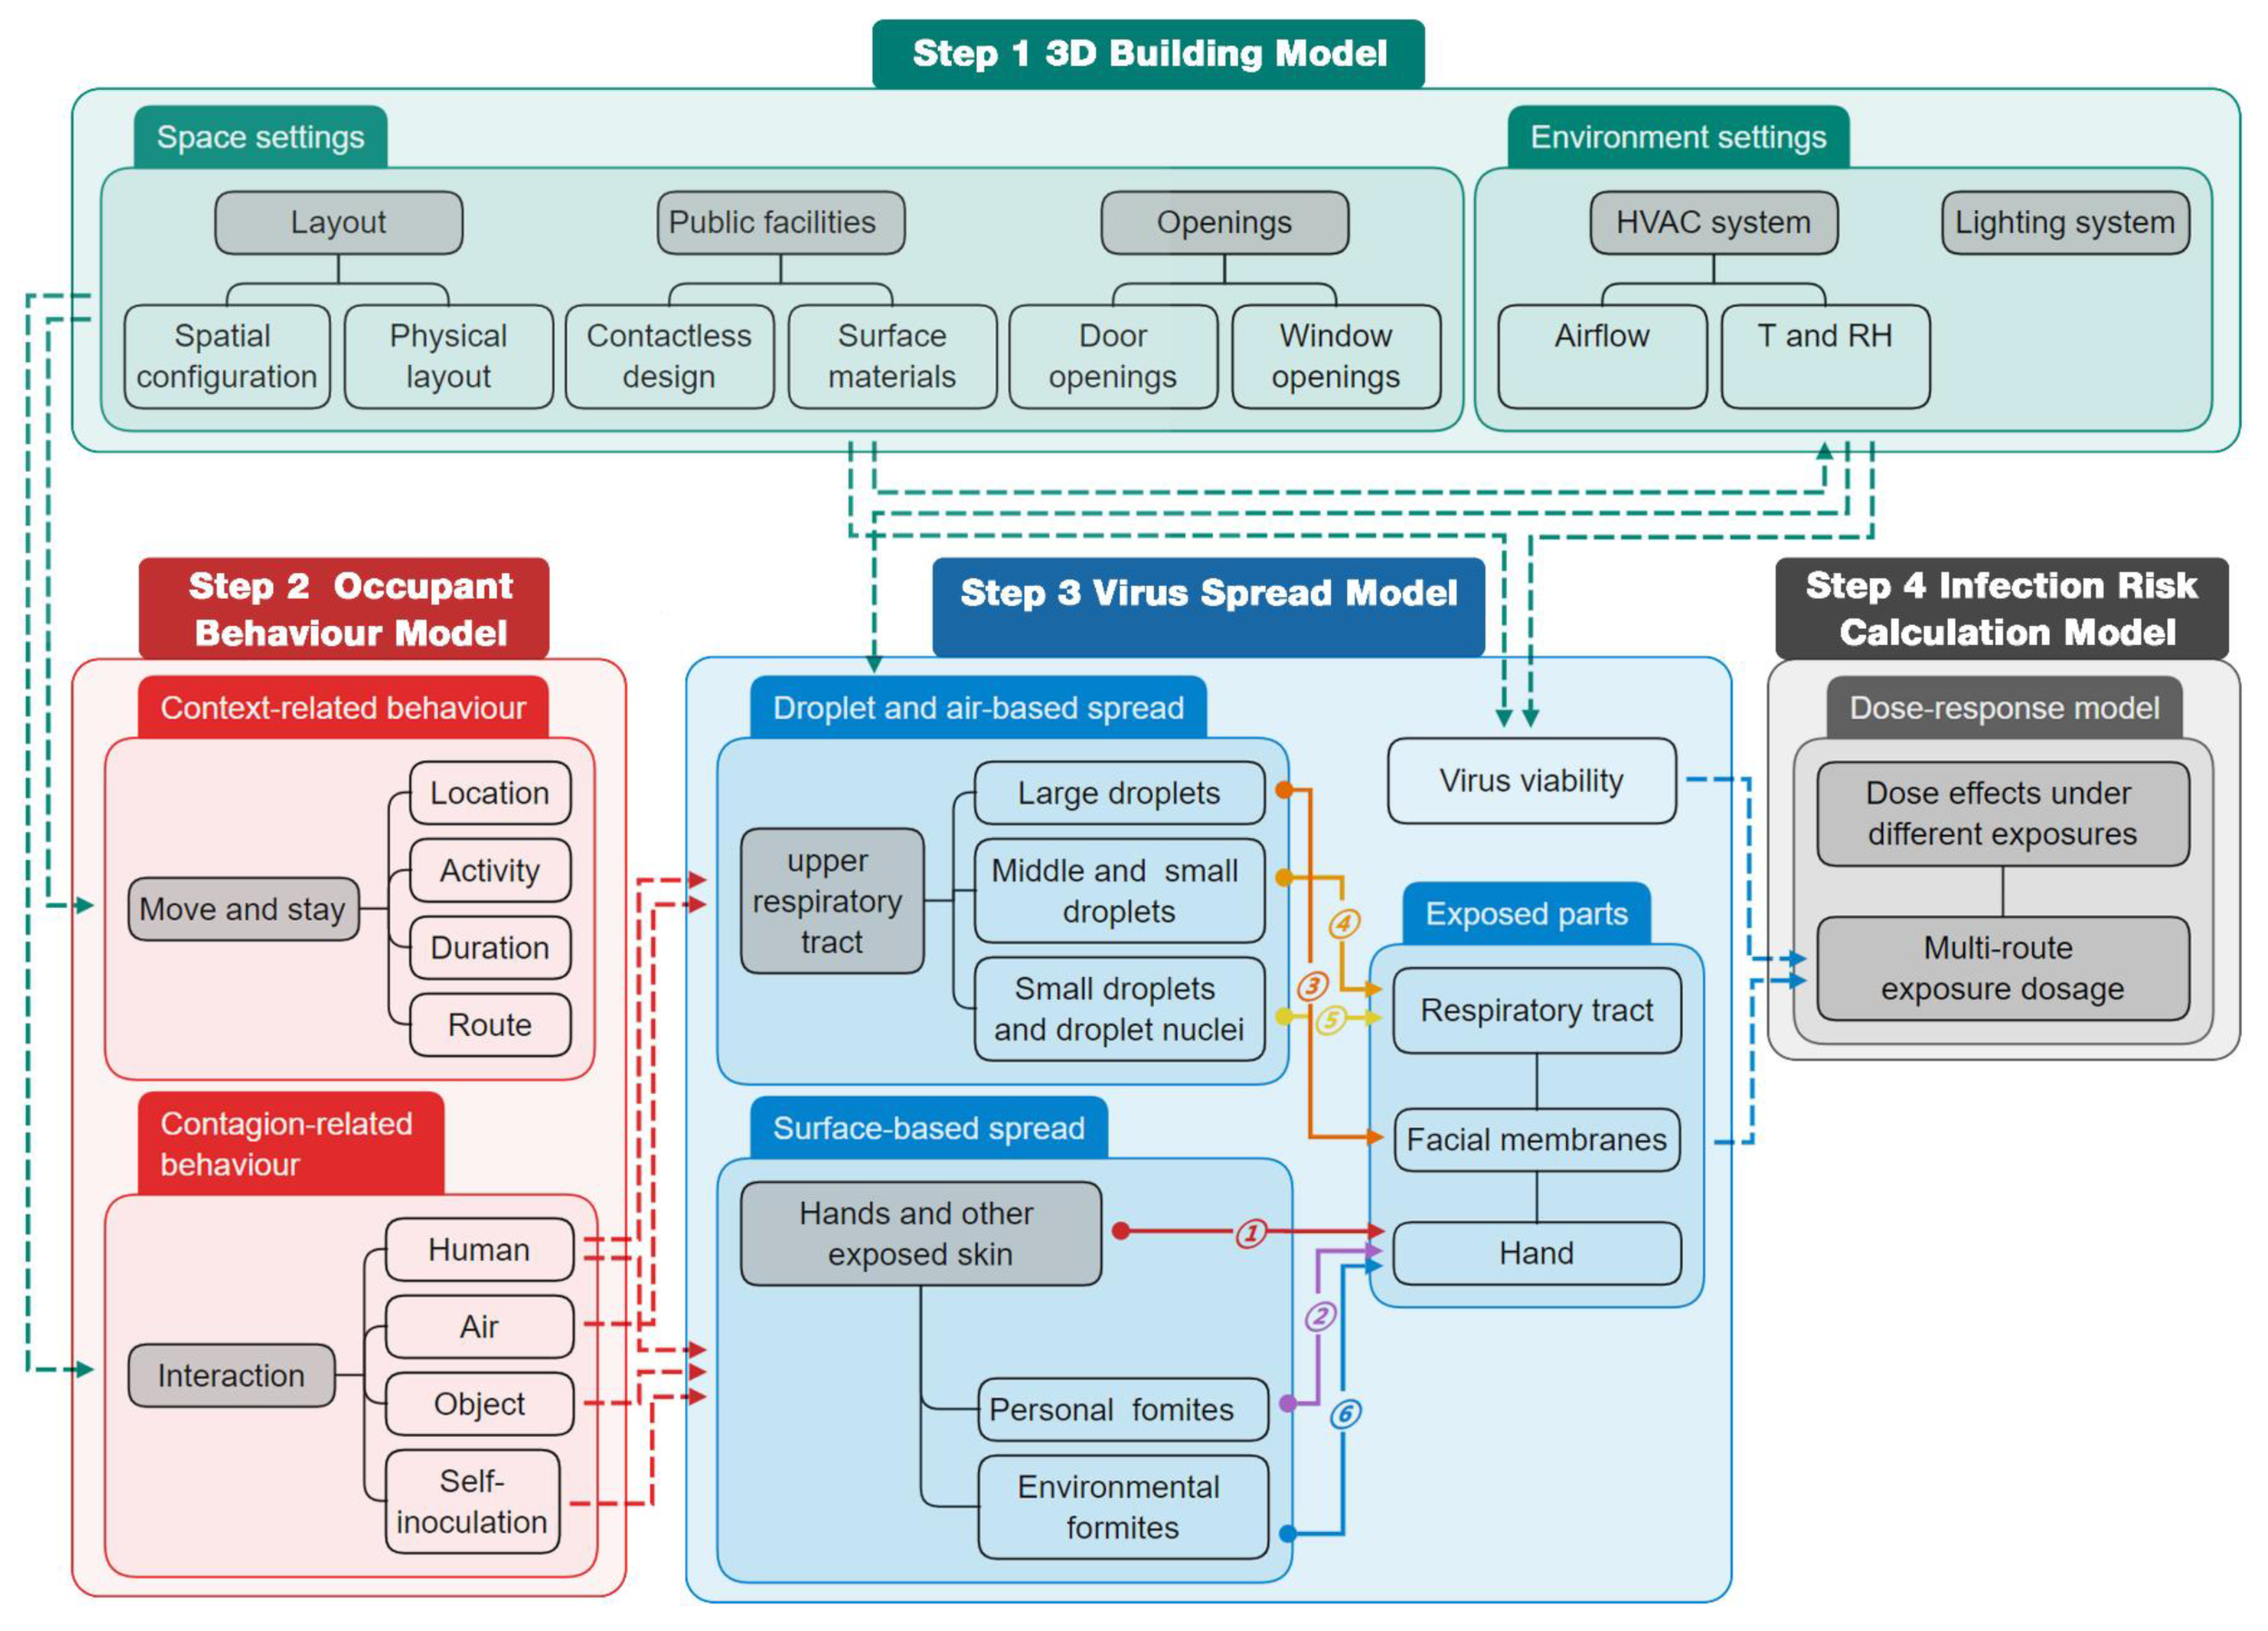
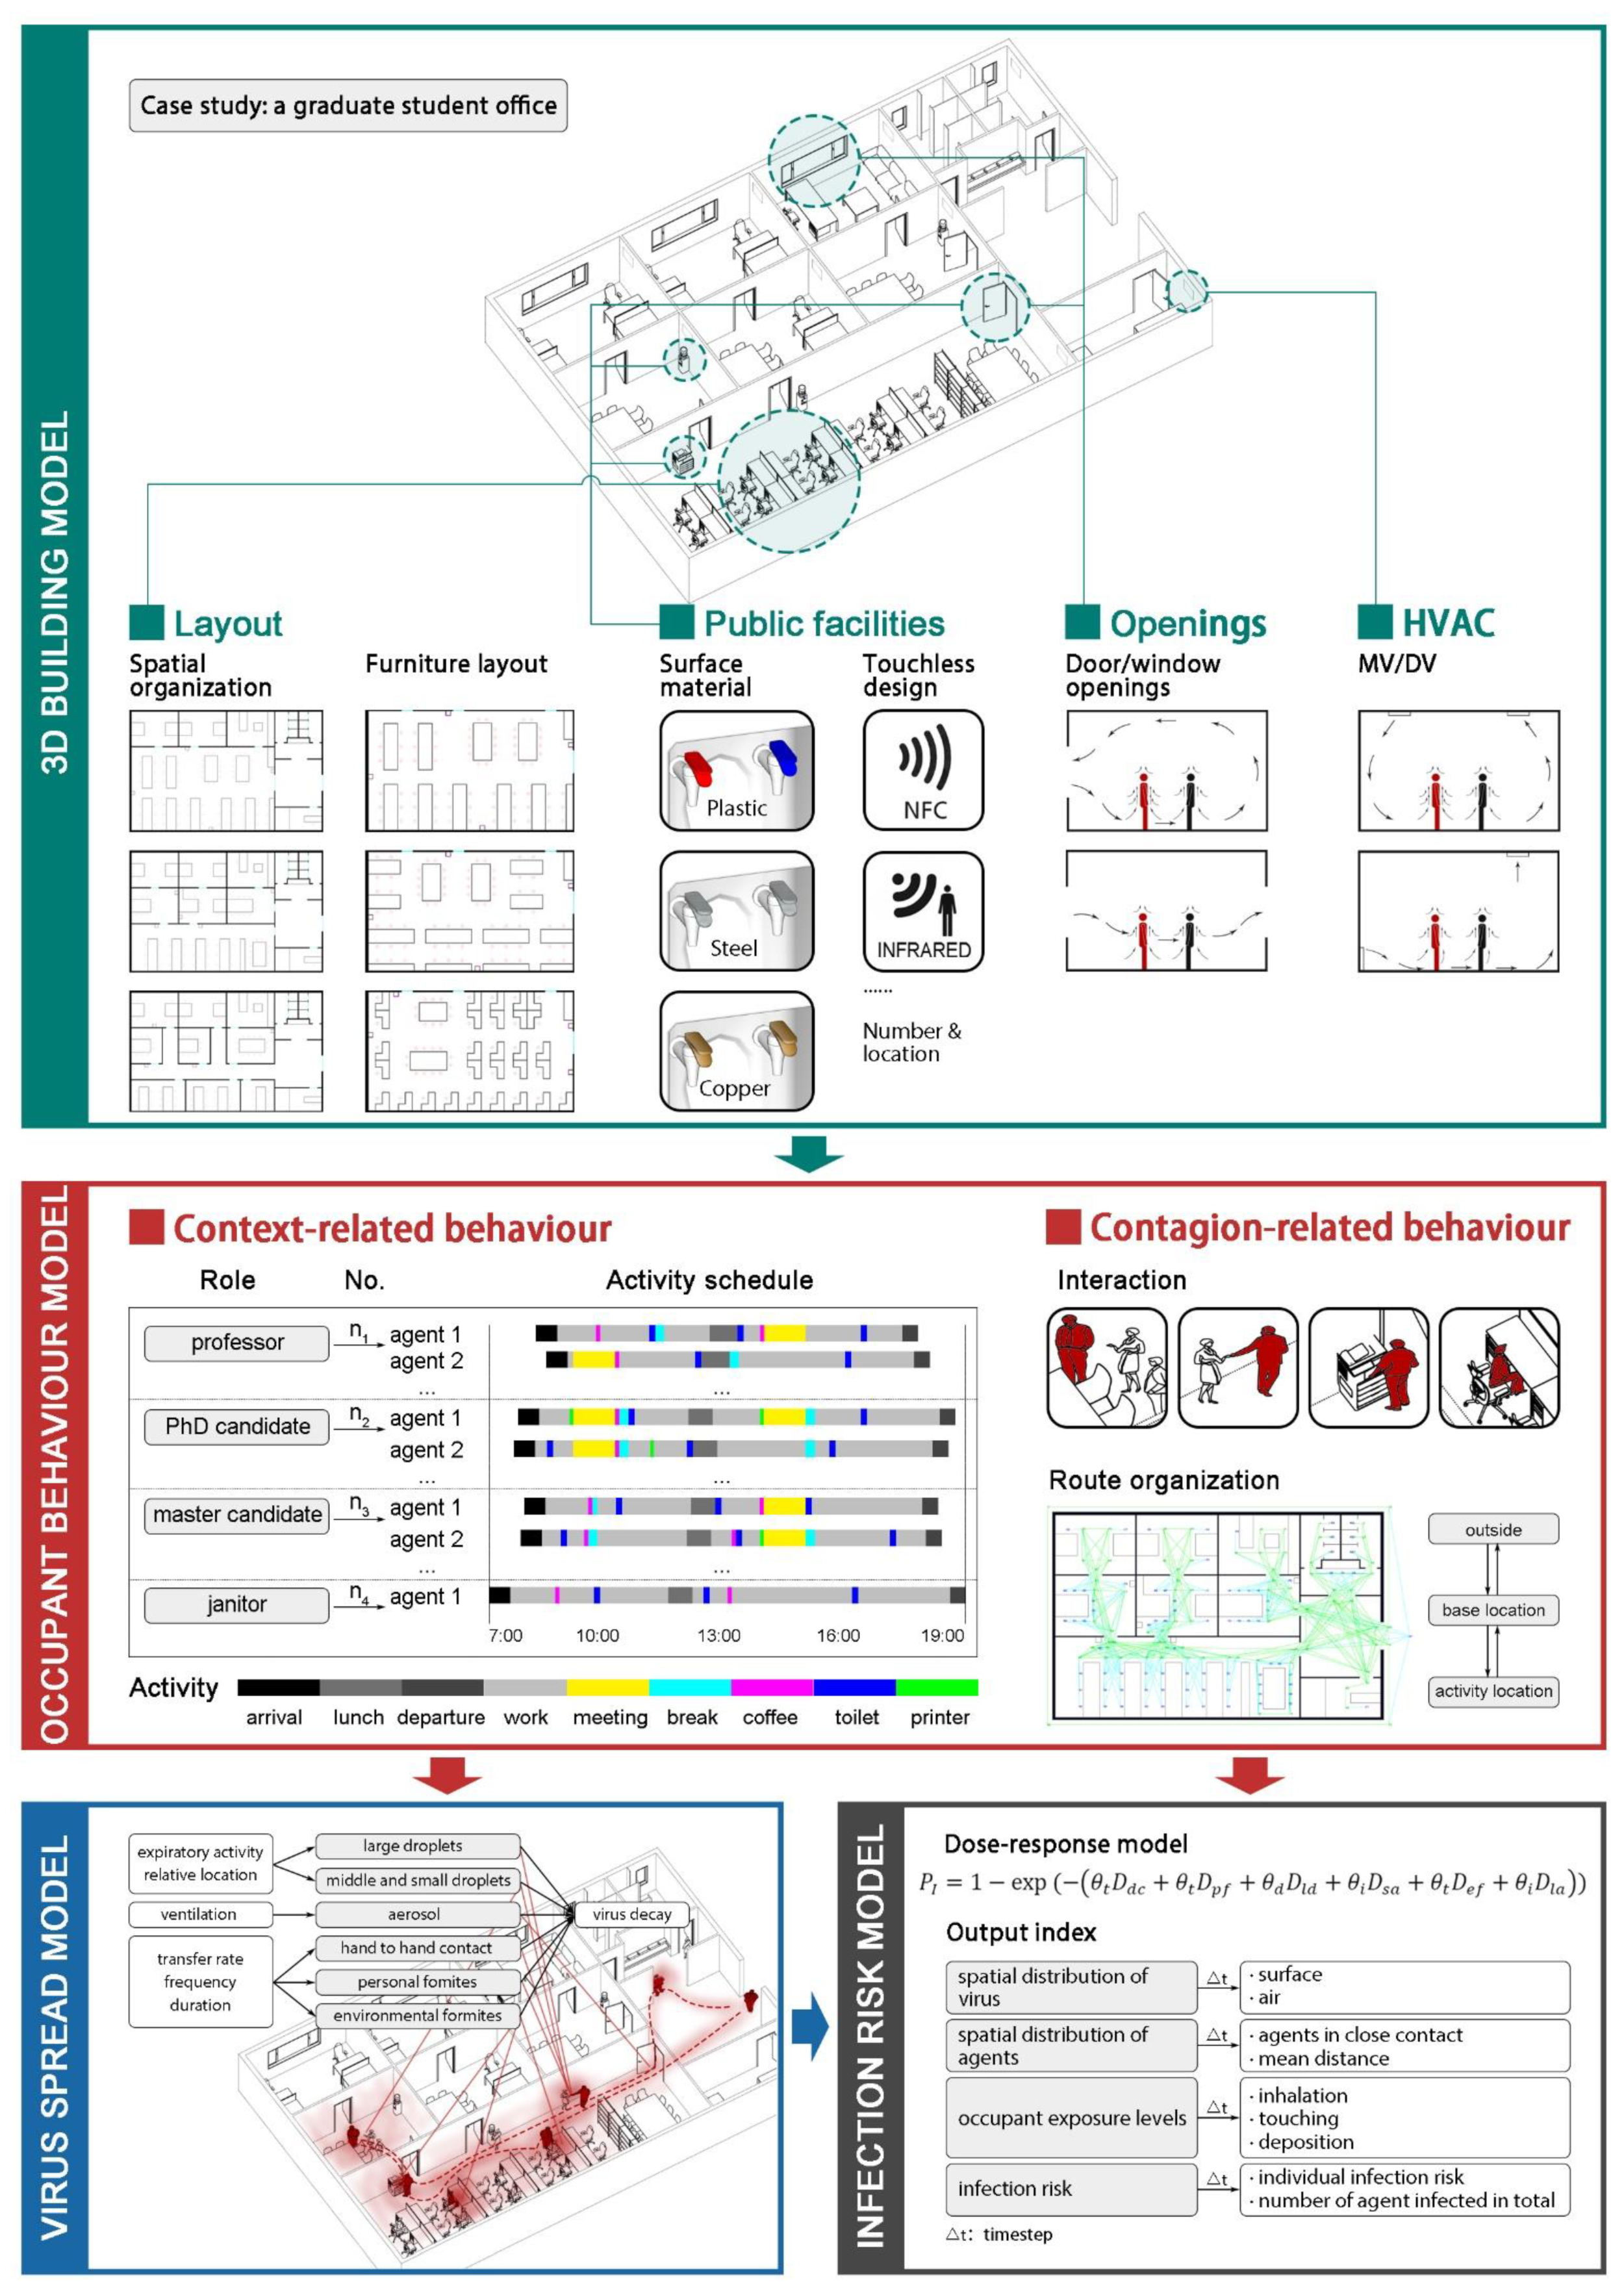
5. A Space-Based Framework to Assess the Indoor Infection Risk
5.1. 3D Building Model
5.2. Occupant Behavior Model
5.2.1. Context-Related Behavior
5.2.2. Contagion-Related Behaviors
5.3. Virus Spread Model
5.4. Infection Risk Calculation Model
5.5. Case Study
6. Discussion and Limitations
7. Conclusions
Author Contributions
Funding
Institutional Review Board Statement
Informed Consent Statement
Data Availability Statement
Conflicts of Interest
References
- WHO. Coronavirus Disease (COVID-19) Pandemic. Available online: https://www.who.int/emergencies/diseases/novel-coronavirus-2019 (accessed on 26 July 2022).
- Alimohamadi, Y.; Taghdir, M.; Sepandi, M. Estimate of the basic reproduction number for COVID-19: A systematic review and meta-analysis. J. Prev. Med. Public Health 2020, 53, 151. [Google Scholar]
- Leclerc, Q.J.; Fuller, N.M.; Knight, L.E.; Funk, S.; Knight, G.M.; CMMID Covid-19 Working Group. What settings have been linked to SARS-CoV-2 transmission clusters? Wellcome Open Res. 2020, 5, 83. [Google Scholar] [CrossRef]
- Anderson, E.L.; Turnham, P.; Griffin, J.R.; Clarke, C.C. Consideration of the aerosol transmission for COVID-19 and public health. Risk Anal. 2020, 40, 902–907. [Google Scholar]
- Morawska, L.; Milton, D.K. It is time to address airborne transmission of coronavirus disease 2019 (COVID-19). Clin. Infect. Dis. 2020, 71, 2311–2313. [Google Scholar]
- Lu, J.; Gu, J.; Li, K.; Xu, C.; Su, W.; Lai, Z.; Zhou, D.; Yu, C.; Xu, B.; Yang, Z. COVID-19 outbreak associated with air conditioning in restaurant, Guangzhou, China, 2020. Emerg. Infect. Dis. 2020, 26, 1628. [Google Scholar]
- Hamner, L. High SARS-CoV-2 attack rate following exposure at a choir practice—Skagit County, Washington, March 2020. MMWR. Morb. Mortal. Wkly. Rep. 2020, 69, 606–610. [Google Scholar]
- Azimi, P.; Keshavarz, Z.; Cedeno Laurent, J.G.; Stephens, B.; Allen, J.G. Mechanistic transmission modeling of COVID-19 on the Diamond Princess cruise ship demonstrates the importance of aerosol transmission. Proc. Natl. Acad. Sci. USA 2021, 118, e2015482118. [Google Scholar] [CrossRef]
- Shen, Y.; Li, C.; Dong, H.; Wang, Z.; Martinez, L.; Sun, Z.; Handel, A.; Chen, Z.; Chen, E.; Ebell, M.H.; et al. Community outbreak investigation of SARS-CoV-2 transmission among bus riders in Eastern China. JAMA Intern. Med. 2020, 180, 1665–1671. [Google Scholar]
- Melikov, A.K. COVID-19: Reduction of airborne transmission needs paradigm shift in ventilation. Build. Environ. 2020, 186, 107336. [Google Scholar]
- Li, Y.; Cheng, P.; Jia, W. Poor ventilation worsens short-range airborne transmission of respiratory infection. Indoor Air 2022, 32, e12946. [Google Scholar]
- Shao, S.; Zhou, D.; He, R.; Li, J.; Zou, S.; Mallery, K.; Kumar, S.; Yang, S.; Hong, J. Risk assessment of airborne transmission of COVID-19 by asymptomatic individuals under different practical settings. J. Aerosol Sci. 2021, 151, 105661. [Google Scholar] [PubMed]
- Yao, M.; Zhang, L.; Ma, J.; Zhou, L. On airborne transmission and control of SARS-Cov-2. Sci. Total Environ. 2020, 731, 139178. [Google Scholar] [PubMed]
- Zhai, Z. Facial mask: A necessity to beat COVID-19. Build. Environ. 2020, 175, 106827. [Google Scholar] [PubMed]
- Zhang, N.; Chen, W.; Chan, P.T.; Yen, H.L.; Tang, J.W.T.; Li, Y. Close contact behaviour in indoor environment and transmission of respiratory infection. Indoor Air 2020, 30, 645–661. [Google Scholar]
- Xie, X.; Li, Y.; Sun, H.; Liu, L. Exhaled droplets due to talking and coughing. J. R. Soc. Interface 2009, 6 (Suppl. 6), S703–S714. [Google Scholar]
- Horve, P.F.; Lloyd, S.; Mhuireach, G.A.; Dietz, L.; Fretz, M.; MacCrone, G.; Wymelenberg, V.D.K.; Ishaq, S.L. Building upon current knowledge and techniques of indoor microbiology to construct the next era of theory into microorganisms, health, and the built environment. J. Expo. Sci. Environ. Epidemiol. 2020, 30, 219–235. [Google Scholar]
- Michalek, J.; Choudhary, R.; Papalambros, P. Architectural layout design optimization. Eng. Optim. 2002, 34, 461–484. [Google Scholar] [CrossRef]
- Sugiyama, T.; Hadgraft, N.; Clark, B.K.; Dunstan, D.W.; Chevez, A.; Healy, G.N.; Cerin, E.; LaMontagne, A.D.; Shibata, A.; Oka, K.; et al. Office spatial design attributes, sitting, and face-to-face interactions: Systematic review and research agenda. Build. Environ. 2021, 187, 107426. [Google Scholar]
- Peng, Z.; Rojas, A.P.; Kropff, E.; Bahnfleth, W.; Buonanno, G.; Dancer, S.J.; Kurnitski, J.; Li, Y.; Loomans, M.G.; Marr, L.C.; et al. Practical indicators for risk of airborne transmission in shared indoor environments and their application to COVID-19 outbreaks. Environ. Sci. Technol. 2022, 56, 1125–1137. [Google Scholar]
- COVID-19 Risk Airborn. Available online: https://www.covidairbornerisk.com/ (accessed on 26 August 2022).
- Harvard, T.H. CHAN School of Public Health: COVID-19 Risk Calculator. Available online: https://covid-19.forhealth.org/covid-19-transmission-calculator/ (accessed on 26 August 2022).
- Harvard, T.H. CHAN School of Public Health: Healthy Buildings. Available online: https://forhealth.org/ (accessed on 26 August 2022).
- Gao, C.X.; Li, Y.; Wei, J.; Cotton, S.; Hamilton, M.; Wang, L.; Cowling, B.J. Multi-route respiratory infection: When a transmission route may dominate. Sci. Total Environ. 2021, 752, 141856. [Google Scholar]
- Duives, D.; Chang, Y.; Sparnaaij, M.; Wouda, B.; Boschma, D.; Liu, Y.; Yuan, Y.; Daamen, W.; Jong, M.D.; Teberg, C.; et al. The multi-dimensional challenges of controlling SARS-CoV-2 transmission in indoor spaces: Insights from the linkage of a microscopic pedestrian simulation and virus transmission models. medRxiv 2021. [Google Scholar] [CrossRef]
- Velraj, R.; Haghighat, F. The contribution of dry indoor built environment on the spread of Coronavirus: Data from various Indian states. Sustain. Cities Soc. 2020, 62, 102371. [Google Scholar]
- Oldham, M.J.; Moss, O.R. Pores of Kohn: Forgotten alveolar structures and potential source of aerosols in exhaled breath. J. Breath Res. 2019, 13, 021003. [Google Scholar] [CrossRef]
- Wanner, A.; Salathé, M.; O’Riordan, T.G. Mucociliary clearance in the airways. Am. J. Respir. Crit. Care Med. 1996, 154, 1868–1902. [Google Scholar] [CrossRef]
- Mittal, R.; Ni, R.; Seo, J. The flow physics of COVID-19. J. Fluid Mech. 2020, 894, 1–14. [Google Scholar] [CrossRef]
- Johnson, G.R.; Morawska, L. The mechanism of breath aerosol formation. J. Aerosol Med. Pulm. Drug Deliv. 2009, 22, 229–237. [Google Scholar] [CrossRef] [PubMed]
- Stadnytskyi, V.; Anfinrud, P.; Bax, A. Breathing, speaking, coughing or sneezing: What drives transmission of SARS-CoV-2? J. Intern. Med. 2021, 290, 1010–1027. [Google Scholar] [CrossRef] [PubMed]
- Alsved, M.; Matamis, A.; Bohlin, R.; Richter, M.; Bengtsson, P.E.; Fraenkel, C.J.; Medstrand, P.; Londahl, J. Exhaled respiratory particles during singing and talking. Aerosol Sci. Technol. 2020, 54, 1245–1248. [Google Scholar] [CrossRef]
- Gregson, F.K.; Watson, N.A.; Orton, C.M.; Haddrell, A.E.; McCarthy, L.P.; Finnie, T.J.; Gent, N.; Donaldson, G.C.; Shah, P.L.; Calder, J.D.; et al. Comparing aerosol concentrations and particle size distributions generated by singing, speaking and breathing. Aerosol Sci. Technol. 2021, 55, 681–691. [Google Scholar] [CrossRef]
- Gralton, J.; Tovey, E.; McLaws, M.L.; Rawlinson, W.D. The role of particle size in aerosolised pathogen transmission: A review. J. Infect. 2011, 62, 1–13. [Google Scholar] [CrossRef]
- Duguid, J.P. The size and the duration of air-carriage of respiratory droplets and droplet-nuclei. Epidemiol. Infect. 1946, 44, 471–479. [Google Scholar] [CrossRef]
- Papineni, R.S.; Rosenthal, F.S. The size distribution of droplets in the exhaled breath of healthy human subjects. J. Aerosol Med. 1997, 10, 105–116. [Google Scholar] [CrossRef] [PubMed]
- Fairchild, C.I.; Stampfer, J.F. Particle concentration in exhaled breath. Am. Ind. Hyg. Assoc. J. 1987, 48, 948–949. [Google Scholar] [PubMed]
- Tang, J.W.; Nicolle, A.D.; Klettner, C.A.; Pantelic, J.; Wang, L.; Suhaimi, A.B.; Tan, A.Y.L.; Ong, G.W.X.; Su, R.; Tham, K.W.; et al. Airflow dynamics of human jets: Sneezing and breathing-potential sources of infectious aerosols. PLoS ONE 2013, 8, e59970. [Google Scholar]
- Xu, C.; Nielsen, P.V.; Liu, L.; Jensen, R.L.; Gong, G. Human exhalation characterization with the aid of schlieren imaging technique. Build. Environ. 2017, 112, 190–199. [Google Scholar] [CrossRef] [PubMed]
- Bu, Y.; Ooka, R.; Kikumoto, H.; Oh, W. Recent research on expiratory particles in respiratory viral infection and control strategies: A review. Sustain. Cities Soc. 2021, 73, 103106. [Google Scholar] [CrossRef]
- Chao, C.Y.H.; Wan, M.P.; Morawska, L.; Johnson, G.R.; Ristovski, Z.D.; Hargreaves, M.; Mengersen, K.; Corbett, S.; Li, Y.; Xie, X.; et al. Characterization of expiration air jets and droplet size distributions immediately at the mouth opening. J. Aerosol Sci. 2009, 40, 122–133. [Google Scholar] [CrossRef]
- Han, M.; Ooka, R.; Kikumoto, H.; Oh, W.; Bu, Y.; Hu, S. Measurements of exhaled airflow velocity through human coughs using particle image velocimetry. Build. Environ. 2021, 202, 108020. [Google Scholar] [CrossRef]
- Jennison, M.W.; Edgerton, H.E. Droplet Infection of Air: Hih-speed Photoraphy of Droplet Production by Sneezin. Proc. Soc. Exp. Biol. Med. 1940, 43, 455–458. [Google Scholar] [CrossRef]
- Han, M.; Ooka, R.; Kikumoto, H.; Oh, W.; Bu, Y.; Hu, S. Experimental measurements of airflow features and velocity distribution exhaled from sneeze and speech using particle image velocimetry. Build. Environ. 2021, 205, 108293. [Google Scholar] [CrossRef]
- Tang, J.W.; Nicolle, A.; Pantelic, J.; Koh, G.C.; Wang, L.D.; Amin, M.; Klettner, C.A.; Cheong, D.K.W.; Sekhar, C.; Tham, K.W. Airflow dynamics of coughing in healthy human volunteers by shadowgraph imaging: An aid to aerosol infection control. PLoS ONE 2012, 7, e34818. [Google Scholar] [CrossRef] [PubMed]
- Loudon, R.G.; Roberts, R.M. Droplet expulsion from the respiratory tract. Am. Rev. Respir. Dis. 1967, 95, 435–442. [Google Scholar] [PubMed]
- Bahl, P.; de Silva, C.; MacIntyre, C.R.; Bhattacharjee, S.; Chughtai, A.A.; Doolan, C. Flow dynamics of droplets expelled during sneezing. Phys. Fluids 2021, 33, 111901. [Google Scholar] [CrossRef] [PubMed]
- Vuorinen, V.; Aarnio, M.; Alava, M.; Alopaeus, V.; Atanasova, N.; Auvinen, M.; Balasubramanian, N.; Bordbar, H.; Erästö, P.; Grande, R.; et al. Modelling aerosol transport and virus exposure with numerical simulations in relation to SARS-CoV-2 transmission by inhalation indoors. Saf. Sci. 2020, 130, 104866. [Google Scholar] [CrossRef]
- Wells, W.F. On AIR-borne infection: Study II. Droplets and droplet nuclei. Am. J. Epidemiol. 1934, 20, 611–618. [Google Scholar] [CrossRef]
- Xie, X.; Li, Y.; Chwang, A.T.; Ho, P.L.; Seto, W.H. How far droplets can move in indoor environments--revisiting the Wells evaporation-falling curve. Indoor Air 2007, 17, 211–225. [Google Scholar] [CrossRef]
- Li, X.; Shang, Y.; Yan, Y.; Yang, L.; Tu, J. Modelling of evaporation of cough droplets in inhomogeneous humidity fields using the multi-component Eulerian-Lagrangian approach. Build. Environ. 2018, 128, 68–76. [Google Scholar] [CrossRef]
- Bourouiba, L. Turbulent gas clouds and respiratory pathogen emissions: Potential implications for reducing transmission of COVID-19. JAMA 2020, 323, 1837–1838. [Google Scholar] [CrossRef]
- Liu, Z.; Zhuang, W.; Hu, L.; Rong, R.; Li, J.; Ding, W.; Li, N. Experimental and numerical study of potential infection risks from exposure to bioaerosols in one BSL-3 laboratory. Build. Environ. 2020, 179, 106991. [Google Scholar] [CrossRef]
- Hou, Y.J.; Okuda, K.; Edwards, C.E.; Martinez, D.R.; Asakura, T.; Dinnon III, K.H.; Kato, T.; Lee, R.E.; Yount, B.L.; Mascenik, T.M.; et al. SARS-CoV-2 reverse genetics reveals a variable infection gradient in the respiratory tract. Cell 2020, 182, 429–446. [Google Scholar] [CrossRef]
- Buonanno, G.; Stabile, L.; Morawska, L. Estimation of airborne viral emission: Quanta emission rate of SARS-CoV-2 for infection risk assessment. Environ. Int. 2020, 141, 105794. [Google Scholar] [CrossRef] [PubMed]
- Karimzadeh, S.; Bhopal, R.; Tien, H.N. Review of infective dose, routes of transmission and outcome of COVID-19 caused by the SARS-CoV-2: Comparison with other respiratory viruses. Epidemiol. Infect. 2021, 149, e96. [Google Scholar] [CrossRef]
- UK Health Security Agency. Coronavirus (COVID-19): Guidance. Available online: https://www.gov.uk/government/collections/coronavirus-covid-19-list-of-guidance (accessed on 3 March 2020).
- Liu, L.; Li, Y.; Nielsen, P.V.; Wei, J.; Jensen, R.L. Short-range airborne transmission of expiratory droplets between two people. Indoor Air 2017, 27, 452–462. [Google Scholar] [CrossRef] [PubMed]
- Nicas, M.; Jones, R.M. Relative contributions of four exposure pathways to influenza infection risk. Risk Anal. Int. J. 2009, 29, 1292–1303. [Google Scholar] [CrossRef] [PubMed]
- Bazant Martin, Z.; Bush, J.W.M. A guideline to limit indoor airborne transmission of COVID-19. Proc. Natl. Acad. Sci. USA 2021, 118, e2018995118. [Google Scholar] [CrossRef] [PubMed]
- Guo, M.; Tao, W.; Flavell, R.A.; Zhu, S. Potential intestinal infection and faecal–oral transmission of SARS-CoV-2. Nat. Rev. Gastroenterol. Hepatol. 2021, 18, 269–283. [Google Scholar] [CrossRef]
- Hong Kong Government. WHO Environmental Health Team Reports on Amoy Gardens. Hong Kong Government. Available online: https://www.info.gov.hk/gia/general/200305/16/0516114.htm (accessed on 26 May 2022).
- Kang, M.; Wei, J.; Yuan, J.; Guo, J.; Zhang, Y.; Hang, J.; Qu, Y.; Qian, H.; Zhuang, Y.; Chen, X.; et al. Probable evidence of fecal aerosol transmission of SARS-CoV-2 in a high-rise building. Ann. Intern. Med. 2020, 173, 974–980. [Google Scholar] [CrossRef]
- Pedersen, R.M.; Tornby, D.S.; Bang, L.L.; Madsen, L.W.; Skov, M.N.; Jensen, T.G.; Johansen, I.S.; Andersen, T.E. Rectally shed SARS-CoV-2 lacks infectivity: Time to rethink faecal–oral transmission? Nat. Rev. Gastroenterol. Hepatol. 2021, 18, 669. [Google Scholar] [CrossRef]
- Chia, P.Y.; Coleman, K.K.; Tan, Y.K.; Ong, S.W.X.; Gum, M.; Lau, S.K.; Lim, X.F.; Lim, A.S.; Sutjipto, S.; Lee, P.H.; et al. Detection of air and surface contamination by SARS-CoV-2 in hospital rooms of infected patients. Nat. Commun. 2020, 11, 2800. [Google Scholar] [CrossRef]
- Guo, Z.-D.; Wang, Z.Y.; Zhang, S.F.; Li, X.; Li, L.; Li, C.; Cui, Y.; Fu, R.-B.; Dong, Y.-Z.; Chi, X.-Y.; et al. Aerosol and surface distribution of severe acute respiratory syndrome coronavirus 2 in hospital wards, Wuhan, China, 2020. Emerg. Infect. Dis. 2020, 26, 1586. [Google Scholar] [CrossRef]
- Liu, Y.; Ning, Z.; Chen, Y.; Guo, M.; Liu, Y.; Gali, N.K.; Sun, L.; Duan, Y.; Cai, J.; Westerdahl, D.; et al. Aerodynamic analysis of SARS-CoV-2 in two Wuhan hospitals. Nature 2020, 582, 557–560. [Google Scholar] [CrossRef] [PubMed]
- Gonçalves, J.; da Silva, P.G.; Reis, L.; Nascimento, M.S.J.; Koritnik, T.; Paragi, M.; Mesquita, J.R. Surface contamination with SARS-CoV-2: A systematic review. Sci. Total Environ. 2021, 798, 149231. [Google Scholar] [CrossRef] [PubMed]
- Ye, G.; Lin, H.; Chen, S.; Wang, S.; Zeng, Z.; Wang, W.; Zhang, S.; Rebmann, T.; Li, Y.; Pan, Z.; et al. Environmental contamination of SARS-CoV-2 in healthcare premises. J. Infect. 2020, 81, e1–e5. [Google Scholar] [CrossRef] [PubMed]
- Harvey, A.P.; Fuhrmeister, E.R.; Cantrell, M.E.; Pitol, A.K.; Swarthout, J.M.; Powers, J.E.; Nadimpalli, M.L.; Julian, T.R.; Pickering, A.J. Longitudinal monitoring of SARS-CoV-2 RNA on high-touch surfaces in a community setting. Environ. Sci. Technol. Lett. 2020, 8, 168–175. [Google Scholar] [CrossRef]
- Ben-Shmuel, A.; Brosh-Nissimov, T.; Glinert, I.; Bar-David, E.; Sittner, A.; Poni, R.; Cohen, R.; Achdout, H.; Tamir, H.; Yahalom-Ronen, Y.; et al. Detection and infectivity potential of severe acute respiratory syndrome coronavirus 2 (SARS-CoV-2) environmental contamination in isolation units and quarantine facilities. Clin. Microbiol. Infect. 2020, 26, 1658–1662. [Google Scholar] [CrossRef]
- Zhang, N.; Li, Y.; Huang, H. Surface touch and its network growth in a graduate student office. Indoor Air 2018, 28, 963–972. [Google Scholar] [CrossRef]
- Bosina, E.; Weidmann, U. Estimating pedestrian speed using aggregated literature data. Phys. A Stat. Mech. Its Appl. 2017, 468, 330–335. [Google Scholar] [CrossRef]
- Zhao, P.; Wang, Q.; Wang, P.; Xiao, S.; Li, Y. Influence of network structure on contaminant spreading efficiency. J. Hazard. Mater. 2022, 424, 127511. [Google Scholar] [CrossRef]
- Toker, U.; Gray, D.O. Innovation spaces: Workspace planning and innovation in US university research centers. Res. Policy 2008, 37, 309–329. [Google Scholar] [CrossRef]
- O’Neill, M.J. Effects of signage and floor plan configuration on wayfinding accuracy. Environ. Behav. 1991, 23, 553–574. [Google Scholar] [CrossRef]
- Hillier, B.; Hanson, J. The Social Logic of Space; Cambridge University Press: Cambridge, UK, 1989. [Google Scholar]
- Koohsari, M.J.; McCormack, G.R.; Nakaya, T.; Shibata, A.; Ishii, K.; Lin, C.Y.; Hanibuchi, T.; Yasunaga, A.; Oka, K. Perceived workplace layout design and work-related physical activity and sitting time. Build. Environ. 2022, 211, 108739. [Google Scholar] [CrossRef]
- Dietz, L.; Horve, P.F.; Coil, D.A.; Fretz, M.; Eisen, J.A.; Van Den Wymelenberg, K. 2019 novel coronavirus (COVID-19) pandemic: Built environment considerations to reduce transmission. Msystems 2020, 5, e00245-20. [Google Scholar] [CrossRef] [PubMed]
- Abdul Nasir, N.A.B.; Hassan, A.S.; Khozaei, F.; Nasir, M.H.B.A. Investigation of spatial configuration management on social distancing of recreational clubhouse for COVID-19 in Penang, Malaysia. Int. J. Build. Pathol. Adapt. 2020, 39, 782–810. [Google Scholar] [CrossRef]
- Pan, J. Redesigning the working space for social distancing: Modelling the movement in an open-plan office. In Proceedings of the CIBSE Technical Symposium 2021, Virtual, 13–14 July 2021. [Google Scholar]
- Van Doremalen, N.; Bushmaker, T.; Morris, D.H.; Holbrook, M.G.; Gamble, A.; Williamson, B.N.; Tamin, A.; Harcourt, J.L.; Thornburg, N.J.; Gerber, S.I.; et al. Aerosol and surface stability of SARS-CoV-2 as compared with SARS-CoV-1. N. Engl. J. Med. 2020, 382, 1564–1567. [Google Scholar] [CrossRef] [PubMed]
- Hobbs, M.A.; Robinson, S.; Neyens, D.M.; Steed, C. Visitor characteristics and alcohol-based hand sanitizer dispenser locations at the hospital entrance: Effect on visitor use rates. Am. J. Infect. Control 2016, 44, 258–262. [Google Scholar] [CrossRef] [PubMed]
- Hassan, A.M.; Megahed, N.A. COVID-19 and urban spaces: A new integrated CFD approach for public health opportunities. Build. Environ. 2021, 204, 108131. [Google Scholar] [CrossRef]
- Priesnitz, J.; Rathgeb, C.; Buchmann, N.; Busch, C.; Marsgraf, M. An overview of touchless 2D fingerprint recognition. EURASIP J. Image Video Processing 2021, 2021, 8. [Google Scholar] [CrossRef]
- SCMP; China Morning Post. New biometric products flood out to tackle COVID-19. Biom. Technol. Today 2020, 2020, 30053–30059. [Google Scholar]
- Bhuptani, M.; Moradpour, S. RFID Field Guide: Deploying Radio Frequency Identification Systems; Prentice Hall PTR: Hoboken, NJ, USA, 2005. [Google Scholar]
- Seth, V. Why NFC is a rising star in digital ID. Biom. Technol. Today 2021, 2021, 5–7. [Google Scholar]
- Whitelaw, S.; Mamas, M.A.; Topol, E.; Van Spall, H.G. Applications of digital technology in COVID-19 pandemic planning and response. Lancet Digit. Health 2020, 2, e435–e440. [Google Scholar] [CrossRef]
- Iqbal, M.Z.; Campbell, A.G. From luxury to necessity: Progress of touchless interaction technology. Technol. Soc. 2021, 67, 101796. [Google Scholar] [CrossRef]
- Zhou, J.; Hua, Y.; Xiao, Y.; Ye, C.; Yang, W. Analysis of Ventilation Efficiency and Effective Ventilation Flow Rate for Wind-driven Single-sided Ventilation Buildings. Aerosol. Air Qual. Res. 2021, 21, 200383. [Google Scholar] [CrossRef]
- Ravikumar, P.; Prakash, D. Analysis of thermal comfort in an office room by varying the dimensions of the windows on adjacent walls using CFD: A case study based on numerical simulation. Build. Simul. 2009, 2, 187–196. [Google Scholar] [CrossRef]
- Chen, T.; Feng, Z.; Cao, S.-J. The effect of vent inlet aspect ratio and its location on ventilation efficiency. Indoor Built Environ. 2020, 29, 180–195. [Google Scholar] [CrossRef]
- Wang, J.; Wang, S.; Zhang, T.; Battaglia, F. Assessment of single-sided natural ventilation driven by buoyancy forces through variable window configurations. Energy Build. 2017, 139, 762–779. [Google Scholar] [CrossRef]
- Liu, X.; Peng, Z.; Liu, X.; Zhou, R. Dispersion characteristics of hazardous gas and exposure risk assessment in a multiroom building environment. Int. J. Environ. Res. Public Health 2020, 17, 199. [Google Scholar] [CrossRef]
- Zhuang, R.; Li, X.; Tu, J. CFD study of the effects of furniture layout on indoor air quality under typical office ventilation schemes. Build. Simul. 2014, 7, 263–275. [Google Scholar] [CrossRef]
- Chin, A.W.H.; Chu, J.T.; Perera, M.R.; Hui, K.P.; Yen, H.L.; Chan, M.C.; Peiris, M.; Poon, L.L. Stability of SARS-CoV-2 in different environmental conditions. Lancet Microbe 2020, 1, e10. [Google Scholar] [CrossRef]
- Harbourt, D.E.; Haddow, A.D.; Piper, A.E.; Bloomfield, H.; Kearney, B.J.; Fetterer, D.; Gibson, K.; Minogue, T. Modeling the stability of severe acute respiratory syndrome coronavirus 2 (SARS-CoV-2) on skin, currency, and clothing. PLoS Negl. Trop. Dis. 2020, 14, e0008831. [Google Scholar] [CrossRef]
- Riddell, S.; Goldie, S.; Hill, A.; Eagles, D.; Drew, T.W. The effect of temperature on persistence of SARS-CoV-2 on common surfaces. Virol. J. 2020, 17, 145. [Google Scholar] [CrossRef]
- Zhao, P.; Chan, P.T.; Gao, Y.; Lai, H.W.; Zhang, T.; Li, Y. Physical factors that affect microbial transfer during surface touch. Build. Environ. 2019, 158, 28–38. [Google Scholar] [CrossRef]
- Behzadinasab, S.; Chin, A.; Hosseini, M.; Poon, L.; Ducker, W.A. A surface coating that rapidly inactivates SARS-CoV-2. ACS Appl. Mater. Interfaces 2020, 12, 34723–34727. [Google Scholar] [CrossRef] [PubMed]
- Hutasoit, N.; Kennedy, B.; Hamilton, S.; Luttick, A.; Rashid, R.A.R.; Palanisamy, S. Sars-CoV-2 (COVID-19) inactivation capability of copper-coated touch surface fabricated by cold-spray technology. Manuf. Lett. 2020, 25, 93–97. [Google Scholar] [CrossRef] [PubMed]
- Hosseini, M.; Chin, A.W.; Behzadinasab, S.; Poon, L.L.; Ducker, W.A. Cupric oxide coating that rapidly reduces infection by SARS-CoV-2 via solids. ACS Appl. Mater. Interfaces 2021, 13, 5919–5928. [Google Scholar] [CrossRef]
- Zhang, A.; Bokel, R.; Van den Dobbelsteen, A.; Sun, Y.; Huang, Q.; Zhang, Q. The effect of geometry parameters on energy and thermal performance of school buildings in cold climates of China. Sustainability 2017, 9, 1708. [Google Scholar] [CrossRef]
- Mishra, A.K.; Loomans, M.G.L.C.; Hensen, J.L.M. Thermal comfort of heterogeneous and dynamic indoor conditions—An overview. Build. Environ. 2016, 109, 82–100. [Google Scholar] [CrossRef]
- Tong, S.; Wong, N.H.; Tan, E.; Jusuf, S.K. Experimental study on the impact of facade design on indoor thermal environment in tropical residential buildings. Build. Environ. 2019, 166, 106418. [Google Scholar] [CrossRef]
- Morris, D.H.; Yinda, K.C.; Gamble, A.; Rossine, F.W.; Huang, Q.; Bushmaker, T.; Fischer, R.J.; Matson, M.J.; Van Doremalen, N.; Vikesland, P.J.; et al. Mechanistic theory predicts the effects of temperature and humidity on inactivation of SARS-CoV-2 and other enveloped viruses. Elife 2021, 10, e65902. [Google Scholar] [CrossRef]
- Biryukov, J.; Boydston, J.A.; Dunning, R.A.; Yeager, J.J.; Wood, S.; Reese, A.L.; Ferris, A.; Miller, D.; Weaver, W.; Zeitouni, N.E.; et al. Increasing temperature and relative humidity accelerates inactivation of SARS-CoV-2 on surfaces. MSphere 2020, 5, e00441-20. [Google Scholar] [CrossRef]
- Matson, M.J.; Yinda, C.K.; Seifert, S.N.; Bushmaker, T.; Fischer, R.J.; van Doremalen, N.; Lloyd-Smith, J.O.; Munster, V.J. Effect of environmental conditions on SARS-CoV-2 stability in human nasal mucus and sputum. Emerg. Infect. Dis. 2020, 26, 2276. [Google Scholar] [CrossRef]
- Kratzel, A.; Steiner, S.; Todt, D.; V’kovski, P.; Brueggemann, Y.; Steinmann, J.; Steinmann, E.; Thiel, V.; Pfaender, S. Temperature-dependent surface stability of SARS-CoV-2. J. Infect. 2020, 81, 452–482. [Google Scholar] [CrossRef]
- Casanova, L.M.; Jeon, S.; Rutala, W.A.; Weber, D.J.; Sobsey, M.D. Effects of air temperature and relative humidity on coronavirus survival on surfaces. Appl. Environ. Microbiol. 2010, 76, 2712–2717. [Google Scholar] [CrossRef] [PubMed]
- Smither, S.J.; Eastaugh, L.S.; Findlay, J.S.; Lever, M.S. Experimental aerosol survival of SARS-CoV-2 in artificial saliva and tissue culture media at medium and high humidity. Emerg. Microbes Infect. 2020, 9, 1415–1417. [Google Scholar] [CrossRef] [PubMed]
- Zhang, A.; Bokel, R.; van den Dobbelsteen, A.; Sun, Y.; Huang, Q.; Zhang, Q. Optimization of thermal and daylight performance of school buildings based on a multi-objective genetic algorithm in the cold climate of China. Energy Build. 2017, 139, 371–384. [Google Scholar] [CrossRef]
- Carleton, T.; Cornetet, J.; Huybers, P.; Meng, K.C.; Proctor, J. Global evidence for ultraviolet radiation decreasing COVID-19 growth rates. Proc. Natl. Acad. Sci. USA 2021, 118, e2012370118. [Google Scholar] [CrossRef]
- Schuit, M.; Ratnesar-Shumate, S.; Yolitz, J.; Williams, G.; Weaver, W.; Green, B.; Miller, D.; Krause, M.; Beck, K.; Wood, S.; et al. Airborne SARS-CoV-2 is rapidly inactivated by simulated sunlight. J. Infect. Dis. 2020, 222, 564–571. [Google Scholar] [CrossRef]
- Ratnesar-Shumate, S.; Williams, G.; Green, B.; Krause, M.; Holland, B.; Wood, S.; Bohannon, J.; Boydston, J.; Freeburger, D.; Hooper, I.; et al. Simulated sunlight rapidly inactivates SARS-CoV-2 on surfaces. J. Infect. Dis. 2020, 222, 214–222. [Google Scholar] [CrossRef]
- Gidari, A.; Sabbatini, S.; Bastianelli, S.; Pierucci, S.; Busti, C.; Bartolini, D.; Stabile, A.M.; Monari, C.; Galli, F.; Rende, M.; et al. SARS-CoV-2 survival on surfaces and the effect of UV-C light. Viruses 2021, 13, 408. [Google Scholar] [CrossRef]
- Herman, J.; Biegel, B.; Huang, L. Inactivation times from 290 to 315 nm UVB in sunlight for SARS coronaviruses CoV and CoV-2 using OMI satellite data for the sunlit Earth. Air Qual. Atmos. Health 2021, 14, 217–233. [Google Scholar] [CrossRef]
- Rathnasinghe, R.; Jangra, S.; Miorin, L.; Schotsaert, M.; Yahnke, C.; Garcίa-Sastre, A. The virucidal effects of 405 nm visible light on SARS-CoV-2 and influenza A virus. Sci. Rep. 2021, 11, 19470. [Google Scholar] [CrossRef]
- Gupta, J.K.; Lin, C.-H.; Chen, Q. Risk assessment of airborne infectious diseases in aircraft cabins. Indoor Air 2012, 22, 388–395. [Google Scholar] [CrossRef] [PubMed]
- Lei, H.; Li, Y.; Xiao, S.; Lin, C.H.; Norris, S.L.; Wei, D.; Hu, Z.; Ji, S. Routes of transmission of influenza A H1N1, SARS CoV, and norovirus in air cabin: Comparative analyses. Indoor Air 2018, 28, 394–403. [Google Scholar] [CrossRef]
- To, S.; Nam, G.; Chao, C.Y.H. Review and comparison between the Wells–Riley and dose-response approaches to risk assessment of infectious respiratory diseases. Indoor Air 2010, 20, 2–16. [Google Scholar]
- Riley, E.C.; Murphy, G.; Riley, R.L. Airborne spread of measles in a suburban elementary school. Am. J. Epidemiol. 1978, 107, 421–432. [Google Scholar] [CrossRef]
- Yan, Y.; Li, X.; Shang, Y.; Tu, J. Evaluation of airborne disease infection risks in an airliner cabin using the Lagrangian-based Wells-Riley approach. Build. Environ. 2017, 121, 79–92. [Google Scholar] [CrossRef] [PubMed]
- Srivastava, S.; Zhao, X.; Manay, A.; Chen, Q. Effective ventilation and air disinfection system for reducing coronavirus disease 2019 (COVID-19) infection risk in office buildings. Sustain. Cities Soc. 2021, 75, 103408. [Google Scholar] [CrossRef]
- Nicas, M. An analytical framework for relating dose, risk, and incidence: An application to occupational tuberculosis infection. Risk Anal. 1996, 16, 527–538. [Google Scholar] [CrossRef]
- Buonanno, G.; Morawska, L.; Stabile, L. Quantitative assessment of the risk of airborne transmission of SARS-CoV-2 infection: Prospective and retrospective applications. Environ. Int. 2020, 145, 106112. [Google Scholar] [CrossRef]
- Li, I.; Mackey, M.G.; Foley, B.; Pappas, E.; Edwards, K.; Chau, J.Y.; Engelen, L.; Voukelatos, A.; Whelan, A.; Bauman, A.; et al. Reducing office workers’ sitting time at work using sit-stand protocols: Results from a pilot randomized controlled trial. J. Occup. Environ. Med. 2017, 59, 543–549. [Google Scholar] [CrossRef]
- Spinney, R.; Smith, L.; Ucci, M.; Fisher, A.; Konstantatou, M.; Sawyer, A.; Wardle, J.; Marmot, A. Indoor tracking to understand physical activity and sedentary behaviour: Exploratory study in UK office buildings. PLoS ONE 2015, 10, e0127688. [Google Scholar] [CrossRef]
- Zhang, N.; Wang, P.; Miao, T.; Chan, P.T.; Jia, W.; Zhao, P.; Su, B.; Chen, X.; Li, Y. Real human surface touch behaviour based quantitative analysis on infection spread via fomite route in an office. Build. Environ. 2021, 191, 107578. [Google Scholar] [CrossRef]
- Edmunds, W.J.; Kafatos, G.; Wallinga, J.; Mossong, J.R. Mixing patterns and the spread of close-contact infectious diseases. Emerg. Themes Epidemiol. 2006, 3, 10. [Google Scholar] [CrossRef] [PubMed]
- Hall, E.T. A system for the notation of proxemic behaviour. Am. Anthropol. 1963, 65, 1003–1026. [Google Scholar] [CrossRef]
- Hayduk, L.A. Personal space: An evaluative and orienting overview. Psychol. Bull. 1978, 85, 117. [Google Scholar] [CrossRef]
- Sommer, R. Personal Space. The Behavioural Basis of Design; Prentice Hall Direct: Hoboken, NJ, USA, 1969. [Google Scholar]
- Lindsley, W.G.; Pearce, T.A.; Hudnall, J.B.; Davis, K.A.; Davis, S.M.; Fisher, M.A.; Khakoo, R.; Palmer, J.E.; Clark, K.E.; Celik, I.; et al. Quantity and size distribution of cough-generated aerosol particles produced by influenza patients during and after illness. J. Occup. Environ. Hyg. 2012, 9, 443–449. [Google Scholar] [CrossRef] [PubMed]
- US Environmental Protection Agency (EPA). Exposure Factors Handbook: Chapter 6—Inhalation Rates. 2011. Available online: https://cfpub.epa.gov/ncea/risk/recordisplay.cfm?deid=236252 (accessed on 12 May 2022).
- Hendley, J.O.; Wenzel, R.P.; Gwaltney, J.M., Jr. Transmission of rhinovirus colds by self-inoculation. N. Engl. J. Med. 1973, 288, 1361–1364. [Google Scholar] [CrossRef] [PubMed]
- Nicas, M.; Best, D. A study quantifying the hand-to-face contact rate and its potential application to predicting respiratory tract infection. J. Occup. Environ. Hyg. 2008, 5, 347–352. [Google Scholar] [CrossRef] [PubMed]
- Ronchi, E.; Lovreglio, R. EXPOSED: An occupant exposure model for confined spaces to retrofit crowd models during a pandemic. Saf. Sci. 2020, 130, 104834. [Google Scholar] [CrossRef]
- Yu, H.-L.; Chang, T.-J. Modeling particulate matter concentration in indoor environment with cellular automata framework. Build. Environ. 2022, 214, 108898. [Google Scholar] [CrossRef]
- Peng, Z.; Jimenez, J.L. Exhaled CO2 as a COVID-19 infection risk proxy for different indoor environments and activities. Environ. Sci. Technol. Lett. 2021, 8, 392–397. [Google Scholar] [CrossRef]
- Querol, X.; Alastuey, A.; Moreno, N.; Minguillón, M.C.; Moreno, T.; Karanasiou, A.; Jimenez, J.L.; Li, Y.; Morguí, J.A.; Felisi, J.M. How can ventilation be improved on public transportation buses? Insights from CO2 measurements. Environ. Res. 2022, 205, 112451. [Google Scholar] [CrossRef] [PubMed]
- Allen, J.G.; Ibrahim, A.M. Indoor air changes and potential implications for SARS-CoV-2 transmission. JAMA 2021, 325, 2112–2113. [Google Scholar] [CrossRef] [PubMed]
- AIREAMOS. Available online: https://www.aireamos.org (accessed on 27 August 2022).
- Henriques, A.; Mounet, N.; Aleixo, L.; Elson, P.; Devine, J.; Azzopardi, G.; Andreini, M.; Rognlien, M.; Tarocco, N.; Tang, J. Modelling airborne transmission of SARS-CoV-2 using CARA: Risk assessment for enclosed spaces. Interface Focus 2022, 12, 20210076. [Google Scholar] [CrossRef]
- Ahlawat, A.; Wiedensohler, A.; Mishra, S.K. An overview on the role of relative humidity in airborne transmission of SARS-CoV-2 in indoor environments. Aerosol Air Qual. Res. 2020, 20, 1856–1861. [Google Scholar] [CrossRef]


| Expiratory Activity | Size Range (μm) | Emission Rate a | Particle Concentration (L−1) | Velocity (m/s) | Duration per Time (s) |
|---|---|---|---|---|---|
| Breathing b | 0.01–100 [34] | 0–65 [35] 85–691 [32] | 1–13 [36] 100–450 [37] 18–890 [33] | <1.4 [38] 0.45–2.58 [39] | 3.3–5 [40] |
| Speaking c | <0.1–125 [34] 0–1000 [16,45] 5–2000 [35] | 50–770 [35] 120–1380 [32] 1–374/s [16] 176 [46] 112–6702 [45] | 6–36 [36] 3–50 [35] 4–223 [45] 16–370 [33] 150–2000 [37] | 2.31–4.07 [40] 3.9 [41] <6.25 [44] | - |
| Coughing | <0.1–500 [34] 0–1000 [45] 0–1500 [16] 5–2000 [35] | 465 [46] 271–1331 [16] 947–2085 [45] 490–16,000 [35] | 24–218 [36] 6–910 [35] 150–2500 [37] 2400–5200 [45] 220–41000 [33] | 1.5–28.8 [45] <4.5 [40] 11.7 [41] <15.3 [42] | 0.3–0.8 [40] |
| Sneezing | <0.1–125 [34] 5–2000 [35] | 65,000–3,100,000 [35] | 5–73,000 [35] | <4.5 [40] 30 [43] <15.9 [44] | 0.15–0.25 [40] |
| Short-Range Exposure | Long-Range Exposure | |||||
|---|---|---|---|---|---|---|
| Transmission route | ① Direct contact route | ② Personal fomite route | ③ Large droplet route | ④ Short-range airborne route | ⑤ Environmental fomite route | ⑥ Long-range airborne route |
| Exposure way | Touching | Touching | Deposition | Inhalation | Touching | Inhalation |
| Virus vector | Body fluid and skin | Personal fomites | Large droplets | Middle and fine droplets, droplet nuclei | Environmental fomites | Fine droplets and droplet nuclei |
| Propagation distance | 0 m | ≤1 m | ≤1 m | ≤1.5 m | >1.5 m | >1.5 m |
| Sites | Spaces | Surfaces | ||
|---|---|---|---|---|
| Envelopes a | Public Facilities b | Personal Belongings c | ||
| Total | 130/674 (19.3) | 1/18 (5.6) | 105/457 (23.0) | 24/199 (12.1) |
| Hospital [69] | Total—84/616 (13.8) | |||
| ICU—22/69 (31.9) Obstetric isolation ward—9/32 (28.1) Isolation ward—11/56 (19.6) Outpatient lobby—5/30 (16.7) Emergency department—10/80 (12.5) Office and preparation area—5/41 (12.2) Obstetric ward—4/33 (12.1) Clinical laboratories—11/96 (11.5) Fever clinic—3/46 (6.5) CT examination room—2/36 (5.6) General ward—3/55 (5.5) | Wall and floor—1/18 (5.6) | Door handle—12/75 (16.0) Hand-sanitizer dispensers—12/59 (20.3) Self-service printer—2/10 (20.0) Table top/keyboard—29/173 (16.8) Medical equipment—6/48 (12.5) Elevator buttons, microwave ovens, faucets, handrails, and hair drier—2/25 (8.0) | Gloves—12/78 (15.4) Telephone—7/56 (12.5) Eye protection or face shield—1/58 (1.7) | |
| Bank [70] | Total—4/9 (44.4) | - | Door handle—3/6 (50.0) ATM—1/3 (33.3) | - |
| Shop [70] | Total—21/27 (77.8) | - | Door handle—19/24 (79.2) Basket handle—2/3 (66.7) | - |
| Restaurant [70] | Total—5/15 (33.3) | Door handle—1/3 (33.3) Trash can—4/12 (33.3) | - | |
| Quarantine hotel [71] | Total—16/42 (38.1) | |||
| Hotel room—7/21 (33.3) Public space—9/21 (42.9) | - | Toilet seat—1/1 (100.0) Electric kettle—2/2 (100) Cold water bar—1/1 (100.0) Air sampling filter—1/1 (100.0) Elevator button panel—4/5 (80.0) Closet door—1/2 (50.0) Chair handle—2/4 (50.0) | Cup—3/3 (100.0) Telephone—1/4 (25.0) | |
| Space | Classroom | Office | Dormitory |
|---|---|---|---|
| Schematic diagram |  |  |  |
| Occupant role | Student, teacher | Teacher, administrator | Student |
| Activity (level) | Attending class (light) | Working, talking (light) | Rest, sleep (resting) |
| Motion state | Stationary | Stationary | Stationary |
| Duration (min) | About 40/lesson | About 40/lesson | >420 |
| Possible contagion- related behavior | Teacher speaking; close contact between students; touching desk, chair, door handle; breathing | Talking to colleagues; touching desk, computer, door handle etc.; shaking hands; breathing | Talking and playing with roommates; touching door handle, chair, bed, wardrobe door, etc.; breathing |
| Transmission routes | Rpf Rld Rsa Ref Rla | Rdc Rpf Rld Rsa Ref Rla | Rdc Rpf Rld Rsa Ref Rla |
| Space | Stairwell | Corridor | lavatory |
| Schematic diagram |  |  |  |
| Occupant role | Student, teacher, sanitation worker, administrator | Student, teacher, sanitation worker, administrator | Student, teacher, sanitation worker, administrator |
| Activity (level) | Climbing stairs (moderate) | Walking (moderate) | Cleaning (light) |
| Motion state | Moving | Moving | Stationary |
| Duration (min) | <5 | <5 | <5 |
| Possible contagion- related behavior | Talking to fellow travelers; crowd gathering; touching stair handrail; breathing | Talking to fellow travelers; crowd gathering; breathing | Touching flush button, faucet and door handle; breathing |
| Transmission routes | Rld Rsa Ref Rla | Rld Rsa Rla | Ref Rla Rfo |
| Parameter | Description | Symbol | |
|---|---|---|---|
| Space | Layout | Floor-level spatial organization and room-level physical layout | SL |
| Public facilities | Touchless technology and surface material | SP | |
| Openings | Door and window openings | SO | |
| Environment | Airflow | The rate and direction of air flow, mainly dependent on ventilation | EA |
| T and RH | Indoor temperature and relative humidity | ETRH | |
| Daylighting | Place windows, skylights, and other openings for sunlight | ED | |
| Behavior | Human-air interaction | Respiratory activities, including breathing, speaking, singing, coughing, and sneezing | BHA |
| Human-human interaction | Direct physical contact and close contact | BHH | |
| Human-object interaction | Touch inanimate surfaces, including personal belongings and public facilities | BHO | |
| Self-inoculation | Touching the facial membranes, including the eyes, nose and mouth with contaminated hands | BS |
| Scale | Permeability | Wayfinding |
|---|---|---|
| Excellent | Hardly accessible by the public, and the private space is only dedicated to a specific and authorized person | The entrance visible without any obstruction by the user from the external area, and the internal space is easily accessed from the standing point |
| Average | A certain area still lacks in controlling the users, especially in segregating public and private users | Space can be accessed, however, depends on the depth of the space. The further it goes, the less quality of wayfinding it possesses |
| Poor | Easily accessible by public users without any space to pass through and weak in control of the movement of end-user especially undedicated areas | Weak in circulation and spatial organization as user-facing difficulties in accessing the space and it goes further from the main entrance |
| Technology | Working Range | Used Cases |
|---|---|---|
| Infrared | 10 m | Doors, elevators, lights, water dispensers, toilet, sanitizing dispenser, faucets, hand dryers |
| Biometric authentication | 0.5 m | Payments, doors, elevators, lights, ATM, smart homes |
| RFID | 10 m | Payments, doors, elevators |
| NFC | 10 cm | Payments, doors, elevators |
| QR code | Depend on the size of QR code | Payments, doors, printers |
| WWR | 0.01 | 0.0225 | 0.04 | 0.0625 | 0.09 | 0.125 | 0.16 | 0.2025 | 0.25 |
| MFR (kg/s) | 0.175 | 0.394 | 0.713 | 1.09 | 1.62 | 2.21 | 2.89 | 3.69 | 4.512 |
| AR | 0.36 | 0.56 | 0.64 | 1 | 1.562 | 1.75 | 2.78 | ||
| MFR (kg/s) | 0.709 | 0.711 | 0.711 | 0.713 | 0.722 | 0.728 | 0.727 |
| Physical Layout | Layout A | Layout B | Layout C | |
|---|---|---|---|---|
| Ventilation effectiveness | MV1 | 0.854 | 1.154 | 1.342 |
| MV2 | 0.736 | 1.258 | 1.173 | |
| DV1 | 1.363 | 1.758 | 1.558 | |
| DV2 | 1.061 | 2.698 | 1.661 | |
| Refs. | T (°C)/RH (%) | Copper | Stainless Steel | Glass | Plastic | Wood | Paper | Cloth | Vinyl |
|---|---|---|---|---|---|---|---|---|---|
| [97] | 22/65 | <7 d | <4 d | <7 d | <2 d | <3 h | <2 d | ||
| [82] | 21–23/65 | <4 h | 72 h < 4 d | 72 h < 4 d | <24 h | ||||
| [99] | 20/50 | >28 d | >28 d | >28 d | <14 d | >28 d | |||
| [98] | 22/40–50 | >8 h | >4 h |
| Refs. | Surface/Aerosol | T (°C) | RH (%) | Results | Correlation | |
|---|---|---|---|---|---|---|
| T | RH | |||||
| [99] | Stainless steel, paper note, polymer note, glass, cotton, vinyl | 20, 30, 40 | 50 | Increasing AT accelerates inactivation of SARS-CoV-2 | − | |
| [71] | Plastic | 22, 40, 50, 60, 70 | 50 | Increasing AT accelerates inactivation of SARS-CoV-2 | − | |
| [110] | Metal discs | 4, RT, 30 | 30–40 | SARS-CoV-2 decays slowly at all AT | NS | |
| [107] | polypropylene plastic | 10, 22, 27 | 40, 65, 85 | SARS-CoV-2 is more stable at low AT and extreme RH (40% and 85%) | − | |
| [108] | ABS plastic, stainless steel, nitrile rubber | 24, 28, 35 | 20, 40, 60, 80 | Increasing AT and RH accelerates inactivation of SARS-CoV-2 | − | − |
| [109] | polypropylene | 4, 21, 27 | 40, 85 | SARS-CoV-2 is more stable at low AT and low RH | − | |
| [112] | aerosol of artificial saliva | 19–22 | 40–60, 68–88 | SARS-CoV-2 is more stable at higher RH | + | |
| [112] | aerosol of tissue culture media | 19–22 | 40–60, 68–88 | SARS-CoV-2 is more stable at medium RH | − | |
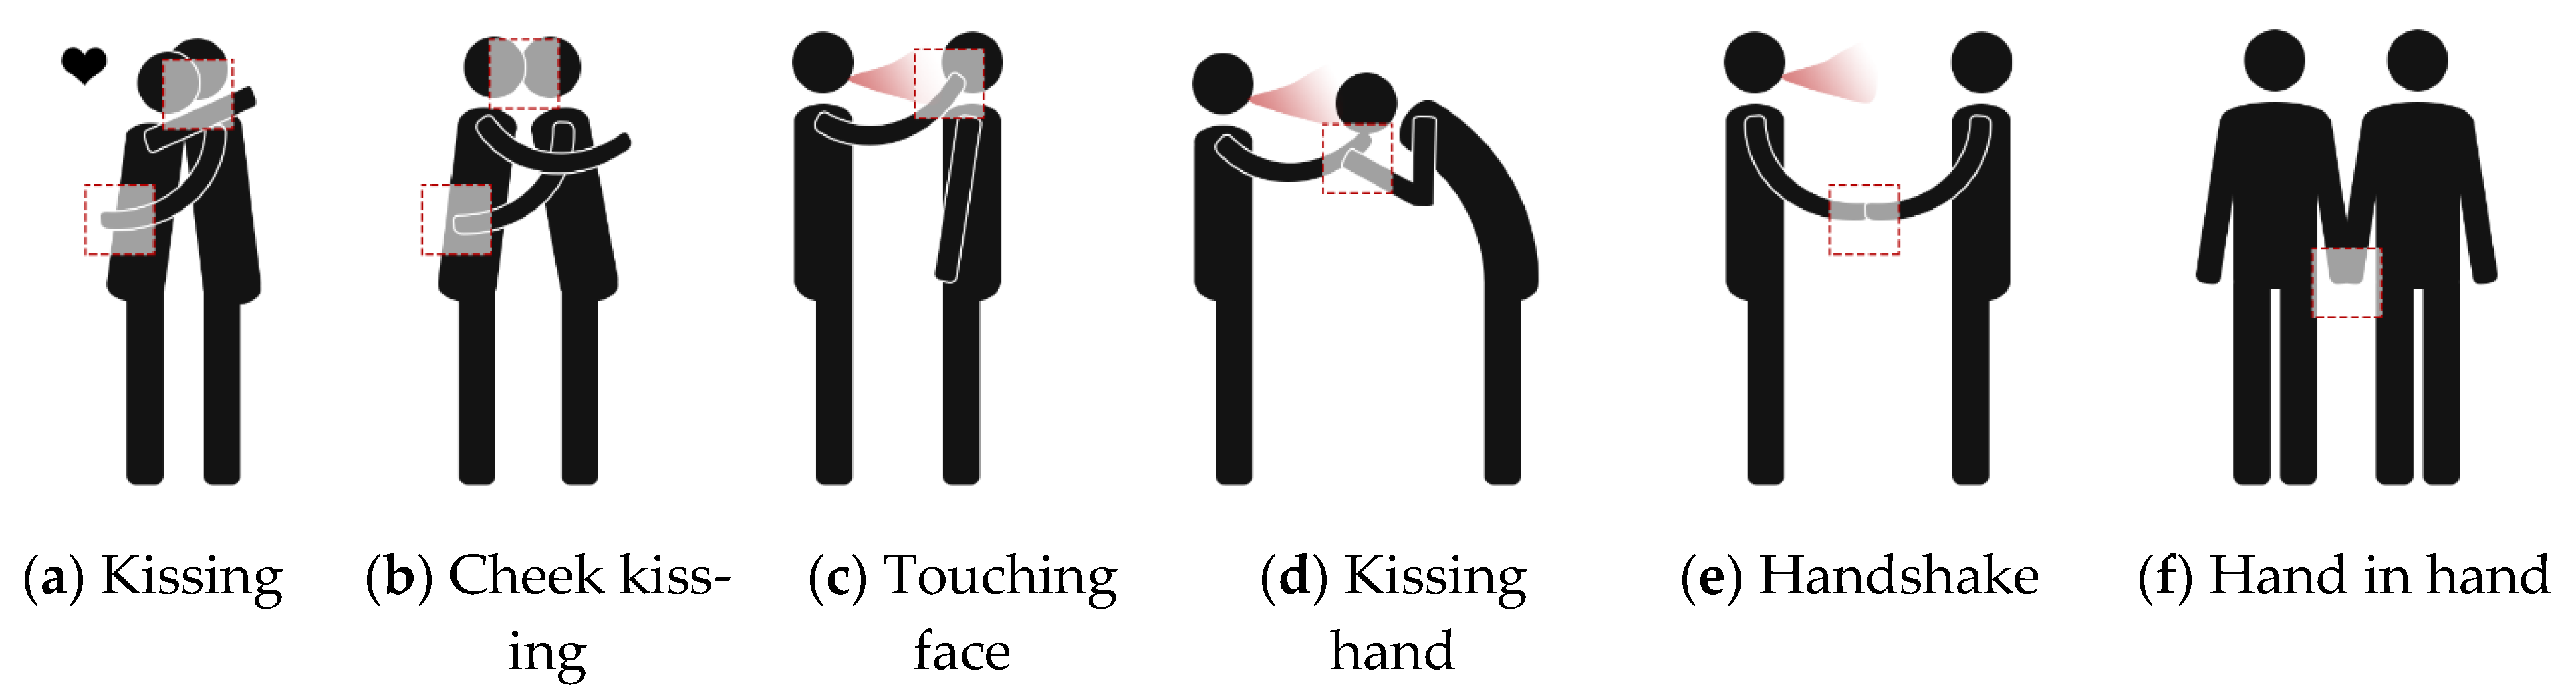
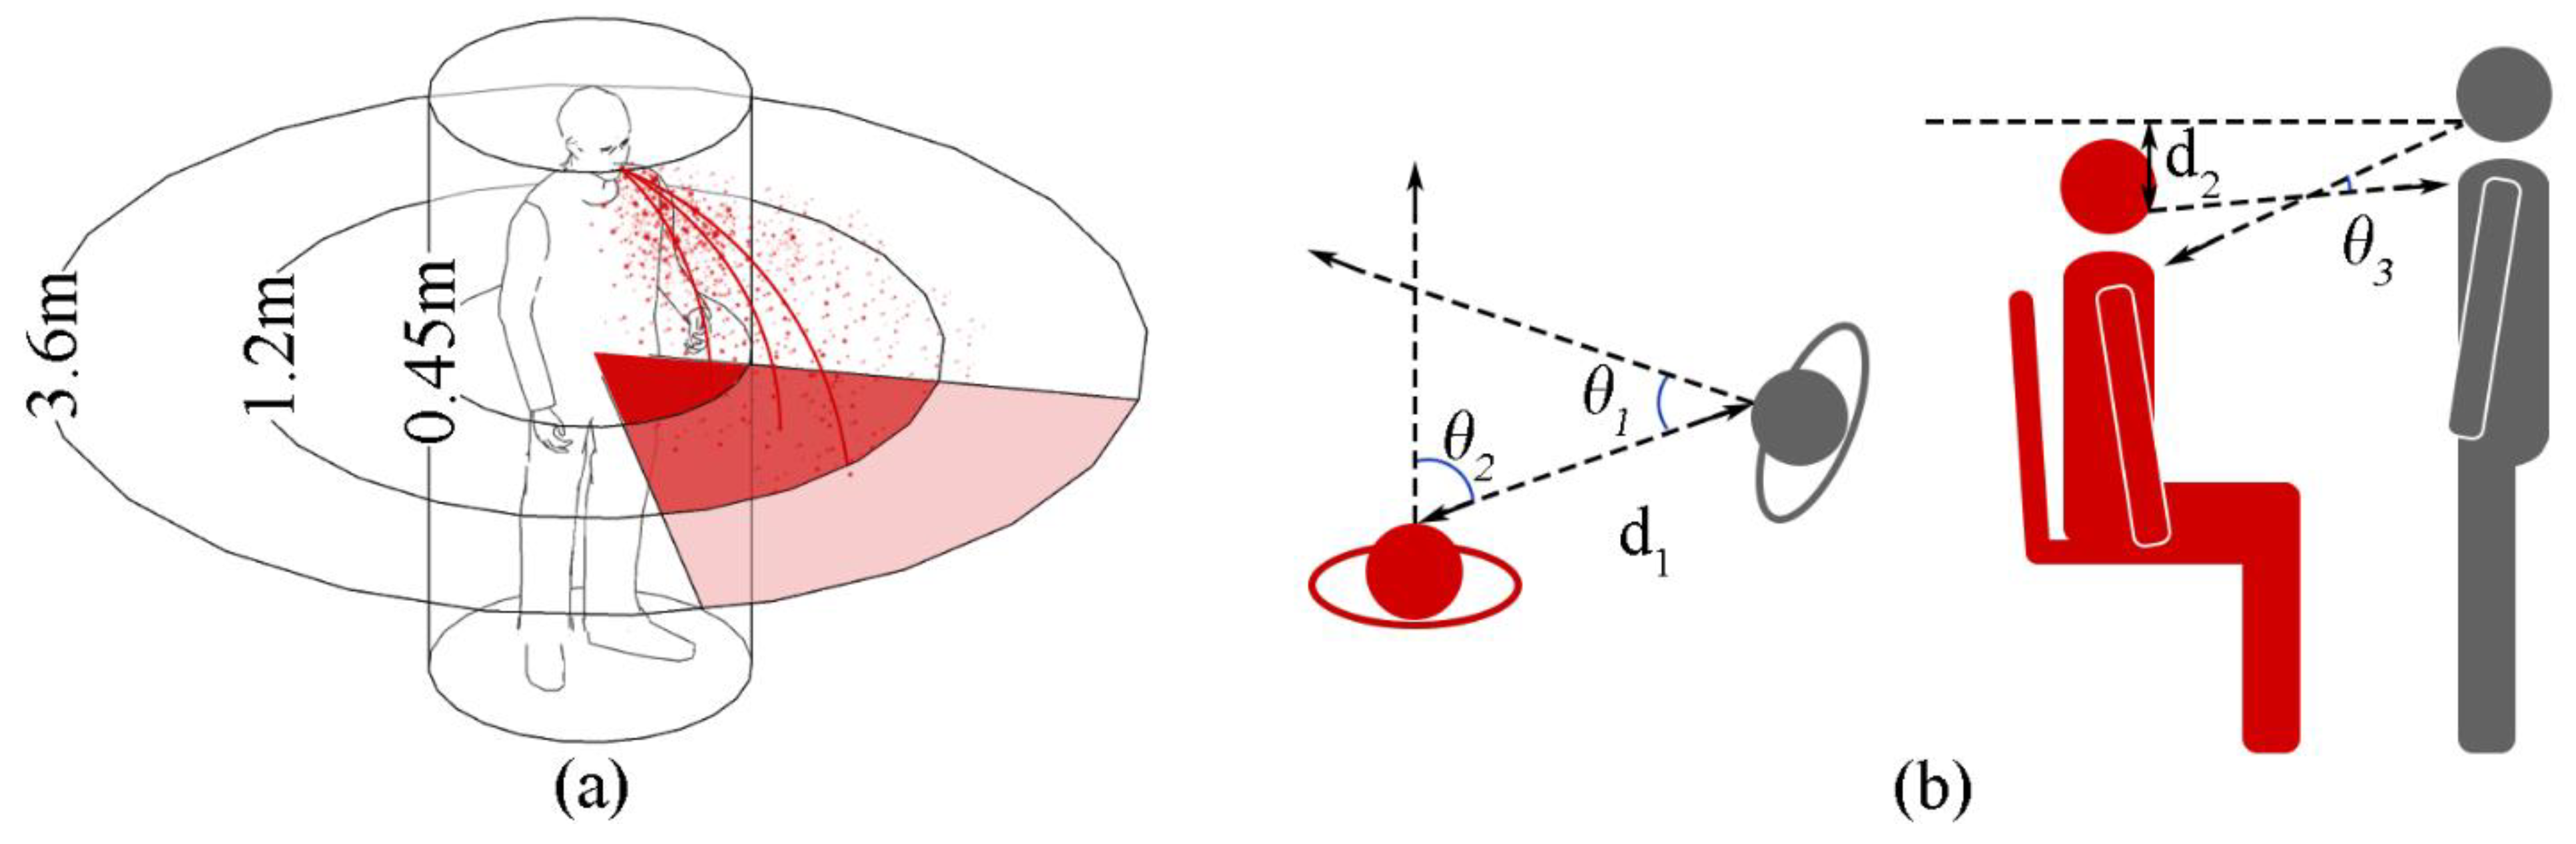
| Personal Spaces | Social Relations | Behaviors | Distance (m) |
|---|---|---|---|
| Intimate zone | Couple, parent-child | Kiss (lips, nose, forehead, face), hug, touch (body), whisper | 0–0.45 |
| Personal zone | Friends or family with positive interactions | Cheek kiss, hand kiss, hug, talk, party | 0.45–1.2 |
| Social zone | Colleagues, strangers | Greetings, bows, and handshakes | 1.2–3.6 |
| Public zone | Public figure | Speech, show | >3.6–7.6 |
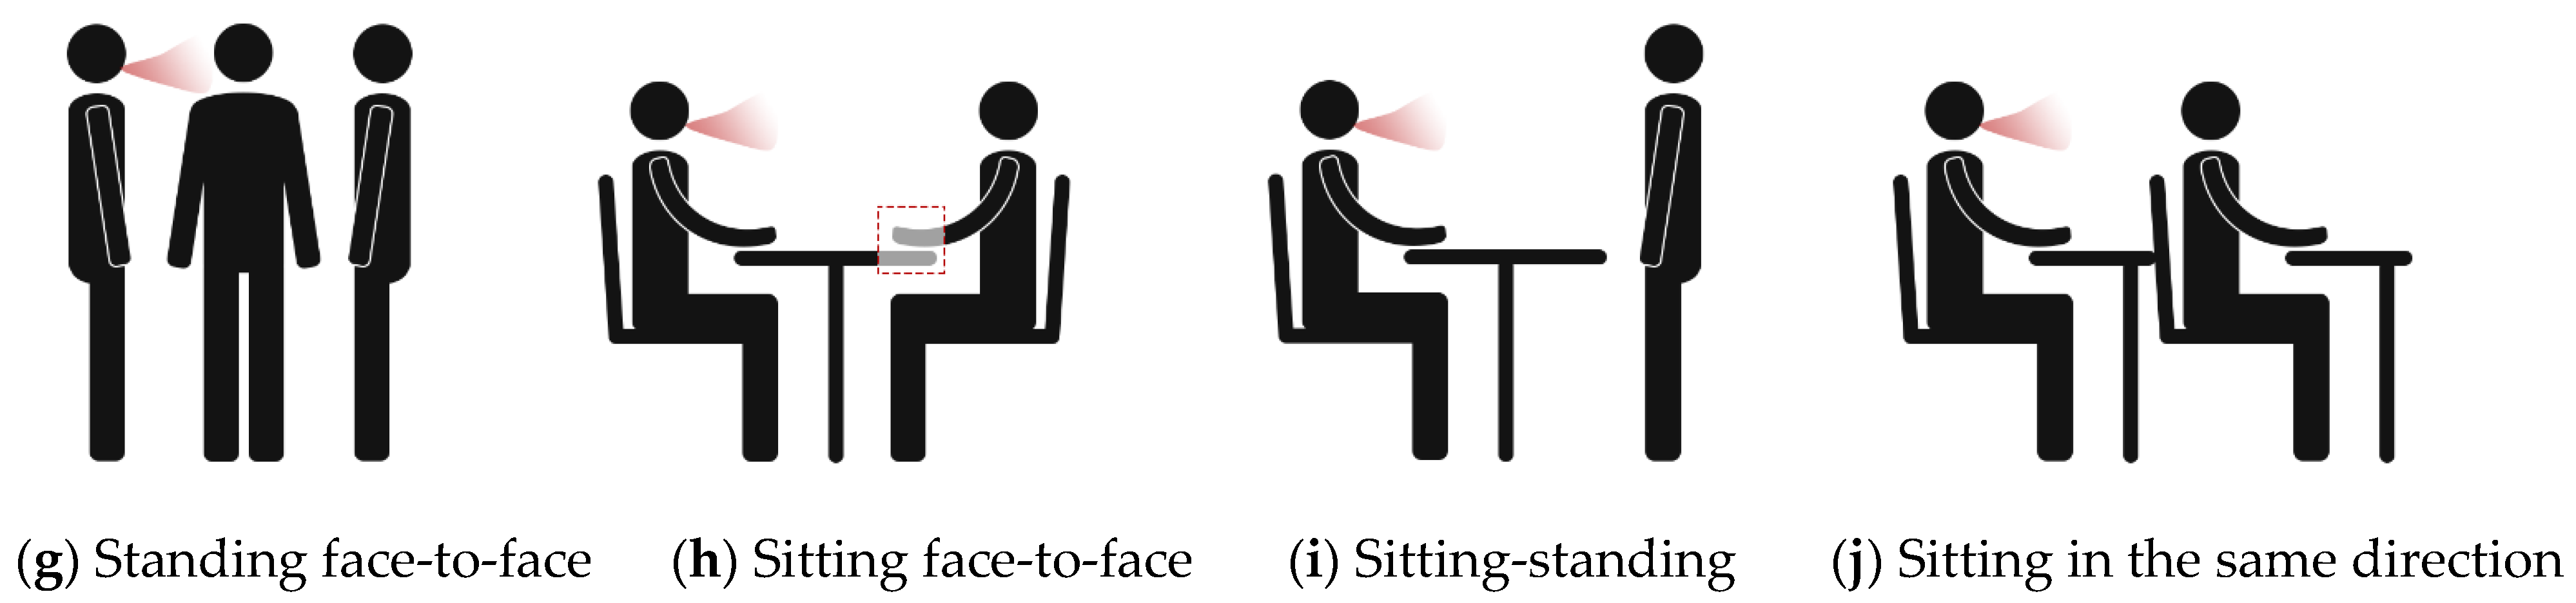
| (a) | (b) | (c) | (d) | (e) | (f) | |
|---|---|---|---|---|---|---|
 |  |  |  | |||
| Talking | ● | ● | ● | |||
| Cooperation | ● | ● | ||||
| Collaborative | ● | ● | ||||
| Competition | ● | ● | ||||
| No interaction | ● | ● | ● | |||
| Resting a (METS ≤ 1.5) | Light b (1.5 < METS ≤ 2.5) | Moderate c (2.5 < METS ≤ 5.0) | High d (METS > 5.0) | ||
|---|---|---|---|---|---|
| Inhalation rate (m3/hour) | Adult male | 0.7 | 0.8 | 2.5 | 4.8 |
| Adult female | 0.3 | 0.5 | 1.6 | 2.9 | |
| Average adult | 0.5 | 0.6 | 2.1 | 3.9 | |
| Frequency (breaths/minute) | Adult male | 12 | 17 | - | 21 |
| Adult female | 12 | 19 | - | 30 | |
| Average hours per day e (hours/day) (percentage) | Indoors | 9.82 (40.91%) | 9.82 (40.91%) | 0.71 (2.96%) | 0.1 (0.41%) |
| Outdoors | 0.51 (2.12%) | 0.51 (2.12%) | 0.65 (2.70%) | 0.12 (0.50%) | |
| In vehicle | 0.86 (3.58%) | 0.86 (3.58%) | 0.05 (0.20%) | 0.0012 (0.01%) | |
Publisher’s Note: MDPI stays neutral with regard to jurisdictional claims in published maps and institutional affiliations. |
© 2022 by the authors. Licensee MDPI, Basel, Switzerland. This article is an open access article distributed under the terms and conditions of the Creative Commons Attribution (CC BY) license (https://creativecommons.org/licenses/by/4.0/).
Share and Cite
Zhen, Q.; Zhang, A.; Huang, Q.; Li, J.; Du, Y.; Zhang, Q. Overview of the Role of Spatial Factors in Indoor SARS-CoV-2 Transmission: A Space-Based Framework for Assessing the Multi-Route Infection Risk. Int. J. Environ. Res. Public Health 2022, 19, 11007. https://doi.org/10.3390/ijerph191711007
Zhen Q, Zhang A, Huang Q, Li J, Du Y, Zhang Q. Overview of the Role of Spatial Factors in Indoor SARS-CoV-2 Transmission: A Space-Based Framework for Assessing the Multi-Route Infection Risk. International Journal of Environmental Research and Public Health. 2022; 19(17):11007. https://doi.org/10.3390/ijerph191711007
Chicago/Turabian StyleZhen, Qi, Anxiao Zhang, Qiong Huang, Jing Li, Yiming Du, and Qi Zhang. 2022. "Overview of the Role of Spatial Factors in Indoor SARS-CoV-2 Transmission: A Space-Based Framework for Assessing the Multi-Route Infection Risk" International Journal of Environmental Research and Public Health 19, no. 17: 11007. https://doi.org/10.3390/ijerph191711007