
Modeling Sleep Quality Depending on Objective Actigraphic Indicators Based on Machine Learning Methods


Abstract
:1. Introduction
2. Literature Background of Sleep Performance Metrics

| Variables (Factor) | Context | References |
|---|---|---|
| Total minutes in bed | Minutes spent in bed per night | [15,16] |
| Total sleep time (TST) | Length of sleep per night expressed in minutes | |
| Wake after sleep onset (WASO) | Time spent awake after falling asleep for the first time | |
| Number of awakenings | Number of awakenings during the night | |
| Average awakening length | Time in seconds spent awakening during the night | |
| Movement index | The number of minutes without movement is expressed as a percentage of the movement phase (i.e., the number of periods with arm movement). | |
| Fragmentation index | The number of minutes with movement is expressed as a percentage of the immobile phase (i.e., the number of the period without arm movement) | |
| Sleep fragmentation index | The ratio of the movement and fragmentation indices |
3. Methods
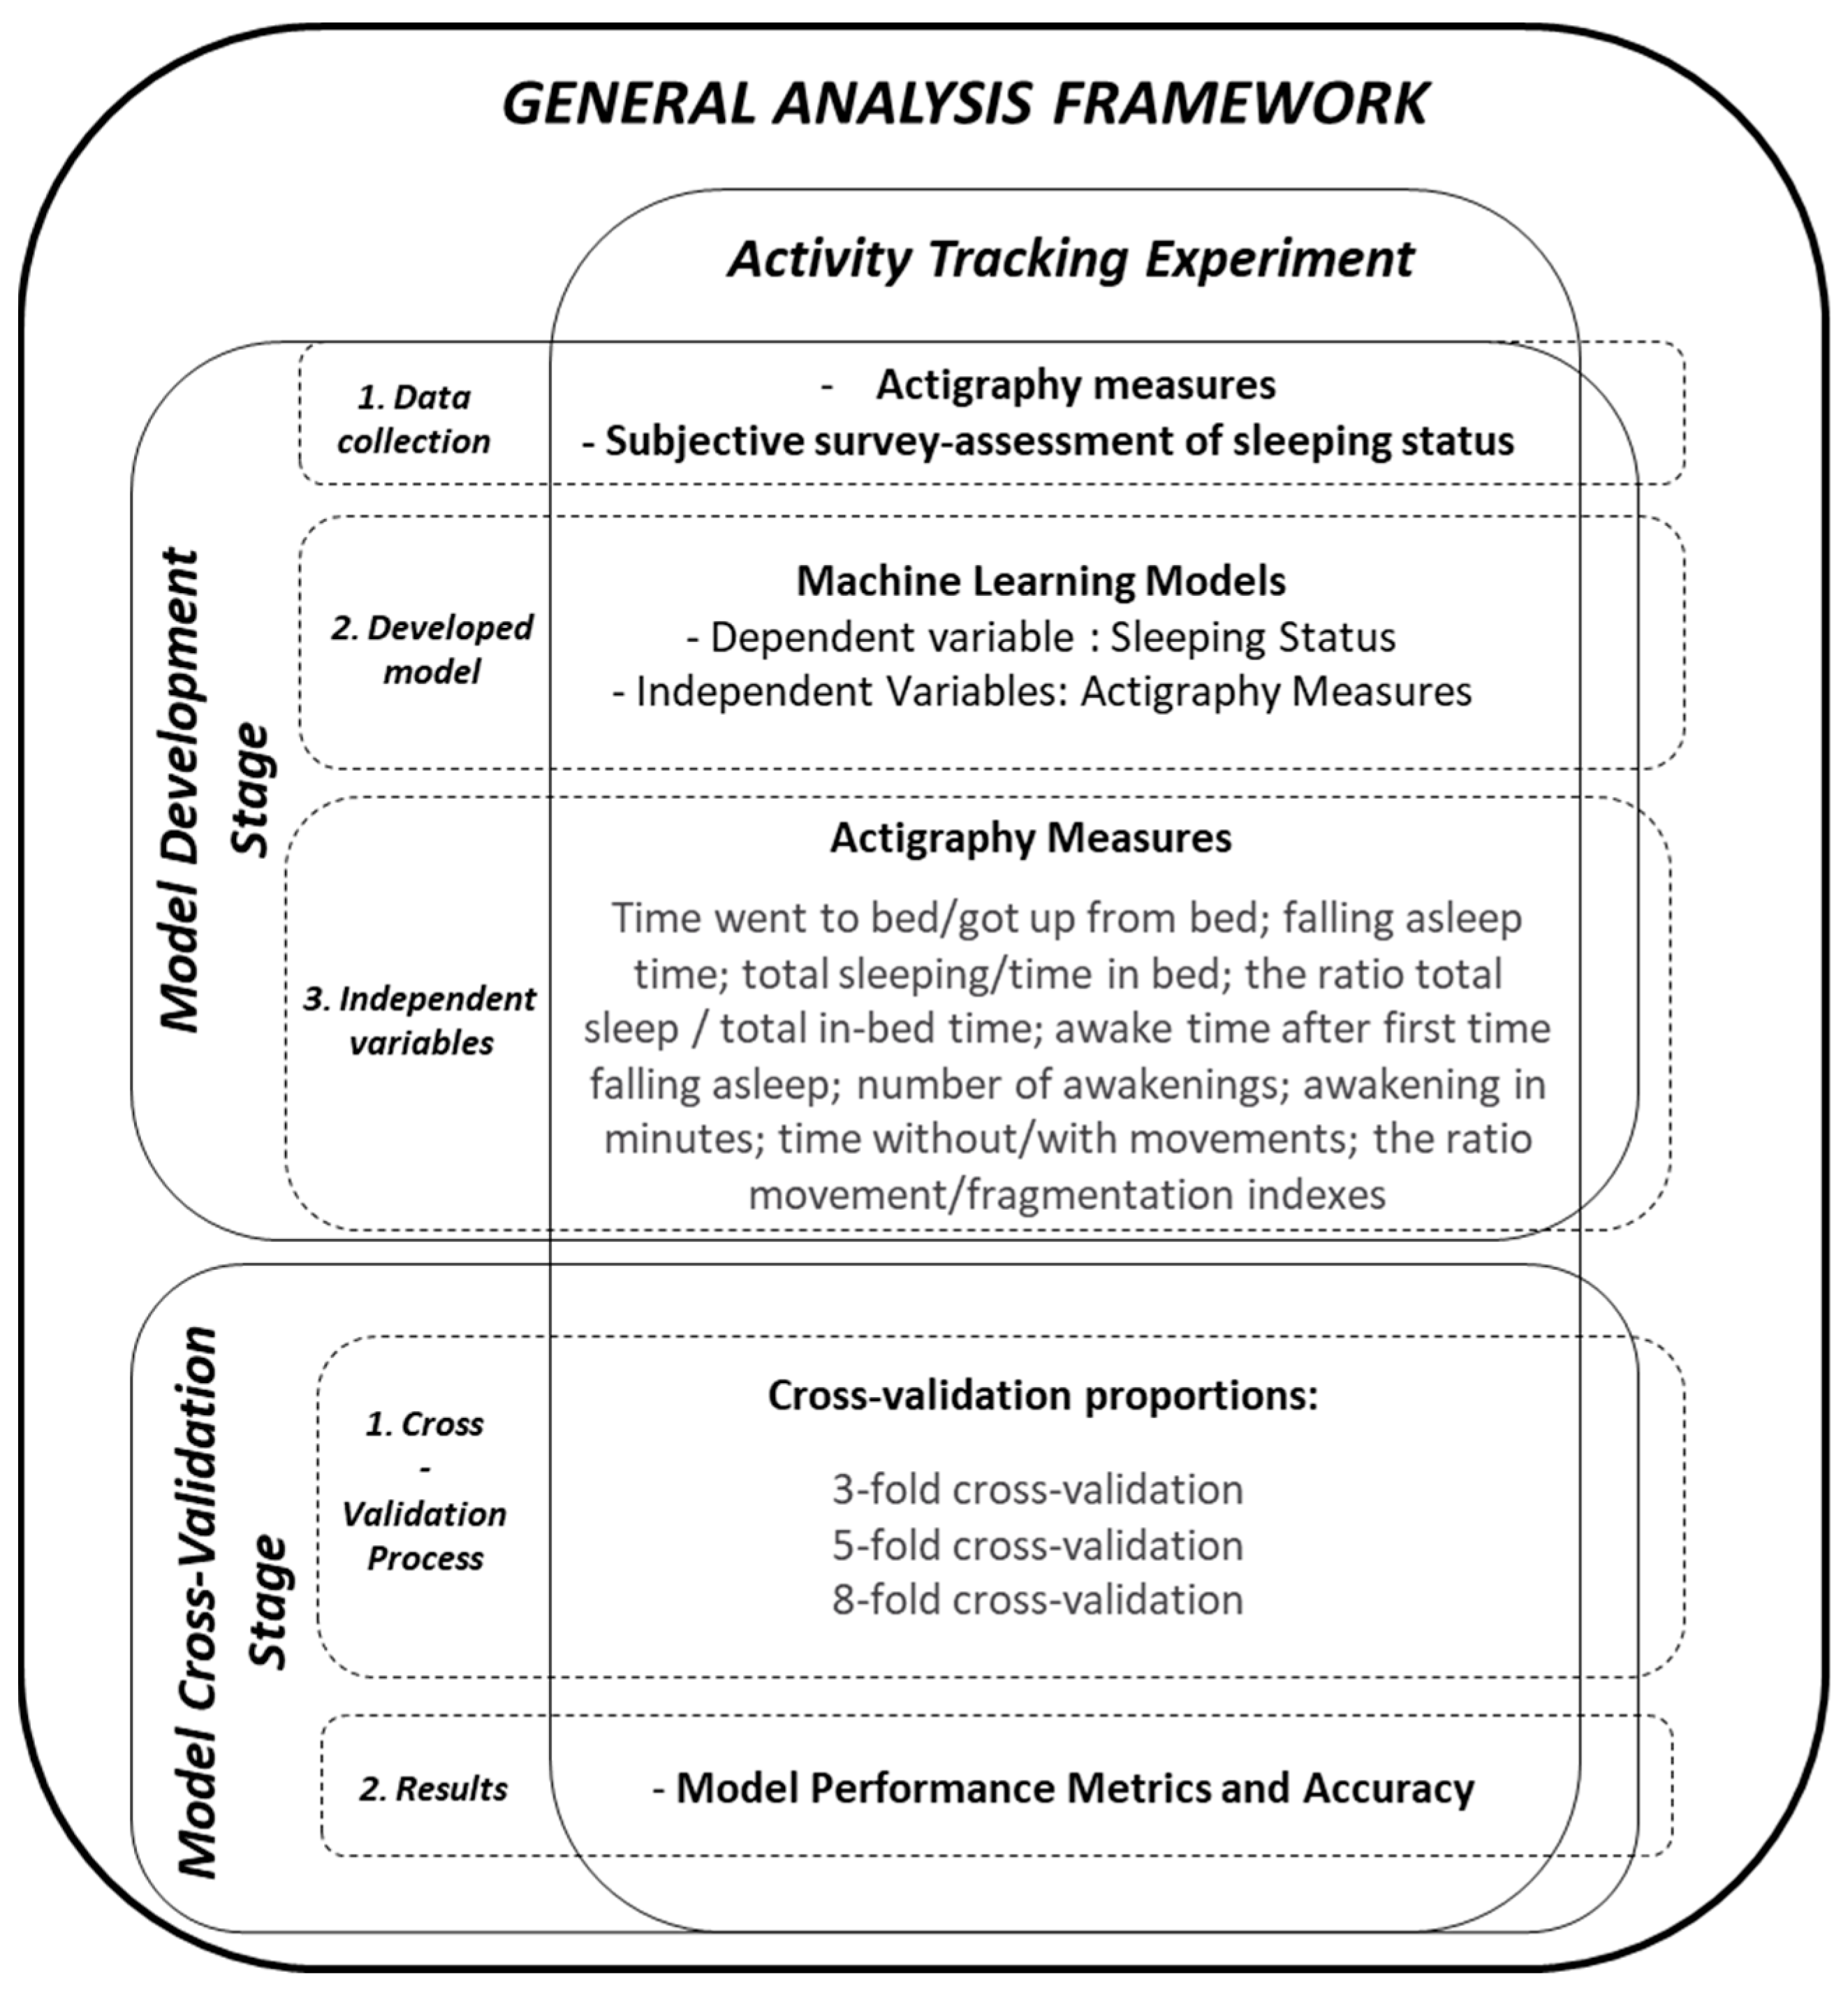
3.1. Data Source
3.2. Methods
3.3. Signal Processing Algorithm
4. Analysis
4.1. Classification Approach and Model
4.2. Machine Learning Methods
5. Results
6. Discussion
6.1. Validity of Applied Dataset and Machine Learning Methods
6.2. Model Performance
6.3. Limitation, Application, and Future Research
7. Conclusions
- The developed model showed satisfactory classification ability and demonstrated the mutual connection between sleeping, human activity, and actigraph data.
- The proposed model applied to the real actigraph dataset showed satisfactory performance with an accuracy of approximately 80%. This result is consistent with previous studies using the same MMASH dataset.
- Machine learning methods (SVM and KNN) showed better performance than LR and NB.
- The combination of actigraph features can be used to access the human sleep process and predict sleep disorders.
Author Contributions
Funding
Institutional Review Board Statement
Informed Consent Statement
Data Availability Statement
Conflicts of Interest
References
- WHO. World Health Organization Site. 2022. Available online: www.who.int (accessed on 15 June 2022).
- Guzman, L.C.D.; De Guzman, L.C.; Maglaque, R.P.C.; Torres, V.M.B.; Zapido, S.P.A.; Cordel, M.O. Design and evaluation of a multi-model, multi-level artificial neural network for eczema skin lesion detection. In Proceedings of the 2015 3rd International Conference on Artificial Intelligence, Modelling and Simulation, Kota Kinabalu, Malaysia, 2–4 December 2015. [Google Scholar]
- Wang, S.Y.; Chang, H.J.; Lin, C.C. Sleep disturbances among patients with non-small cell lung cancer in Taiwan: Congruence between sleep log and actigraphy. Cancer Nurs. 2010, 33, E11–E17. [Google Scholar] [CrossRef] [PubMed]
- Natale, V.; Plazzi, G.; Martoni, M. Actigraphy in the assessment of insomnia: A quantitative approach. Sleep 2009, 32, 767–771. [Google Scholar] [CrossRef] [PubMed] [Green Version]
- Sivertsen, B.; Omvik, S.; Havik, O.E.; Pallesen, S.; Bjorvatn, B.; Nielsen, G.H.; Straume, S.; Nordhus, I.H. A comparison of actigraphy and polysomnography in older adults treated for chronic primary insomnia. Sleep 2006, 29, 1353–1358. [Google Scholar] [CrossRef] [PubMed] [Green Version]
- Sitnick, S.L.; Goodlin-Jones, B.L.; Anders, T.F. The use of actigraphy to study sleep disorders in preschoolers: Some concerns about detection of nighttime awakenings. Sleep 2008, 31, 395–401. [Google Scholar] [CrossRef]
- Adebayo, J.; Gilmer, J.; Muelly, M.; Goodfellow, I.; Hardt, M.; Kim, B. Sanity checks for saliency maps. In Proceedings of the 32nd Conference on Neural Information Processing Systems, Montréal, QC, Canada, 3–8 December 2018; pp. 1–11. [Google Scholar]
- Kurniawan, H.; Maslov, A.V.; Pechenizkiy, M. Stress detection from speech and galvanic skin response signals. In Proceedings of the IEEE Symposium on Computer-Based Medical Systems, Porto, Portugal, 20–22 June 2013; pp. 209–214. [Google Scholar]
- Taylor, J.E.T.; Taylor, G.W. Artificial cognition: How experimental psychology can help generate explainable artificial intelligence. Psychon. Bull. Rev. 2021, 28, 454–474. [Google Scholar] [CrossRef]
- Zhang, J.; Wang, J.; He, L.; Li, Z.; Yu, P.S. Layerwise Perturbation-Based Adversarial Training for Hard Drive Health Degree Prediction. In Proceedings of the 2018 IEEE International Conference on Data Mining (ICDM), Singapore, 7–20 November 2018; pp. 1428–1433. [Google Scholar]
- Setyohadi, D.B.; Kusrohmaniah, S.; Gunawan, S.B.; Pranowo, P.; Prabuwono, A. Galvanic Skin Response Data Classification for Emotion Detection. Int. J. Electr. Comput. Eng. 2018, 8, 31–41. [Google Scholar] [CrossRef] [Green Version]
- Palanisamy, K.; Murugappan, M.; Yaacob, S. Multiple Physiological Signal-Based Human Stress Identification Using Non-Linear Classifiers. Electr. Electron. Eng. 2013, 19, 80–85. [Google Scholar] [CrossRef]
- Lutin, E.; Hashimoto, R.; De Raedt, W.; Van Hoof, C. Feature Extraction for Stress Detection in Electrodermal Activity. In Proceedings of the 14th International Joint Conference on Biomedical Engineering Systems and Technologies, Vienna, Austria, 11–13 February 2021; Volume 4, pp. 177–185. [Google Scholar]
- American Academy of Sleep Medicine. Diagnostic and Coding Manual, 2nd ed.; International Classification of Sleep Disorders; American Academy of Sleep Medicine: Westchester, IL, USA, 2005. [Google Scholar]
- Rossi, A.; Da Pozzo, E.; Menicagli, D.; Tremolanti, C.; Priami, C.; Sirbu, A.; Clifton, D.; Martini, C.; Morelli, D. Multilevel Monitoring of Activity and Sleep in Healthy People (Version 1.0.0). PhysioNet 2020. [Google Scholar] [CrossRef]
- Rossi, A.; Da Pozzo, E.; Menicagli, D.; Tremolanti, C.; Priami, C.; Sirbu, A.; Clifton, D.; Martini, C.; Morelli, D. A Public Dataset of 24-h Multi-Levels Psycho-Physiological Responses in Young Healthy Adults. Data 2020, 5, 91. [Google Scholar] [CrossRef]
- Werner, H.; Molinari, L.; Guyer, C.; Jenni, O.G. Agreement rates between actigraphy, diary, and questionnaire for children’s sleep patterns. Arch. Pediatr. Adolesc. Med. 2008, 162, 350–358. [Google Scholar] [CrossRef] [Green Version]
- Taylor, D.J.; Zimmerman, M.R.; Gardner, C.E.; Williams, J.M.; Grieser, E.A.; Tatum, J.I.; Bramoweth, A.D.; Francetich, J.M.; Ruggero, C. A pilot randomized controlled trial of the effects of cognitive-behavioral therapy for insomnia on sleep and daytime functioning in college students. Behav. Ther. 2014, 45, 376–389. [Google Scholar] [CrossRef] [PubMed]
- Taylor, D.J.; Peterson, A.L.; Pruiksma, K.E.; Young-McCaughan, S.; Nicholson, K.; Mintz, J.; Strong Star Consortium. Internet and In-Person Cognitive Behavioral Therapy for Insomnia in Military Personnel: A Randomized Clinical Trial. Sleep 2017, 40, zsx075. [Google Scholar] [CrossRef] [PubMed] [Green Version]
- Dayyat, E.A.; Spruyt, K.; Molfese, D.L.; Gozal, D. Sleep estimates in children: Parental versus actigraphic assessments. Nat. Sci. Sleep 2011, 3, 115–123. [Google Scholar]
- Paine, S.; Gradisar, M. A randomised controlled trial of cognitive-behaviour therapy for behavioural insomnia of childhood in school-aged children. Behav. Res. Ther. 2011, 49, 379–388. [Google Scholar] [CrossRef] [PubMed]
- Goldberger, A.; Amaral, L.; Glass, L.; Hausdorff, J.; Ivanov, P.C.; Mark, R.; Stanley, H.E. PhysioBank, PhysioToolkit, and PhysioNet: Components of a new research resource for complex physiologic signals. Circulation 2000, 101, e215–e220. [Google Scholar] [CrossRef] [PubMed] [Green Version]
- American Medical AssociationCPT 2018 Professional Edition Chicago; American Medical Association: Chicago, IL, USA, 2017.
- Morgenthaler, T.; Alessi, C.; Friedman, L.; Owens, J.; Kapur, V.; Boehlecke, B.; Brown, T.; Chesson, A., Jr.; Coleman, J.; Lee-Chiong, T.; et al. Practice parameters for the use of actigraphy in the assessment of sleep and sleep disorders: An update for 2007. Sleep 2007, 30, 519. [Google Scholar] [CrossRef] [Green Version]
- Sadeh, A. The role and validity of actigraphy in sleep medicine: An update. Sleep Med. Rev. 2011, 15, 259. [Google Scholar] [CrossRef]
- Marino, M.; Li, Y.; Rueschman, M.N.; Winkelman, J.W.; Ellenbogen, J.M.; Solet, J.M.; Dulin, H.; Berkman, L.F.; Buxton, O.M. Measuring sleep: Accuracy, sensitivity, and specificity of wrist actigraphy compared to polysomnography. Sleep 2013, 36, 1747. [Google Scholar] [CrossRef]
- Thomas, S.S.; Gamble, K. 2022 Actigraphy in the Evaluation of Sleep Disorders. Available online: https://www.uptodate.com/contents/actigraphy-in-the-evaluation-of-sleep-disorders#:~:text=Actigraphy%20is%20a%20validated%20method,accelerometer%20%5B1%2D6%5D (accessed on 15 June 2022).
- Cole, R.J.; Kripke, D.F.; Gruen, W.; Mullaney, D.J.; Gillin, J.C. Automatic sleep/wake identification from wrist activity. Sleep 1992, 15, 461–469. [Google Scholar] [CrossRef]
- Curcio, G.; Tempesta, D.; Scarlata, S.; Marzano, C.; Moroni, F.; Rossini, P.M.; Ferrara, M.; De Gennaro, L. Validity of the Italian Version of the Pittsburgh Sleep Quality Index (PSQI). Neurol. Sci. 2013, 34, 511–519. [Google Scholar] [CrossRef]
- Buysse, D.J.; Reynolds, C.F., 3rd; Monk, T.H.; Berman, S.R.; Kupfer, D.J. The Pittsburgh Sleep Quality Index: A new instrument for psychiatric practice and research. Psychiatry Res. 1989, 28, 193–213. [Google Scholar] [CrossRef]
- Jahrami, H.; BaHammam, A.S.; AlGahtani, H.; Ebrahim, A.; Faris, M.; AlEid, K.; Saif, Z.; Haji, E.; Dhahi, A.; Marzooq, H.; et al. The examination of sleep quality for frontline healthcare workers during the outbreak of COVID-19. Sleep Breath. 2021, 25, 503–511. [Google Scholar] [CrossRef] [PubMed]
- Dzierzewski, J.M.; Mitchell, M.; Rodriguez, J.C.; Fung, C.H.; Jouldjian, S.; Alessi, C.A.; Martin, J.L. Patterns and predictors of sleep quality before, during, and after hospitalization in older adults. J. Clin. Sleep Med. 2015, 11, 45–51. [Google Scholar] [CrossRef] [PubMed] [Green Version]
- Seun-Fadipe, C.T.; Mosaku, K.S. Sleep quality and academic performance among Nigerian undergraduate students. J. Syst. Integr. Neurosci. 2017, 3, 1–6. [Google Scholar] [CrossRef] [Green Version]
- Esteva, A.; Kuprel, B.; Novoa, R.A.; Ko, J.; Swetter, S.M.; Blau, H.M. Corrigendum: Dermatologist-level classification of skin cancer with deep neural networks. Nature 2017, 546, 686. [Google Scholar] [CrossRef]
- MPH Online Learning Modules-SPH-Boston University. Available online: https://sphweb.bumc.bu.edu/otlt/MPH-Modules/PH717-QuantCore/PH717-Module9-Correlation-Regression/PH717-Module9-Correlation-Regression4.html (accessed on 25 July 2022).
- Oyeleye, M.; Chen, T.; Titarenko, S.; Antoniou, G. A Predictive Analysis of Heart Rates Using Machine Learning Techniques. Int. J. Environ. Res. Public Health 2022, 19, 2417. [Google Scholar] [CrossRef]
- Site, A.; Lohan, E.S.; Jolanki, O.; Valkama, O.; Hernandez, R.R.; Latikka, R.; Alekseeva, D.; Vasudevan, S.; Afolaranmi, S.; Ometov, A.; et al. Managing Perceived Loneliness and Social-Isolation Levels for Older Adults: A Survey with Focus on Wearables-Based Solutions. Sensors 2022, 22, 1108. [Google Scholar] [CrossRef]
- Geng, D.; Qin, Z.; Wang, J.; Gao, Z.; Zhao, N. Personalized recognition of wake/sleep state based on the combined shapelets and K-means algorithm. Biomed. Signal. Process. Control 2022, 71, 103132. [Google Scholar] [CrossRef]
- Kusmakar, S.; Karmakar, C.; Zhu, Y.; Shelyag, S.; Drummond, S.; Ellis, J.; Angelova, M. A machine learning model for multi-night actigraphic detection of chronic insomnia: Development and validation of a pre-screening tool. R. Soc. Open Sci. 2021, 8, 202264. [Google Scholar] [CrossRef]
- Sathyanarayana, A.; Joty, S.; Fernandez-Luque, L.; Ofli, F.; Srivastava, J.; Elmagarmid, A.; Arora, T.; Taheri, S. Sleep Quality Prediction From Wearable Data Using Deep Learning. JMIR Mhealth Uhealth 2016, 4, e125. [Google Scholar] [CrossRef]
- Angelova, M.; Karmakar, C.; Zhu, Y.; Drummond, S.P.A.; Ellis, J. Automated Method for Detecting Acute Insomnia Using Multi-Night Actigraphy Data. IEEE Access 2020, 8, 74413–74422. [Google Scholar] [CrossRef]
- Sano, A.; Chen, W.; Lopez-Martinez, D.; Taylor, S.; Picard, R.W. Multimodal Ambulatory Sleep Detection Using LSTM Recurrent Neural Networks. IEEE J. Biomed. Health Inform. 2019, 4, 1607–1617. [Google Scholar] [CrossRef]
- Khademi, A.; El-Manzalawy, Y.; Master, L.; Buxton, O.M.; Honavar, V.G. Personalized Sleep Parameters Estimation from Actigraphy: A Machine Learning Approach. Nat. Sci. Sleep 2019, 11, 387–399. [Google Scholar] [CrossRef] [Green Version]
- Huang, Y.; Zhu, M. Increased Global PSQI Score Is Associated with Depressive Symptoms in an Adult Population from the United States. Nat. Sci. Sleep 2020, 12, 487–495. [Google Scholar] [CrossRef]
- Backhaus, J.; Junghanns, K.; Broocks, A.; Riemann, D.; Hohagen, F. Test–retest Reliability and Validity of the Pittsburgh Sleep Quality Index in Primary Insomnia. J. Psychosom. Res. 2002, 53, 737–740. [Google Scholar] [CrossRef]
- Hu, Z.; Zhu, X.; Kaminga, A.C.; Zhu, T.; Nie, Y.; Xu, H. Association between poor sleep quality and depression symptoms among the elderly in nursing homes in Hunan province, China: A cross-sectional study. BMJ Open 2020, 10, e036401. [Google Scholar] [CrossRef]
- Chidambaram, S.; Srinivasagan, K.G. Performance evaluation of support vector machine classification approaches in data mining. Cluster Comput. 2019, 22, 189–196. [Google Scholar] [CrossRef]
- Bhaskar, N.A. Performance Analysis of Support Vector Machine and Neural Networks in Detection of Myocardial Infarction. Procedia Comput. Sci. 2015, 46, 20–30. [Google Scholar] [CrossRef] [Green Version]
- Naicker, N.; Adeliyi, T.; Wing, J. Linear Support Vector Machines for Prediction of Student Performance in School-Based Education. Math. Probl. Eng. 2020, 7, 4761468. [Google Scholar] [CrossRef]
- Rajaguru, H.; Sannasi Chakravarthy, S.R. Analysis of Decision Tree and K-Nearest Neighbor Algorithm in the Classification of Breast Cancer. Asian Pac. J. Cancer Prev. 2019, 20, 3777–3781. [Google Scholar] [CrossRef] [Green Version]
- Forner-Cordero, A.; Umemura, G.S.; Furtado, F.; Gonçalves, B.D.S.B. Comparison of sleep quality assessed by actigraphy and questionnaires to healthy subjects. Sleep Sci. 2018, 11, 141–145. [Google Scholar] [CrossRef]
- Sadeh, A.; Hauri, P.J.; Kripke, D.F.; Lavie, P. The role of actigraphy in the evaluation of sleep disorders. Sleep 1995, 18, 288–302. [Google Scholar] [CrossRef]
- Maynard, T.; Appleman, E.; Cronin-Golomb, A.; Neargarder, S. Objective measurement of sleep by smartphone application: Comparison with actigraphy and relation to self-reported sleep. Explor. Med. 2021, 2, 382–391. [Google Scholar] [CrossRef]
- Birling, Y.; Li, G.; Jia, M.; Zhu, X.; Sarris, J.; Bensoussan, A.; Wang, J.; Fahey, P. Is insomnia disorder associated with time in bed extension? Sleep Sci. 2020, 13, 215–219. [Google Scholar]
- Suni, E. How To Determine Poor Sleep Quality? Sleep Foundation. Available online: https://www.sleepfoundation.org/sleep-hygiene/how-to-determine-poor-quality-sleep (accessed on 25 July 2022).
- Ohayon, M.M.; Krystal, A.; Roehrs, T.A.; Roth, T.; Vitiello, M.V. Using difficulty resuming sleep to define nocturnal awakenings. Sleep Med. 2010, 11, 236–241. [Google Scholar] [CrossRef] [Green Version]
- Momayyezi, M.; Fallahzadeh, H.; Farzaneh, F.; Momayyezi, M. Sleep Quality and Cancer-Related Fatigue in Patients with Cancer. J. Caring Sci. 2021, 10, 145–152. [Google Scholar] [CrossRef]


| Classifier | Accuracy | PPV | Sensitivity | Specificity |
|---|---|---|---|---|
| Logistic regression | 57% | 60 | 75 | 33 |
| Support vector machine | 71% | 100 | 71 | 0 |
| Fine k-nearest neighbor | 81% | 100 | 79 | 100 |
| Naïve Bayes | 67% | 93 | 70 | 0 |
| Classifier | Accuracy | PPV | Sensitivity | Specificity |
|---|---|---|---|---|
| Logistic regression | 62% | 60 | 82 | 40 |
| Support vector machine | 86% | 93 | 88 | 80 |
| Fine k-nearest neighbor | 76% | 93 | 78 | 67 |
| Naïve Bayes | 67% | 93 | 70 | 0 |
| Classifier | Accuracy | PPV | Sensitivity | Specificity |
|---|---|---|---|---|
| Logistic regression | 67% | 80 | 75 | 40 |
| Support vector machine | 71% | 100 | 71 | 0 |
| Fine k-nearest neighbor | 81% | 93 | 82 | 75 |
| Naïve Bayes | 71% | 100 | 71 | 0 |
| Study | Dataset Used | Machine Learning Methods | Independent Variables | Dependent Variables | Average Model Accuracy |
|---|---|---|---|---|---|
| [36] | Open source MMASH | Autoregressive integrated moving average, linear regression, support vector regression, K-nearest neighbor, decision tree, random forest, and long-short-term memory | Heart rate time-series | Expected heart rate | Over 90% |
| [37] | Cross-disciplinary survey using open source MMASH and other | Logistic regression, random forest, support vector machine | Different metrics of wireless technology and wearables | Perceived loneliness, social isolation levels | Over 90% |
| [38] | Open source MMASH | Combined shapelets and K-means algorithm | Heart rate variability segment | Wake/sleep state | Over 77% |
| [39] | Experiment with co-habiting couples | Random forest, support vector machine | Entropy, statistics, Poincaré plot features, total sleep time, wake after sleep onset, sleep-wake ratio, sleep latency and sleep efficiency | Nocturnal Awakenings | Approximately 75–80% |
| [40] | Experiment with random participants | Logistic regression, multilayer perception, convolutional neural network, recurrent neural network, a long-short-term memory cell | Raw accelerometer data, awake time, a summary of movements | Sleep quality | Approximately 66–93% |
| [41] | Publicly available source | Random forest, support vector machine | Entropy, statistics, Poincaré plot features, total sleep time, wake after sleep onset, sleep-wake ratio, sleep efficiency, and complex correlation measure | Nocturnal awakenings | Approximately 73–84% |
| [42] | Experiment with undergraduate students | Recurrent neural network with long-short-term memory cells | Different combinations of multimodal data from smartphones and wearable technologies | Sleep/wake state, sleep onset/offset | Over 90% |
| [43] | Experiment in a sleep laboratory | Logistic regression, random forest, adaptive boost, and extreme gradient boost | Total sleep time, wake after sleep onset, sleep efficiency, number of awakenings | Wake/sleep state | Over 75% |
Publisher’s Note: MDPI stays neutral with regard to jurisdictional claims in published maps and institutional affiliations. |
© 2022 by the authors. Licensee MDPI, Basel, Switzerland. This article is an open access article distributed under the terms and conditions of the Creative Commons Attribution (CC BY) license (https://creativecommons.org/licenses/by/4.0/).
Share and Cite
Bitkina, O.V.; Park, J.; Kim, J. Modeling Sleep Quality Depending on Objective Actigraphic Indicators Based on Machine Learning Methods. Int. J. Environ. Res. Public Health 2022, 19, 9890. https://doi.org/10.3390/ijerph19169890
Bitkina OV, Park J, Kim J. Modeling Sleep Quality Depending on Objective Actigraphic Indicators Based on Machine Learning Methods. International Journal of Environmental Research and Public Health. 2022; 19(16):9890. https://doi.org/10.3390/ijerph19169890
Chicago/Turabian StyleBitkina, Olga Vl., Jaehyun Park, and Jungyoon Kim. 2022. "Modeling Sleep Quality Depending on Objective Actigraphic Indicators Based on Machine Learning Methods" International Journal of Environmental Research and Public Health 19, no. 16: 9890. https://doi.org/10.3390/ijerph19169890