
Using Generic and Disease-Specific Measures to Assess Quality of Life before and after 12 Months of Hearing Implant Use: A Prospective, Longitudinal, Multicenter, Observational Clinical Study

 ,
,  , , , , ,
Abstract
:1. Introduction
2. Materials and Methods
2.1. Participants I: Inclusion and Exclusion Criteria
2.2. Participants II: Study Size Calculation
2.3. Assessments and Intervals
2.3.1. Generic QoL
2.3.2. Disease-Specific QoL
2.3.3. Satisfaction with Audio Processor
2.3.4. Audio Processor Daily Use
2.3.5. Speech Understanding
2.4. Bias
2.5. Safety and Adverse Events
2.6. Statistics
3. Results
3.1. Participants
3.2. Assessments
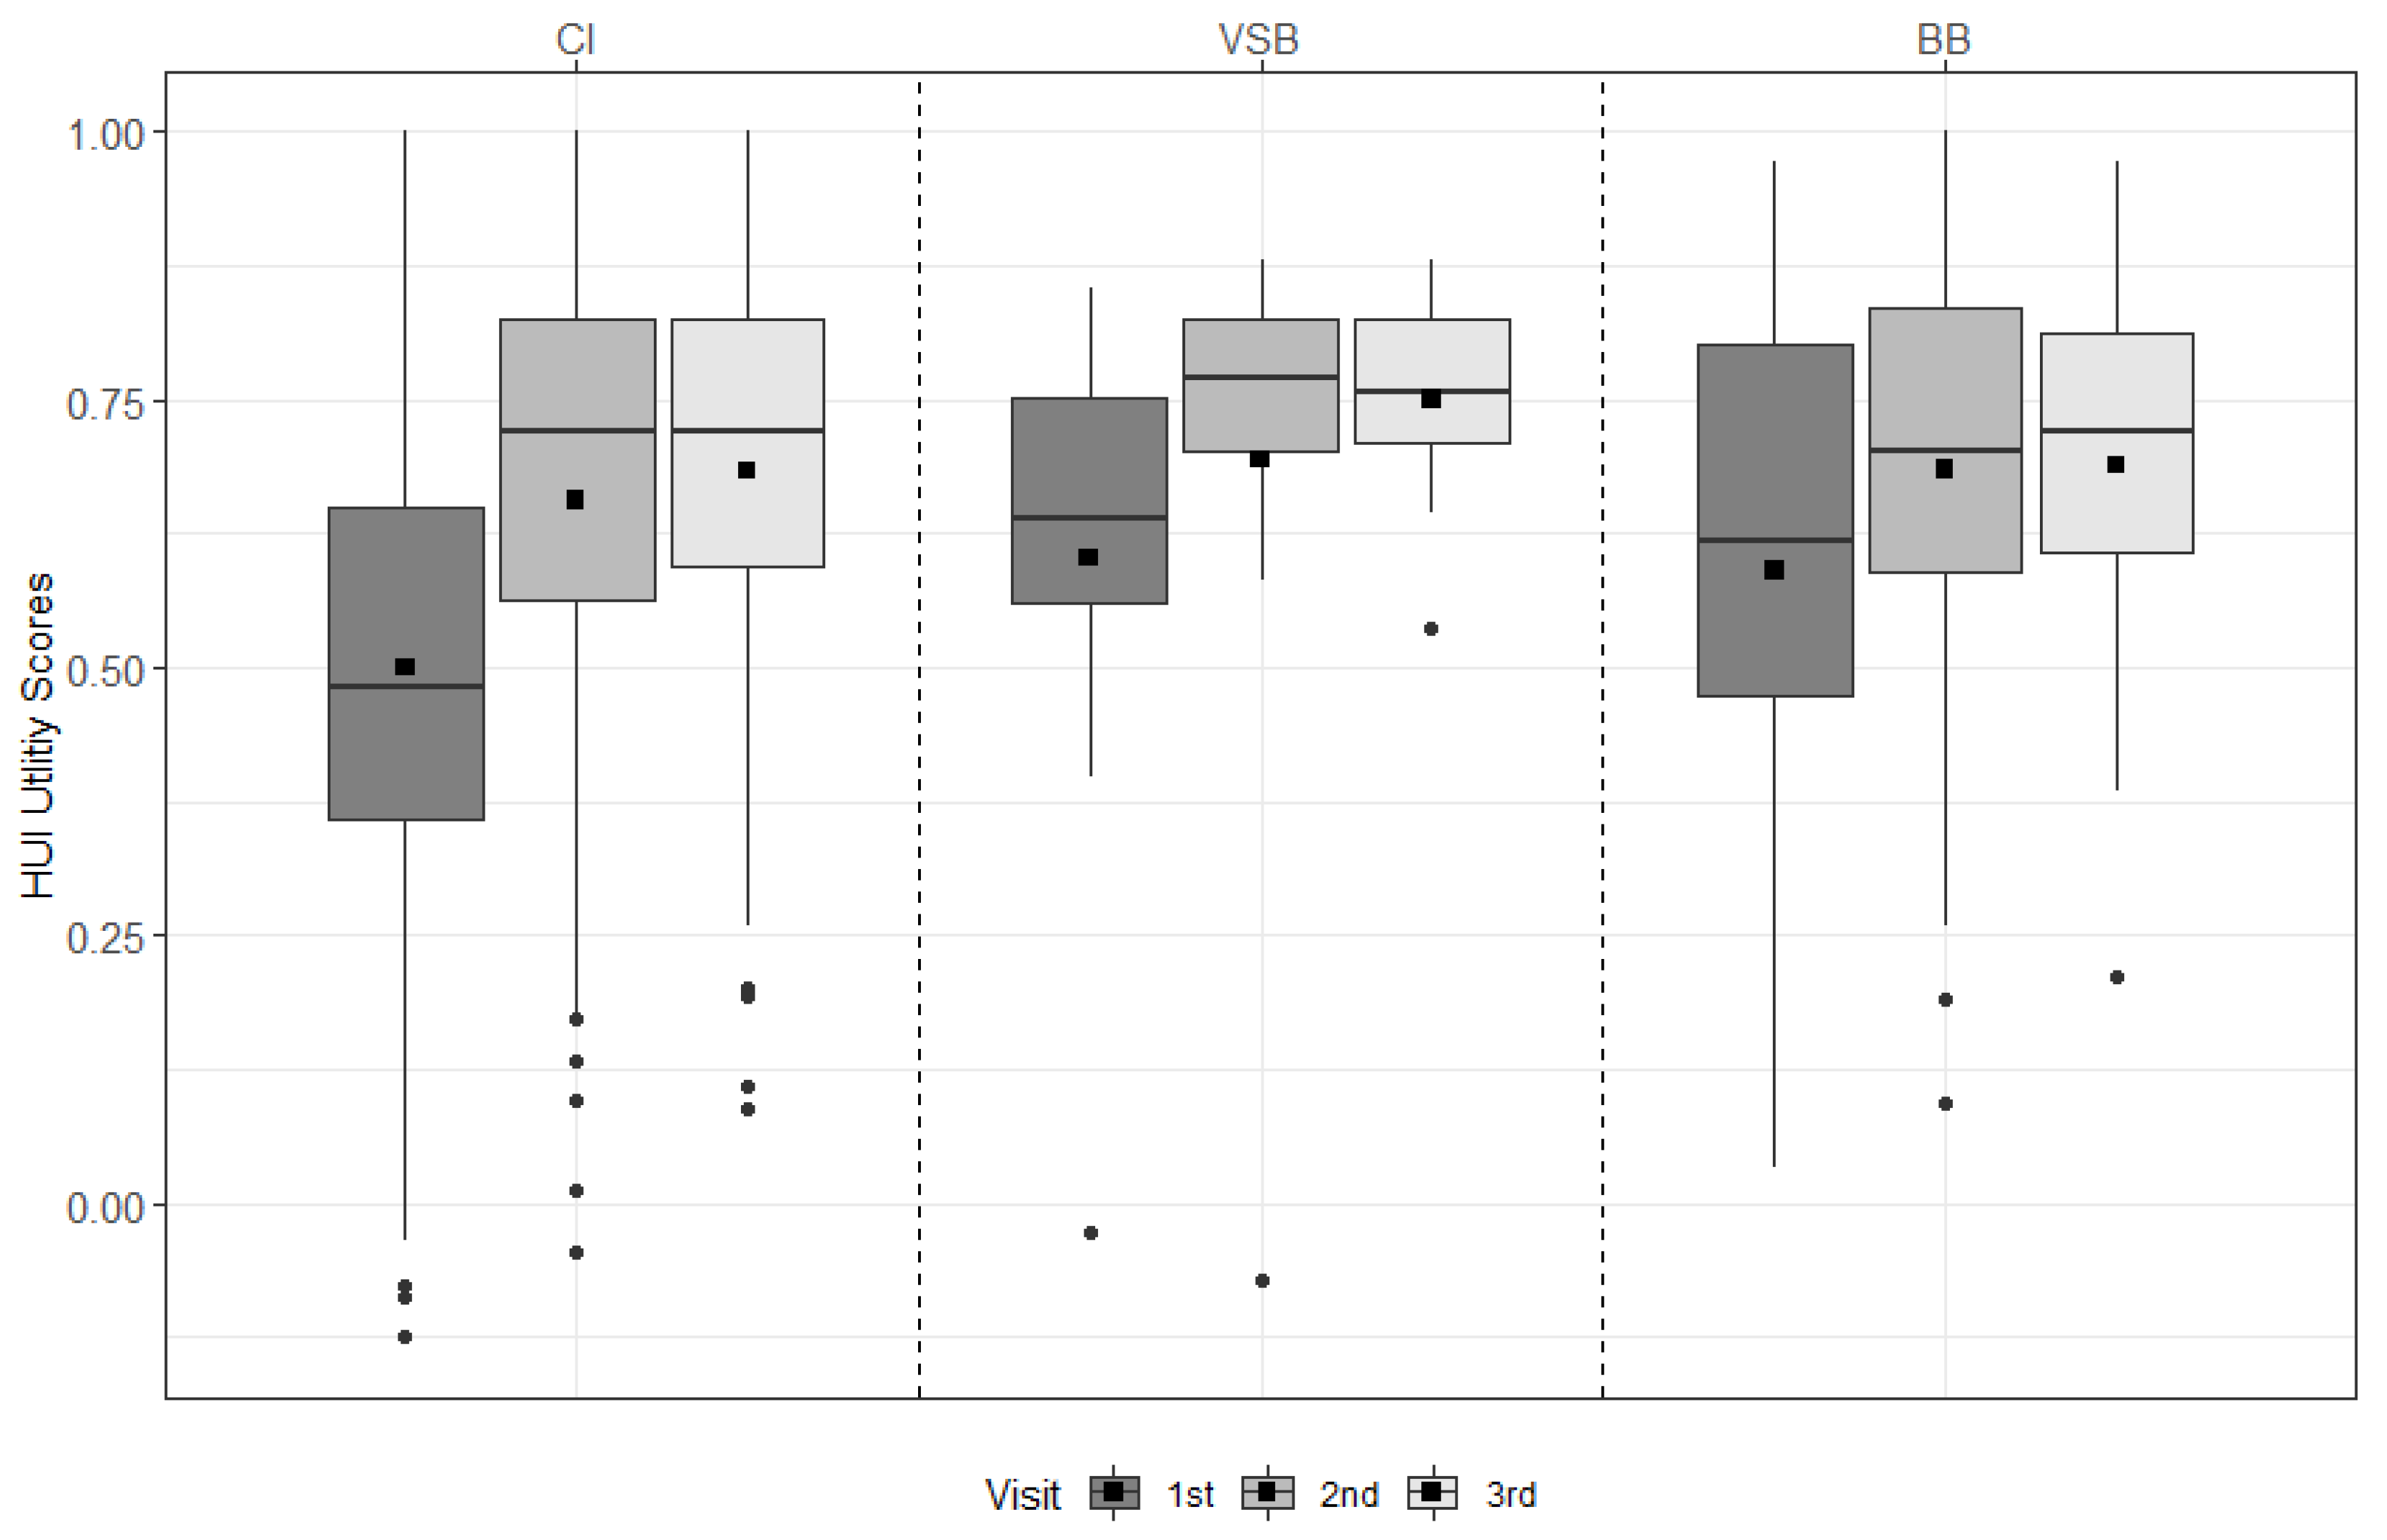
3.2.1. Generic QoL
HUI-3
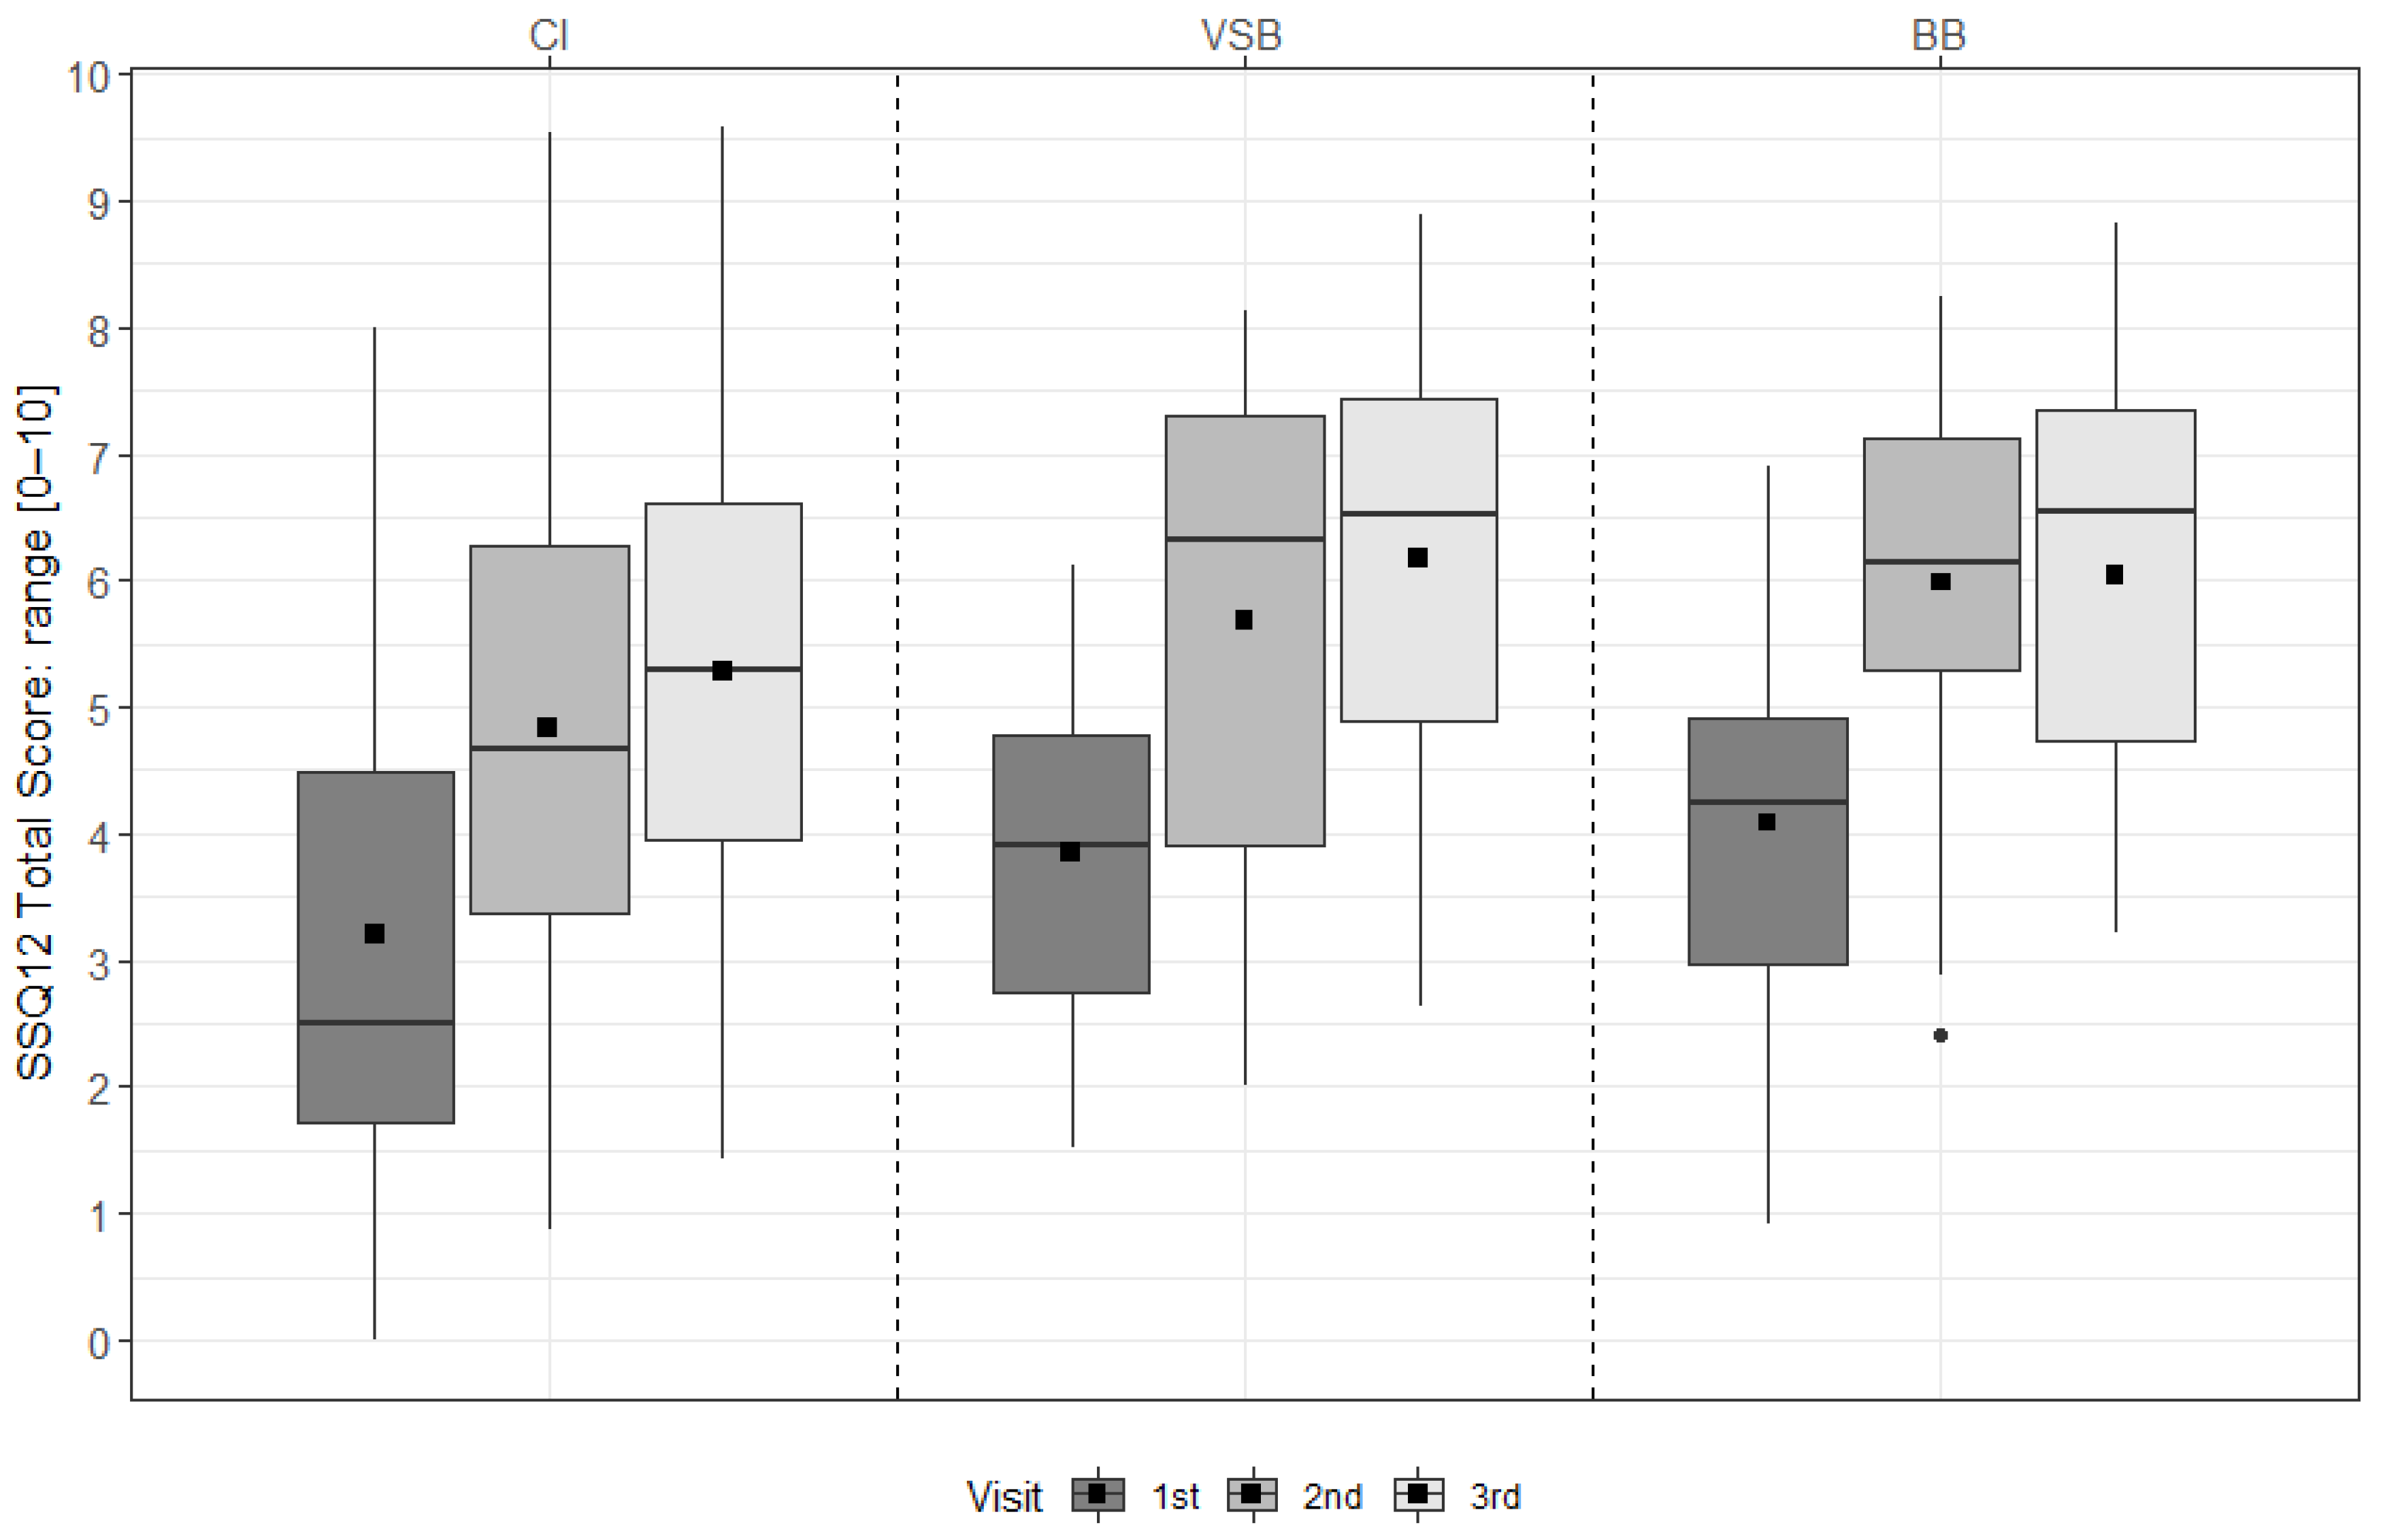
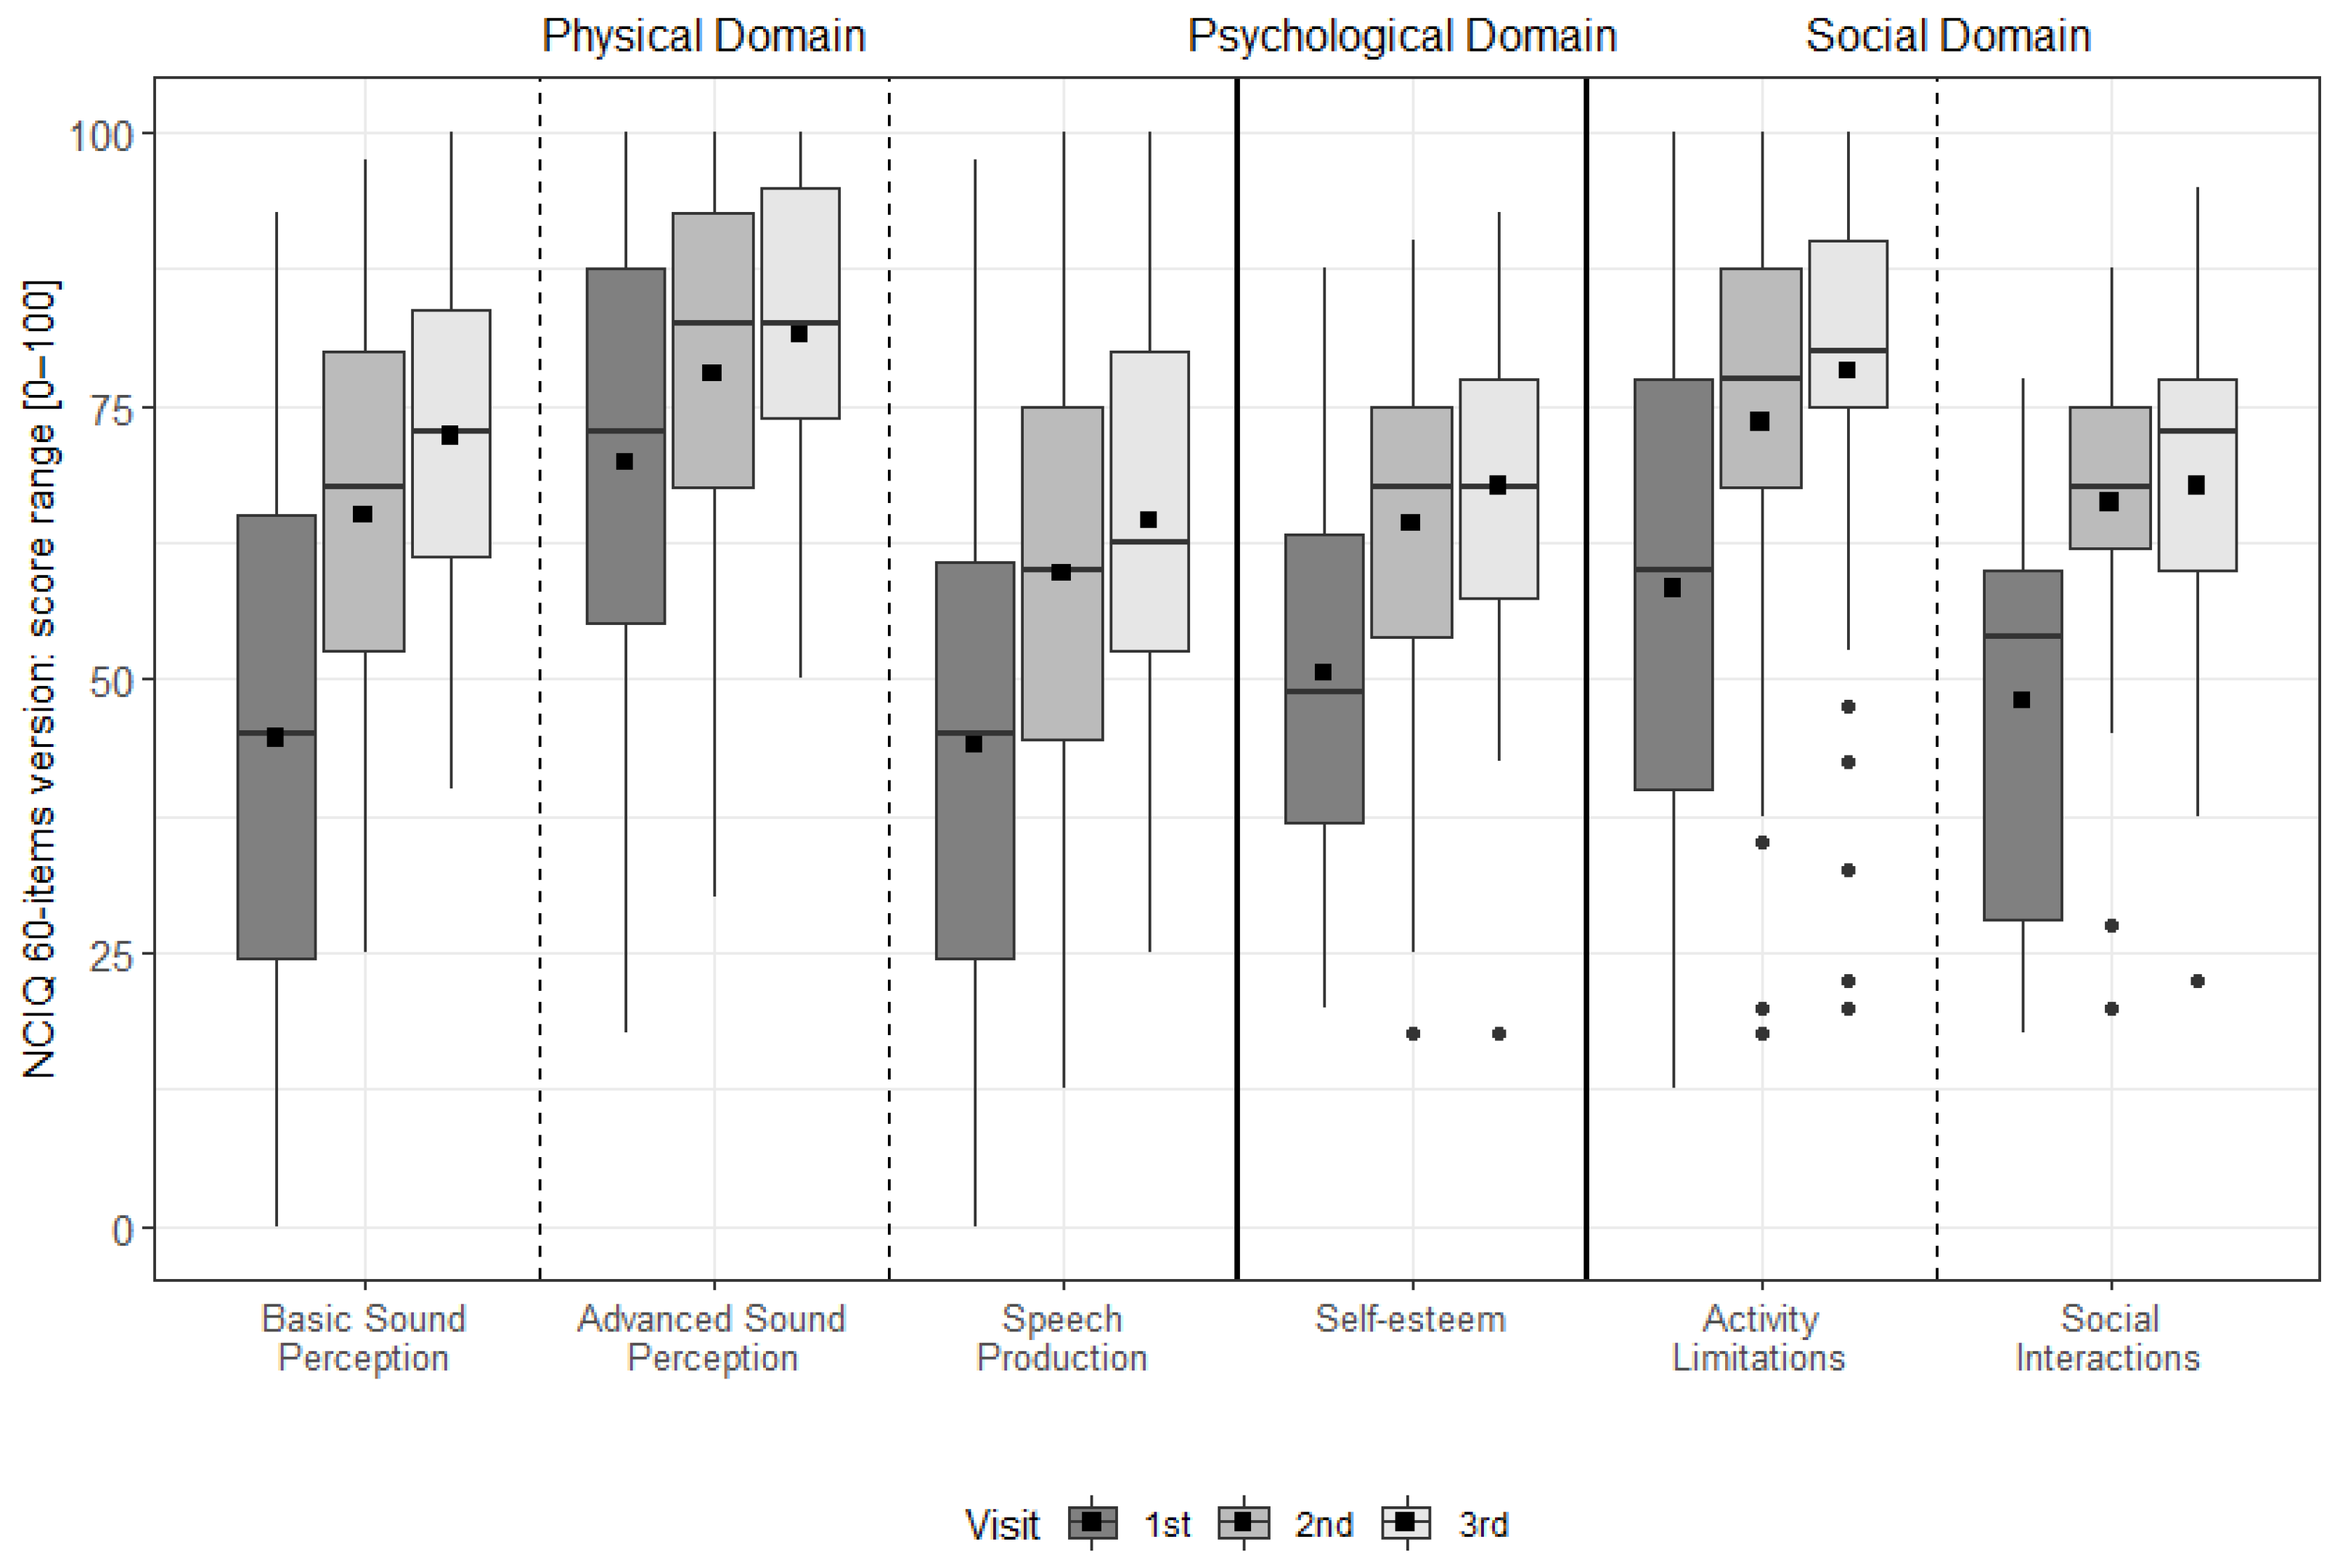
3.2.2. Disease-Specific QoL
SSQ12
NCIQ
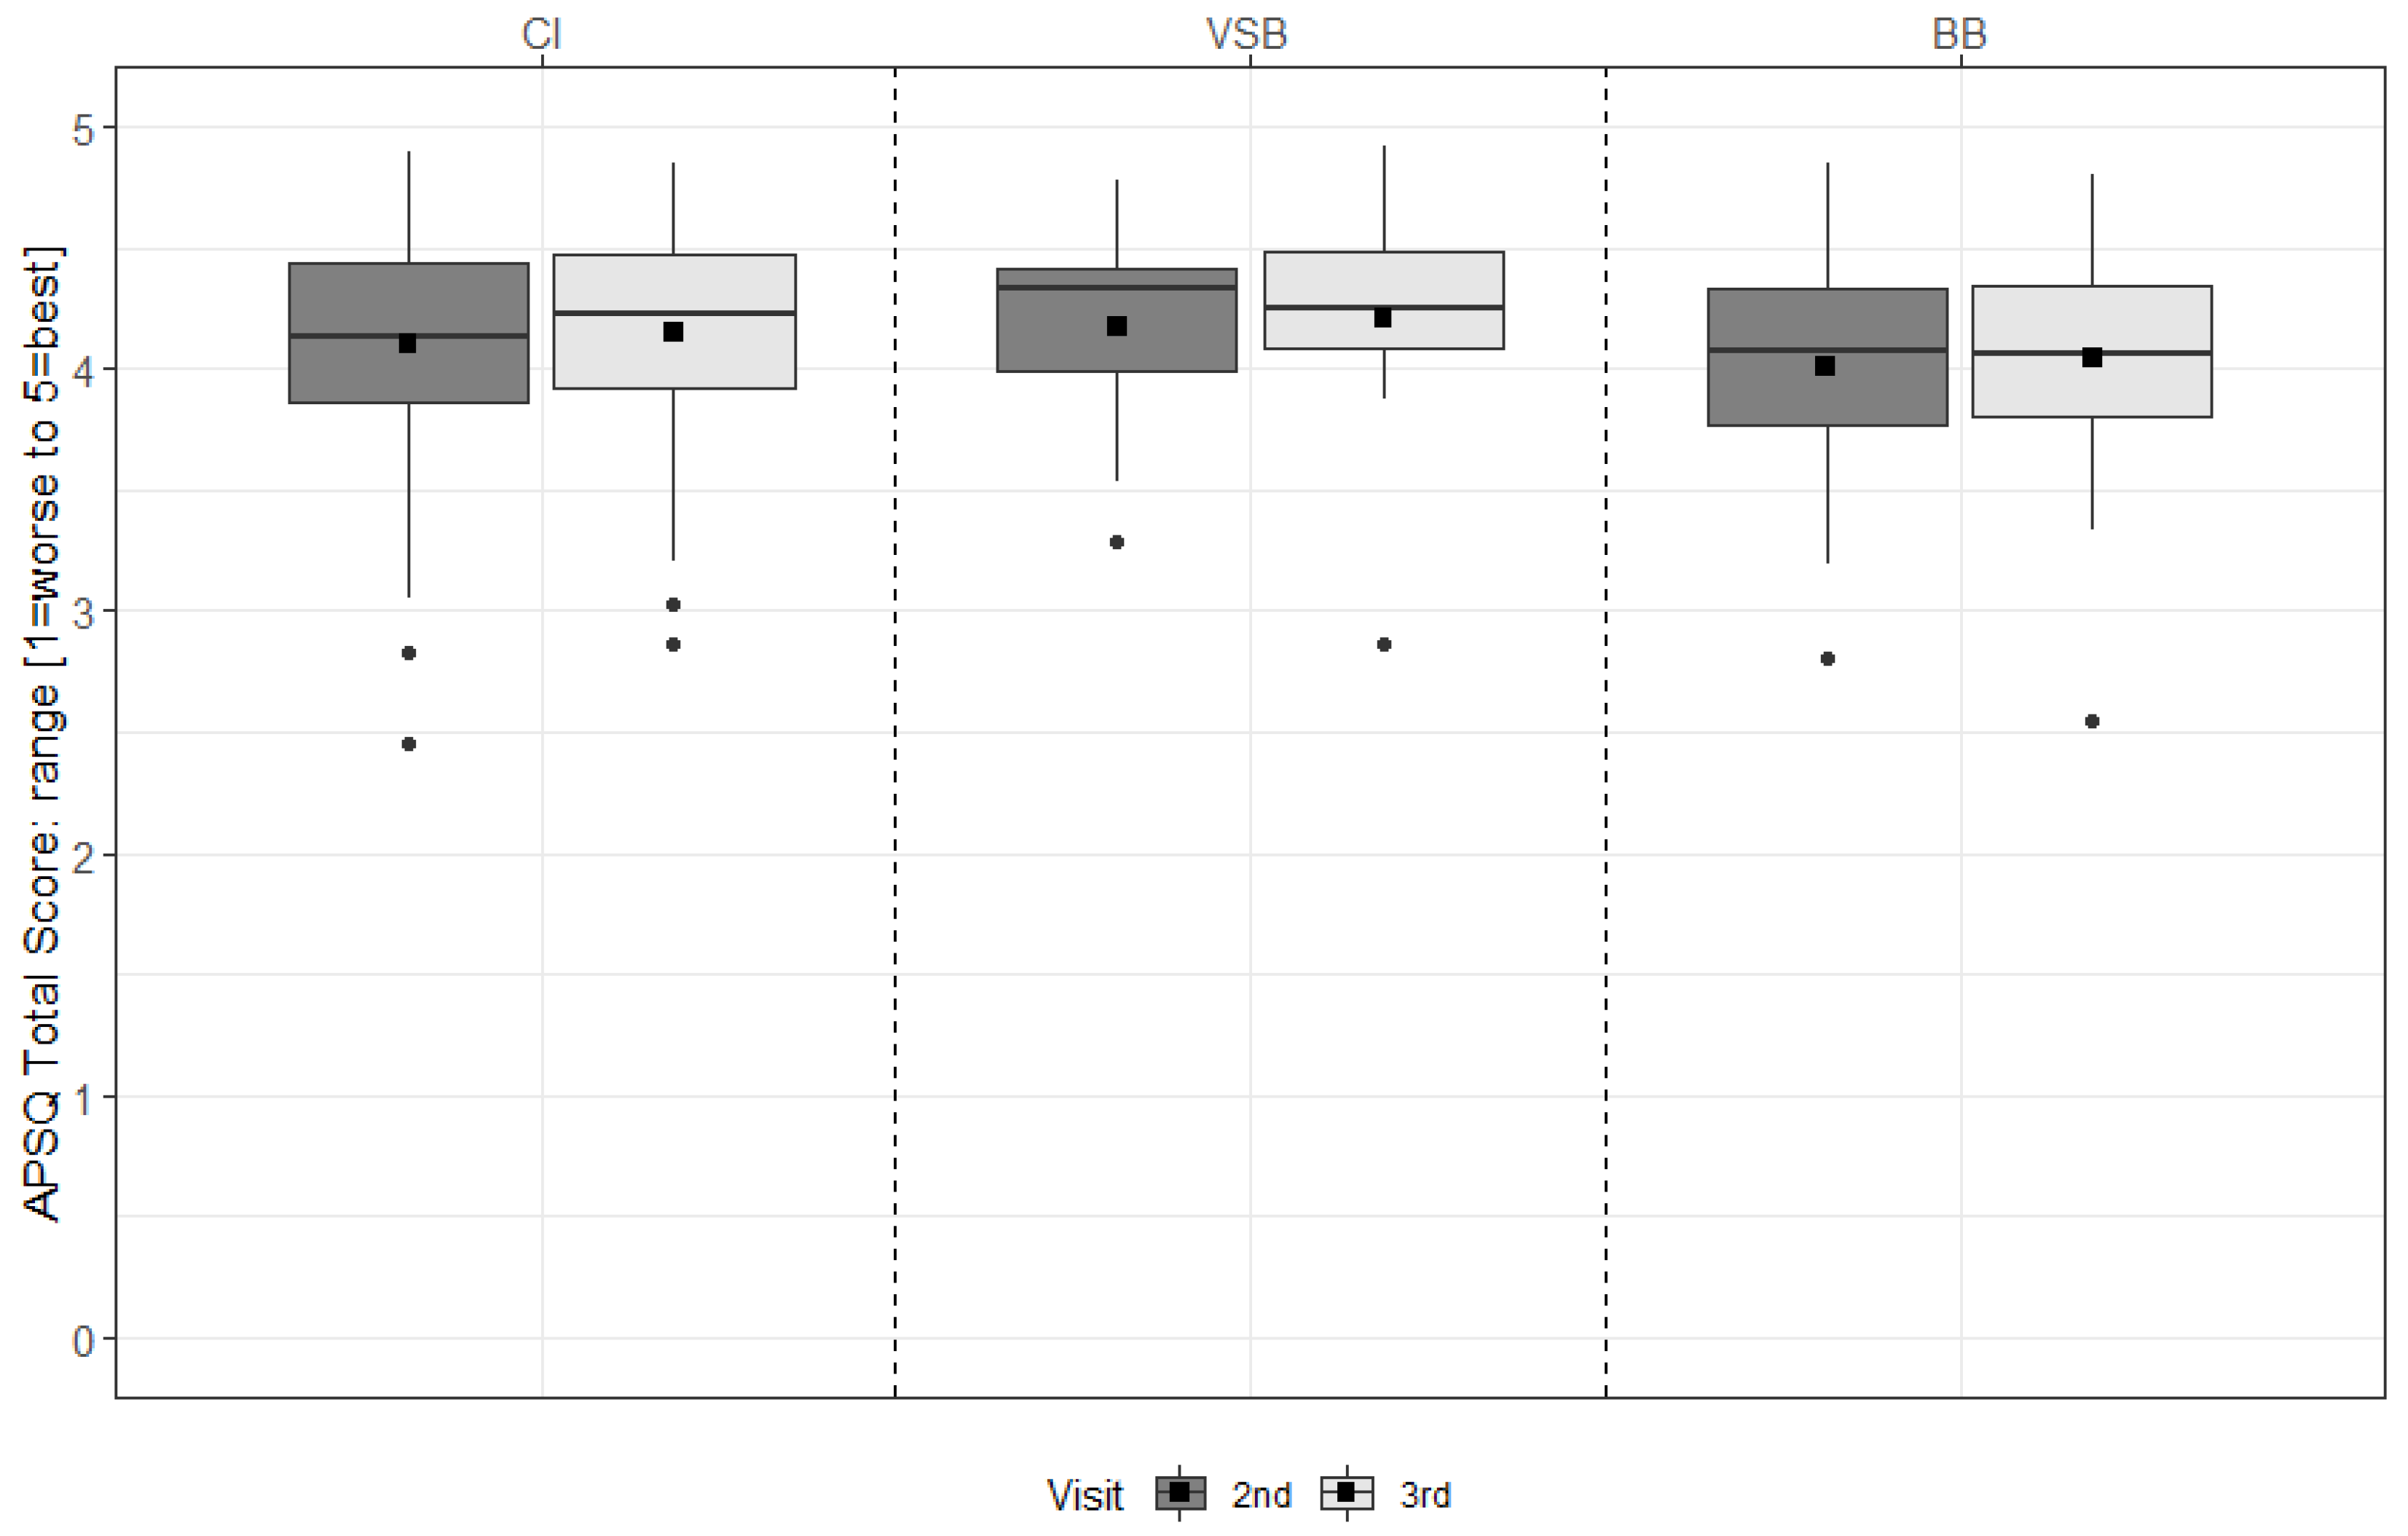
3.2.3. Satisfaction with Audio Processor
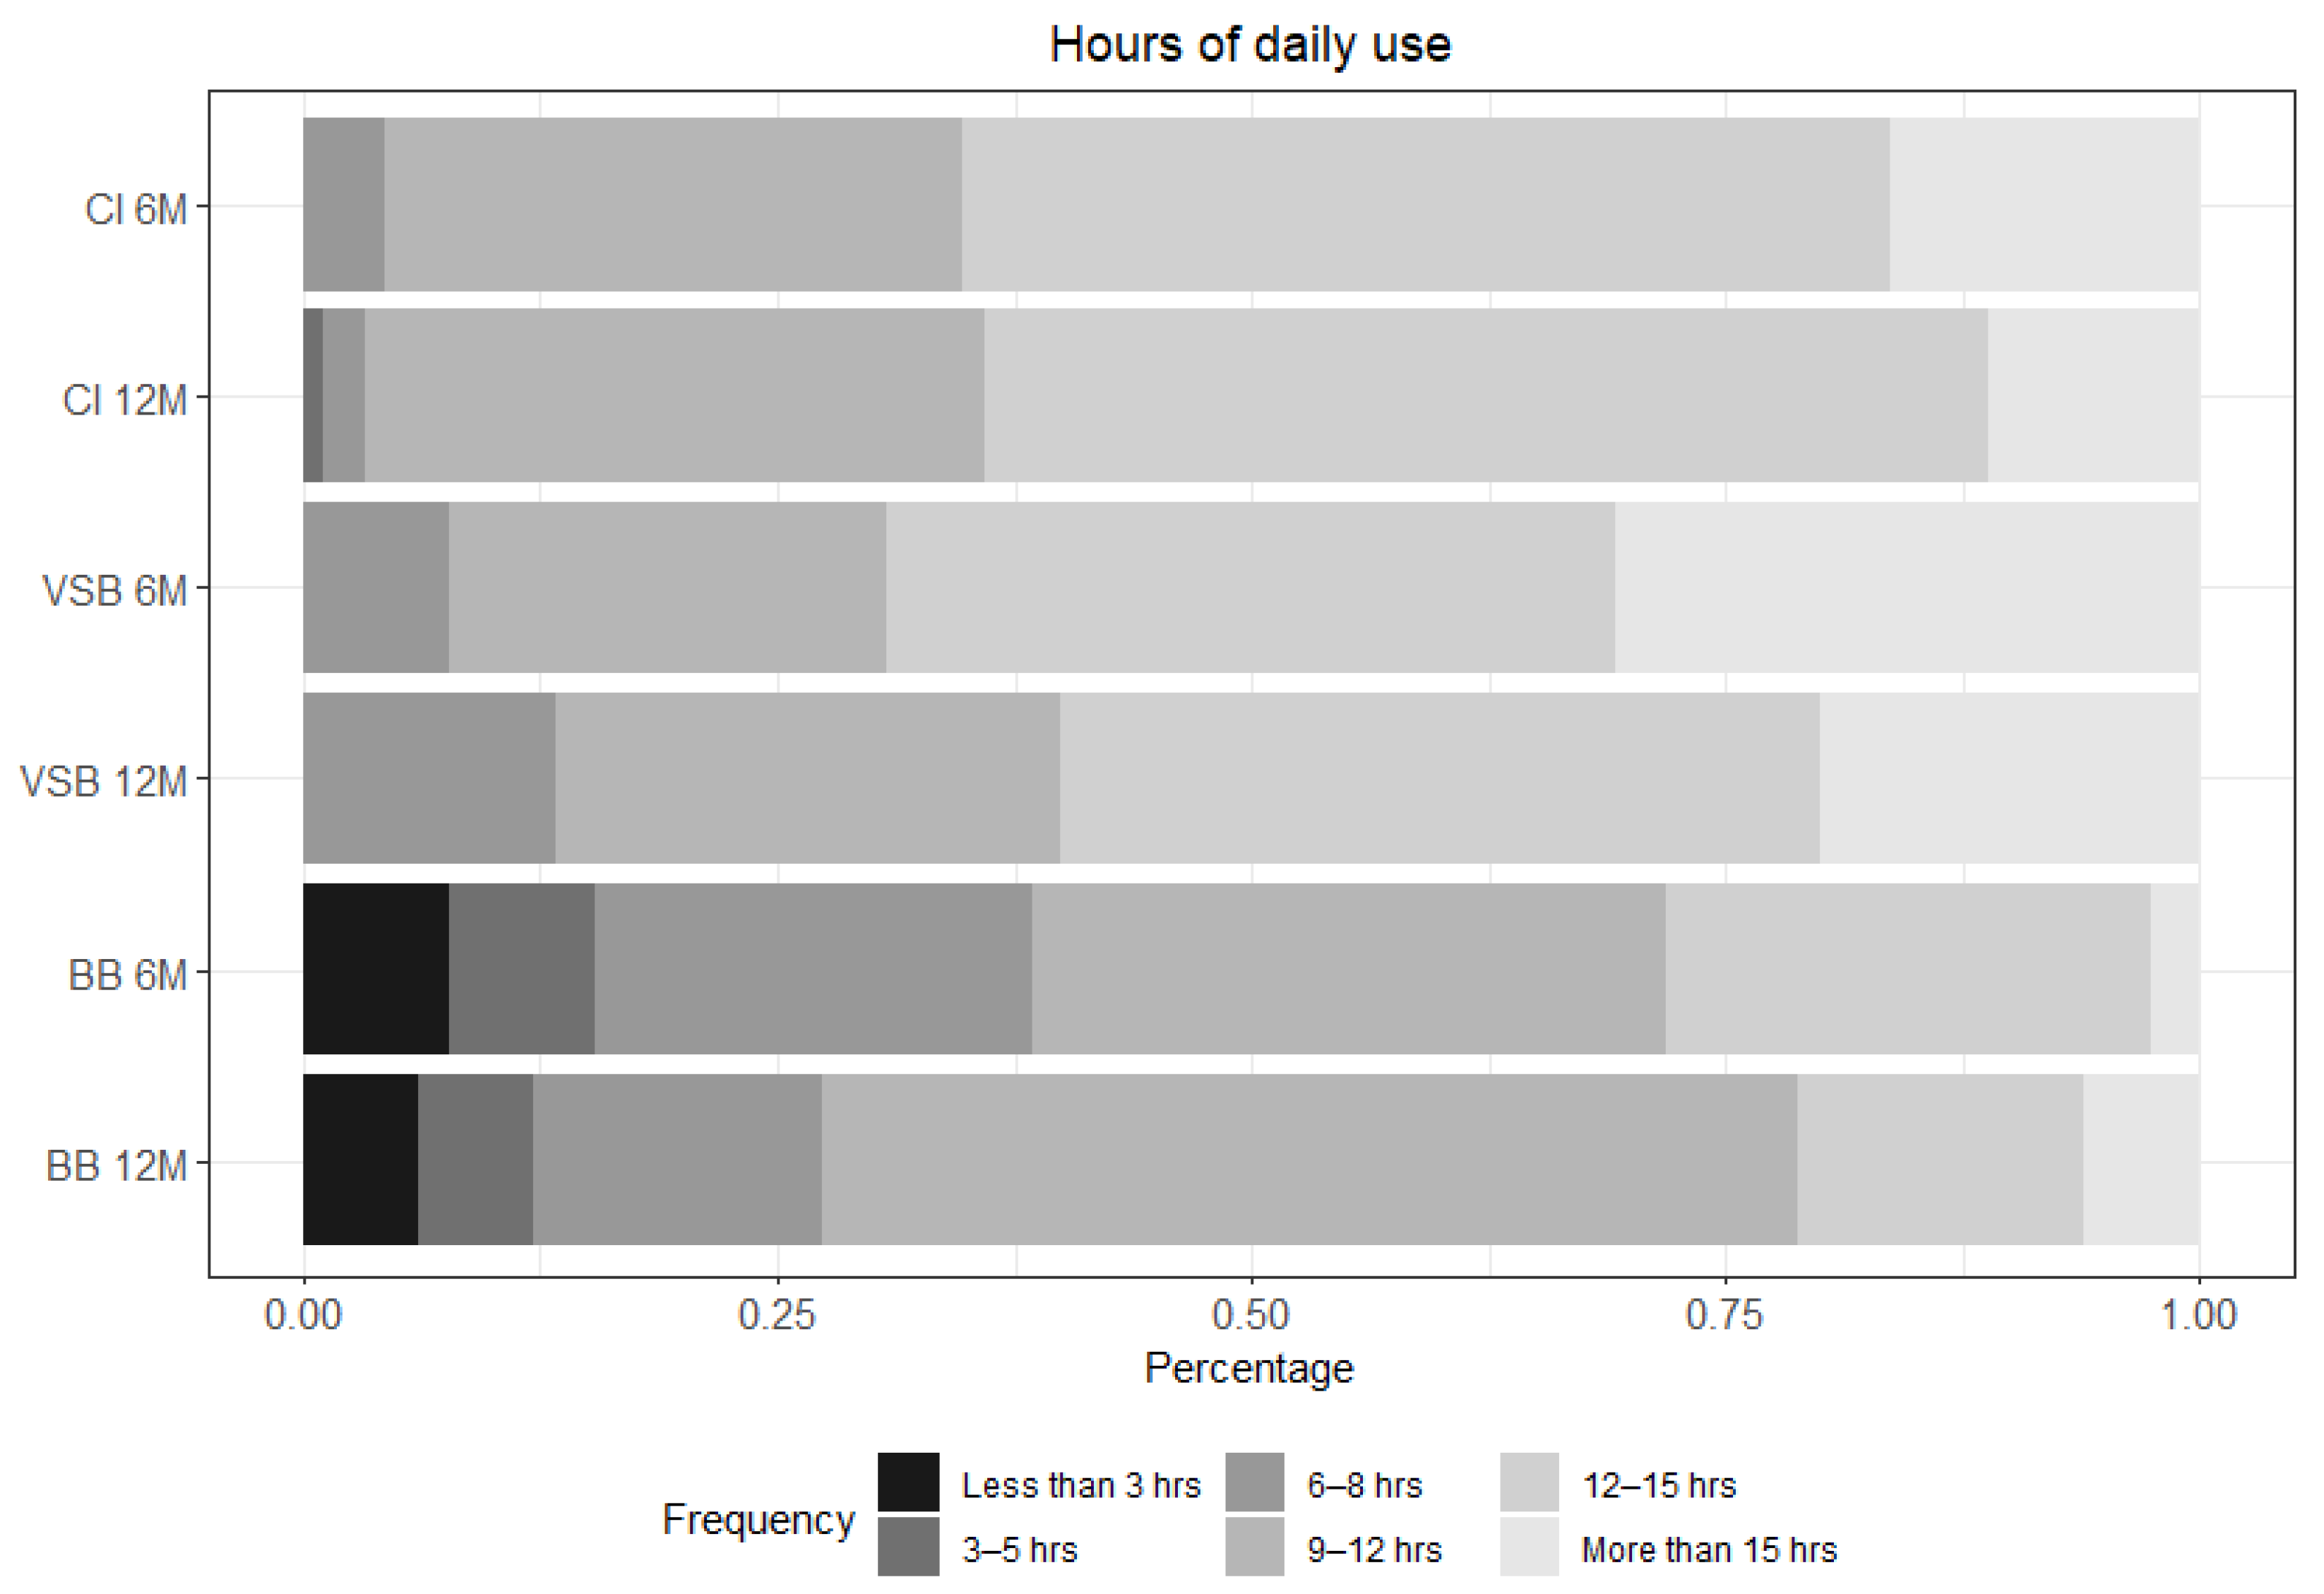
3.2.4. Daily Use of the Audio Processor
3.2.5. Speech Understanding
3.3. Correlations between Results
3.3.1. Disease-Specific and Generic Quality of Life Measures
3.3.2. Quality of Life and Device Satisfaction
3.3.3. Quality of Life and Speech Test Outcomes
3.4. Safety and Device- or Procedure-Related Adverse Events
4. Discussion
5. Conclusions
Supplementary Materials
Author Contributions
Funding
Institutional Review Board Statement
Informed Consent Statement
Data Availability Statement
Acknowledgments
Conflicts of Interest
References
- WHO Constitution. Available online: https://www.who.int/about/governance/constitution (accessed on 23 August 2021).
- Holch, P.; Absolom, K.; Brooke, C.; Wang, X. Advances in Patient Reported Outcomes: Integration and Innovation: Leeds, UK. 13 June 2019. J. Patient Rep. Outcomes 2020, 4 (Suppl. S1), 28. [Google Scholar]
- Mercieca-Bebber, R.; King, M.T.; Calvert, M.J.; Stockler, M.R.; Friedlander, M. The importance of patient-reported outcomes in clinical trials and strategies for future optimization. Patient Relat. Outcome Meas. 2018, 9, 353–367. [Google Scholar] [CrossRef] [PubMed] [Green Version]
- Rivera, S.C.; Kyte, D.G.; Aiyegbusi, O.L.; Slade, A.L.; McMullan, C.; Calvert, M.J. The impact of patient-reported outcome (PRO) data from clinical trials: A systematic review and critical analysis. Health Qual. Life Outcomes 2019, 17, 156. [Google Scholar] [CrossRef]
- Rudolph, C.; Petersen, G.S.; Pritzkuleit, R.; Storm, H.; Katalinic, A. The acceptance and applicability of a patient-reported experience measurement tool in oncological care: A descriptive feasibility study in northern Germany. BMC Health Serv. Res. 2019, 19, 786. [Google Scholar] [CrossRef] [PubMed]
- Dominick, K.L.; Ahern, F.M.; Gold, C.H.; Heller, D.A. Relationship of health-related quality of life to health care utilization and mortality among older adults. Aging Clin. Exp. Res. 2002, 14, 499–508. [Google Scholar] [CrossRef] [PubMed]
- Etschmair, M.; Gittings, K.; Ruban, C.; Papadopoulos, G.; McLaughlin, T. Integration of Patient-Reported Outcomes (PROs) and the Patient Voice: A Review of 6 Health Technology Assessment (HTA) Agencies. Available online: https://www.xcenda.com/insights/htaq-spring-2020-pro-patient-voice-hta (accessed on 18 February 2022).
- FDA. Value and Use of Patient-Reported Outcomes (Pros) in Assessing Effects of Medical Devices: Cdrh Strategic Priorities 2016–2017. Available online: https://www.fda.gov/files/about%20fda/published/Value-and-Use-of-Patient-Reported-Outcomes-%28PROs%29-in-Assessing-Effects-of-Medical-Devices.pdf (accessed on 23 August 2021).
- Weszl, M.; Rencz, F.; Brodszky, V. Is the trend of increasing use of patient-reported outcome measures in medical device studies the sign of shift towards value-based purchasing in Europe? Eur. J. Health Econ. 2019, 20 (Suppl. S1), 133–140. [Google Scholar] [CrossRef] [PubMed] [Green Version]
- Häußler, S.M.; Knopke, S.; Wiltner, P.; Ketterer, M.; Gräbel, S.; Olze, H. Long-term Benefit of Unilateral Cochlear Implantation on Quality of Life and Speech Perception in Bilaterally Deafened Patients. Otol. Neurotol. 2019, 40, e430–e440. [Google Scholar]
- Hirschfelder, A.; Gräbel, S.; Olze, H. The impact of cochlear implantation on quality of life: The role of audiologic performance and variables. Otolaryngol. Head Neck Surg. 2008, 138, 357–362. [Google Scholar] [CrossRef]
- Capretta, N.R.; Moberly, A.C. Does quality of life depend on speech recognition performance for adult cochlear implant users? Laryngoscope 2016, 126, 699–706. [Google Scholar] [CrossRef]
- McRackan, T.R.; Hand, B.N.; Velozo, C.A.; Dubno, J.R. Association of Demographic and Hearing-Related Factors With Cochlear Implant-Related Quality of Life. JAMA Otolaryngol. Head Neck Surg. 2019, 145, 422–430. [Google Scholar] [CrossRef]
- Moberly, A.C.; Harris, M.S.; Boyce, L.; Vasil, K.; Wucinich, T.; Pisoni, D.B.; Baxter, J.; Ray, C.; Shafiro, V. Relating quality of life to outcomes and predictors in adult cochlear implant users: Are we measuring the right things? Laryngoscope 2018, 128, 959–966. [Google Scholar] [CrossRef] [Green Version]
- Nordvik, Ø.; Laugen Heggdal, P.O.; Brännström, J.; Vassbotn, F.; Aarstad, A.K.; Aarstad, H.J. Generic quality of life in persons with hearing loss: A systematic literature review. BMC Ear Nose Throat Disord. 2018, 18, 1. [Google Scholar] [CrossRef] [Green Version]
- Skarżyński, P.H.; Ratuszniak, A.; Król, B.; Kozieł, M.; Osińska, K.; Cywka, K.B.; Sztabnicka, A.; Skarżyński, H. The Bonebridge in Adults with Mixed and Conductive Hearing Loss: Audiological and Quality of Life Outcomes. Audiol. Neurootol. 2019, 24, 90–99. [Google Scholar] [CrossRef]
- Czerniejewska-Wolska, H.; Kałos, M.; Gawłowska, M.; Sekula, A.; Mickiewicz, P.; Wiskirska-Woźnica, B.; Karlik, M. Evaluation of quality of life in patients after cochlear implantation surgery in 2014–2017. Otolaryngol. Pol. 2019, 73, 11–17. [Google Scholar] [CrossRef]
- Muigg, F.; Bliem, H.R.; Kühn, H.; Seebacher, J.; Holzner, B.; Weichbold, V.W. Cochlear implantation in adults with single-sided deafness: Generic and disease-specific long-term quality of life. Eur. Arch. Otorhinolaryngol. 2020, 277, 695–704. [Google Scholar] [CrossRef]
- Summerfield, A.Q.; Barton, G.R. Sensitivity of EQ-5D-3L, HUI2, HUI3, and SF-6D to changes in speech reception and tinnitus associated with cochlear implantation. Qual. Life Res. 2019, 28, 1145–1154. [Google Scholar] [CrossRef] [Green Version]
- Plath, M.; Marienfeld, T.; Sand, M.; van de Weyer, P.S.; Praetorius, M.; Plinkert, P.K.; Baumann, I.; Zaoui, K. Prospective study on health-related quality of life in patients before and after cochlear implantation. Eur. Arch. Otorhinolaryngol. 2022, 279, 115–125. [Google Scholar] [CrossRef]
- Brodie, A.; Smith, B.; Ray, J. The impact of rehabilitation on quality of life after hearing loss: A systematic review. Eur. Arch. Otorhinolaryngol. 2018, 275, 2435–2440. [Google Scholar] [CrossRef]
- Arnoldner, C.; Lin, V.Y.; Bresler, R.; Kaider, A.; Kuthubutheen, J.; Shipp, D.; Chen, J.M. Quality of life in cochlear implantees: Comparing utility values obtained through the Medical Outcome Study Short-Form Survey-6D and the Health Utility Index Mark 3. Laryngoscope 2014, 124, 2586–2590. [Google Scholar] [CrossRef]
- Edfeldt, L.; Strömbäck, K.; Grendin, J.; Bunne, M.; Harder, H.; Peebo, M.; EegOlofsson, M.; Petersson, C.M.; Konradsson, K. Evaluation of cost-utility in middle ear implantation in the ‘Nordic School’: A multicenter study in Sweden and Norway. Cochlear Implant. Int. 2014, 15 (Suppl. S1), S65–S67. [Google Scholar] [CrossRef]
- Faul, F.; Erdfelder, E.; Lang, A.G.; Buchner, A. G*Power 3: A flexible statistical power analysis program for the social, behavioral, and biomedical sciences. Behav. Res. Methods 2007, 39, 175–191. [Google Scholar] [CrossRef]
- Horsman, J.; Furlong, W.; Feeny, D.; Torrance, G. The Health Utilities Index (HUI): Concepts, measurement properties and applications. Health Qual. Life Outcomes 2003, 1, 54. [Google Scholar] [CrossRef] [Green Version]
- Noble, W.; Jensen, N.S.; Naylor, G.; Bhullar, N.; Akeroyd, M.A. A short form of the Speech, Spatial and Qualities of Hearing scale suitable for clinical use: The SSQ12. Int. J. Audiol. 2013, 52, 409–412. [Google Scholar] [CrossRef]
- Hinderink, J.B.; Krabbe, P.F.; Van Den Broek, P. Development and application of a health-related quality-of-life instrument for adults with cochlear implants: The Nijmegen cochlear implant questionnaire. Otolaryngol. Head Neck Surg. 2000, 123, 756–765, Corrigendum: 2017, 156, 391. [Google Scholar] [CrossRef]
- Billinger-Finke, M.; Bräcker, T.; Weber, A.; Amann, E.; Anderson, I.; Batsoulis, C. Development and validation of the audio processor satisfaction questionnaire (APSQ) for hearing implant users. Int. J. Audiol. 2020, 59, 392–397. [Google Scholar] [CrossRef]
- Magele, A.; Schoerg, P.; Stanek, B.; Gradl, B.; Sprinzl, G.M. Active transcutaneous bone conduction hearing implants: Systematic review and meta-analysis. PLoS ONE 2019, 14, e0221484. [Google Scholar] [CrossRef] [Green Version]
- McRackan, T.R.; Hand, B.N.; Velozo, C.A.; Dubno, J.R. Validity and reliability of the Cochlear Implant Quality of Life (CIQOL)-35 Profile and CIQOL-10 Global instruments in comparison to legacy instruments. Ear Hear. 2021, 42, 896–908. [Google Scholar] [CrossRef]
- Ramakers, G.G.; Smulders, Y.E.; van Zon, A.; Kraaijenga, V.J.; Stegeman, I.; Van Zanten, G.A.; Grolman, W. Agreement between health utility instruments in cochlear implantation. Clin. Otolaryngol. 2016, 41, 737–743. [Google Scholar] [CrossRef]
- Sprinzl, G.M.; Wolf-Magele, A. The Bonebridge Bone Conduction Hearing Implant: Indication criteria, surgery and a systematic review of the literature. Clin. Otolaryngol. 2016, 41, 131–143. [Google Scholar] [CrossRef]
- Ball, G.R.; Rose-Eichberger, K. Design and development of the VIBRANT SOUNDBRIDGE—A 25-year perspective. J. Hear. Sci. 2021, 11, 9–20. [Google Scholar]
- Ramos Macías, A.; Falcón-González, J.C.; Manrique Rodríguez, M.; Morera Pérez, C.; García-Ibáñez, L.; Cenjor Español, C.; Coudert-Koall, C.; Killian, M. One-Year Results for Patients with Unilateral Hearing Loss and Accompanying Severe Tinnitus and Hyperacusis Treated with a Cochlear Implant. Audiol. Neurootol. 2018, 23, 8–19. [Google Scholar] [CrossRef] [PubMed]
- Richardson, J.; Iezzi, A.; Khan, M.A.; Maxwell, A. Validity and reliability of the Assessment of Quality of Life (AQoL)-8D multi-attribute utility instrument. Patient 2014, 7, 85–96. [Google Scholar] [CrossRef] [Green Version]
- Sarant, J.; Harris, D.; Busby, P.; Maruff, P.; Schembri, A.; Dowell, R.; Briggs, R. The Effect of Cochlear Implants on Cognitive Function in Older Adults: Initial Baseline and 18-Month Follow Up Results for a Prospective International Longitudinal Study. Front. Neurosci. 2019, 13, 789. [Google Scholar] [CrossRef] [Green Version]
- Ambert-Dahan, E.; Laouénan, C.; Lebredonchel, M.; Borel, S.; Carillo, C.; Bouccara, D.; Sterkers, O.; Ferrary, E.; Mosnier, I. Evaluation of the impact of hearing loss in adults: Validation of a quality of life questionnaire. Eur. Ann. Otorhinolaryngol. Head Neck Dis. 2018, 135, 25–31. [Google Scholar] [CrossRef] [PubMed]
- Finke, M.; Strauß-Schier, A.; Kludt, E.; Büchner, A.; Illg, A. Speech intelligibility and subjective benefit in single-sided deaf adults after cochlear implantation. Hear. Res. 2017, 348, 112–119. [Google Scholar] [CrossRef]


| Group | N | n | Age at Implantation (Years) | n | Duration of Deafness (Years) | CI | Audio Processor | Array |
|---|---|---|---|---|---|---|---|---|
| CI | 111 | 98 | 56.7 (16.8–85.8) | 79 | 20.3 (0–67) | SONATA = 37 SYNCHRONY = 22 SYNCHONRY PIN = 22 CONCERTO = 12 CONCERTO PIN = 5 data missing = 12 | SONNET = 65 RONDO = 14 SONNET EAS = 10 OPUS 2 = 9 data missing = 12 | FLEX28 = 57 FLEX24 = 23 STANDARD = 9 FLEX20 = 4 COMPRESSED = 3 MEDIUM = 1 FLEXSOFT = 1 data missing = 12 |
| VSB | 18 | 15 | 49.4 (20.0–74.2) | 11 | 18.7 (8–40) | n/a | SAMBA = 13 Amadé = 2 data missing = 4 | n/a |
| BB | 41 | 40 | 40.2 (14.8–73.7) | 25 | 18.4 (1–56) | n/a | SAMBA BB = 39 Amadé BB = 1 data missing = 1 | n/a |
Publisher’s Note: MDPI stays neutral with regard to jurisdictional claims in published maps and institutional affiliations. |
© 2022 by the authors. Licensee MDPI, Basel, Switzerland. This article is an open access article distributed under the terms and conditions of the Creative Commons Attribution (CC BY) license (https://creativecommons.org/licenses/by/4.0/).
Share and Cite
Lassaletta, L.; Calvino, M.; Sanchez-Cuadrado, I.; Skarzynski, P.H.; Cywka, K.B.; Czajka, N.; Kutyba, J.; Tavora-Vieira, D.; van de Heyning, P.; Mertens, G.; et al. Using Generic and Disease-Specific Measures to Assess Quality of Life before and after 12 Months of Hearing Implant Use: A Prospective, Longitudinal, Multicenter, Observational Clinical Study. Int. J. Environ. Res. Public Health 2022, 19, 2503. https://doi.org/10.3390/ijerph19052503
Lassaletta L, Calvino M, Sanchez-Cuadrado I, Skarzynski PH, Cywka KB, Czajka N, Kutyba J, Tavora-Vieira D, van de Heyning P, Mertens G, et al. Using Generic and Disease-Specific Measures to Assess Quality of Life before and after 12 Months of Hearing Implant Use: A Prospective, Longitudinal, Multicenter, Observational Clinical Study. International Journal of Environmental Research and Public Health. 2022; 19(5):2503. https://doi.org/10.3390/ijerph19052503
Chicago/Turabian StyleLassaletta, Luis, Miryam Calvino, Isabel Sanchez-Cuadrado, Piotr Henryk Skarzynski, Katarzyna B. Cywka, Natalia Czajka, Justyna Kutyba, Dayse Tavora-Vieira, Paul van de Heyning, Griet Mertens, and et al. 2022. "Using Generic and Disease-Specific Measures to Assess Quality of Life before and after 12 Months of Hearing Implant Use: A Prospective, Longitudinal, Multicenter, Observational Clinical Study" International Journal of Environmental Research and Public Health 19, no. 5: 2503. https://doi.org/10.3390/ijerph19052503