Validity and Reliability of the Satel 40 Hz Stabilometric Force Platform for Measuring Quiet Stance and Dynamic Standing Balance in Healthy Subjects

 , , , , and
Abstract
:1. Introduction
2. Materials and Methods
2.1. Study Design
2.2. Parameters
2.3. Data Analysis
2.4. Ethics Approval and Consent to Participate
3. Results
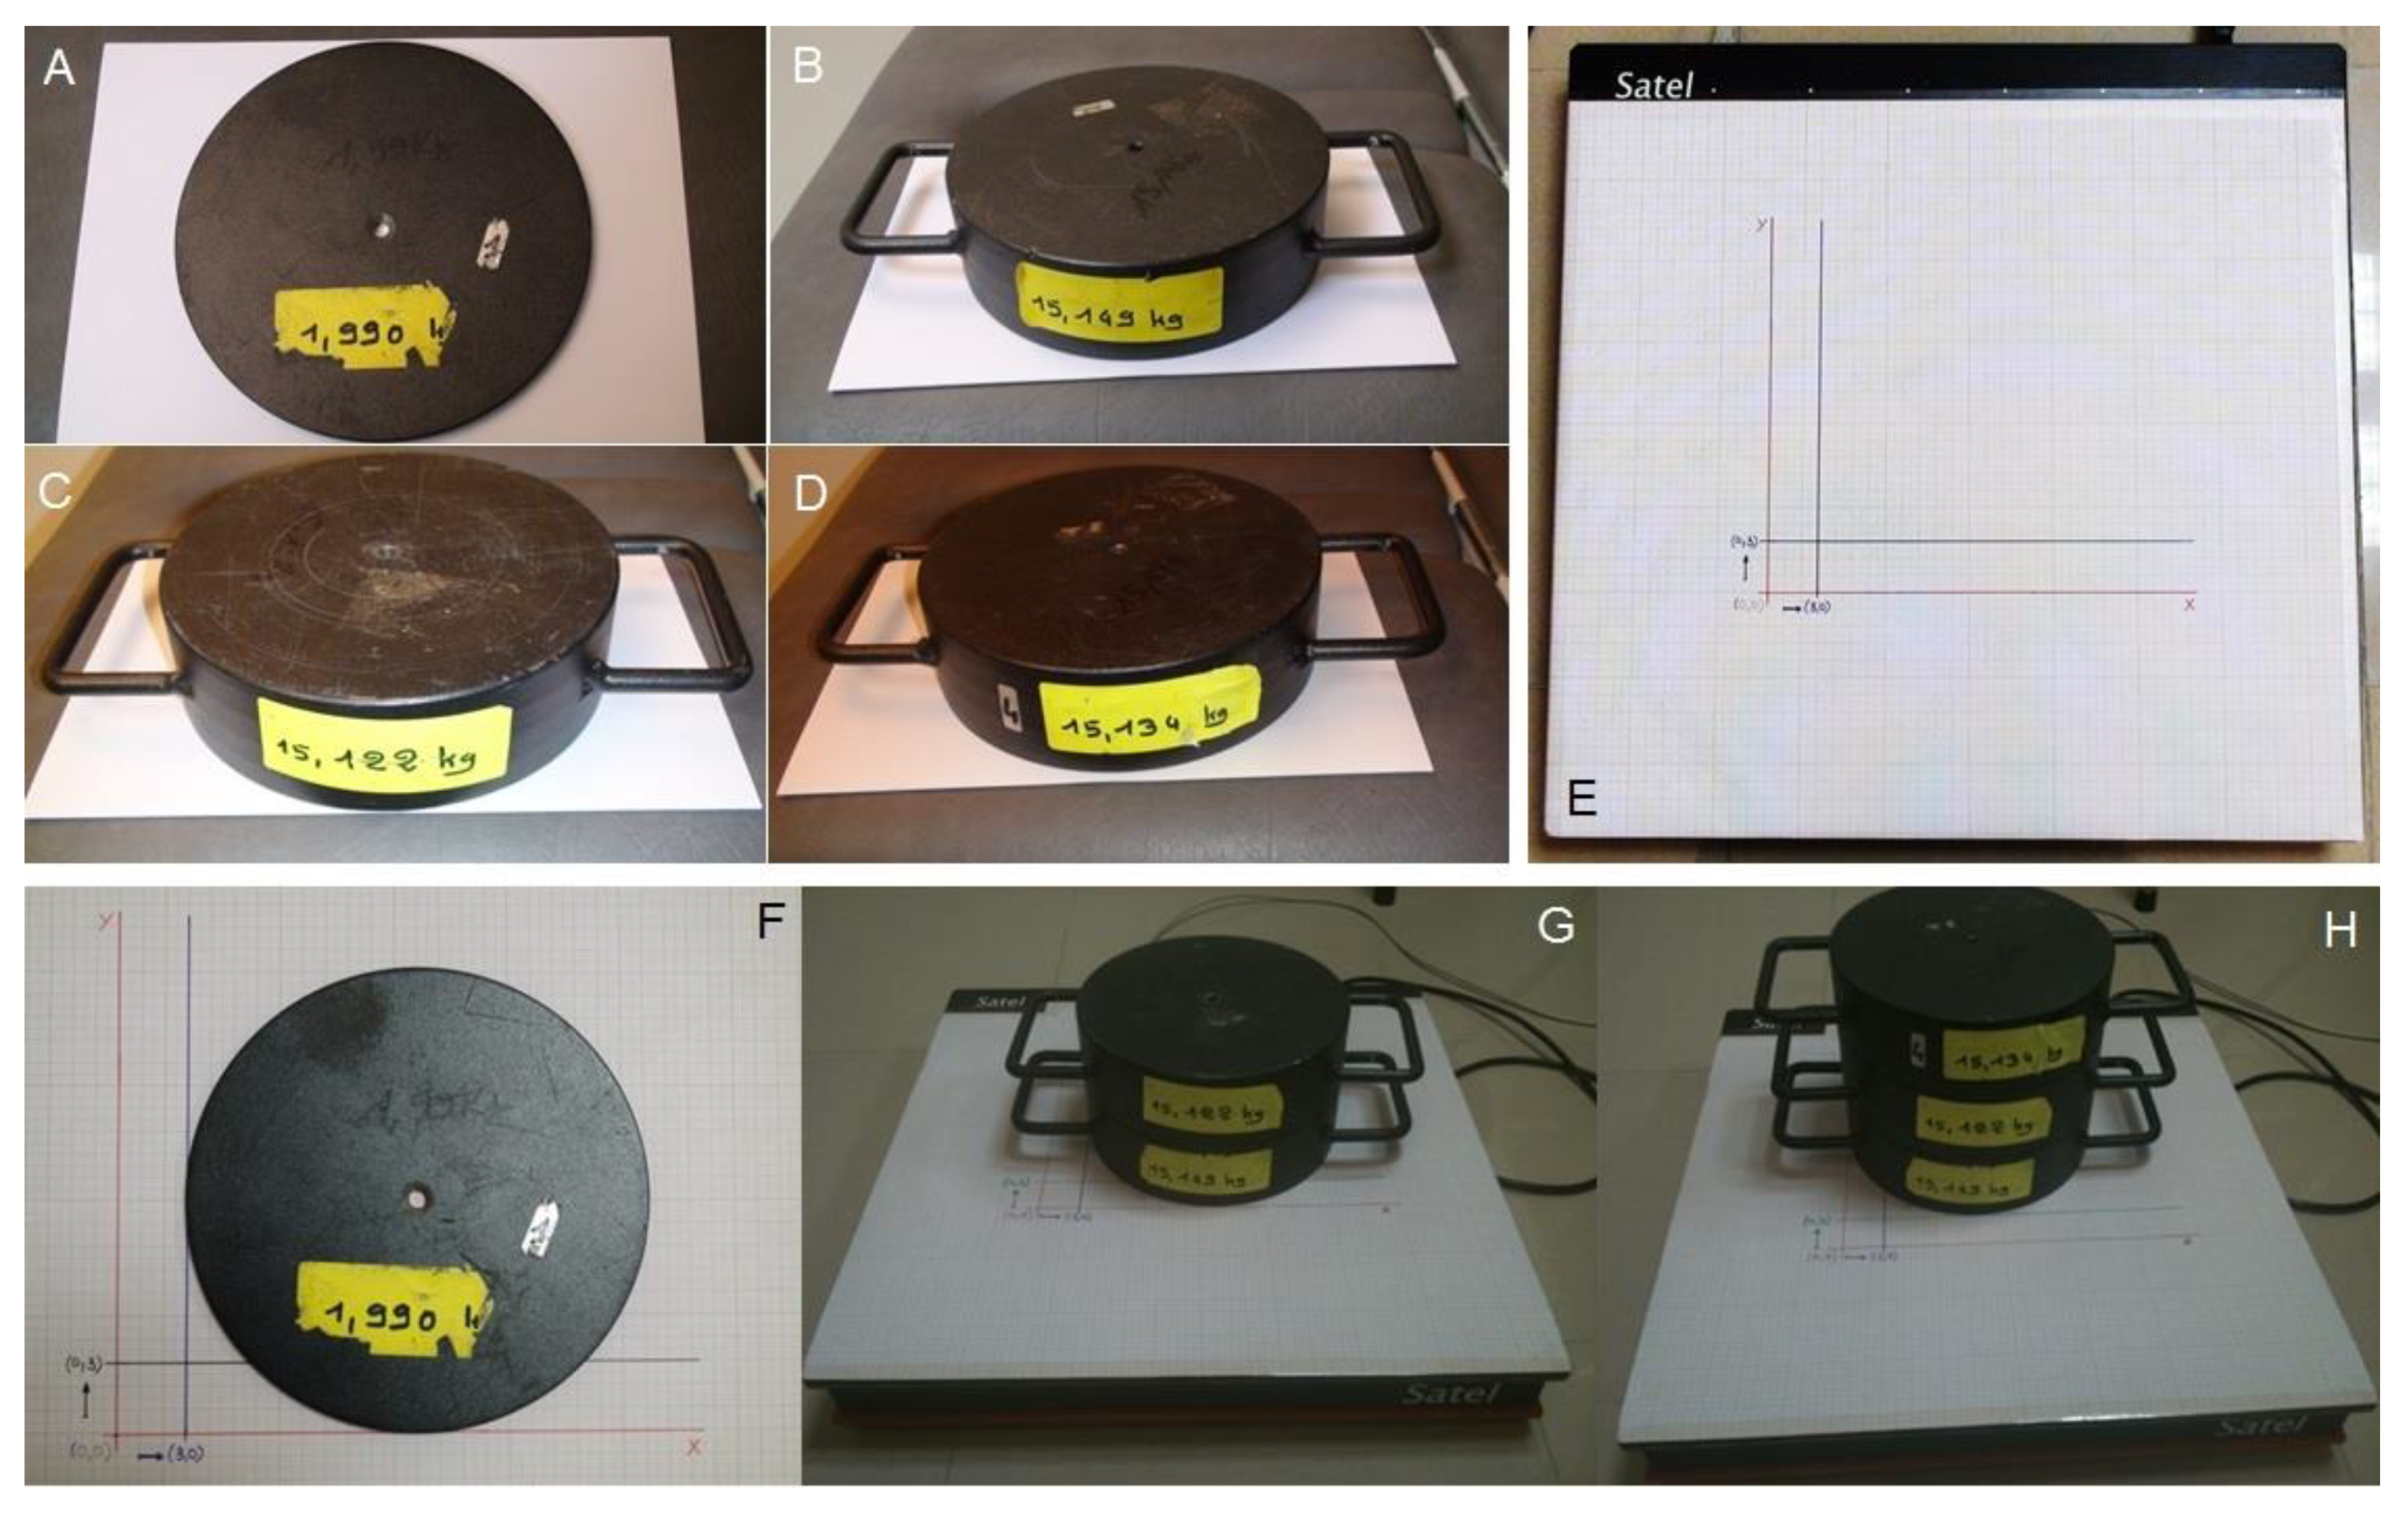
3.1. Validity
3.2. Reliability of Stabilometry of Posturographic Variables by Correlation and in Intra-Class Correlation Coefficient (ICC)
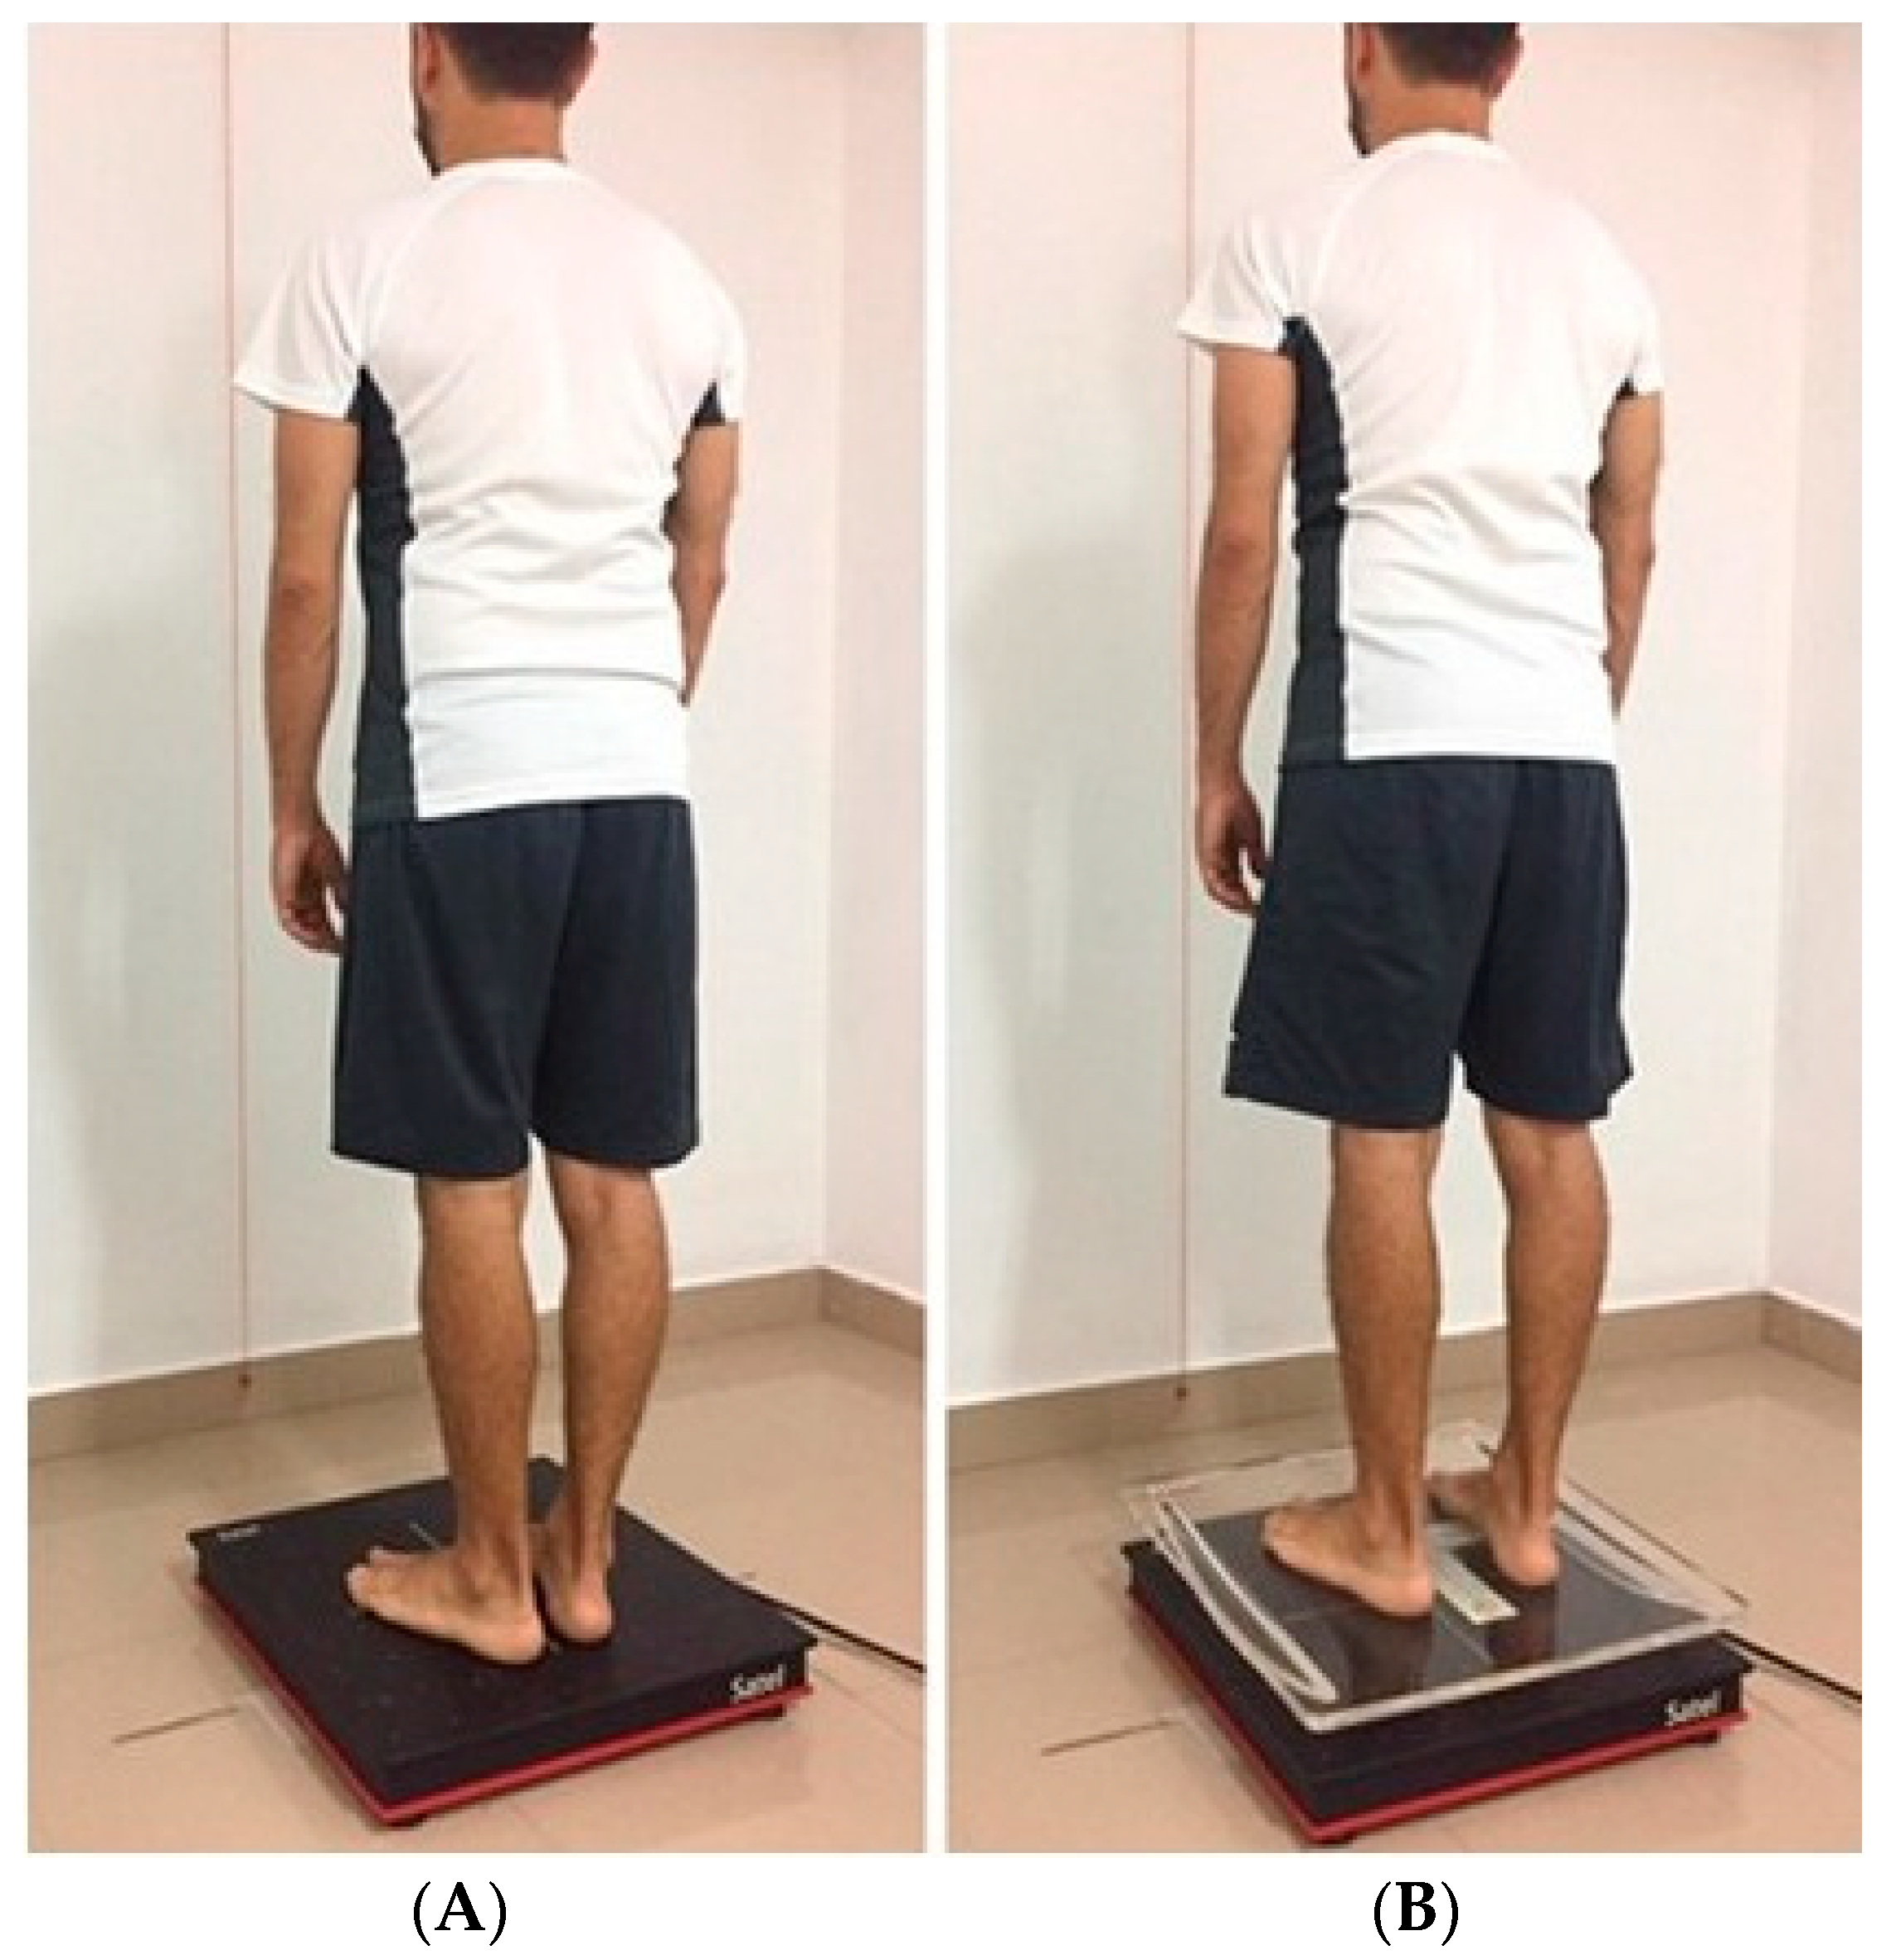
3.3. Static Measurement
3.4. Dynamic Measurement
4. Discussion
4.1. Validity
4.2. Reliability of Stabilometry
5. Conclusions
Author Contributions
Funding
Acknowledgments
Conflicts of Interest
Data Availability
Abbreviations
| CI | confidence interval |
| COP | center of pressure |
| DX | distance travelled of COP on the x-axis |
| DY | distance travelled of COP on the y-axis |
| Kg | kilograms |
| ICC | intraclass correlation coefficient |
| OE | open eyes |
| SD | standard deviation |
| Xm | mean displacement in the x-axis |
| Ym | mean displacement in the y-axis |
References
- Pavol, M.J. Detecting and understanding differences in postural sway. Focus on A new interpretation of spontaneous sway measures based on a simple model of human postural control. J. Neurophysiol. 2005, 93, 20–21. [Google Scholar] [CrossRef]
- Horak, F.B. Clinical measurement of postural control in adults. Phys. Ther. 1987, 67, 1881–1885. [Google Scholar] [CrossRef] [PubMed]
- Browne, J.; O’Hare, N. Review of the different methods for assessing standing balance. Physiotherapy 2001, 87, 489–495. [Google Scholar] [CrossRef] [Green Version]
- Baratto, L.; Morasso, P.G.; Re, C.; Spada, G. A new look at posturographic analysis in the clinical context: Sway-density versus other parameterization techniques. Motor Control 2002, 6, 246–270. [Google Scholar] [CrossRef] [PubMed]
- Duarte, M.; Freitas, S. Revision of posturo-graphy based on force plate for balance evaluation. Rev. Bras. Fisoter. 2010, 14, 183–192. [Google Scholar] [CrossRef] [Green Version]
- Reynard, F.; Christe, D.; Terrier, P. Postural control in healthy adults: Determinants of trunk sway assessed with a chest-worn accelerometer in 12 quiet standing tasks. PLoS ONE 2019, 14, e0211051. [Google Scholar] [CrossRef] [Green Version]
- Scoppa, F.; Capra, R.; Gallamini, M.; Shiffer, R. Clinical stabilometry standardization. Basic definitions- Acquisition interval-Sampling frequency. Gait Posture 2013, 37, 290–292. [Google Scholar] [CrossRef]
- Kapteyn, T.S.; Bles, W.; Njiokiktjien, Ç.J.; Kodde, L.; Massen, C.H.; Mol, J.M. Standardization in platform stabilometry being a part of posturography. Agressologie 1983, 24, 321–326. [Google Scholar]
- McGuine, T.A.; Greene, J.J.; Best, T.; Leverson, G. Balance as a predictor of ankle injuries in high school basketball players. Clin. J. Sport Med. 2000, 10, 239–244. [Google Scholar] [CrossRef]
- Loudon, J.K.; Reiman, M.P.; Sylvain, J. The efficacy of manual joint mobilisation/manipulation in treatment of lateral ankle sprains: A systematic review. Br. J. Sports Med. 2014, 48, 365–370. [Google Scholar] [CrossRef]
- Meli, A.; Aud, B.M.; Aud, S.T.; Aud, R.G.; Cristofari, E. Vestibular function after cochlear implant surgery. Cochlear Implant. Int. 2016, 17, 151–157. [Google Scholar] [CrossRef] [PubMed]
- Nacci, A.; Ferrazzi, M.; Berrettini, S.; Panicucci, E.; Matteucci, J.; Bruschini, L.; Ursino, F.; Fattori, B. Vestibular and stabilometric findings in whiplash injury and minor head trauma. Acta Otorhinolaryngol. Ital. 2011, 31, 378–389. [Google Scholar] [PubMed]
- Palano, D.; Molinari, G.; Cappelletto, M.; Guidetti, G.; Vernole, B. L’emploi de la stabilométrie assistée par ordinateur dans le diagnostic des troubles crânio-mandibulaires (TCM) [The use of computer-assisted stabilometry in the diagnosis of craniomandibular disorders]. Bull. Group Int. Rech. Sci. Stomatol. Odontol. 1994, 37, 19–22. [Google Scholar]
- Fukuda, T. The stepping test: Two phases of the labyrin¬thine reflex. Acta Otolaryngol. 1959, 50, 95–108. [Google Scholar] [CrossRef] [PubMed]
- Paquet, N.; Taillon-Hobson, A.; Lajoie, Y. Fukuda and Babinski-Weil tests: Within-subject variability and test-retest reliability in nondisabled adults. J. Rehabil. Res. Dev. 2014, 51, 1013–1022. [Google Scholar] [CrossRef] [PubMed]
- Lanska, D.J.; Goetz, C.G. Romberg’s sign: Development, adoption, and adaptation in the 19th century. Neurology 2000, 55, 1201–1206. [Google Scholar] [CrossRef]
- Levitan, M.N.; Crippa, J.A.; Bruno, L.M.; Pastore, D.L.; Freire, R.C.; Arrais, K.C.; Hallak, J.E.; Nardi1, A.E. Postural balance in patients with social anxiety disorder. Braz. J. Med. Biol. Res. 2012, 45, 38–42. [Google Scholar] [CrossRef] [Green Version]
- Kamieniarz, A.; Michalska, J.; Brachman, A.; Pawłowski, M.; Słomka, K.J.; Juras, G. A posturographic procedure assessing balance disorders in Parkinson’s disease: A systematic review. Clin. Interv. Aging 2018, 12, 2301–2306. [Google Scholar] [CrossRef] [Green Version]
- Kubo, T.; Sakata, Y.; Matsunaga, T.; Koshimune, A.; Sakai, S.; Ameno, K.; Ijiri, I. Analysis of body sway pattern after alcohol ingestion in human subjects. Acta Otolaryngol. 1989, 108, 247–252. [Google Scholar] [CrossRef]
- Bernard Maze, F.; Blazquez Tejada, M.T.; Rojas Ruiz, F.J. Effects of Proprioceptive Training on the Postural Control System in Young Football Players: A Study Performed with Detrended Fluctuation (DFA). TK Rev. Euroam. Cienc. Deporte 2017, 6, 49–58. [Google Scholar]
- Lion, A.; Spada, R.S.; Bosser, G.; Gauchard, G.C.; Anello, G.; Bosco, P.; Calabrese, S.; Iero, A.; Stella, G.; Elia, M.; et al. Biological determinants of postural disorders in elderly women. Int. J. Neurosci. 2013, 123, 24–30. [Google Scholar] [CrossRef] [PubMed]
- Hoang, C.L.; Salle, J.Y.; Mandigout, S.; Hamonet, J.; Macian-Montoro, F.; Daviet, J.C. Physical factors associated with fatigue after stroke: An exploratory study. Top. Stroke Rehabil. 2012, 19, 369–376. [Google Scholar] [CrossRef]
- Lelard, T.; Godefroy, O.; Ahmaidi, S.; Krystkowiak, P.; Mouras, H. Mental simulation of painful situations has an impact on posture and psychophysiological parameters. Front. Psychol. 2017, 8, 2012. [Google Scholar] [CrossRef] [PubMed] [Green Version]
- Bauer, C.M.; Gröger, I.; Rupprecht, R.; Marcar, V.L.; Gaßmann, K.G. Prediction of future falls in a community dwelling older adult population using instrumented balance and gait analysis. Z. Gerontol. Geriatr. 2016, 49, 232–236. [Google Scholar] [CrossRef] [PubMed] [Green Version]
- Beckmann, H.; Bohlen, S.; Saft, C.; Hoffmann, R.; Gerss, J.; Muratori, L.; Ringelstein, E.B.; Landwehrmeyer, G.B.; Reilmann, R. Objective assessment of gait and posture in premanifest and manifest Huntington disease-A multi-center study. Gait Posture 2018, 63, 452–457. [Google Scholar] [CrossRef]
- Lelard, T.; Montalan, B.; Morel, M.F.; Krystkowiak, P.; Ahmaidi, S.; Godefroy, O.; Mouras, H. Postural correlates with painful situations. Front. Hum. Neurosci. 2013, 5, 4. [Google Scholar] [CrossRef] [Green Version]
- Yahia, A.; Ghroubi, S.; Jribi, S.; Mâlla, J.; Baklouti, S.; Ghorbel, A.; Elleuch, M.H. Chronic neck pain and vertigo: Is a true balance disorder present? Ann. Phys. Rehabil. Med. 2009, 52, 556–567. [Google Scholar] [CrossRef] [Green Version]
- Dehail, P.; Petit, H.; Joseph, P.A.; Vuadens, P.; Mazaux, J.M. Assessment of postural instability in patients with traumatic brain injury upon enrolment in a vocational adjustment programme. J. Rehabil. Med. 2007, 39, 531–536. [Google Scholar] [CrossRef] [Green Version]
- Cao, H.; Peyrodie, L.; Boudet, S.; Cavillon, F.; Agnani, O.; Hautecoeur, P.; Donzé, C. Expanded disability status scale (edss) estimation in multiple sclerosis from posturographic data. Gait Posture 2013, 37, 242–245. [Google Scholar] [CrossRef] [Green Version]
- Mbongo, F.; Patko, T.; Vidal, P.P.; Vibert, N.; Tran Ba Huy, P.; de Waele, C. Postural control in patients with unilateral vestibular lesions is more impaired in the roll than in the pitch plane: A static and dynamic posturography study. Audiol. Neurootol. 2005, 10, 291–302. [Google Scholar] [CrossRef]
- Mouras, H.; Lelard, T.; Ahmaidi, S.; Godefroy, O.; Krystkowiak, P. Freezing behavior as a response to sexual visual stimuli as demonstrated by posturography. PLoS ONE 2015, 10, e0127097. [Google Scholar] [CrossRef] [PubMed]
- Chastan, N.; Debono, B.; Maltête, D.; Weber, J. Discordance between measured postural instability and absence of clinical symptoms in Parkinson’s disease patients in the early stages of the disease. Mov. Disord. 2008, 23. [Google Scholar] [CrossRef] [PubMed]
- Gagey, P.M. International standardization of clinical stabilometry (Minutes of the meeting of posturologists, Paris 07.10.2015). Man. Ther. Posturol. Rehabil. J. 2016, 14. [Google Scholar] [CrossRef] [Green Version]
- AFP. Normes 85. Paris 20 Rue Du Rendez-Vous 75012; AFP: Paris, Frane, 1985; p. 249. [Google Scholar]
- Koo, T.K.; Li, M.Y. A guideline of selecting and reporting intraclass correlation coefficients for reliability research. J. Chiropr. Med. 2016, 15, 155–163. [Google Scholar] [CrossRef] [Green Version]
- Portney, L.; Watkins, M. Foundations of Clinical Research: Applications to Practice, 3rd ed.; F.A. Davis Company: Philadelphia, PA, USA, 2015; p. 912. [Google Scholar]
- Carrascosa, A.; Yeste, D.; Moreno-Galdó, A.; Gussinyé, M.; Ferrández, Á.; Clemente, M.; Fernández-Cancio, M. Body mass index and tri-ponderal mass index of 1453 healthy non-obese, non-undernourished millennial children. The Barcelona longitudinal growth study. An. Pediatr. 2018, 89, 137–143. [Google Scholar] [CrossRef]
- What Is Electrical Noise and Where Does It Come from?—Technical Articles. Available online: https://www.allaboutcircuits.com/technical-articles/electrical-noise-what-causes-noise-in-electrical-circuits/ (accessed on 5 March 2020).
- Jacob, J.M. Industrial Control Electronics: Applications and Design. Solutions Manual; Prentice Hall: Upper Saddle River, NJ, USA, 1989. [Google Scholar]
- Lanzarin, M.; Parizzoto, P.; De, T.; Libardoni, C. The influence of dual-tasking on postural control in young adults. Fisioter Pesqui. 2015, 22, 61–68. [Google Scholar] [CrossRef]
- Chen, Y.; Yu, Y.; Niu, R.; Liu, Y. Selective effects of postural control on spatial vs. nonspatial working memory: A functional near-infrared spectral imaging study. Front. Hum. Neurosci. 2018, 12, 243. [Google Scholar] [CrossRef] [Green Version]
- Posner, M.I.; Dehaene, S. Attentional networks. Trends Neurosci. 1994, 27, 75–79. [Google Scholar] [CrossRef]
- Posner, M.I.; Gilbert, C.D. Attention and primary visual cortex. Proc. Natl. Acad. Sci. USA 1999, 96, 2585–2587. [Google Scholar] [CrossRef] [PubMed] [Green Version]
- Guyton, D.L.; Cheeseman, E.W.; Ellis, F.J.; Straumann, D.; Zee, D.S. Dissociated vertical deviation: An exaggerated normal eye movement used to damp cyclovertical latent nystagmus. Trans. Am. Ophthalmol. Soc. 1998, 96, 389–424. [Google Scholar]
- Guyton, A.; Hall, J.E. Tratado de Fisiología Médica, 12a Edició; Panamericana: Barcelona, España, 2011. [Google Scholar]
- Guyton, D.L. Dissociated vertical deviation: Etiology, mechanism, and associated phenomena. Costenbader Lecture. J. Aapos. Off. Publ. Am. Assoc. Pediatr. Ophthalmol. Strabismus 2000, 4, 131–144. [Google Scholar] [CrossRef]
- Ouaknine, M. Les sabots et cyber-sabots dynamométriques: La conception du statodynamique. M Ouaknine Introduction La posture érigée: Contraintes biomécaniques. Résonances Eur. Rachis 2009, 16, 2117–2128. [Google Scholar]
- Andersson, G.; Yardley, L.; Luxon, L. A dual-task study of interference between mental activity and control of balance. Am. J. Otol. 1998, 19, 632–637. [Google Scholar] [PubMed]
- Kerr, B.; Condon, S.M.; McDonald, L.A. Cognitive spatial processing and the regulation of posture. J. Exp. Psychol. Hum. Percept. Perform. 1985, 11, 617–622. [Google Scholar] [CrossRef] [PubMed]


| Parameters | Weight | (0,0) | (0,3) | (3,0) | % ∆ | % ∆ |
|---|---|---|---|---|---|---|
| (kg) | (Mean ± SD) | (Mean ± SD) | (Mean ± SD) | p-Value (0,0)/(0,3) | p-Value (0,0)/(3,0) | |
| Surface | 1.990 | 6.14 ± 0.50 | 7.96 ± 0.59 | 5.28 ± 0.28 | 29.58%/0.000 * | −13.99%/0.001 * |
| 15.149 | 0.97 ± 0.10 | 1.10 ± 0.05 | 0.84 ± 0.03 | 13.20%/0.002 * | −13.00%/0.004 * | |
| 30.271 | 0.79 ± 0.02 | 0.80 ± 0.06 | 0.68 ± 0.03 | 1.02%/0.661 * | −13.77%/0.000 * | |
| 45.405 | 0.48 ± 0.03 | 0.87 ± 0.96 | 0.58 ± 0.03 | 80.26%/0.005 *,w | 20.11%/0.000 * | |
| X mean | 1.990 | −12.64 ± 0.12 | −12.65 ± 0.13 | 18.32 ± 0.06 | 0.06%/0.721 *,w | −244.98%/0.000 * |
| 15.149 | −8.93 ± 0.01 | −9.08 ± 0.01 | 20.95 ± 0.01 | 1.77%/0.000 * | −334.73%/0.000 * | |
| 30.271 | −8.55 ± 0.00 | −8.84 ± 0.00 | 21.57 ± 0.00 | 3.42%/0.005 *,w | −352.35%/0.005 * | |
| 45.405 | −8.39 ± 0.00 | −8.75 ± 0.08 | 21.98 ± 0.01 | 4.31%/0.005 *,w | −362.02%/0.000 * | |
| Y mean | 1.990 | 103.58 ± 0.07 | 133.66 ± 0.19 | 103.92 ± 0.04 | 29.04%/0.005 * | 0.33%/0.000 * |
| 15.149 | 108.05 ± 0.01 | 138.06 ± 0.01 | 107.75 ± 0.01 | 27.77%/0.000 * | −0.28%/0.000 * | |
| 30.271 | 108.65 ± 0.00 | 138.21 ± 0.00 | 108.22 ± 0.00 | 27.21%/0.000 * | −0.40%/0.000 * | |
| 45.405 | 108.84 ± 0.00 | 138.17 ± 0.03 | 108.41 ± 0.00 | 26.95%/0.005 * w | −0.39%/0.000 * | |
| L | 1.990 | 187.46 ± 2.67 | 193.01 ± 3.45 | 193.82 ± 2.09 | 2.96%/0.002 * | 3.40% 7 0.001 * |
| 15.149 | 29.97 ± 1.94 | 28.34 ± 0.81 | 28.56 ± 0.40 | −5.44%/0.028 *,w | −4.70%/0.047 *,w | |
| 30.271 | 25.49 ± 0.38 | 22.72 ± 0.67 | 24.85 ± 0.59 | −10.84%/0.000 * | −2.49%/0.017 *,w | |
| 45.405 | 15.47 ± 0.45 | 14.88 ± 0.47 | 18.64 ± 0.41 | −3.68%/0.037 *,w | 20.66%/0.005 *,w | |
| LX | 1.990 | 117.42 ± 2.46 | 119.91 ± 2.37 | 124.62 ± 2.28 | 2.12%/0.037 * | 6.13%/0.000 * |
| 15.149 | 18.86 ± 1.15 | 17.61 ± 0.55 | 18.27 ± 0.27 | −6.61%/0.014 * | −3.11%/0.147 | |
| 30.271 | 13.41 ± 0.28 | 11.13 ± 0.40 | 13.75 ± 0.39 | −17.01%/0.000 * | 2.53%/0.121 | |
| 45.405 | 8.16 ± 0.26 | 7.62 ± 0.28 | 10.00 ± 0.32 | −6.53%/0.001 * | 22.57%/0.000 * | |
| LY | 1.990 | 129.39 ± 2.16 | 134.03 ± 3.33 | 129.41 ± 1.40 | 3.59%/0.006 * | 0.02%/0.978 |
| 15.149 | 20.10 ± 1.48 | 19.20 ± 0.58 | 18.61 ± 0.46 | −4.52%/0.114 w | −7.43%/0.013 *,w | |
| 30.271 | 19.75 ± 0.40 | 18.09 ± 0.61 | 18.46 ± 0.41 | −8.42%/0.005 *,w | −6.50%/0.005 *,w | |
| 45.405 | 11.78 ± 0.42 | 11.48 ± 0.39 | 13.78 ± 0.39 | −2.49%/0.193 | 17.00%/0.000 * |
| Parameters | Weight (kg) | (0,0) | (0,3) | (3,0) | % ∆ | % ∆ |
|---|---|---|---|---|---|---|
| (Mean ± SD | (Mean ± SD) | (Mean ± SD) | p-Value (0,0)/(0,3) | p-Value (0,0)/(3,0) | ||
| Stabilometry Amplitude in X | 1.990 | 14.74 ± 0.01 | 17.92 ± 0.02 | 14.78 ± 0.01 | 21.54%/0.005 * | 0.26%/0.005 * |
| 15.149 | 15.22 ± 0.00 | 18.37 ± 0.00 | 15.19 ± 0.00 | 20.70%/0.002 * | −0.20%/0.002 * | |
| 30.271 | 15.29 ± 0.00 | 18.39 ± 0.00 | 15.24 ± 0.00 | 20.27%/0.002 * | −0.33%/0.002 * | |
| 45.405 | 15.31 ± 0.00 | 18.38 ± 0.01 | 15.26 ± 0.00 | 20.08%/0.004 * | −0.33%/0.002 * | |
| Stabilometry in X maximum | 1.990 | −12.04 ± 0.21 | −11.93 ± 0.22 | 18.96 ± 0.20 | −0.86%/0.303 | −257.53%/0.000 * |
| 15.149 | −8.81 ± 0.03 | −8.99 ± 0.03 | 21.07 ± 0.03 | 2.04%/0.000 * | −339.22%/0.000 * | |
| 30.271 | −8.46 ± 0.02 | −8.76 ± 0.05 | 21.65 ± 0.03 | 3.64%/0.000 * | −356.05%/0.000 * | |
| 45.405 | −8.34 ± 0.01 | −8.68 ± 0.08 | 22.06 ± 0.02 | 4.17%/0.000 * | −364.66%/0.000 * | |
| Stabilometry in X minimum | 1.990 | −13.34 ± 0.23 | −13.32 ± 0.23 | 17.76 ± 0.06 | −0.19%/0.836 | −233.11%/0.005 *,w |
| 15.149 | −9.04 ± 0.06 | −9.19± 0.02 | 20.86 ± 0.03 | 1.58%/0.000 * | −330.64%/0.000* | |
| 30.271 | −8.64 ± 0.02 | −8.91 ± 0.02 | 21.48 ± 0.02 | 3.14%/0.000 * | −348.75%/0.000 * | |
| 45.405 | −8.45 ± 0.02 | −8.81 ± 0.08 | 21.90 ± 0.04 | 4.23%/0.000 * | −358.99%/0.000 * | |
| Stabilometry Amplitude in Y | 1.990 | −1.45 ± 0.01 | −1.45 ± 0.02 | 2.10 ± 0.01 | 0.14%/0.587 | −335.29%/0.005 * |
| 15.149 | −1.02 ± 0.00 | −1.04 ± 0.00 | 2.40 ± 0.00 | 1.96%/0.002 * | −244.89%/0.002 * | |
| 30.271 | −0.98 ± 0.00 | −1.01 ± 0.00 | 2.47 ± 0.00 | 3.06%/0.002 * | −352.04%/0.002 * | |
| 45.405 | −0.96 ± 0.00 | −1.00 ± 0.01 | 2.52 ± 0.00 | 4.48%/0.004 * | −362.50%/0.002 * | |
| Stabilometry in Y maximum | 1.990 | 102.80 ± 0.17 | 132.90 ± 0.27 | 103.21 ± 0.08 | 29.28%/0.000 * | 0.40%/0.000 * |
| 15.149 | 107.93 ± 0.05 | 137.94 ± 0.02 | 107.66 ± 0.01 | 27.81%/0.000 * | −0.25%/0.000 * | |
| 30.271 | 108.52 ± 0.02 | 138.10 ± 0.03 | 108.10 ± 0.02 | 27.26%/0.000 * | −0.39%/0.000 * | |
| 45.405 | 108.74 ± 0.06 | 138.02 ± 0.08 | 108.27 ± 0.11 | 26.93%/0.000 * | −0.43%/0.005 *,w | |
| Stabilometry in Y minimum | 1.990 | 104.25 ± 0.14 | 134.39 ± 0.23 | 104.63 ± 0.11 | 28.91%/0.000 * | 0.37%/0.000 * |
| 15.149 | 108.17 ± 0.02 | 138.17 ± 0.02 | 107.88 ± 0.04 | 27.74%/0.000 * | −0.27%/0.000 * | |
| 30.271 | 108.81 ± 0.04 | 138.34 ± 0.06 | 108.36 ± 0.02 | 27.14%/0.000 * | −0.41%/0.000 * | |
| 45.405 | 108.94 ± 0.06 | 138.26 ± 0.04 | 108.51 ± 0.10 | 26.92%/0.000 * | −0.39%/0.005 *,w |
| Parameters | Visual Condition | R1 (Mean ± SD) | R2 (Mean ± SD) | Correlation p-Value | ICC [95% CI] |
|---|---|---|---|---|---|
| Surface | OE | 172.75 ± 92.41 | 210.70 ± 143.09 | 0.529 (0.000 *) | 0.651 [0.350, 0.812] |
| CE | 239.64 ± 137.03 | 202.01 ± 90.05 | 0.664 (0.000 *) | 0.750 [0.549, 0.870] | |
| X mean | OE | −1.21 ± 5.36 | −0.87 ± 5.14 | 0.371 (0.016 *) | 0.540 [0.145, 0.753] |
| CE | 0.02 ± 6.17 | −0.40 ± 5.36 | 0.635 (0.000 *) | 0.772 [0.577, 0.878] | |
| Y mean | OE | −34.10 ± 13.17 | −36.60 ± 13.86 | 0.776 (0.000 *) | 0.874 [0.765, 0.932] |
| CE | −31.13 ± 12.41 | −33.02 ± 12.24 | 0.761 (0.000 *) | 0.864 [0.747, 0.927] | |
| L | OE | 463.11 ± 106.16 | 458.02 ± 104.05 | 0.545 (0.000 *) | 0.705 [0.452, 0.842] |
| CE | 649.91 ± 209.16 | 579.22± 162.25 | 0.612 (0.000 *) | 0.744 [0.524, 0.862] | |
| LX | OE | 266.23 ± 65.43 | 271.13 ± 69.21 | 0.599 (0.000 *) | 0.749 [0.532, 0.865] |
| CE | 362.89 ± 117.10 | 326.73 ± 112.85 | 0.694 (0.000 *) | 0.819 [0.664, 0.903] | |
| LY | OE | 321.65 ± 82.23 | 309.54 ± 77.72 | 0.477 (0.001 *) | 0.645 [0.340, 0.809] |
| CE | 458.96 ± 169.92 | 407.26 ± 115.34 | 0.549 (0.000 *) | 0.675 [0.396, 0.825] | |
| Stabilometry Amplitude in X | OE | 16.05 ± 5.97 | 16.25 ± 5.60 | 0.598 (0.000 *) | 0.747 [0.530, 0.864] |
| CE | 21.49 ± 8.67 | 19.46 ± 5.89 | 0.635 (0.000 *) | 0.742 [0.520, 0.861] | |
| Stabilometry in X maximum | OE | 7.13 ± 6.89 | 7.26 ± 6.09 | 0.407 (0.007 *) | 0.575 [0.210, 0.772] |
| CE | 10.66 ± 8.51 | 8.99 ± 6.22 | 0.597 (0.000 *) | 0.725 [0.488, 0.852] | |
| Stabilometry in X minimum | OE | −8.91 ± 5.47 | −8.99 ± 6.32 | 0.402 (0.008 *) | 0.570 [0.199, 0.769] |
| CE | −10.82 ± 7.39 | −10.47 ± 6.08 | 0.523 (0.000 *) | 0.679 [0.402, 0.827] | |
| Stabilometry Amplitude in Y | OE | 21.57 ± 5.76 | 24.36 ± 9.69 | 0.303 (0.051) | 0.420 [−0.077, 0.689] |
| CE | 24.09 ± 7.35 | 22.29 ± 5.62 | 0.645 (0.000 *) | 0.767 [0.567, 0.875] | |
| Stabilometry in Y maximum | OE | −44.96 ± 13.70 | −48.87 ± 16.48 | 0.657 (0.000 *) | 0.785 [0.600, 0.885] |
| CE | −42.99 ± 13.01 | −43.98 ± 12.69 | 0.745 (0.000 *) | 0.854 [0.728, 0.922] | |
| Stabilometry in Y minimum | OE | −23.39 ± 13.50 | −24.51 ± 14.31 | 0.765 (0.000 *) | 0.866 [0.751, 0.928] |
| CE | −18.90 ± 13.73 | −21.68 ± 13.12 | 0.743 (0.000 *) | 0.852 [0.724, 0.920] |
| Parameters | Imbalance | Visual Condition | R1 (Mean ± SD) | R2 (Mean ± SD) | Correlation p-Value | ICC [95% CI] |
|---|---|---|---|---|---|---|
| Surface | SI | OE | 408.97 ± 133.83 | 432.81 ± 168.34 | 0.525 (0.000 *) | 0.677 [0.399, 0.826] |
| CE | 1331.15 ± 663.81 | 1213.30 ± 588.70 | 0.713 (0.000 *) | 0.829 [0.682, 0.908] | ||
| LI | OE | 381.82 ± 165.02 | 397.91± 149.48 | 0.400 (0.009 *) | 0.570 [0.200, 0.769] | |
| CE | 1669.57 ± 800.46 | 1607.78 ± 720.49 | 0.629 (0.000 *) | 0.769 [0.571, 0.876] | ||
| X mean | SI | OE | −1.90 ± 7.80 | 0.48 ± 6.37 | 0.480 (0.001 *) | 0.640 [0.330, 0.806] |
| CE | −0.58 ± 7.42 | 0.20 ± 7.59 | 0.480 (0.001 *) | 0.648 [0.346, 0.811] | ||
| LI | OE | −2.19 ± 6.32 | −1.88 ± 6.94 | 0.356 (0.021 *) | 0.523 [0.113, 0.744] | |
| CE | −4.29 ± 9.97 | −4.51 ± 7.13 | 0.587 (0.000 *) | 0.714 [0.468, 0.846] | ||
| Y mean | SI | OE | −2.93 ± 18.10 | −5.40± 14.39 | 0.575 (0.000 *) | 0.718 [0.475, 0.848] |
| CE | −1.98 ± 20.66 | −8.62 ± 17.31 | 0.788 (0.000 *) | 0.874 [0.766, 0.932] | ||
| LI | OE | −3.51 ± 15.83 | −7.9127 ± 17.38 | 0.743 (0.000 *) | 0.851 [0.722, 0.920] | |
| CE | 3.62 ± 16.98 | −1.5315 ± 16.89 | 0.765 (0.000 *) | 0.867 [0.752, 0.928] | ||
| L | SI | OE | 703.91 ± 189.26 | 645.94 ± 176.18 | 0.823 (0.000 *) | 0.901 [0.816, 0.947] |
| CE | 1346.19 ± 543.73 | 1220.79 ± 420.82 | 0.812 (0.000 *) | 0.880 [0.778, 0.936] | ||
| LI | OE | 594.75 ± 192.48 | 565.51 ± 142.08 | 0.795 (0.000 *) | 0.864 [0.746, 0.927] | |
| CE | 1230.91 ± 404.83 | 1160.31 ± 384.42 | 0.829 (0.000 *) | 0.906 [0.824, 0.949] | ||
| LX | SI | OE | 247.42± 71.16 | 226.36 ± 75.15 | 0.628 (0.000 *) | 0.771 [0.573, 0.877] |
| CE | 491.79 ± 178.74 | 472.93 ± 212.37 | 0.762 (0.000 *) | 0.858 [0.735, 0.923] | ||
| LI | OE | 427.17 ± 159.23 | 409.11 ± 123.16 | 0.808 (0.000 *) | 0.878 [0.773, 0.934] | |
| CE | 882.52 ± 292.44 | 835.60 ± 275.34 | 0.808 (0.000 *) | 0.893 [0.801, 0.942] | ||
| LY | SI | OE | 603.37 ± 182.31 | 555.24 ± 161.00 | 0.822 (0.000 *) | 0.898 [0.811, 0.945] |
| CE | 1143.29 ± 499.99 | 1017.34 ± 354.42 | 0.773 (0.000 *) | 0.844 [0.709, 0.916] | ||
| LI | OE | 319.60 ± 96.75 | 299.73 ± 74.62 | 0.703 (0.000 *) | 0.809 [0.645, 0.897] | |
| CE | 664.13 ± 245.79 | 620.75 ± 233.48 | 0.801 (0.000 *) | 0.889 [0.793, 0.940] | ||
| Starbilometry Amplitude in X | SI | OE | 18.87 ± 5.57 | 19.02 ± 5.34 | 0.538 (0.000 *) | 0.699 [0.440, 0.838] |
| CE | 34.65 ± 10.58 | 33.10 ± 12.18 | 0.598 (0.000 *) | 0.744 [0.524, 0.862] | ||
| LI | OE | 29.95 ± 10.46 | 28.87 ± 7.28 | 0.474 (0.002 *) | 0.615 [0.284, 0.793] | |
| CE | 72.48 ± 21.28 | 71.98 ± 18.93 | 0.469 (0.002 *) | 0.636 [0.323, 0.804] | ||
| Stabilometry in X maximum | SI | OE | 7.75 ± 9.41 | 9.90 ± 6.92 | 0.466 (0.002 *) | 0.616 [0.286, 0.794] |
| CE | 16.33 ± 9.57 | 16.77 ± 10.53 | 0.538 (0.000 *) | 0.697 [0.437, 0.837] | ||
| LI | OE | 12.72 ± 8.49 | 12.47 ± 8.29 | 0.246 (0.116) | 0.395 [−0.013, 0.675] | |
| CE | 31.68 ± 16.07 | 31.78 ± 14.45 | 0.513 (0.001 *) | 0.676 [0.397, 0.826] | ||
| Stabilometry in X minimum | SI | OE | −11.11 ± 8.36 | −9.11 ± 7.23 | 0.431 (0.004 *) | 0.613 [0.280, 0.792] |
| CE | −18.32 ± 8.99 | −16.32 ± 8.93 | 0.532 (0.000 *) | 0.694 [0.432, 0.836] | ||
| LI | OE | −17.22 ± 9.59 | −16.40 ± 7.24 | 0.402 (0.008 *) | 0.558 [0.177, 0.762] | |
| CE | −40.79 ± 14.12 | −40.19 ± 12.03 | 0.509 (0.001 *) | 0.669 [0.384, 0.822] | ||
| Stabilometry Amplitude in Y | SI | OE | 41.57 ± 10.09 | 42.83 ± 9.39 | 0.360 (0.019 *) | 0.529 [0.123, 0.747] |
| CE | 74.12 ± 18.52 | 71.68 ± 18.56 | 0.630 (0.000 *) | 0.773 [0.577, 0.878] | ||
| LI | OE | 25.46 ± 6.99 | 25.68 ± 8.28 | 0.433 (0.004 *) | 0.598 [0.252, 0.784] | |
| CE | 44.40 ± 14.65 | 41.17 ± 14.05 | 0.553 (0.000 *) | 0.712 [0.464, 0.845] | ||
| Stabilometry in Y maximum | SI | OE | −23.868 ± 16.35 | −26.75 ± 13.88 | 0.499 (0.001 *) | 0.660 [0.386, 0.817] |
| CE | −39.21 ± 20.90 | −43.43 ± 17.77 | 0.764 (0.000 *) | 0.860 [0.739, 0.925] | ||
| LI | OE | −16.21 ± 15.65 | −20.78 ± 16.94 | 0.687 (0.000 *) | 0.813 [0.652, 0.900] | |
| CE | −19.05 ± 17.41 | −22.29 ± 17.53 | 0.731 (0.000 *) | 0.845 [0.711, 0.916] | ||
| Stabilometry in Y minimum | API | OE | 17.70 ± 20.58 | 16.07 ± 17.06 | 0.582 (0.000 *) | 0.727 [0.493, 0.853] |
| CE | 34.90 ± 25.68 | 28.25 ± 21.91 | 0.656 (0.000 *) | 0.786 [0.603, 0.885] | ||
| LI | OE | 9.24 ± 15.86 | 4.90 ± 18.33 | 0.765 (0.000 *) | 0.862 [0.740, 0.926] | |
| CE | 25.35 ± 20.63 | 18.88 ± 19.25 | 0.729 (0.000 *) | 0.842 [0.706, 0.915] |
Publisher’s Note: MDPI stays neutral with regard to jurisdictional claims in published maps and institutional affiliations. |
© 2020 by the authors. Licensee MDPI, Basel, Switzerland. This article is an open access article distributed under the terms and conditions of the Creative Commons Attribution (CC BY) license (http://creativecommons.org/licenses/by/4.0/).
Share and Cite
Rodríguez-Rubio, P.R.; Bagur-Calafat, C.; López-de-Celis, C.; Bueno-Gracía, E.; Cabanas-Valdés, R.; Herrera-Pedroviejo, E.; Girabent-Farrés, M. Validity and Reliability of the Satel 40 Hz Stabilometric Force Platform for Measuring Quiet Stance and Dynamic Standing Balance in Healthy Subjects. Int. J. Environ. Res. Public Health 2020, 17, 7733. https://doi.org/10.3390/ijerph17217733
Rodríguez-Rubio PR, Bagur-Calafat C, López-de-Celis C, Bueno-Gracía E, Cabanas-Valdés R, Herrera-Pedroviejo E, Girabent-Farrés M. Validity and Reliability of the Satel 40 Hz Stabilometric Force Platform for Measuring Quiet Stance and Dynamic Standing Balance in Healthy Subjects. International Journal of Environmental Research and Public Health. 2020; 17(21):7733. https://doi.org/10.3390/ijerph17217733
Chicago/Turabian StyleRodríguez-Rubio, Pere Ramón, Caritat Bagur-Calafat, Carlos López-de-Celis, Elena Bueno-Gracía, Rosa Cabanas-Valdés, Ernesto Herrera-Pedroviejo, and Montserrat Girabent-Farrés. 2020. "Validity and Reliability of the Satel 40 Hz Stabilometric Force Platform for Measuring Quiet Stance and Dynamic Standing Balance in Healthy Subjects" International Journal of Environmental Research and Public Health 17, no. 21: 7733. https://doi.org/10.3390/ijerph17217733