Comparing the Climatic and Landscape Risk Factors for Lyme Disease Cases in the Upper Midwest and Northeast United States


Abstract
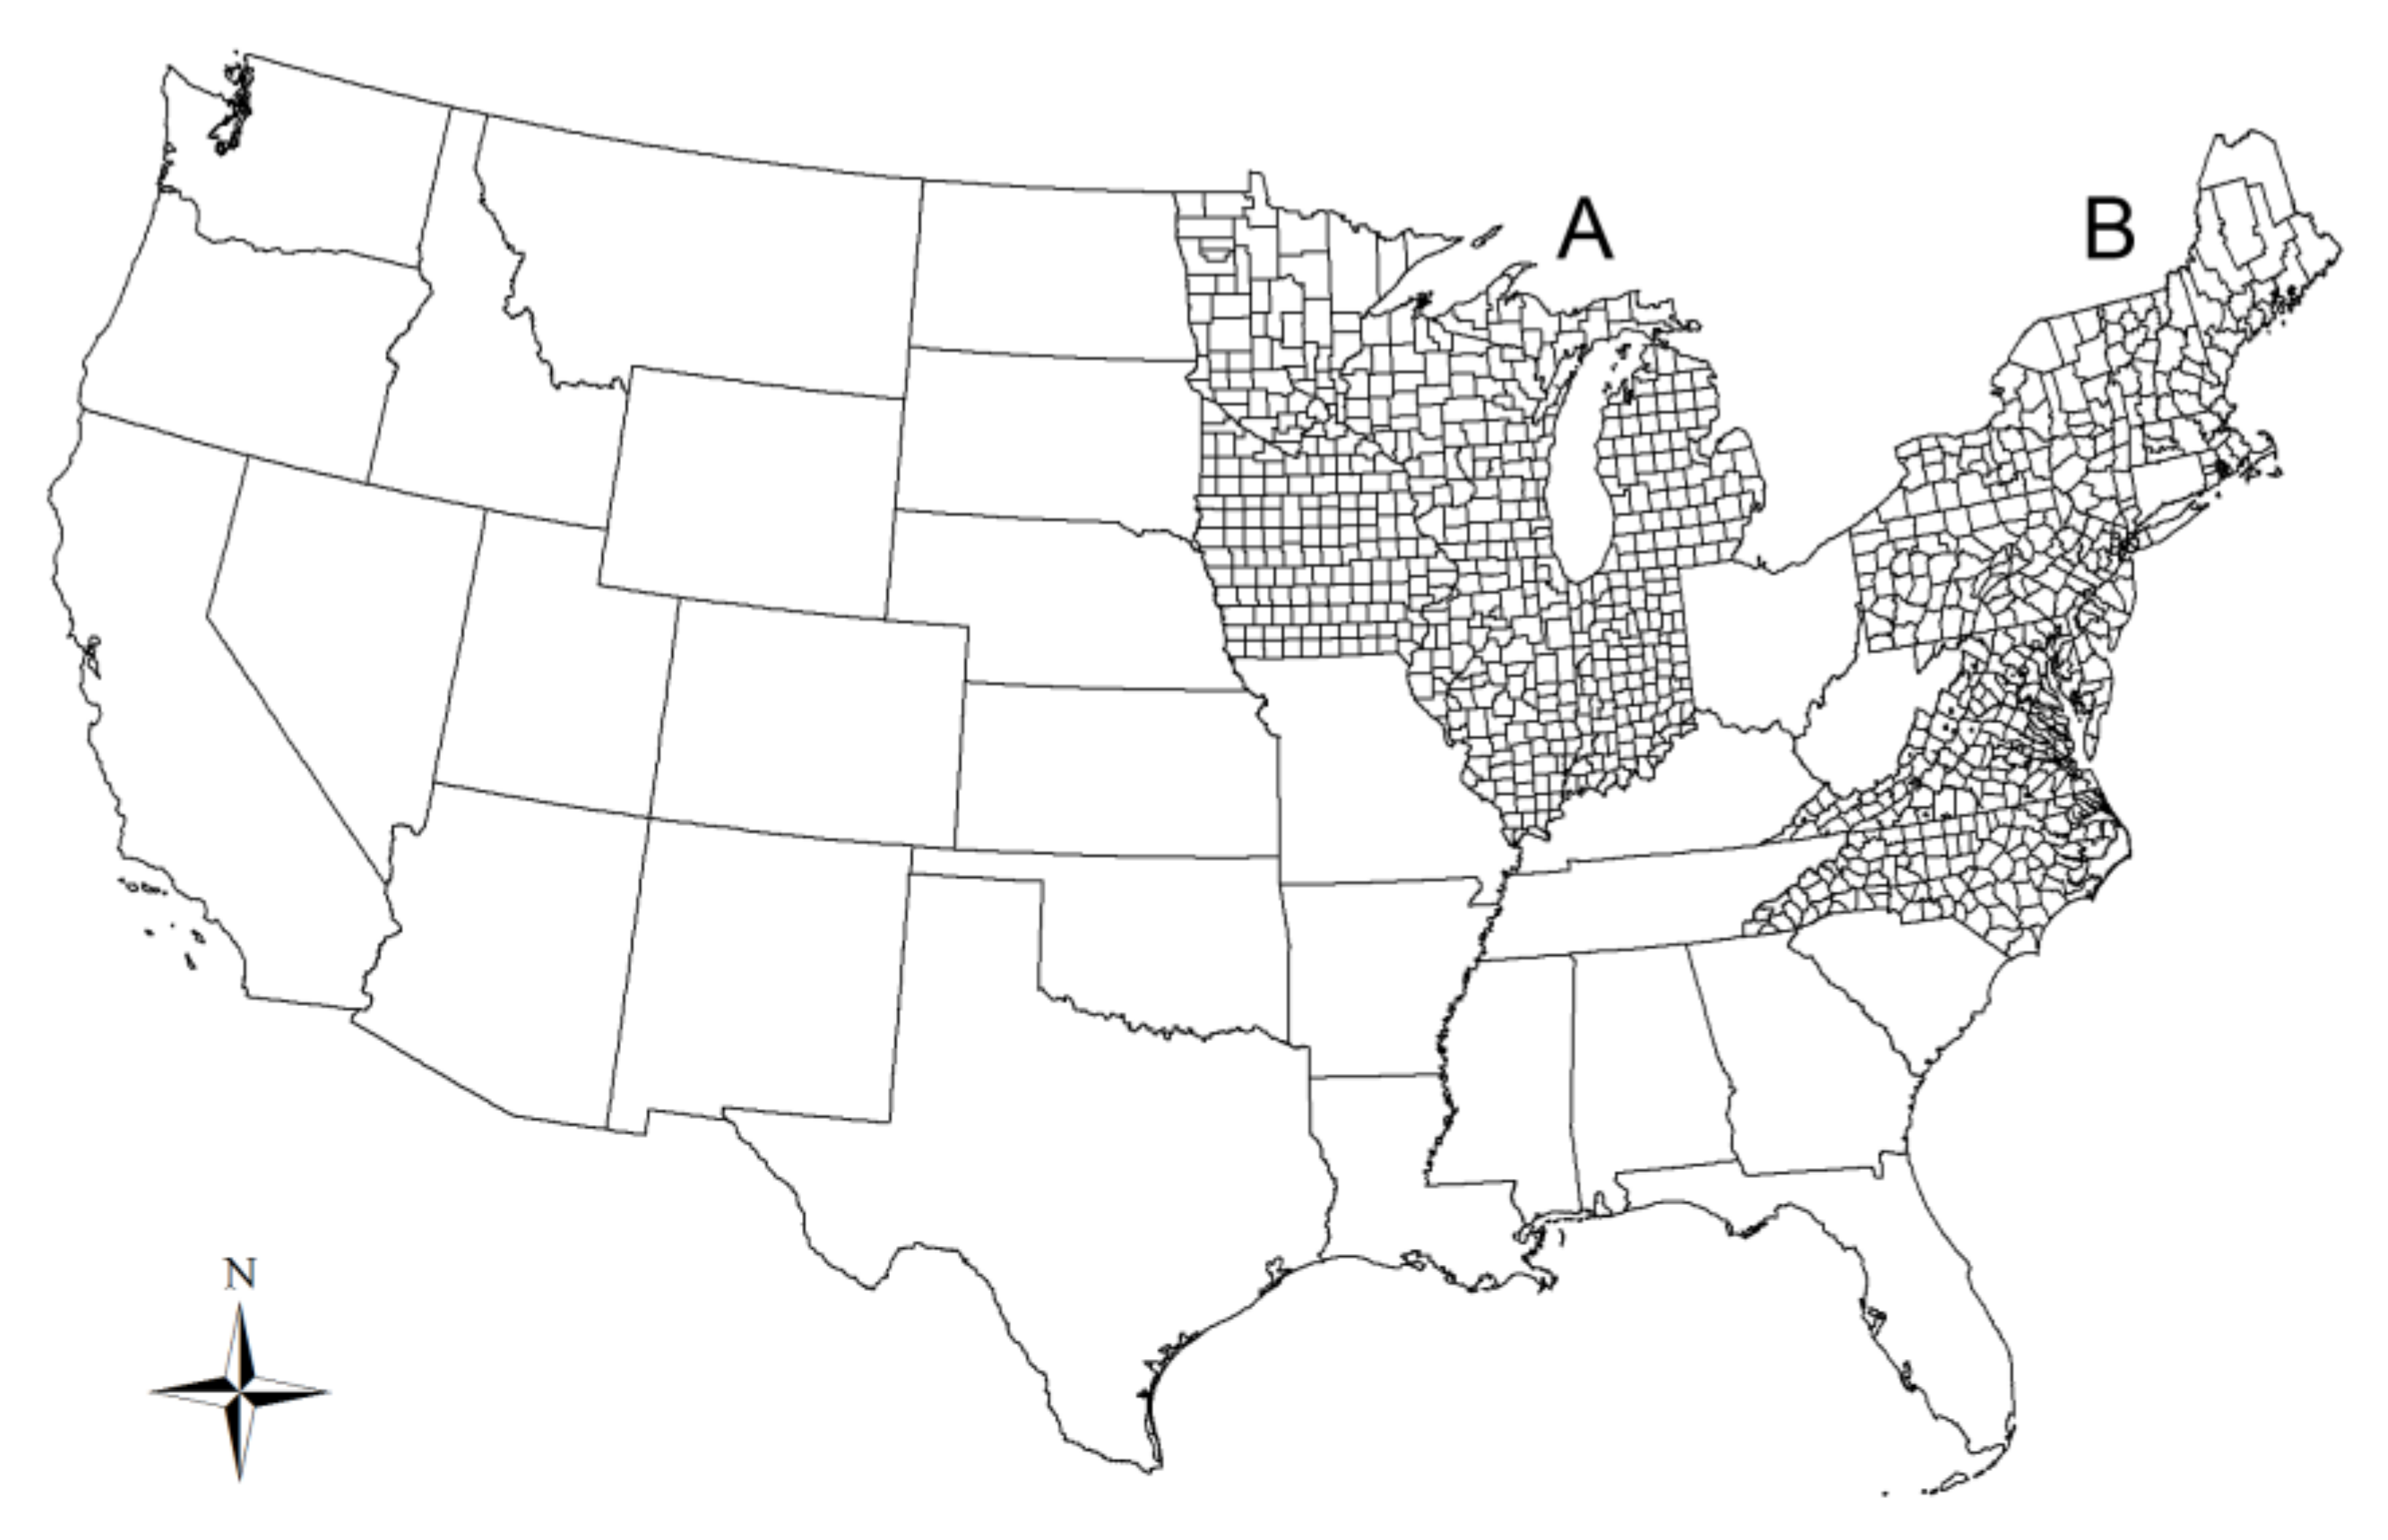
:1. Introduction
2. Materials and Methods
2.1. Lyme Disease Data
2.2. Data of Predictors
2.3. Statistical Analyses
3. Results
3.1. Univariate Regression Analyses
3.2. Model Averaging Analyses
4. Discussion
5. Conclusions
Author Contributions
Funding
Conflicts of Interest
References
- Killilea, M.E.; Swei, A.; Lane, R.S.; Briggs, C.J.; Ostfeld, R.S. Spatial dynamics of Lyme disease: A review. EcoHealth 2008, 5, 167–195. [Google Scholar] [CrossRef] [PubMed] [Green Version]
- McClure, M.; Diuk-Wasser, M. Reconciling the entomological hazard and disease risk in the Lyme disease system. Int. J. Environ. Res. Public Health 2018, 15, 1048. [Google Scholar] [CrossRef] [PubMed] [Green Version]
- Tran, P.M.; Waller, L. Effects of landscape fragmentation and climate on Lyme disease incidence in the northeastern United States. Ecohealth 2013, 10, 394–404. [Google Scholar] [CrossRef] [PubMed]
- Steere, A.C.; Coburn, J.; Glickstein, L. The emergence of Lyme disease. J. Clin. Investig. 2004, 113, 1093–1101. [Google Scholar] [CrossRef] [Green Version]
- Turney, S.; Gonzalez, A.; Millien, V. The negative relationship between mammal host diversity and Lyme disease incidence strengthens through time. Ecology 2014, 95, 3244–3250. [Google Scholar] [CrossRef]
- Wang, Y.X.; Matson, K.D.; Xu, Y.; Prins, H.H.; Huang, Z.Y.; de Boer, W.F. Forest connectivity, host assemblage characteristics of local and neighboring counties, and temperature jointly shape the spatial expansion of lyme disease in United States. Remote Sens. 2019, 11, 2354. [Google Scholar] [CrossRef] [Green Version]
- Barbour, A.G.; Fish, D. The biological and social phenomenon of Lyme disease. Science 1993, 260, 1610–1616. [Google Scholar] [CrossRef] [Green Version]
- Wood, C.L.; Lafferty, K.D. Biodiversity and disease: A synthesis of ecological perspectives on Lyme disease transmission. Trends Ecol. Evol. 2013, 28, 239–247. [Google Scholar] [CrossRef]
- DeLong, A.; Hsu, M.; Kotsoris, H. Estimation of cumulative number of post-treatment Lyme disease cases in the US, 2016 and 2020. BMC Public Health 2019, 19, 352. [Google Scholar] [CrossRef]
- Sanchez, E.; Vannier, E.; Wormser, G.P.; Hu, L.T. Diagnosis, treatment, and prevention of Lyme disease, human granulocytic anaplasmosis, and babesiosis: A review. JAMA 2016, 315, 1767–1777. [Google Scholar] [CrossRef]
- Estrada-Peña, A.; Ostfeld, R.S.; Peterson, A.T.; Poulin, R.; de la Fuente, J. Effects of environmental change on zoonotic disease risk: An ecological primer. Trends. Parasitol. 2014, 30, 205–214. [Google Scholar] [CrossRef]
- Huang, Z.Y.X.; van Langevelde, F.; Prins, H.H.T.; de Boer, W.F. The diversity–disease relationship: Evidence for and criticisms of the dilution effect. Parasitology 2016, 143, 1075–1086. [Google Scholar] [CrossRef]
- Bron, G.M.; del Pilar Fernandez, M.; Larson, S.; Maus, A.; Gustafson, D.; Tsao, J.I.; Diuk-Wasser, M.A.; Bartholomay, L.C.; Paskewitz, S.M. Context matters: Contrasting behavioral and residential risk factors for Lyme disease between two high-incidence regions in the Northeastern and Midwestern US. medRxiv 2020. [Google Scholar] [CrossRef] [Green Version]
- Sharareh, N.; Behler, R.P.; Roome, A.B.; Shepherd, J.; Garruto, R.M.; Sabounchi, N.S. Risk Factors of Lyme Disease: An Intersection of Environmental Ecology and Systems Science. Healthcare 2019, 7, 66. [Google Scholar] [CrossRef] [PubMed] [Green Version]
- Moon, K.A.; Pollak, J.; Poulsen, M.N.; Hirsch, A.G.; DeWalle, J.; Heaney, C.D.; Aucott, J.N.; Schwartz, B.S. Peridomestic and community-wide landscape risk factors for Lyme disease across a range of community contexts in Pennsylvania. Environ. Res. 2019, 178, 108649. [Google Scholar] [CrossRef] [PubMed]
- Fischhoff, I.R.; Bowden, S.E.; Keesing, F.; Ostfeld, R.S. Systematic review and meta-analysis of tick-borne disease risk factors in residential yards, neighborhoods, and beyond. BMC Infect. Dis. 2019, 19, 1–11. [Google Scholar]
- Needham, G.R.; Teel, P.D. Off-Host Physiological Ecology of Ixodid Ticks. Annu. Rev. Entomol. 1991, 36, 659–681. [Google Scholar] [CrossRef] [PubMed]
- Vail, S.; Smith, G. Vertical Movement and Posture of Blacklegged Tick (Acari: Ixodidae) Nymphs as a Function of Temperature and Relative Humidity in Laboratory Experiments. J. Med. Entomol. 2002, 39, 842–846. [Google Scholar] [CrossRef] [Green Version]
- Ostfeld, R.S.; Canham, C.D.; Oggenfuss, K.; Winchcombe, R.J.; Keesing, F. Climate, deer, rodents, and acorns as determinants of variation in Lyme-disease risk. PLoS. Biol. 2006, 4, e145. [Google Scholar] [CrossRef]
- Brownstein, J.S.; Holford, T.R.; Fish, D. Effect of climate change on Lyme disease risk in North America. EcoHealth 2005, 2, 38–46. [Google Scholar] [CrossRef] [Green Version]
- McCabe, G.J.; Bunnell, J.E. Precipitation and the occurrence of Lyme disease in the northeastern United States. Vector. Borne. Zoonotic. Dis. 2004, 4, 143–148. [Google Scholar] [CrossRef] [PubMed]
- Subak, S. Effects of climate on variability in Lyme disease incidence in the northeastern United States. Am. J. Epidemiol. 2003, 157, 531–538. [Google Scholar] [CrossRef] [PubMed] [Green Version]
- Horobik, V.; Keesing, F.; Ostfeld, R.S. Abundance and Borrelia burgdorferi-infection prevalence of nymphal Ixodes scapularis ticks along forest–field edges. EcoHealth 2006, 3, 262–268. [Google Scholar] [CrossRef] [Green Version]
- Millins, C.; Dickinson, E.R.; Isakovic, P.; Gilbert, L.; Wojciechowska, A.; Paterson, V.; Tao, F.; Jahn, M.; Kilbride, E.; Birtles, R. Landscape structure affects the prevalence and distribution of a tick-borne zoonotic pathogen. Parasite Vector. 2018, 11, 1–11. [Google Scholar] [CrossRef] [PubMed]
- VanAcker, M.C.; Little, E.A.; Molaei, G.; Bajwa, W.I.; Diuk-Wasser, M.A. Enhancement of Risk for Lyme Disease by Landscape Connectivity, New York, New York, USA. Emerg. Infect. Dis. 2019, 25, 1136. [Google Scholar] [CrossRef] [PubMed]
- Sharareh, N.; Sabounchi, N.S.; Roome, A.; Spathis, R.; Garruto, R.M. Model-based risk assessment and public health analysis to prevent Lyme disease. R. Soc. Open Sci. 2017, 4, 170841. [Google Scholar] [CrossRef] [Green Version]
- Suzán, G.; Esponda, F.; Carrasco-Hernández, R.; Aguirre, A. Habitat fragmentation and infectious disease ecology. In New Directions in Conservation Medicine: Applied Cases of Ecological Health; Aguirre, A., Ostfeld, R., Daszak, P., Eds.; Oxford University Press: New York, NY, USA, 2012; pp. 135–150. [Google Scholar]
- Ferrell, A.M.; Brinkerhoff, R.J. Using landscape analysis to test hypotheses about drivers of tick abundance and infection prevalence with Borrelia burgdorferi. Int. J. Environ. Res. Public Health 2018, 15, 737. [Google Scholar] [CrossRef] [Green Version]
- Brownstein, J.S.; Skelly, D.K.; Holford, T.R.; Fish, D. Forest fragmentation predicts local scale heterogeneity of Lyme disease risk. Oecologia 2005, 146, 469–475. [Google Scholar] [CrossRef]
- Frank, D.H.; Fish, D.; Moy, F.H. Landscape features associated with Lyme disease risk in a suburban residential environment. Landscape Ecol. 1998, 13, 27–36. [Google Scholar] [CrossRef]
- Li, S.; Hartemink, N.; Speybroeck, N.; Vanwambeke, S.O. Consequences of landscape fragmentation on Lyme disease risk: A cellular automata approach. PLoS ONE 2012, 7, e39612. [Google Scholar] [CrossRef] [Green Version]
- Eisen, R.J.; Piesman, J.; Zielinski-Gutierrez, E.; Eisen, L. What do we need to know about disease ecology to prevent Lyme disease in the northeastern United States? J. Med. Entomol. 2012, 49, 11–22. [Google Scholar] [CrossRef] [PubMed]
- Harris, I.; Jones, P.D.; Osborn, T.J.; Lister, D.H. Updated high-resolution grids of monthly climatic observations–the CRU TS3. 10 Dataset. Int. J. Climatol. 2014, 34, 623–642. [Google Scholar] [CrossRef] [Green Version]
- Wickham, J.; Homer, C.; Vogelmann, J.; McKerrow, A.; Mueller, R.; Herold, N.; Coulston, J. The multi-resolution land characteristics (MRLC) consortium—20 years of development and integration of USA national land cover data. Remote Sens. 2014, 6, 7424–7441. [Google Scholar] [CrossRef] [Green Version]
- Bown, K.J.; Begon, M.; Bennett, M.; Woldehiwet, Z.; Ogden, N.H. Seasonal dynamics of Anaplasma phagocytophila in a rodent-tick (Ixodes trianguliceps) system, United Kingdom. Emerg. Infect. Dis. 2003, 9, 63. [Google Scholar] [CrossRef] [PubMed] [Green Version]
- Jackson, L.E.; Hilborn, E.D.; Thomas, J.C. Towards landscape design guidelines for reducing Lyme disease risk. Int. J. Epidemiol. 2006, 35, 315–322. [Google Scholar] [CrossRef] [Green Version]
- Zuur, A.F.; Ieno, E.N.; Elphick, C.S. A protocol for data exploration to avoid common statistical problems. Methods Eco.l Evol. 2010, 1, 3–14. [Google Scholar] [CrossRef]
- Burnham, K.P.; Anderson, D.R.; Huyvaert, K.P. AIC model selection and multimodel inference in behavioral ecology: Some background, observations, and comparisons. Behav. Ecol. Sociobiol. 2011, 65, 23–35. [Google Scholar] [CrossRef]
- Bates, D.; Sarkar, D.; Bates, M.D.; Matrix, L. The lme4 package. R. Package Version 2007, 2, 74. [Google Scholar]
- Barton, K.; Barton, M.K. Package ‘MuMIn’. 17 November 2019. Available online: https://cran.r-project.org/web/packages/MuMIn/MuMIn.pdf (accessed on 17 November 2019).
- Werden, L.; Barker, I.K.; Bowman, J.; Gonzales, E.K.; Leighton, P.A.; Lindsay, L.R.; Jardine, C.M. Geography, deer, and host biodiversity shape the pattern of Lyme disease emergence in the Thousand Islands archipelago of Ontario, Canada. PLoS ONE 2014, 9, e85640. [Google Scholar] [CrossRef] [Green Version]
- Schauber, E.M.; Ostfeld, R.S.; Evans, J.; Andrew, S. What is the best predictor of annual Lyme disease incidence: Weather, mice, or acorns? Ecol. Appl. 2005, 15, 575–586. [Google Scholar] [CrossRef]
- Allan, B.F.; Keesing, F.; Ostfeld, R.S. Effect of forest fragmentation on Lyme disease risk. Conserv. Biol. 2003, 17, 267–272. [Google Scholar] [CrossRef] [Green Version]


| Predictors | Descriptions |
|---|---|
| Climatic predictors | |
| Pre_1 | Mean precipitation in previous spring |
| Pre_2 | Mean precipitation in previous summer |
| Pre_3 | Mean precipitation in previous autumn |
| Pre_4 | Mean precipitation in previous winter |
| MeanTem_1 | Mean temperature in previous spring |
| MeanTem_2 | Mean temperature in previous summer |
| MeanTem_3 | Mean temperature in previous autumn |
| MeanTem_4 | Mean temperature in previous winter |
| MaxTem_1 | Mean maximum temperature in previous spring |
| MaxTem_2 | Mean maximum temperature in previous summer |
| MaxTem_3 | Mean maximum temperature in previous autumn |
| MaxTem_4 | Mean maximum temperature in previous winter |
| Landscape factors | |
| CA_X 1 | Total area of a land cover class X |
| PLAND_X 1 | Percentage of area of a land cover class X |
| TE_X 1 | Total edge length of a land cover X at the region |
| ED_X 1 | Edge density of a land cover X at the region |
| DIST_O | Distance to the origin area of Lyme disease |
| Variables | Upper Midwest | Northeast | ||||
|---|---|---|---|---|---|---|
| Mean ± S.D. | b | t | Mean ± S.D. | b | t | |
| Dist_O | 125 ± 157 | −1.39 | −12.9 *** | 296 ± 248 | −1.25 | −12.5 *** |
| Climatic predictors 1 | ||||||
| Pre_1 | 100 ± 35.4 | −0.073 | −1.0 | 90.6 ± 29.3 | −0.056 | −1.15 |
| Pre_2 | 82.2 ± 24.5 | 0.23 | 3.51 *** | 114 ± 38.7 | −0.006 | −0.095 |
| Pre_3 | 72.0 ± 29.6 | −0.072 | −1.02 | 87.0 ± 26.7 | −0.098 | −2.09 * |
| Pre_4 | 54.9 ± 23.4 | −0.56 | −5.62 *** | 85.9 ± 18.7 | 0.067 | 1.13 |
| MeanTem_1 | 13.4 ± 5.41 | −0.066 | −1.07 | 13.2 ± 5.50 | 0.024 | 0.52 |
| MeanTem_2 | 24.4 ± 3.43 | −0.15 | −2.56 * | 24.3 ± 3.76 | 0.076 | 1.67 |
| MeanTem_3 | 13.9 ± 4.36 | −0.039 | −0.66 | 13.8 ± 4.36 | 0.003 | 0.07 |
| MeanTem_4 | 0.39 ± 6.99 | 0.008 | 0.13 | 2.41 ± 6.83 | −0.016 | −0.36 |
| MaxTem_1 | 15.1 ± 4.02 | −1.21 | −8.54 *** | 17.4 ± 3.88 | 0.58 | 4.12 *** |
| MaxTem_2 | 28.6 ± 2.07 | −0.74 | −6.47 *** | 28.6 ± 2.39 | 0.66 | 6.61 *** |
| MaxTem_3 | 16.40 ± 2.29 | −0.82 | −7.62 *** | 18.3 ± 3.02 | 0.44 | 3.73 *** |
| MaxTem_4 | 2.55 ± 4.67 | −1.33 | −9.32 *** | 6.25 ± 5.18 | 0.041 | 0.29 |
| Landscape predictors 2 | ||||||
| CA_21 | 7180 ± 4421 | 0.874 | 18.2 *** | 1.0E5 ± 7205 | 0.70 | 17.2 *** |
| PLAND_21 | 4.51 ± 2.75 | 0.68 | 14.2 *** | 7.14 ± 5.22 | 0.51 | 11.9 *** |
| TE_21 | 4.6E6 ± 2.3E6 | 0.95 | 18.3 *** | 6.1E6 ± 3.9E6 | 0.82 | 17.8 *** |
| ED_21 | 28.9 ± 13.2 | 0.72 | 15.0 *** | 42.2 ± 23.1 | 0.56 | 12.8 *** |
| CA_22 | 4786 ± 6960 | 0.76 | 17.6 *** | 5206 ± 5775 | 0.69 | 18.1 *** |
| PLAND22 | 3.21 ± 4.59 | 0.68 | 15.8 *** | 4.12 ± 4.97 | 0.56 | 13.1 *** |
| TE_22 | 3.1E6 ±3.3E6 | 0.76 | 17.7 *** | 3.7E6 ± 3.8E6 | 0.73 | 18.5 *** |
| ED_22 | 20.6 ± 22.7 | 0.70 | 16.0 *** | 28.4 ± 29.9 | 0.60 | 13.9 *** |
| CA_23 | 1887 ± 4573 | 0.84 | 19.2 *** | 2655 ± 4094 | 0.67 | 16.9 *** |
| PLAND_23 | 1.30 ± 0.64 | 0.67 | 14.9 *** | 2.51 ± 4.88 | 0.43 | 10.0 *** |
| TE_23 | 1.3E6 ± 2.5E6 | 0.77 | 17.8 *** | 1.7E6 ± 2.4E6 | 0.70 | 17.5 *** |
| ED_23 | 8.84 ± 17.1 | 0.66 | 15.1 *** | 15.6 ± 26.1 | 0.49 | 11.2 *** |
| CA_24 | 759 ± 2354 | 0.88 | 19.8 *** | 998 ± 1729 | 0.52 | 12.8 *** |
| PLAND_24 | 0.52 ± 1.37 | 0.64 | 14.1 *** | 1.24 ± 4.28 | 0.16 | 3.62 *** |
| TE_24 | 3.6E5 ± 9.0E5 | 0.83 | 18.9 *** | 5.1E5 ± 7.8E5 | 0.59 | 14.3 *** |
| ED_24 | 2.49 ± 5.80 | 0.65 | 14.5 *** | 5.44 ± 13.5 | 0.28 | 6.32 *** |
| CA_41 | 3.2E5 ± 3.2E5 | −0.05 | −0.64 | 4.8E5 ± 4.9E5 | 0.03 | 0.40 |
| PLAND_41 | 17.7 ± 13.9 | −0.19 | −2.91 ** | 26.3 ± 18.7 | 0.094 | 1.66 |
| TE_41 | 6.8E6 ± 6.1E6 | 0.19 | 1.96 | 9.7E6 ± 8.5E6 | 0.32 | 3.46 *** |
| ED_41 | 37.0 ± 19.7 | 0.053 | 0.77 | 55.1 ± 27.7 | 0.22 | 4.24 *** |
| CA_42 | 3293 ± 1.0E5 | −0.26 | −3.85 *** | 1.7E5 ± 3.5E5 | −0.75 | −7.27 *** |
| PLAND_42 | 1.21 ± 2.58 | −0.19 | −2.95 ** | 8.36 ± 8.81 | −0.57 | −9.74 *** |
| TE_42 | 1.3E6 ± 3.8E6 | −0.23 | −3.43 *** | 5.5E6 ± 9.4E6 | −0.78 | −6.45 *** |
| ED_42 | 4.98 ± 9.60 | −0.14 | −2.16 * | 27.7 ± 23.1 | −0.47 | −8.02 *** |
| CA_43 | 9616 ± 1.9E5 | −0.19 | −2.61 ** | 2.6E5 ± 4.7E5 | −0.52 | −4.41 *** |
| PLAND_43 | 4.11 ± 5.37 | −0.18 | −2.71 ** | 13.2 ± 9.62 | −0.097 | −1.67 |
| TE_43 | 4.3E6 ± 7.2E6 | −0.16 | −1.97 * | 1.0E7 ± 1.4E7 | −0.22 | −1.70 |
| ED_43 | 19.5 ± 20.4 | −0.12 | −1.78 | 54.4 ± 31.9 | 0.002 | 0.044 |
| Variables | Upper Midwest | Northeast | ||||
|---|---|---|---|---|---|---|
| b | Z | p-Value | b | Z | p-Value | |
| Dist_O | −1.12 | 12.8 *** | <0.001 | −0.60 | 5.02 *** | <0.001 |
| Climatic predictors 1 | ||||||
| PRE_2 | −0.004 | 0.22 | 0.827 | |||
| PRE_3 | −0.003 | 0.21 | 0.831 | |||
| MeanTem_2 | 0.02 | 0.565 | 0.827 | |||
| MaxTem_2 | 0.14 | 2.07 * | 0.038 | |||
| MaxTem_4 | 0.001 | 0.073 | 0.942 | |||
| Landscape predictors 2 | ||||||
| TE_21 | 0.42 | 4.66 *** | <0.001 | |||
| ED_21 | 0.36 | 5.09 *** | <0.001 | |||
| PLAND_22 | −0.022 | 0.471 | 0.637 | |||
| TE_22 | 0.72 | 11.76 *** | <0.001 | |||
| CA_24 | 0.05 | 1.10 | 0.270 | |||
| PLAND_24 | 0.16 | 4.85 *** | <0.001 | |||
| PLAND_41 | 0.34 | 6.65 *** | <0.001 | |||
| TE_41 | 0.060 | 0.469 | 0.638 | |||
| ED_41 | 0.30 | 4.09 *** | <0.001 | |||
| CA_42 | −0.002 | 0.118 | 0.906 | 0.036 | 0.34 | 0.731 |
| PLAND_42 | −0.22 | 3.03 ** | 0.002 | |||
| PLAND_43 | 0.003 | 0.165 | 0.869 | |||
© 2020 by the authors. Licensee MDPI, Basel, Switzerland. This article is an open access article distributed under the terms and conditions of the Creative Commons Attribution (CC BY) license (http://creativecommons.org/licenses/by/4.0/).
Share and Cite
Dong, Y.; Huang, Z.; Zhang, Y.; Wang, Y.X.G.; La, Y. Comparing the Climatic and Landscape Risk Factors for Lyme Disease Cases in the Upper Midwest and Northeast United States. Int. J. Environ. Res. Public Health 2020, 17, 1548. https://doi.org/10.3390/ijerph17051548
Dong Y, Huang Z, Zhang Y, Wang YXG, La Y. Comparing the Climatic and Landscape Risk Factors for Lyme Disease Cases in the Upper Midwest and Northeast United States. International Journal of Environmental Research and Public Health. 2020; 17(5):1548. https://doi.org/10.3390/ijerph17051548
Chicago/Turabian StyleDong, Yuting, Zheng Huang, Yong Zhang, Yingying X.G. Wang, and Yang La. 2020. "Comparing the Climatic and Landscape Risk Factors for Lyme Disease Cases in the Upper Midwest and Northeast United States" International Journal of Environmental Research and Public Health 17, no. 5: 1548. https://doi.org/10.3390/ijerph17051548