Article

Validation of the Brief Thai Version of the Work-Related Quality of Life Scale (Brief THWRQLS)

by
Teerayut Kongsin
1,
Naesinee Chaiear
1,2,*,
Nikom Thanomsieng
3 and
Sirintip Boonjaraspinyo
1
1
Division of Occupational Medicine, Department of Community Medicine, Faculty of Medicine, Khon Kaen University, Khon Kaen 40002, Thailand
2
Occupational Health and Safety Office, Faculty of Medicine, Khon Kaen University, Khon Kaen 40002, Thailand
3
Department of Biostatistics and Demography, Faculty of Public Health, Khon Kaen University, Khon Kaen 40002, Thailand
*
Author to whom correspondence should be addressed.
Int. J. Environ. Res. Public Health 2020, 17(5), 1503; https://doi.org/10.3390/ijerph17051503
Submission received: 3 February 2020 / Revised: 21 February 2020 / Accepted: 23 February 2020 / Published: 26 February 2020

Abstract

:
The Work-Related Quality of Life Scale (WRQLS) was developed by Van Laar et al. The Thai version was developed and could be completed in 13.4 min on average with some items having a factor loading of less than 0.4. The aims of this study were (a) to develop a brief Thai version of the WRQLS (brief THWRQLS), and (b) to assess its validity and reliability. A descriptive correlation study was performed with the components of THWRQLS selected based on statistical and judgmental criteria. The statistical criteria were developed using secondary data from 320 physicians identifying discrimination, internal consistency and exploratory factor analysis (EFA). The judgmental criteria included content validity and agreement by five experts. The web-based brief THWRQLS was then used by 250 health personnel, and confirmatory factor analysis (CFA) was conducted and internal consistency assessed. The brief THWRQLS consisted of seven dimensions, encompassing 25 of the original 32 items. The CFA revealed that most of the standardized factor loadings were greater than 0.5. The χ2goodness of fit was 268.772 (p < 0.01), the comparative fit index was 0.971, the root mean square error of approximation was 0.039, and the standardized root mean square residual was 0.049. The Cronbach’s alpha coefficient of the scale was 0.94, and almost all dimensions were greater than 0.7 except for that of “stress at work,” which was 0.53. In conclusion, the brief THWRQLS appeared to be valid, and the reliability was acceptable, except in the dimension of “stress at work.”

1. Introduction

Quality of work-life refers to all of the organizational inputs that aim to enhance employee satisfaction and organizational effectiveness [1]. According to Walton, the idea of the quality of work-life, which developed during the 1970s, includes the values “human needs and aspirations”, “adequate and fair compensation for work”, and “social relevance of work” [2].
Most organizations encounter psychosocial stressors, especially hospitals. Healthcare professionals suffer from various psychosocial stressors in their workplaces, such as role conflict, emotional labor, being concerned about medical errors and litigation, as well as experiencing verbal or physical abuse by patients and caregivers or bullying by colleagues [3,4]. In addition, healthcare professionals have a much greater chance of being exposed to long working hours, night work, or shift work and conflict among co-workers. These stressors affect the quality of work-life and can lead to burnout, depression, anxiety disorders, sleep disorders, or other psychiatric disorders [5,6,7,8,9].
Tools for assessing the quality of work-life should have good psychometric properties. Initially, before the development of a questionnaire for evaluating the quality of work life, quality of life (QoL) was used as a proxy to assess the quality of work-life [10,11,12]. The 23-item Work-related Quality of Life Scale (WRQLS), which was first developed in England by Van Laar et al., was developed based on six factors: job and career satisfaction (JCS), general well-being (GWB), home–work interface (HWI), stress at work (SAW), control at work (CAW), and working conditions (WCS). Its validity and reliability have been established among medical personnel in the United Kingdom [13], and it has been used in various types of organizations and translated into 13 languages (including Thai) [14]. The WRQLS-2 was a modified version of the WRQLS that initially consisted of six factors and 34 items, that was later adjusted to comprise seven factors, adding employee engagement EET) and 32 items. According to Sirisawasd et al., the reliability (Cronbach’s α of 0.671–0.82) and validity (Cronbach’s α of 0.92) of the Thai version of the tool (THWRQLS) was sufficient to assess the quality of work-life among nurses in Thailand. However, the THWRQLS is time-consuming, taking an average of 13.4 min to complete (SD = 4.58 min, range 8–20 min) [15]. In addition, a seven-factor model generated from the principal component factor analysis found that five items have factor loadings of less than 0.4, and Somsila et al. [16] found that the content of some items overlapped. This suggests that the original 32-item scale contains several items that tend not to perform well psychometrically.
Questionnaires provide for a large amount of people or a time-limited organization, but the content should be concise, easily understood and contain a suitable number of items that still retain good psychometric properties [17]. Therefore, the objectives of this research were to develop a brief Thai version of the work-related quality of life scale (brief THWRQLS) that would reduce the amount of content without sacrificing measurement precision, and to assess its validity and reliability.

2. Materials and Methods

2.1. The Selection of Components to be Included in the Brief THWRQLS

The brief Thai version of the work-related quality of life scale (Brief THWRQLS) was developed based on the items included in the original 32-item scale. The selection of items to be included was based on expert consensus using data based on statistical and judgmental criteria. The statistical criteria were developed based on statistical analysis of secondary data obtained by Soonthornvinit et al. [18] in a study on the quality of work-life among doctors in the northeastern region of Thailand. In the factor analysis literature, the minimum sample size necessary to obtain factor solutions that are adequately stable and that correspond closely to population factors should be at least 10 times the number of items. [19]. As the THWRQLS has 32 items, a sample size of 320 was used. Three statistical criteria were also used. The first was discrimination—the power of an item to separate respondents with good and poor quality of work-life, which was analyzed using a t-test or Mann–Whitney U test. The second was the item-total correlation, evaluated using the correlation among the scores for each item. The average of the correlation of the remaining tests that were still candidates for inclusion in the measurement was more than 0.3 [20]. The third criterion was based on exploratory analysis, which aimed to reduce the number of items in the questionnaire while retaining scale reliability. A principal component analysis (PCA) was carried out on the THWRQLS data set, and a low loading variable factor reduction process was used to reduce the number of variables in the original scale. Items with a loading of less than 0.4 were removed from the item set [21].
Judgmental criteria consisted of expert evaluation of content validity and agreement in terms of item selection. Five experts who had experience in the psychometric properties of the questionnaire were included in the study. The content validity was measured using the item content validity index (I-CVI), with a score of 0.8 or higher, indicating excellent content validity [22]. Agreement regarding item selection was determined using a four-point Likert scale. Items were included in the brief THWRQLS if there was strong agreement, as indicated by an average score greater than 3. A conference was then arranged to allow the experts to reach a consensus on the item selection.

2.2. Validity and Reliability of the Brief THWRQLS

2.2.1. Participants and Data Collection

Health personnel at the Khon Kaen University (KKU) Faculty of Medicine (Khon Kaen, Thailand) completed a self-administered online survey based on the brief THWRQLS from April 1 to June 30, 2019. To be included in this study, the participants had to have been working at the KKU Faculty of Medicine for at least one month. Health personnel who were on sabbatical leave were excluded. We calculated our minimum sample size as 10 times the number of items in the scale [19]. Considering that the brief THWRQLS contained 25 items and factoring in a 30% expected loss, we determined that 360 sets of questionnaires would need to be distributed to the target health personnel. After the selection of components to be included in the brief THWRQLS, the online website questionnaire was developed by a programmer. The self-administration online questionnaire contained two parts, the brief THWRQLS, and personal and occupational information. Participants with incomplete answers were not able to submit answers.

2.2.2. Data Analysis

Stata 15 (StataCorp, USA) was used for data analysis. A confirmatory factor analysis was performed to analyze the construct validity of the scale. Standardized factor loading and the data-model fit evaluation based on the Chi-square goodness-of-fit index, Comparative Fit Index (CFI), Root Mean Square Error of Approximation (RMSEA), and Standardized RMR (SRMR) were used. Cronbach’s alpha values were calculated to test the internal consistency. A Cronbach’s alpha of greater than 0.7 was considered as consistent [23]. However, a Cronbach’s alpha of 0.6 was acceptable in this study because there were fewer items in some dimensions than in others.

3. Results

3.1. Development of the Brief THWRQLS

Statistical and judgmental criteria were used to eliminate items from the scale. Statistical criteria were based on discrimination analysis, item-total correlation, and exploratory factor analysis. All items in the THWRQLS were statistically significant (p <0.01) according to discrimination analysis, demonstrating that they had discrimination power. In terms of item-total correlation, only SAW3 had a Pearson correlation of less than 0.3, indicating that it should be eliminated from the original scale. For the exploratory factor analysis, a seven-factor model was generated from the principal component analysis. Twelve items (CAW3, HWI4, GWB1, GWB3, GWB5, GWB6, JCS4, JCS5, JCS6, WCS3, WCS4, and SAW3) had factor loadings of less than 0.4, and it was therefore decided that they should be eliminated from the item set (Table 1). Judgmental criteria consisted of content validity and agreement on item selection. In terms of content validity, four items (EET1, HWI2, HWI3, and GWB4) had I-CVI of less than 0.8, indicating that they should be eliminated. Regarding agreement on item selection, five items (EET1, CAW3, GWB1, GWB3, and SAW4) had an average score of less than 3, making them candidates for elimination from the original scale (Table 1).
Item selection was based on expert consensus. The results of the analyses above were presented to the experts to help them with the decision-making process. The result was the elimination of EET1, CAW2, HWI3, GWB1, GWB3, WCS3, and SAW2 from the THWRQLS (Table 1), leaving seven dimensions with 24 items and one overall item in the final scale. The content of each item in brief THWRQLS were shown in Appendix A.

3.2. Validation and Reliability of the Brief THWRQLS

3.2.1. Characteristics of the Participants

Out of 350 invited employees, 250 completed the questionnaire (response rate 71.4%). Forty-six percent of the 250 participants were between 20 and 30 years old. Two hundred and eleven (84.4%) were female, 53.2% were single, and 63.2% had at least one underlying disease. Most were nurses and practitioners (67.6% and 92.8%, respectively). Most of the participants (64.8%) worked 50 to 100 hour per week, and 45.2% had work experience of less than or equal to 5 years (Table 2).

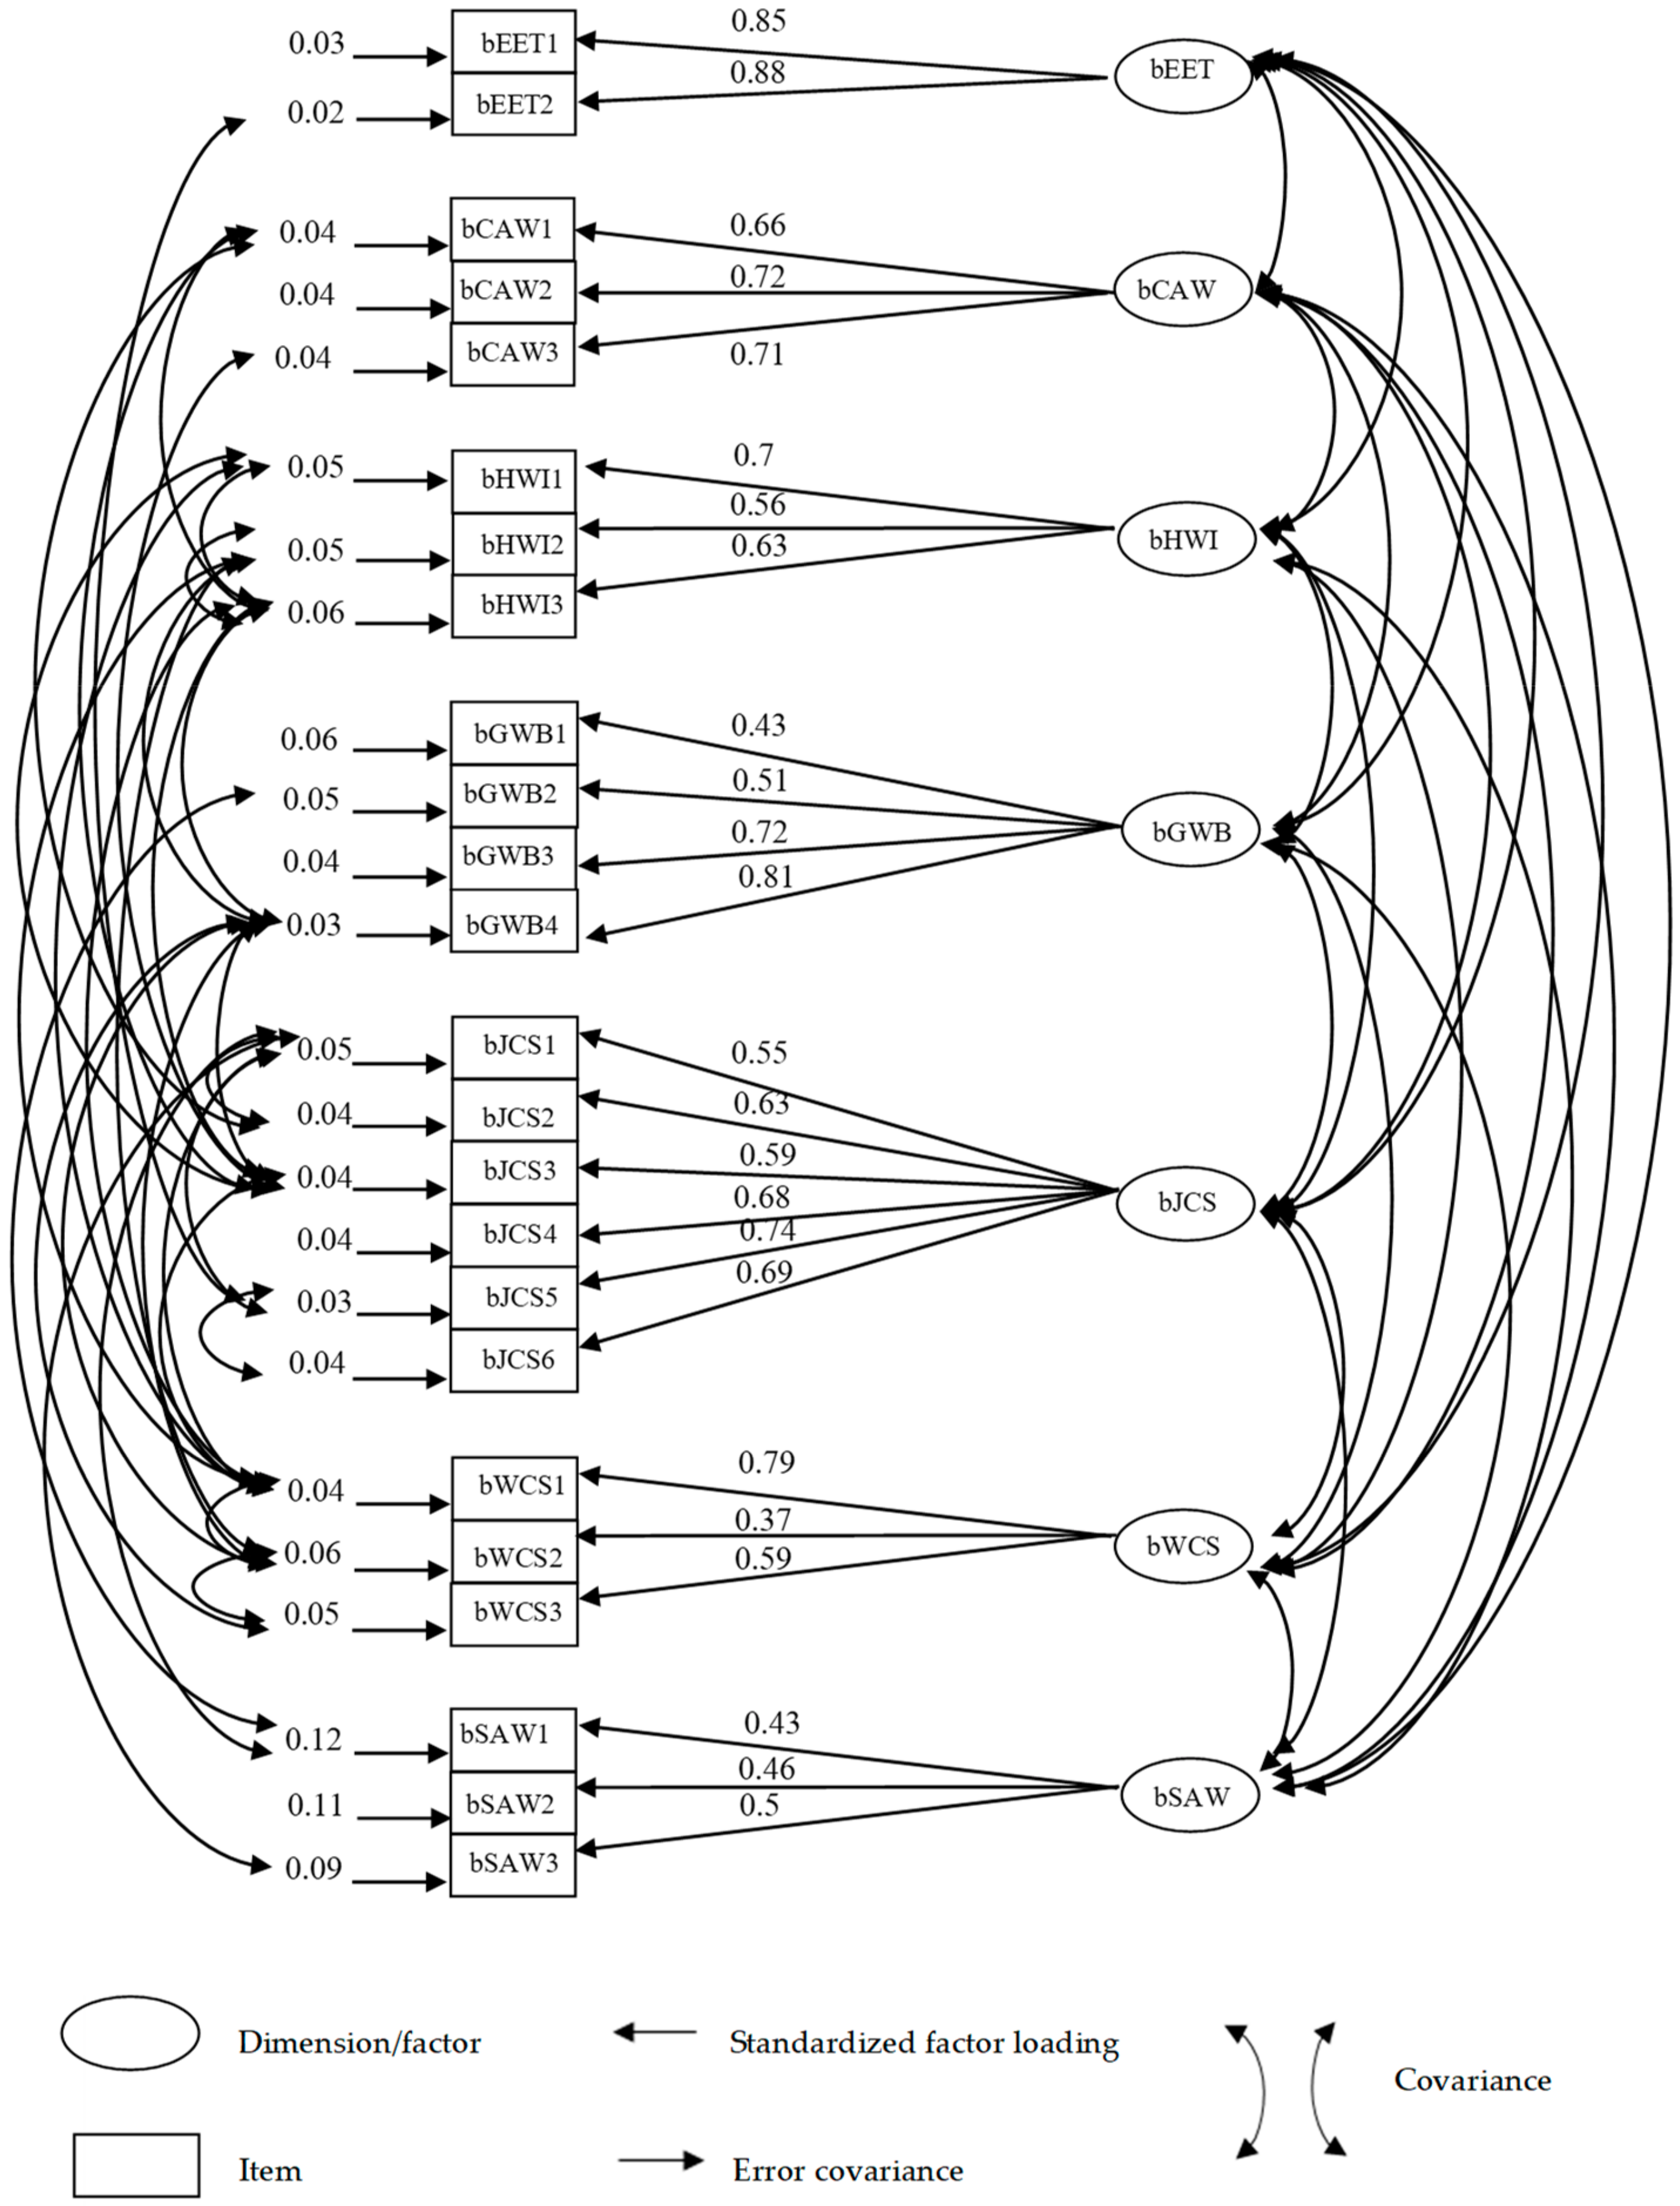
3.2.2. Construct Validity of the Brief THWRQLS

Confirmatory factor analysis for the seven-factor, 24-item model was conducted in all participants and revealed four items (bGWB1, bWCS2, bSAW1, bSAW3) to be problematic, with standardized factor loadings below 0.50. Standardized factor loadings across the 24 items ranged from 0.37 to 0.88 (Table 3). We determined that the model shown in Figure 1 provided an acceptable fit based on its goodness-of-fit statistics (Chi-square = 268.77, p-value < 0.01, CFI = 0.97, RMSEA = 0.04 and SRMR = 0.05).

3.2.3. Internal Consistency of the Brief THWRQLS

The internal consistency of the overall scale and subscale based on this model were satisfactory. The calculated Cronbach’s alpha value for the seven subscales ranged from 0.53 to 0.8, and that of the overall scale was 0.94 (Table 4).

4. Discussion

The purpose of this study was to develop and evaluate the psychometric characteristics of the brief THWRQLS. The selection of THWRQLS components was conducted based on expert consensus using statistical and judgmental criteria and thus relied on both statistical analysis and expert decision-making. The advantage of using statistical criteria is that they can be used to make quantitative comparisons [24]. However, the results of statistical analysis conducted using data from physicians may not be generalizable to other occupations. In addition, statistical analysis does not take the content of the question into account. Expert opinions based on knowledge, experience, and evidence, on the other hand, are able to reliably explain work-life discrepancies [25]. The appointed experts’ study decided to eliminate seven items which did not meet the criteria, were overly similar to other items, were unclear, or were not related to the dimensions in which they were included.
Test validity is important in the development of any tool because it indicates the usefulness and effectiveness of each component of the scale [26]. The scale’s construct validity was tested using confirmatory factor analysis. We found that there was one item in the “general well-being” dimension, one item in the “working conditions” dimension, and two items in the “stress at work” dimension that had standardized factor loadings of less than 0.5 which may be due to most items being negatively framed or dealing with sensitive issues, which could result in people giving neutral responses to avoid expressing their true opinions or feelings [27] and therefore affecting the validity or reliability of the questionnaire. The other reason is that this scale is multidimensional. The exploratory factor analysis can answer how many dimensions should consist of this scale [28]. However, dividing into seven dimensions is useful to assess each problem to solve the problem on each dimension. Confirmatory factor analysis found this to be a well-fitting model, but there were many pairs of items with high covariance that could be grouped in the same dimension to reduce the overall number of dimensions. The internal consistency of the overall scale and subscale based on this model were satisfactory. The Cronbach’s alpha coefficient of the scale overall was 0.94, and most of the dimensions were greater than 0.7. The one exception was “stress at work,” which had a Cronbach’s alpha coefficient of 0.53. A low value of alpha could be due to a low number of questions, with poor correlation between items meaning that then some should be revised or discarded. The easiest method to find them is to compute the correlation of each test item with the total score test, deleting items with low correlations (approaching zero) [23].

5. Conclusions

The brief THWRQLS was shown to have appropriate psychometric properties, as evidenced by the construct validity and internal consistency and can, therefore, be used to evaluate the quality of work-life of healthcare personnel. Besides, the brief THWRQLS was divided into seven dimensions, allowing the results of this assessment to be used to solve each problem. Finally, some limitations remain. This study was conducted with health personnel, who may not be a representative sample. It needs to proceed to further research with other occupations. In future, the brief THWRQLS should be used widely to assess the quality of working life, to understanding problems of the questionnaire and the opinions of the users.

Author Contributions

Conceptualization, T.K. and N.C.; Formal analysis, T.K., N.C. and N.T.; Investigation, N.C.; Methodology, T.K., N.C. and S.B.; Resources, N.T.; Supervision, N.C.; Validation, N.C.; Writing—Original draft, T.K.; Writing—Review & editing, N.C. All authors have read and agreed to the published version of the manuscript.

Funding

This research was funded by the Faculty of Medicine, Khon Kaen University, Khon Kaen, Thailand (grant no. IN62209).

Acknowledgments

The authors wish to thank all health personnel who participated in the study and financially supported by the Faculty of Medicine, Khon Kaen University.

Conflicts of Interest

The authors declare no conflict of interest.

Appendix A

Table A1. The content of brief THWRQLS.
To What Extent do you Agree with the Following?Strongly DisagreeDisagreeNeutralAgreeStrongly Agree
1bJCS1I have a clear set of goals and aims to enable me to do my job.
2bCAW1I feel able to voice opinions and influence changes in my area of work.
3bJCS2I have the opportunity to use my abilities at work.
4bHWI1My employer provides adequate facilities and flexibility for me to fit work in around my family life.
5bHWI2My current working hours / patterns suit my personal circumstances.
6bSAW1I often feel under pressure at work.
7bJCS3When I have done a good job, it is acknowledged by my line manager.
8bGWB2Recently, I have been feeling unhappy and depressed.
9bJCS4I am encouraged to develop new skills.
10bCAW2I am involved in decisions that affect me in my own area of work.
11bWCS1My employer provides me with what I need to do my job effectively.
12bGWB4In most ways my life is close to ideal.
13bWCS2I work in a safe environment.
14bGWB5Generally, things work out well for me.
15bJCS5I am satisfied with the career opportunities available for me here.
16bJCS6I am satisfied with the training I receive in order to perform my present job.
17bGWB6Recently, I have been feeling reasonably happy all things considered.
18bSAW3I have unachievable deadlines.
19bHWI4I am able to achieve a healthy balance between my work and home life.
20bEET2I am proud to tell others that I am part of this organization.
21bEET3I would recommend this organization as a good one to work for.
22bSAW4I am pressured to work long hours.
23bCAW4I have sufficient opportunities to question managers about change at work.
24bWCS4I am happy with the physical environment where I usually work.
25bOVLI am satisfied with the overall quality of my working life.
Note. bEET = Employee Engagement (brief), bCAW = Control at Work (brief), bHWI = Home-Work Interface (brief), bGWB = General Well-Being (brief), bJCS = Job and Career Satisfaction (brief), bWCS = Working Conditions (brief), bSAW = Stress at Work (brief) and bOVL = overall (brief).

References

  1. Davis, K. Quality of work life in human behavior at work. In Human Behavior at Work: Organizational Behavior, 6th ed.; McGraw-Hill: New York, NY, USA, 1981; pp. 285–286. [Google Scholar]
  2. Walton, R.E. Improving the quality of work life. Harv. Bus. Rev. 1975, 7, 14–16. [Google Scholar]
  3. Firth-Cozens, J.; Greenhalgh, J. Doctors’ perceptions of the links between stress and lowered clinical care. Soc. Sci. Med. 1997, 44, 1017–1022. [Google Scholar] [CrossRef]
  4. Ruotsalainen, J.; Serra, C.; Marine, A.; Verbeek, J. Systematic review of interventions for reducing occupational stress in health care workers. Scand. J. Work Environ. Health 2008, 34, 169–178. [Google Scholar] [CrossRef] [PubMed]
  5. Michie, S.; Williams, S. Reducing work related psychological ill health and sickness absence: A systematic literature review. Occup. Environ. Med. 2003, 60, 3–9. [Google Scholar] [CrossRef] [PubMed] [Green Version]
  6. Embriaco, N.; Papazian, L.; Kentish-Barnes, N.; Pochard, F.; Azoulay, E. Burnout syndrome among critical care healthcare workers. Curr. Opin. Crit. Care 2007, 13, 482–488. [Google Scholar] [CrossRef] [PubMed]
  7. Hegney, D.G.; Craigie, M.; Hemsworth, D.; Osseiran-Moisson, R.; Aoun, S.; Francis, K.; Drury, V. Compassion satisfaction, compassion fatigue, anxiety, depression and stress in registered nurses in Australia: Study 1 results. J. Nurs. Manag. 2014, 22, 506–518. [Google Scholar] [CrossRef] [PubMed]
  8. Kim, K.; Lee, S.; Choi, Y.H. Relationship between occupational stress and depressive mood among interns and residents in a tertiary hospital, Seoul, Korea. Clin. Exp. Emerg. Med. 2015, 2, 117–122. [Google Scholar] [CrossRef] [PubMed] [Green Version]
  9. Tomioka, K.; Morita, N.; Saeki, K.; Okamoto, N.; Kurumatani, N. Working hours, occupational stress and depression among physicians. Occup. Med. 2011, 61, 163–170. [Google Scholar] [CrossRef] [PubMed] [Green Version]
  10. Cheawchanwattana, A.; Limwattananon, C.; Gross, C.; Limwattananon, S.; Tangcharoensathien, V.; Pongskul, C.; Sirivongs, D. The validity of a new practical quality of life measure in patients on renal replacement therapy. J. Med. Assoc. Thai. 2006, 89 (Suppl. 2), S207–S217. [Google Scholar] [PubMed]
  11. Tangtrakulwanich, B.; Wiwatwongwana, S.; Chongsuvivatwong, V.; Geater, A.F. Comparison of validity, and responsiveness between general and disease-specific quality of life instruments (Thai version) in knee osteoarthritis. J. Med. Assoc. Thai. 2006, 89, 1454–1459. [Google Scholar] [PubMed]
  12. Laosanguanek, N.; Wiroteurairuang, T.; Siritho, S.; Prayoonwiwat, N. Reliability of the Thai version of SF-36 questionnaire for an evaluation of quality of life in multiple sclerosis patients in multiple sclerosis clinic at Siriraj Hospital. J. Med. Assoc. Thai. 2011, 94 (Suppl. 1), S84–S88. [Google Scholar] [PubMed]
  13. Van Laar, D.; Edwards, J.A.; Easton, S. The work-related quality of life scale for healthcare workers. J. Adv. Nurs. 2007, 60, 325–333. [Google Scholar] [CrossRef] [PubMed]
  14. Quality of Working Life. Translating QoWL Scales and Surveys. Available online: https://bit.ly/30QdH7Y (accessed on 5 October 2018).
  15. Sirisawasd, P.; Chaiear, N.; Johns, N.P.; Khiewyoo, J. Validation of the Thai version of a work-related quality of life scale in the nursing profession. Saf. Health Work 2014, 5, 80–85. [Google Scholar] [CrossRef] [PubMed] [Green Version]
  16. Somsila, N.; Chaiear, N.; Tiamkao, S. Work-related quality of life among medical residents at a University Hospital in Northeastern Thailand. J. Med. Assoc. Thai. 2015, 98, 1244–1253. [Google Scholar] [PubMed]
  17. Ercan, I.; Yazici, B.; Ocakoglu, G.; Sigirli, D.; Kan, I. Review of Reliability and Factors Affecting the Reliability. Available online: https://bit.ly/2LQoI5g (accessed on 28 October 2018).
  18. Soonthornvinit, W.; Chaiear, N. Quality of working life (QoWL) among doctors in the university hospitals in the Northeastern Thailand. J. Med. Assoc. Thai. 2019, 102 (Suppl. 1), S39–S46. [Google Scholar]
  19. MacCallum, R.C.; Widaman, K.F.; Zhang, S.; Hong, S. Sample size in factor analysis. Psychol. Methods 1999, 4, 84–99. [Google Scholar] [CrossRef]
  20. Streiner, D.L.; Norman, G.R. Health Measurement Scales: A Practical Guide to Their Development and Use, 4th ed.; Oxford University Press: Oxford, UK, 2008. [Google Scholar]
  21. Pett, M.A.; Lackey, N.R.; Sullivan, J.J. Making Sense of Factor Analysis: The Use of Factor Analysis for Instrument Development in Health Care Research; Sage: Thousand Oaks, CA, USA, 2003. [Google Scholar]
  22. Polit, D.F.; Beck, C.T.; Owen, S.V. Is the CVI an acceptable indicator of content validity? Appraisal and recommendations. Res. Nurs. Health 2007, 30, 459–467. [Google Scholar] [CrossRef] [PubMed]
  23. Tavakol, M.; Dennick, R. Making sense of Cronbach’s alpha. Int. J. Med. Educ. 2011, 2, 53–55. [Google Scholar] [CrossRef] [PubMed]
  24. Rahman, M. The advantages and disadvantages of using qualitative and quantitative approaches and methods in language “testing and assessment” research: A literature review. J. Educ. Learn. 2016, 6, 102. [Google Scholar] [CrossRef]
  25. Wieten, S. Expertise in Evidence-Based Medicine: A Tale of Three Models. Philos Ethics Humanit Med. 2018. Available online: https://bit.ly/2LNshsG (accessed on 5 September 2019).
  26. Allen, M.J.; Yen, W.M. Introduction to Measurement Theory; Waveland: Prospect Heights, IL, USA, 2002. [Google Scholar]
  27. Edwards, M.L.; Smith, B.C. The Effects of the Neutral Response Option on the Extremeness of Participant Responses. 2019. Available online: https://bit.ly/31P1cev (accessed on 20 July 2019).
  28. Ximénez, C. Recovery of weak factor loadings when adding the mean structure in confirmatory factor Analysis: A Simulation Study. Front Psychol. 2016, 6, 1943. [Google Scholar] [CrossRef] [PubMed] [Green Version]
Figure 1. Confirmatory factor analysis of the seven-factor, 24-item brief THWRQLS model (n = 250). goodness-of-fit statistics for the structure model: χ2 = 268.77, p-value < 0.01, CFI = 0.97, RMSEA = 0.04, SRMR = 0.05.
Ijerph 17 01503 g001
Table 1. Item selection of brief Thai version of the Work-Related Quality of Life Scale (THWRQLS).
Items of THWRQLS Statistical CriteriaJudgmental CriteriaItems of Brief THWRQLS
Discrimination (p-Value)Item-Total CorrelationFactor LoadingI-CVIsExpert Agreement
EET 1<0.010.520.590.42.8-
EET 2<0.010.720.7414bETT 1
EET 3<0.010.740.6613.8bETT 2
CAW 1<0.010.620.5913.8bCAW 1
CAW 2<0.010.650.5513.8bCAW 2
CAW 3<0.010.560.350.82.8-
CAW 4<0.010.650.520.83.6bCAW 3
HWI 1<0.010.720.5913.6bHWI 1
HWI 2<0.010.690.630.63.2bHWI 2
HWI 3<0.010.730.440.63-
HWI 4<0.010.640.3914bHWI 3
GWB 1<0.010.760.360.82.6-
GWB 2<0.010.620.6413.6bGWB 1
GWB 3 <0.010.730.3212.8-
GWB 4<0.010.720.440.63bGWB 2
GWB 5<0.010.750.370.83.6bGWB 3
GWB 6<0.010.790.360.84bGWB 4
JCS 1<0.010.410.5913.8bJCS 1
JCS 2<0.010.580.7313.2bJCS 2
JCS 3<0.010.540.510.83.2bJCS 3
JCS 4<0.010.660.2713bJCS 4
JCS 5<0.010.720.2913.6bJCS 5
JCS 6<0.010.620.310.83.2bJCS 6
WCS 1<0.010.630.5313.4bWCS 1
WCS 2<0.010.650.6314bWCS 2
WCS 3<0.010.780.2813.4-
WCS 4<0.010.660.370.84bWCS 3
SAW 1<0.010.470.5914bSAW 1
SAW 2<0.010.500.7814-
SAW 3<0.010.240.370.83.2bSAW 2
SAW 4<0.010.390.550.82.8bSAW 3
OVL<0.010.82-0.83.6bOVL
Note. EET = employee engagement, CAW = control at work, HWI = home-work interface, GWB = general well-being, JCS = job and career satisfaction, WCS = working conditions, SAW = stress at work and OVL = overall.
Table 2. Characteristics of the participants.
CharacteristicsFrequency (n = 250)%
SexMale3915.6
Female21184.4
Age (y)20–3011546.0
31–405923.6
41–504016.0
51–603614.4
Marital statusSingle13353.2
Married9939.6
Divorced/Separated/Widowed187.2
Underlying diseaseNo9236.8
Yes15863.2
ProfessionDoctor/Dentist4819.2
Nurse16967.6
Pharmacist145.6
Others197.6
Work roleLeaders187.2
Practitioners23292.8
Years of workUp to 5 years11345.2
>5 to 15 years8032.0
>15 years5722.8
Working hoursUp to 50 h per week4718.8
>50 to 100 h per week16264.8
>100 h per week4116.4
Table 3. Standardized factor loading based on confirmatory factor analysis of the brief THWRQLS.
ItemsConfirmatory Factor Analysis
Standardized Factor Loading95% CIP-Value
bEET 10.850.9–5.460.00
bEET 20.880.92–4.890.00
bCAW 10.660.74–5.60.00
bCAW 20.720.8–5.10.00
bCAW 30.710.8–5.00.00
bHWI 10.700.8–4.840.00
bHWI 20.560.67–3.670.00
bHWI 30.630.74–4.26 0.00
bGWB 10.430.54–3.280.00
bGWB 20.510.6–3.840.00
bGWB 30.720.79–5.580.00
bGWB 40.810.86–5.00.00
bJCS 10.550.64–5.820.00
bJCS 20.630.72–5.960.00
bJCS 30.590.68–4.830.00
bJCS 40.680.75–4.870.00
bJCS 50.740.8–5.20.00
bJCS 60.690.77–5.450.00
bWCS 10.790.86–4.740.00
bWCS 20.370.5–4.160.00
bWCS 30.590.69–4.30.00
bSAW 10.430.66–3.680.00
bSAW 20.460.67–3.410.00
bSAW 30.500.68–3.470.00
Note. bEET = employee engagement (brief), bCAW = control at work (brief), bHWI = home-work interface (brief), bGWB = general well-being (brief), bJCS = job and career satisfaction (brief), bWCS = working conditions (brief) and bSAW = stress at work (brief).
Table 4. Internal consistency of the brief THWRQLS.
FactorCronbach’s Alpha
bEET0.8
bCAW0.73
bHWI0.74
bGWB0.8
bJCS0.78
bWCS0.71
bSAW0.53
Overall Scale0.94
Note. bEET = employee engagement (brief), bCAW = control at work (brief), bHWI = home-work interface (brief), bGWB = general well-being (brief), bJCS = job and career satisfaction (brief), bWCS = working conditions (brief) and bSAW = stress at work (brief).

