Article

Does Particulate Matter Modify the Short-Term Association between Heat Waves and Hospital Admissions for Cardiovascular Diseases in Greater Sydney, Australia?

1
Climate Change Research Centre, University of New South Wales, Sydney, NSW 2052, Australia
2
ARC Centre of Excellence for Climate Extremes, University of New South Wales, Sydney, NSW 2052, Australia
3
Australia and NHMRC Centre for Air Pollution, Energy and Health Research, University of Sydney, Sydney, NSW 2052, Australia
4
School of Public Health, University of Sydney, Sydney, NSW 2006, Australia
5
Faculty of Health, University of Technology Sydney, Sydney, NSW 2007, Australia
*
Author to whom correspondence should be addressed.
Int. J. Environ. Res. Public Health 2019, 16(18), 3270; https://doi.org/10.3390/ijerph16183270
Submission received: 20 January 2019 / Revised: 30 July 2019 / Accepted: 31 July 2019 / Published: 5 September 2019

Abstract

:
Little is known about the potential interactive effects of heat waves and ambient particulate matter on cardiovascular morbidity. A time-stratified case-crossover design was used to examine whether particulate matter (PM10) modifies the association between heat waves and emergency hospital admissions for six cardiovascular diseases in Greater Sydney, Australia during the warm season for 2001–2013. We estimated and compared the effect of heat waves on high- and low-level PM10 days at lag0–lag2, adjusting for dew-point temperature, ambient ozone, ambient nitrogen dioxide, and public holidays. We also investigated the susceptibility of both younger (0–64 years) and older populations (65 years and above), and tested the sensitivity of three heat wave definitions. Stronger heat wave effects were observed on high- compared to low-level PM10 days for emergency hospital admissions for cardiac arrest for all ages combined, 0–64 years and 65 years and above; conduction disorders for 0–64 years; and hypertensive diseases for all ages combined and 0–64 years. Overall, we found some evidence to suggest that PM10 may modify the association between heat waves and hospital admissions for certain cardiovascular diseases, although our findings largely differed across disease, age group, lag, and heat wave definition.

1. Introduction

Cardiovascular disease is a major cause of death both worldwide and in Australia [1,2]. Some studies have shown that high temperatures and heat waves are associated with increased risk of hospitalisation for cardiovascular diseases generally [3,4,5], and specific cardiovascular diseases including ischemic heart disease and cardiac (or heart) dysrhythmias [3,4,6]. Elevated temperature and heat waves have also been shown to be associated with an increased risk of out-of-hospital cardiac arrest [7]. A short lag effect has been observed, with positive associations between high temperatures and hospitalisations for cardiovascular diseases reported on the same day of exposure [4] and between 1–3 days after exposure [3]. Other studies, however, including two meta-analyses, have reported null or negative associations between high temperatures and hospital admissions for cardiovascular diseases [8,9,10,11], but Phung et al. [10] reported a small, positive heat wave effect.
Ambient particulate matter with an aerodynamic diameter less than 10 μm, known as particulate matter (PM10), is comprised of both solid particles and liquid droplets from natural and anthropogenic sources [12]. Levels and mixtures of PM10 can depend on season and temperature, with bushfire smoke and dust storms being important sources during the warm season in Australia, and wood heaters an important source in the cool season [13]. Studies have shown that elevated levels of PM10 are associated with an increased risk of hospitalisation for all cardiovascular or cardiac diseases [14,15,16] and specific diseases including ischemic heart disease [17,18], heart failure [19], and heart arrhythmias and conduction disorders [15], particularly among the elderly. Elevated levels of PM10 have also been shown to be associated with an increased risk of out-of-hospital cardiac arrest [20]. A few studies have assessed, or controlled for, the potential confounding effects of PM10 when estimating the association between extreme heat and hospitalisations for cardiovascular diseases (e.g., [21,22]).
Little is known about the potential joint or interactive effects of high temperatures, particularly heat waves, and PM10 on cardiovascular health outcomes. This is concerning given that the joint effect of weather and air pollution on health outcomes is thought to be greater than the risk derived from the individual impacts of these two exposures [23]. There is also some suggestion that an interactive effect between air pollution and temperature may be biologically plausible [24]. Some studies from Europe and Asia have investigated whether temperature modifies the association between PM10 and all-cause and/or cardiovascular mortality [25,26,27,28,29,30]. Most of these studies have generally found stronger associations at high compared to moderate or low level temperatures, although such evidence of effect modification has not been consistently statistically significant. However, Cheng and Kan [28] found a statistically significant interaction between low, but not high, temperature and PM10 on total and cardiovascular mortality in Shanghai, China.
Few studies have investigated whether PM10 modifies the association between high temperatures, particularly heat waves, and cardiovascular health outcomes. Some have found stronger associations between high temperatures or heat waves and all-cause and/or cardiovascular mortality at higher levels of PM10, although not all have reported evidence of statistical significance [30,31,32,33]. Other studies have found no evidence of an interaction between temperature and PM10 on mortality [34,35]. Little work, however, has examined whether PM10 modifies the association between temperature or heat waves and cardiovascular morbidity, particularly cause-specific cardiovascular morbidity. One Australian study found that PM10 modified the association between temperature and cardiovascular hospital admissions at different lags in Brisbane, however it found little evidence of effect modification for cardiovascular emergency presentations [36]. Further, a recent Korean study found no evidence of a significant interactive effect between heat waves and PM10 on out-of-hospital cardiac arrest [7].
The frequency, intensity, and duration of heat waves is expected to increase in the future under climate change across most land areas globally, including Australia [37,38]. It is therefore important to clarify and enhance our understanding of the association between heat waves and cardiovascular morbidity to inform climate change adaptation planning in the health sector. This study aimed to examine whether PM10 modifies the short-term association between heat waves and hospital admissions for specific cardiovascular diseases in Greater Sydney, Australia. We investigated the susceptibility of both younger (0–64 years) and older populations (65 years and above), and tested the sensitivity of three heat wave definitions.

2. Materials and Methods

2.1. Meteorological Data

Daily weather data for all stations located in the Sydney Statistical Division (SSD) with near complete coverage of the period of 2001 to 2013 were obtained from the Australian Government’s Bureau of Meteorology (n = 17). Before identifying extreme temperature events in a climate time series, such as summer heat waves, it is important that the data undergo quality control checks [39]. This is because it is possible for incorrect data entries to be considered as real “extreme” values and included in further analyses [39]. To ensure our observational weather data was of the highest possible quality, we performed a series of quality control checks on the observed daily maximum, minimum, and dew-point temperature values for each weather station, and also tested for inhomogeneities in each daily maximum and minimum time series to inspect their overall quality. High quality stations (n = 15) were then used to calculate the respective city-wide averages for each temperature metric if they had a total missing value count of ≤2.5% of the study period. The missing value threshold was set at ≤2.5% to maximise the number of stations included in the calculation of the average and subsequent spatial coverage of the SSD, while also ensuring that the quality of those stations that were included remained high. The daily average mean temperature was calculated as the mean of the city-wide daily average maximum and minimum temperature values. For dew-point temperature, as the observations were recorded at 3-hour intervals over a 24-hour period, the city-wide average value for each time interval was first calculated with those stations where the missing value count was ≤2.5% of the study period, then the overall 24-hour daily average was calculated from these averaged time interval values.
In the absence of a standard heat wave definition, we selected and compared three heat wave definitions for this study. Previous studies have shown that the choice of heat wave definition can alter the magnitude and statistical significance of the association between heat waves and adverse health outcomes [40,41]. We defined a heat wave as two or more consecutive days where the temperature metric (three temperature metrics were selected and compared: maximum temperature (HWD01), mean temperature (HWD02), and minimum temperature (HWD03)) is greater than or equal to the 90th percentile of the warm season (1 November to 31 March) during 2001 to 2013. We compared heat wave definitions with alternative temperature metrics, rather than temperature thresholds or durations, to ensure that we kept an adequate number of heat wave days to conduct the analysis.

2.2. Ambient Air Pollution Data

Daily ambient air pollution data for all stations located in the SSD were obtained from the NSW Office of Environment and Heritage for 2001 to 2013. Daily data were obtained for the following air pollutants and used in this study: ozone (1 h average 24 h maximum value (pphm)); nitrogen dioxide (1 h average 24 h maximum value (pphm)), and particulate matter (particles with an aerodynamic diameter of less than 10 μm, PM10) (1 h average 24 h average value). The NSW Office of Environment and Heritage follows several quality assurance procedures to ensure the data are precise, accurate, representative, and comparable [42]. Negative daily values were assigned a value of 0. Stations that had a missing value count of ≤5% of the study period were used to calculate the daily city-wide average for each pollutant. Junger and Ponce de Leon [43] regarded a missing data level of 5% as the best-case scenario in their application of time-series air pollution data. Similar to the threshold selection for our meteorological data, a threshold of 5% was optimal in allowing us to maximise the number of stations included in the calculation of the average and subsequent spatial coverage of the SSD, while also ensuring that the quality of those stations that were included remained high. PM2.5 (ambient particulate matter with an aerodynamic diameter less than 2.5 μm) was not considered in this study given the smaller spatial and temporal coverage of the data across the Greater Sydney region.

2.3. Health Data

Individual-level daily hospital admission records with a principal diagnosis of I00-I99 (ICD-10-AM) for all public and private hospitals located in the SSD were obtained from the NSW Ministry of Health, Admitted Patient Data Collection, for 2001 to 2013 as part of a larger dataset (n = 1,570,805). All exact duplicate records were extracted and removed (n = 1,570,741, 64 records removed), as well those records with an admission date outside of 1 July 2001–30 June 2013 (n = 1,499,661, 71,080 records removed). Records that were classified as “emergency” hospital admissions (EHAs) were then selected for analysis to eliminate “pre-planned” hospital admissions (n = 1,132,737, records removed 366924) [44]. We then extracted and removed remaining records with an implausible, unknown, or missing entry for age (ranged deemed plausible: 0–115 years) or sex (required entry: male or female) (n = 1,132,705, records removed 32). Those records with a principal diagnosis of ischemic heart disease (ICD-10-AM: I20-I25), heart failure (ICD-10-AM: I50), cardiac arrest (ICD-10-AM: I46), heart arrhythmia (ICD-10-AM: 147-I49), conduction disorders (ICD-10-AM: I44-I45), and hypertensive diseases (ICD-10-AM: I10-I15) were then selected and aggregated into daily counts. To investigate the susceptibility of both younger and older populations, we stratified the data into two age groups: 0–64 years and 65 years and above.

2.4. Study Design and Statistical Analysis

We used a time-stratified case-crossover study design [45,46]. This design has been used in previous studies to estimate the association between heat waves and hospital admissions [47,48], and has been shown to produce similar results to the alternate time-series design [49]. The design is equivalent to a matched pair case-control design: it compares a case’s exposure on the day of an adverse health event (e.g., hospital admission) to their exposure on control days (or referent times), which are selected before and/or after the event [46,50,51]. Since each case acts as their own control, personal characteristics such as sex and smoking status are controlled for by matching [51]. We used the time-stratified approach to select control days to avoid potential bias introduced by other approaches, such as the unidirectional and bidirectional designs [46]. We matched cases and controls on day of the week and within the same month, and thus controlled for the confounding effects of season and long-term trends by design.
We used conditional logistic regression to estimate the association between heat waves and EHAs for our six selected cardiovascular diseases. We first estimated the association with and without adjusting for daily average PM10 at lag0. All of the models included daily average dew-point temperature, daily average nitrogen dioxide, daily average ozone, and public holidays as covariates. More specifically, we adjusted for daily average dew-point temperature [52] using a natural cubic spline (df = 3, knots at quantiles), daily average nitrogen dioxide (1 h average 24 h maximum value (pphm)), daily average ozone (1 h maximum 24 h average value (pphm)), and public holidays. To determine the most appropriate way to model dew-point temperature, we conducted sensitivity tests modelling this variable as a natural cubic spline with 3 and 2 degrees of freedom, and as a linear variable at lag0. As the coefficients of the heat wave effect were largely similar across the three modelling approaches, we selected to model dew-point temperature as a natural cubic spline with 3 degrees of freedom to be consistent with previous work [53].
To examine whether PM10 modifies the association between heat waves and EHAs for our six selected cardiovascular diseases, we estimated and compared heat wave effects on days with high and low levels of PM10 at lag0-lag2. High and low level PM10 days were defined as those where the daily average PM10 value was ≥90th and <90th percentile of the warm season during 2001 to 2013, respectively (Note: 90th percentile of the distribution was equal to 30.52 µg/m3). We created an interaction term between high and low level PM10 days (1 = high, 0 = low) and heat wave days (1 = yes, 0 = no). This term was added to the model, along with the respective individual variables and potential confounding variables described in the previous paragraph. We selected the threshold of the 90th percentile for two main reasons: to ensure there was a reasonably equal distribution of high and low level PM10 days across heat wave days for the three definitions for a fair comparison and to compare and estimate heat wave effects on days with the more extreme values of PM10.
The statistical analyses were conducted in the “R” Statistical Computing Environment (Version 3.2.1) using the “season” and “dlnm” packages. As we wanted to examine the impact of summer heat waves, we restricted our analyses to the warm season (1 November to 31 March) for 2001 to 2013. The effects are presented as odds ratio with their corresponding 95% confidence intervals. The figure is presented on the log scale. A p-value of <0.05 was considered significant.
This project was approved by the University of New South Wales Human Research Low Risk Ethics Advisory Committee Panel H.

3. Results

Descriptive statistics for selected weather and ambient air pollution variables during the study period are presented in Table 1. The mean daily average maximum temperature was 26.0 °C, and the mean daily average value of PM10 was 20.43 µg/m3.
Table 2 shows descriptive statistics for selected EHAs for six cardiovascular diseases for all ages combined and two age groups: 0–64 years and 65 years and over. Ischemic heart disease had the highest number of total EHAs during the study period with 68,334, while cardiac arrest had the lowest with 1861. For each cardiovascular disease, the older age group had a higher number of EHAs than the younger age group.
A summary of the heat wave characteristics for each heat wave definition used is provided in Table 3. HWD03 had the highest total number of heat wave days during the study period and the longest average heat wave duration of 2.92 days. HWD02 had the highest number of total heat wave events with 43.
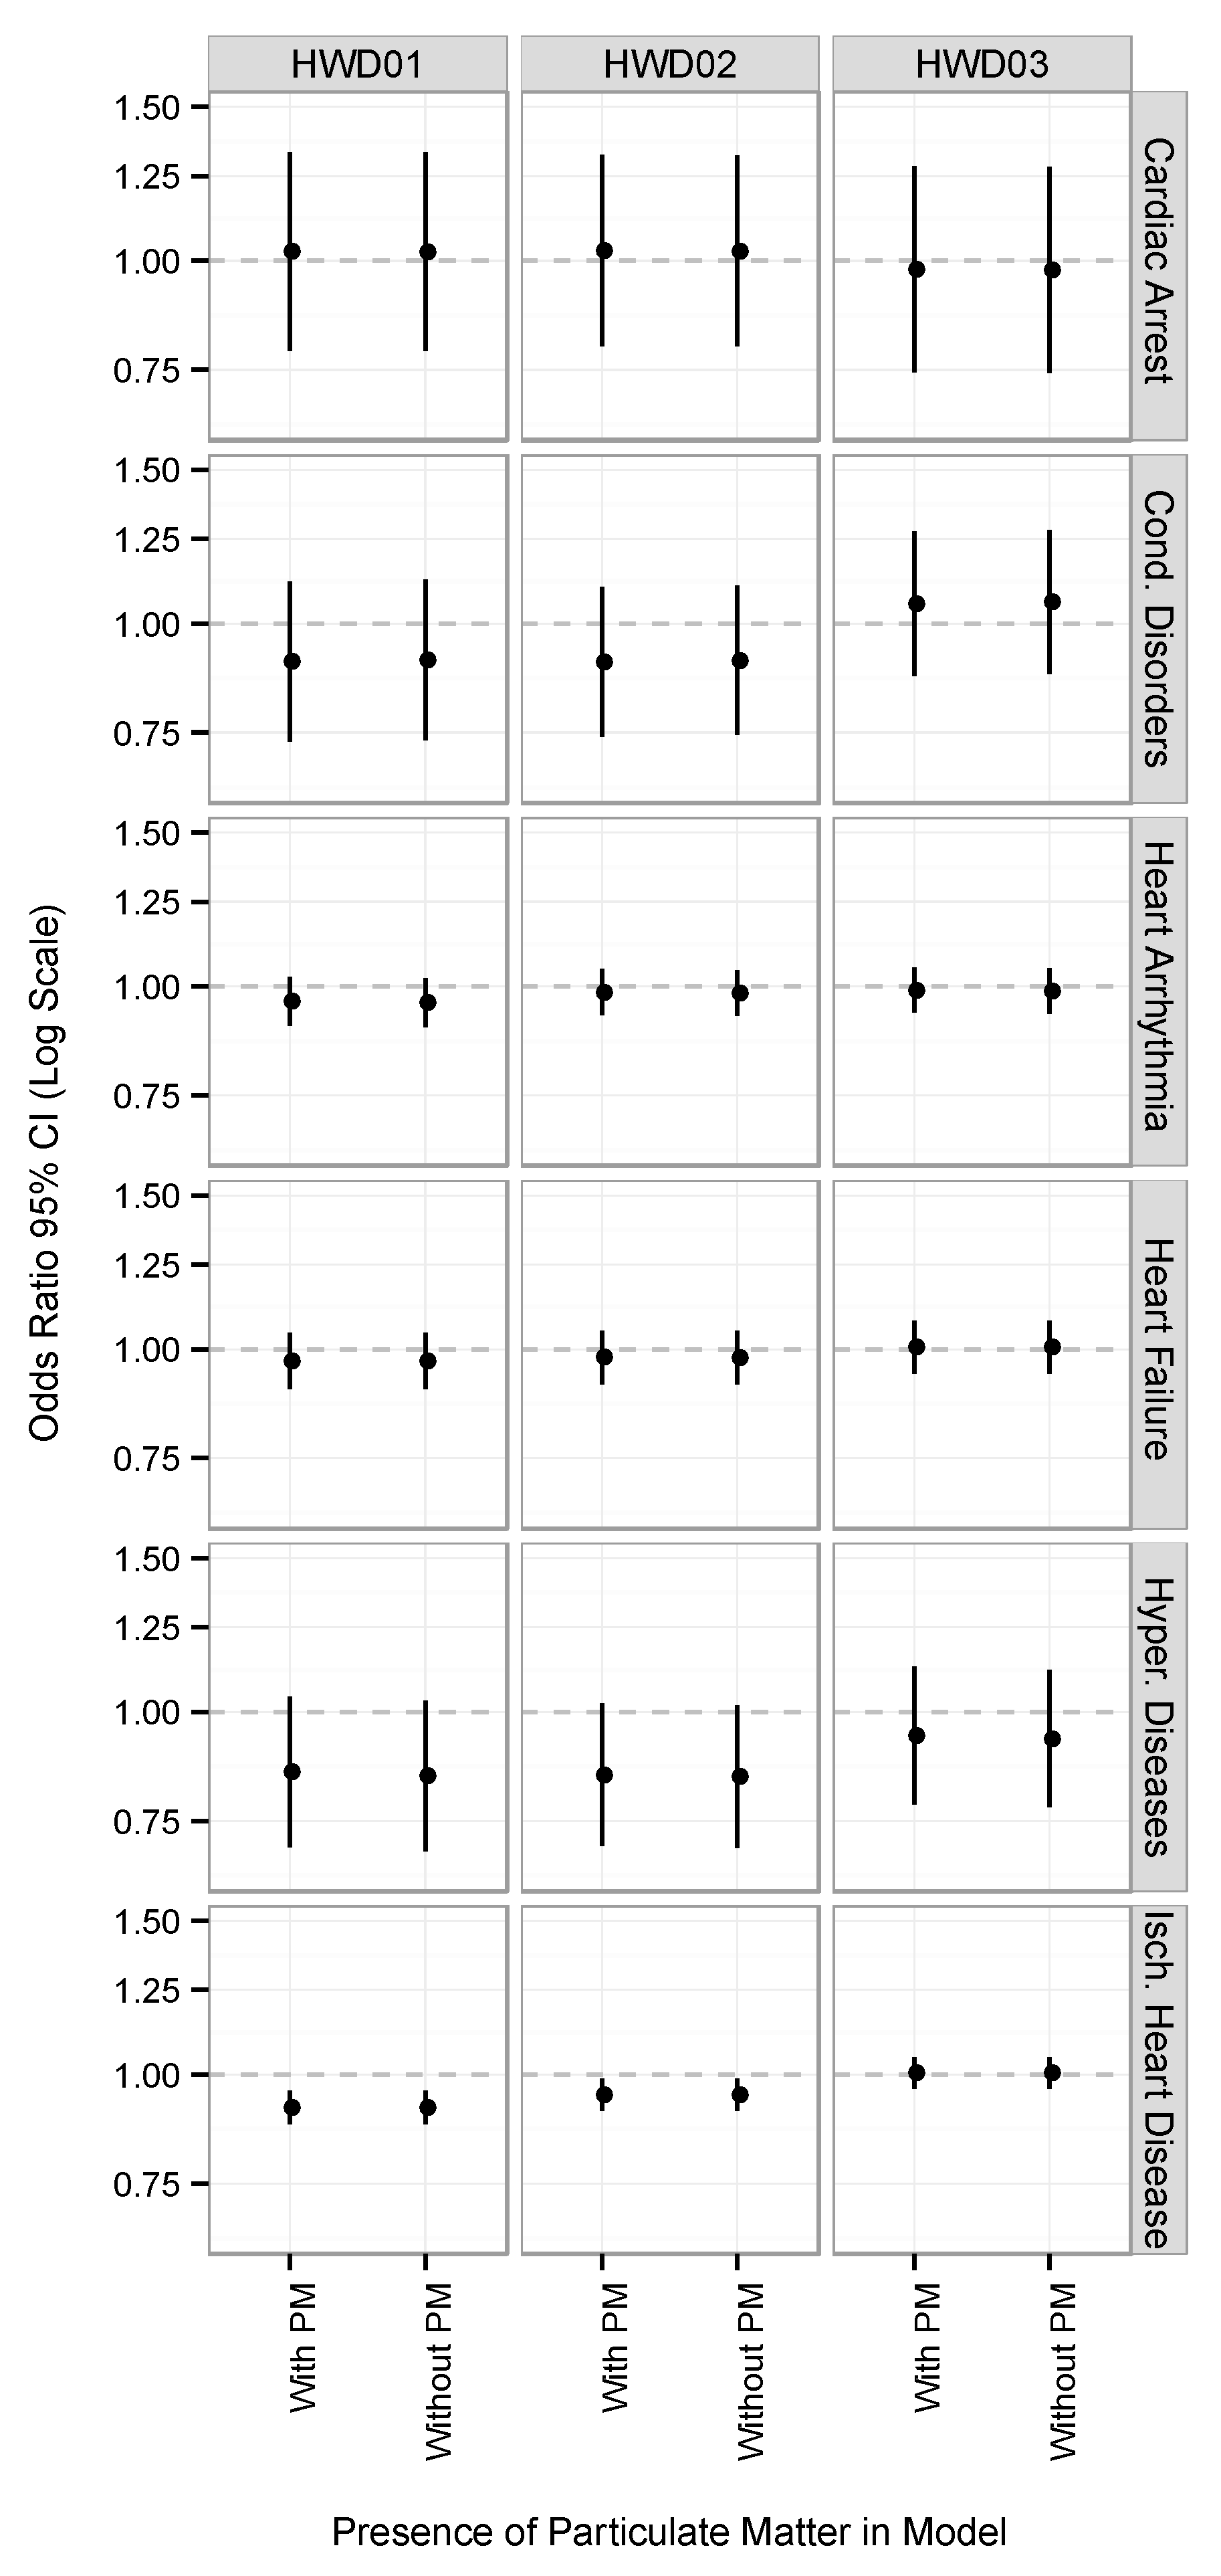
Figure 1 shows the association between heat wave days and EHAs for six cardiovascular diseases with and without controlling for daily average PM10 at lag0 for all ages. For all diseases and across the three heat wave definitions, controlling for daily average PM10 had little effect on the health risk estimates. Negative associations were found between heat wave days and EHAs for heart arrhythmia and hypertensive diseases for all three heat wave definitions, although these associations were not statistically significant. Negative associations were also found between heat wave days and EHAs for ischemic heart disease, heart failure, and conduction disorders for HWD01 and HWD02, and small positive associations were found for HWD03. The negative associations found for EHAs for ischemic heart disease for HWD01 and HWD02 were statistically significant. Small, positive associations were found between heat wave days and EHAs for cardiac arrest for HWD01 and HWD02, and negative associations were found for HWD03.
Table 4 shows the association between heat wave days and EHAs for six cardiovascular diseases at two levels of PM10 (high: ≥90th percentile; and low: <90th percentile) for all ages at lag0 and lag1. The results for lag2 are presented in Table A1 in Appendix A. A positive, statistically significant interaction was found between heat wave and high-level PM10 days on EHAs for hypertensive diseases at lag1 for HWD03, meaning that there was a stronger effect on EHAS on high-level PM10 days than on low-level PM10 days. Heat wave effects were also stronger on high-level PM10 days for hypertensive diseases for HWD03 at lag0 and lag2, but the p-value of the interaction term was not statistically significant. The impact of heat waves on EHAs for cardiac arrest was generally found to be stronger on days with high levels of PM10 across most lags and definitions, although none of the interaction terms were statistically significant. A negative, statistically significant interaction was found between heat wave and high-level PM10 days on EHAs for ischemic heart disease at lag2 for HWD01 (meaning that there was a weaker effect on EHAS on high-level PM10 days than on low-level PM10 days), but not at lag0 or lag1.
Table 5 shows the association between heat wave days and EHAs for six cardiovascular diseases at two levels of PM10 (high: ≥90th percentile; and low: <90th percentile) for younger and older populations at lag0 and lag1. The results for lag2 are presented in Table A2 in the Appendix A. A positive, statistically significant interaction was found between heat wave and high-level PM10 days on EHAs for cardiac arrest in the older age group for HWD01 at lag1 and lag2, and for HWD02 at lag1. Heat wave effects were also found to be stronger on high-level PM10 days at lag0 for HWD02, and at lag0 and lag1 for HWD03 in the younger age group, but no evidence of a statistically significant interaction was found. The impact of heat waves on EHAs for conduction disorders was stronger on high-level PM10 days for all definitions and lags, and on EHAs for hypertensive diseases for HWD02 and HWD03 at all lags and lag1 for HWD01 in the younger population. Stronger heat wave effects on high- compared to low-level PM10 days were found for EHAs for heart failure at lag1 for HWD03 in the older age group. A negative, statistically significant interaction was found between heat wave and high-level PM10 days on EHAs for heart arrhythmia for HWD01 at lag1 in the younger age group.

4. Discussion

This study examined whether PM10 modifies the association between heat waves and EHAs for six cardiovascular diseases in Greater Sydney, Australia. We estimated and compared the effect of heat waves on high- and low-level PM10 days at lag0–lag2 for three age groups: all ages combined, 0–64 years, and 65 years and above, and tested the sensitivity of three heat wave definitions. We found some evidence that PM10 modifies the association between heat waves and EHAs for certain cardiovascular diseases. Stronger heat wave effects were observed on high- compared to low-level PM10 days for EHAs for cardiac arrest for all three age groups; conduction disorders for 0–64 years; and hypertensive diseases for all ages combined and 0–64 years. These findings, however, were generally not consistent across all heat wave definitions and lags. Positive, statistically significant interactions were found only for EHAs for hypertensive diseases (all ages combined) and cardiac arrest (65 years and above).
It is difficult to directly compare our findings to previous studies, as most of the work to date examining the potential interactive effects of temperature or heat waves and PM10 on cardiovascular health outcomes has considered cardiovascular mortality (e.g., [26,27,30,32,33,34]). Few studies have considered cardiovascular morbidity as the health outcome, particularly cause-specific cardiovascular morbidity [36,54,55]. Much like our findings, the results of the studies considering cardiovascular morbidity have been broadly inconsistent, although different exposure variables have been considered (i.e., temperature, season, and relative humidity). For example, Ren et al. [36] found evidence of a statistical interaction between temperature and total cardiovascular hospital admissions at different lags in Brisbane, Australia, but found no such evidence for total cardiovascular emergency presentations. Qiu et al. [55] reported that the association between PM10 and emergency hospital admissions for ischemic heart disease was strongest in the cool season and at lower levels of relative humidity in Hong Kong, China. Further, Kang et al. [7] found no evidence of a significant interactive effect between heat waves and PM10 on out-of-hospital cardiac arrest in Korea, which is in general disagreement with our findings regarding EHAs for cardiac arrest. The level and source composition of PM10 differs across regions and cities [56,57,58], as does population acclimatisation to temperature changes and heat waves [1,59]. It is therefore important to conduct further localised studies to account for these differences and clarify our understanding of any potential interactive effects of these environmental exposures on cardiovascular morbidity.
It is plausible that air pollution and heat exposure may interact on a biological level, although the exact causal pathways and mechanisms involved are not known. The activation of the body’s thermoregulatory system and mechanisms during heat stress can facilitate and increase the absorption and entry of toxins and air pollutants into the body, as well as alter the body’s response to such substances [24]. The strength of the toxicity of a chemical or toxin on a biological system can be exacerbated by increased body temperature [24,60]. Passive heat exposure can stress the cardiovascular system, where increased skin blood flow during thermoregulation results in increased cardiac output, which in turn is mediated by increases in heart rate [61]. Madaniyazi et al. [62] observed a “V” shaped relationship between mean temperature and heart rate and blood pressure (systolic and diastolic) in Chinese adults, finding heat effects above certain thresholds. Others have, however, observed a decrease in systolic blood pressure with an increase in ambient temperature [63]. Ren et al. [64] found that increased ambient temperature is associated with decreased heart rate variability (HRV) during the warm season, but found no evidence of an interactive effect between ambient temperature and PM2.5 on HRV. Particulate matter may also adversely affect the cardiovascular system by directly entering into the systemic circulation (smaller particles: PM2.5 or PM1.0), or indirectly by affecting the autonomic nervous system or inducing an inflammatory response [65]. Stafoggia et al. [26] noted that their findings of stronger PM10 effects on mortality during the warm season might be a result of increased exposure to this pollutant, with individuals more likely to open their windows and spend time outdoors during the summer months.
We observed positive, statistically significant interactions between heat wave and high-level PM10 days on EHAs for cardiac arrest among the elderly. Previous studies examining the susceptibility of specific age groups to the potential interactive effects of high temperatures or heat waves and PM10 on cardiovascular mortality have generally found effect modification to be more pronounced among the elderly [27,31,33]. The elderly are particularly susceptible to extreme heat exposure due to their decreased capacity to effectively thermoregulate, with sweat gland output, blood flow to the skin, and cardiac output reduced [66]. Given the general decline of the body’s physiological processes with age and the higher prevalence of cardiovascular diseases among older age groups, the elderly are also susceptible to the adverse effects of particulate matter [67]. We also found some evidence of effect modification in the younger age group for certain diseases. The reasons for this are unclear, although it may be because younger populations are generally more physically active than older populations [68], which may result in more time spent outdoors, subsequently increasing their exposure levels.
We found positive, statistically significant interactions at lag1 and lag2 for certain cardiovascular diseases, but not at lag0. Evidence of an interactive effect between high temperature and high-levels of PM10 on cardiovascular health outcomes has also been found at certain lags [25,36]. For example, Qian et al. [25] observed stronger PM10 effects on cardiovascular mortality at high compared to normal level temperatures at lag0–1 in Wuhan, China. Short lag effects have also been observed when examining the independent effects of high temperatures and PM10 on cardiovascular morbidity [3,15]. Positive, statistically significant interactions were also found for some heat wave definitions only. The choice of heat wave definition has been shown to affect both the magnitude and statistical significance of the association between heat waves and health outcomes [69]. Each of the three heat wave definitions used in this study identified different days as “exposure” days, and the total number of exposure days varied between our definitions (See Table 3). It is likely that this affected our models, as well as the calculation of the interaction term between heat wave and high-level PM10 days. It is also possible that different temperature metrics (maximum, mean, minimum) may have different impacts on cardiovascular health outcomes, although differences in their interaction with PM10 is unclear. For example, Kang et al. [7] found that the risk of out-of-hospital cardiac arrest during heat waves was highest in the afternoon (3 p.m. to 5 p.m.), which coincided with the peak of daily outdoor temperature.
A few negative, statistically significant interactions were found, and negative associations were observed across both high- and low-level PM10 days and in Figure 1 for certain cardiovascular diseases. Several previous studies have also found null or negative associations between increased temperature or extreme heat and hospital admissions for cardiovascular diseases [8,9,11]. Such findings are in contrast to the positive associations often observed between high temperature or heat waves and cardiovascular mortality across several regions, particularly among the elderly [70,71]. The exact reasons for the differences found between these cardiovascular health outcomes are not known. One possible explanation is that individuals may die quickly from cardiovascular disease during high temperatures before they are able to seek medical attention or be admitted to hospital [72].
This study has some potential strengths. To the best of our knowledge, this is the first study to examine the potential interactive effects of heat waves and PM10 on cause-specific cardiovascular hospital admissions in an Australian city. By examining and comparing six specific cardiovascular diseases, we have shown that some conditions may be more susceptible to the potential interactive effects of heat waves and PM10 than others (e.g., cardiac arrest). We also analysed a relatively long period of time series data (12 years) and controlled for other ambient air pollutants including ozone and nitrogen dioxide.
This study has some potential limitations. The analysis was performed for a single city and, therefore, our results may not be generalisable given that PM10 levels and mixtures can vary geographically, as well as population acclimatisation to heat waves. The samples sizes for some of the cardiovascular diseases were relatively small when stratified by age group (e.g., cardiac arrest, conductions disorders), and we had limited power to detect interaction effects because of the small number of days that were classified as being heatwaves and having high PM10 levels. Therefore, caution is warranted when interpreting the significance of these results. We estimated exposure to heat waves and PM10 by calculating the daily city-wide average using monitoring stations, and not by measuring an individual’s personal exposure level, which may have resulted in some exposure misclassification. Our analysis did not account for transfers between episodes of care in the hospital admissions data, and thus it is possible that admissions relating to the same cardiac event for an individual were counted as different events. Further, heat wave forecasts or government-issued heat wave warnings may result in individuals exhibiting avoidance behaviours, especially for people with existing health conditions. This individual level response is beyond the scope of this research.

5. Conclusions

This study found some evidence that PM10 modifies the association between heat waves and hospital admissions for certain cardiovascular diseases. Our findings, however, showed inconsistencies and largely differed across age group, disease, lag, and heat wave definition. Given the differences found across diseases, our study highlights the need for future studies to consider, where possible, cause-specific outcomes when examining the potential interactive effects of heat waves and ambient air pollution. With both heat waves and levels of ambient particulate matter expected to increase under climate change, it is important to consider potential effect modification by air pollution when examining the impacts of heat waves on cardiovascular morbidity. As our study has shown, this is true even for locations with comparatively low levels of particulate matter, such as Australia.

Author Contributions

Data curation M.P. and Y.Z.; formal analysis M.P. and A.H.; methodology, M.P. and A.H.; writing—original draft preparation, M.P.; writing—review and editing, D.G. and A.H.; supervision, D.G. and A.H.; project administration, D.G.; investigation, A.H.; resources, D.G.

Funding

This research received no external funding.

Acknowledgments

The authors would like to thank and acknowledge the Australian Bureau of Meteorology for providing the meteorological data; the NSW Office of Environment and Heritage for providing the air population data and the Centre for Epidemiology and Evidence, NSW Ministry of Health for providing the hospital admissions data from the Admitted Patient Data Collection (SAPHaRI). Further, the authors would like to thank Associate Professor Lisa Alexander for her advice and insights regarding weather station data and temperature extremes; Professor Adrian Barnett for his assistance with the application of the “season” package in the R Statistical Computing Environment and James Goldie for his assistance and insights regarding public holiday data.

Conflicts of Interest

The authors declare no conflict of interest.

Appendix A

Table A1. The effect of heat wave days on “emergency” hospital admissions (EHAs) for six cardiovascular diseases on days with high levels of particulate matter (PM10) compared to days with low levels of PM10 in the Sydney Statistical Division (SSD) during the warm season, 2001 to 2013, for all ages at lag2.
HWD01HWD02HWD03
CardiovascularHeat EffectHeat EffectHeat EffectHeat EffectHeat EffectHeat Effect
Disease Low PM10 High PM10 Low PM10High PM10Low PM10 High PM10
Ischemic Heart1.020.93 **1.000.950.990.98
Disease(0.98, 1.07)(0.85, 1.02)(0.96, 1.04)(0.87, 1.03)(0.96, 1.03)(0.89, 1.07)
Heart Failure0.870.890.920.890.940.91
(0.81, 0.94)(0.76, 1.03)(0.86, 0.99)(0.76, 1.03)(0.88, 1.002)(0.77, 1.07)
Cardiac Arrest1.131.261.131.371.130.73
(0.87, 1.47)(0.75, 2.12)(0.89, 1.45)(0.89, 2.09)(0.89, 1.43)(0.40, 1.35)
Heart Arrhythmia0.981.001.001.041.021.08
(0.92, 1.05)(0.87, 1.14)(0.95, 1.06)(0.92, 1.19)(0.97, 1.08)(0.94, 1.24)
Conduction Disorders1.010.810.920.880.850.90
(0.82, 1.23)(0.51, 1.28)(0.76, 1.11)(0.57, 1.35)(0.71, 1.01)(0.58, 1.39)
Hypertensive Disease 1.020.941.020.911.001.11
(0.85, 1.23)(0.62, 1.41)(0.86, 1.20)(0.61, 1.35)(0.85, 1.17)(0.73, 1.68)
** Denotes a statistically significant negative interaction term p-value (<0.05).
Table A2. The effect of heat wave days on EHAs for cardiovascular diseases on days with high levels of PM10 compared to days with low levels of PM10 in the SSD during the warm season, 2001 to 2013, for those aged 0–64 years and 65 years and over at lag2.
HWD01HWD02HWD03
CardiovascularHeat EffectHeat EffectHeat EffectHeat EffectHeat EffectHeat Effect
Disease Low PM10High PM10 Low PM10 High PM10Low PM10 High PM10
Ischemic Heart Disease
0–64 years1.070.961.010.951.001.04
(1.00, 1.14)(0.84, 1.11)(0.95, 1.07)(0.84, 1.09)(0.94, 1.06)(0.86, 1.14)
65 years and over0.990.910.990.940.990.93
(0.94, 1.05)(0.80, 1.02)(0.94, 1.05)(0.84, 1.06)(0.94, 1.04)(0.82, 1.06)
Heart Failure
0–64 years0.840.780.901.020.990.92
(0.69, 1.02)(0.51, 1.19)(0.75, 1.07)(0.69, 1.49)(0.84, 1.18)(0.60, 1.40)
65 years and over0.900.900.920.860.930.91
(0.83, 0.98)(0.75, 1.05)(0.86, 0.99)(0.73, 1.02)(0.87, 0.997)(0.76, 1.08)
Cardiac Arrest
0–64 years1.510.761.330.771.170.61
(1.01, 2.26)(0.31, 1.85)(0.93, 1.91)(0.34, 1.74)(0.83, 1.65)(0.24, 1.57)
65 years and over0.921.71 *0.981.681.100.83
(0.65, 1.31)(0.89, 3.28)(0.70, 1.38)(0.89, 3.18)(0.80, 1.51)(0.36, 1.90)
Heart Arrhythmia
0–64 years1.051.041.031.000.980.96
(0.95, 1.16)(0.84, 1.29)(0.94, 1.13)(0.81, 1.22)(0.89, 1.07)(0.76, 1.20)
65 years and over0.950.970.991.081.051.16
(0.87, 1.03)(0.82, 1.15)(0.92, 1.07)(0.91, 1.27)(0.98, 1.12)(0.97, 1.39)
Conduction Disorders
0–64 years1.092.071.081.800.811.58
(0.70, 1.72)(0.79, 5.42)(0.72, 1.62)(0.70, 4.66)(0.55, 1.18)(0.59, 4.22)
65 years and over0.990.620.880.730.860.78
(0.79, 1.24)(0.36, 1.07)(0.72, 1.09)(0.45, 1.19)(0.71, 1.06)(0.47, 1.27)
Hypertensive Disease
0–64 years0.831.081.061.211.001.64
(0.62, 1.11)(0.60, 1.94)(0.82, 1.38)(0.69, 2.14)(0.78, 1.28)(0.91, 2.98)
65 years and over1.180.770.980.690.990.78
(0.93, 1.50)(0.43, 1.40)(0.79, 1.22)(0.39, 1.21)(0.81, 1.22)(0.43, 1.42)
* Denotes a statistically significant positive interaction term p-value (<0.05).

References

  1. Nichols, M.; Peterson, K.; Alston, L.; Allender, S. Australian Heart Disease Statistics 2014; National Heart Foundation of Australia: Melbourne, Australia, 2014. [Google Scholar]
  2. World Health Organization. Cardiovascular diseases (CVDs). 2017. Available online: http://www.who.int/mediacentre/factsheets/fs317/en/ (accessed on 2 February 2018).
  3. Lin, S.; Luo, M.; Walker, R.J.; Liu, X.; Hwang, S.; Chinery, R. Extreme high temperatures and hospital admissions for respiratory and cardiovascular diseases. Epidemiology 2009, 20, 738–746. [Google Scholar] [CrossRef]
  4. Ostro, B.; Rauch, S.; Green, R.; Malig, B.; Basu, R. The effects of temperature and use of air conditioning on hospitalizations. Am. J. Epidemiol. 2010, 172, 1053–1061. [Google Scholar] [CrossRef]
  5. Ma, W.; Xu, X.; Peng, L.; Kan, H. Impact of extreme temperature on hospital admission in Shanghai, China. Sci. Total Environ. 2011, 409, 3634–3637. [Google Scholar] [CrossRef]
  6. Nitschke, M.; Tucker, G.R.; Bi, P. Morbidity and mortality during heatwaves in metropolitan Adelaide. Med. J. Aust. 2007, 187, 662–665. [Google Scholar] [Green Version]
  7. Kang, S.H.; Oh, I.Y.; Heo, J.; Lee, H.; Kim, J.; Lim, W.H.; Cho, Y.; Choi, E.K.; Yi, S.M.; Shin, S.D.; et al. Heat, heat waves, and out-of-hospital cardiac arrest. Int. J. Cardiol. 2016, 221, 232–237. [Google Scholar] [CrossRef]
  8. Michelozzi, P.; Accetta, G.; De Sario, M.; D’Ippoliti, D.; Marino, C.; Baccini, M.; Biggeri, A.; Anderson, H.R.; Katsouyanni, K.; Ballester, F.; et al. High temperature and hospitalizations for cardiovascular and respiratory causes in 12 European cites. Am. J. Respir. Crit. Care Med. 2009, 179, 383–389. [Google Scholar] [CrossRef]
  9. Turner, L.R.; Barnett, A.G.; Connell, D.; Tong, S. Ambient temperature and cardiorespiratory morbidity: A systematic review and meta-analysis. Epidemiology 2012, 23, 594–606. [Google Scholar] [CrossRef]
  10. Phung, D.; Thai, P.K.; Guo, Y.; Morawska, L.; Rutherford, S.; Chu, C. Ambient temperature and risk of cardiovascular hospitalization: An updated systematic review and meta-analysis. Sci. Total Environ. 2016, 550, 1084–1102. [Google Scholar] [CrossRef]
  11. Ogbomo, A.S.; Gronlund, C.J.; O’Neill, M.S.; Konen, T.; Cameron, L.; Wahl, R. Vulnerability to extreme-heat-associated hospitalization in three counties in Michigan, USA, 2000–2009. Int. J. Biometeorol. 2017, 61, 833–843. [Google Scholar] [CrossRef]
  12. US EPA (United States Environment Protection Authority). Particulate Matter (PM) Pollution. 2016. Available online: https://www.epa.gov/pm-pollution/particulate-matter-pm-basics#PM (accessed on 6 September 2017).
  13. Keywood, M.D.; Emmerson, K.M.; Hibberd, M.F. Ambient Air Quality: Coarse Particulate Matter (PM10). In Australia State of the Environment 2016; 2016. Available online: https://soe.environment.gov.au/theme/ambient-air-quality/topic/2016/coarse-particulate-matter-pm10 (accessed on 17 April 2018).
  14. Barnett, A.G.; Williams, G.M.; Schwartz, J.; Best, T.L.; Neller, A.H.; Petroeschevsky, A.L.; Simpson, R.W. The effects of air pollution on hospitalizations for cardiovascular disease in elderly people in Australian and New Zealand cities. Environ. Health Perspect. 2006, 114, 1018–1023. [Google Scholar] [CrossRef]
  15. Colais, P.; Faustini, A.; Stafoggia, M.; Berti, G.; Bisanti, L.; Cadum, E.; Cernigliaro, A.; Mallone, S.; Pacelli, B.; Serinelli, M.; et al. Particulate air pollution and hospital admissions for cardiac diseases in potentially sensitive subgroups. Epidemiology 2012, 23, 473–481. [Google Scholar] [CrossRef]
  16. Stafoggia, M.; Samoli, E.; Alessandrini, E.; Cadum, E.; Ostro, B.; Berti, G.; Faustini, A.; Jacquemin, B.; Linares, C.; Pascal, M.; et al. Short-term associations between fine and coarse particulate matter and hospitalizations in Southern Europe: Results from the MED-PARTICLES Project. Environ. Health Perspect. 2013, 121, 1026–1033. [Google Scholar] [CrossRef]
  17. Schwartz, J.; Morris, R. Air pollution and hospital admissions for cardiovascular disease in Detroit, Michigan. Am. J. Epidemiol. 1995, 142, 23–35. [Google Scholar] [CrossRef]
  18. Xu, A.; Mu, Z.; Jiang, B.; Wang, W.; Yu, H.; Zhang, L.; Li, J. Acute effects of particulate air pollution in ischemic heart disease hospitalizations in Shanghai, China. Int. J. Environ. Res. Public Health 2017, 14, 168. [Google Scholar] [CrossRef]
  19. Shah, A.S.V.; Langrish, J.P.; Nair, H.; McAllister, D.A.; Hunter, A.L.; Donaldson, K.; Newby, D.E.; Mills, N.L. Global association of air pollution and heart failure: A systematic review and meta-analysis. Lancet 2013, 382, 1039–1048. [Google Scholar] [CrossRef]
  20. Zhao, R.; Chen, S.; Wang, W.; Huang, J.; Wang, K.; Liu, L.; Wei, S. The impact of short-term exposure to air pollutants on the onset of out-of-hospital cardiac arrest: A systematic review and meta-analysis. Int. J. Cardiol. 2017, 226, 110–117. [Google Scholar] [CrossRef]
  21. Vaneckova, P.; Bambrick, H. Cause-specific hospital admissions on hot days in Sydney, Australia. PLoS ONE 2013, 8, e55459. [Google Scholar] [CrossRef]
  22. Wilson, L.A.; Morgan, G.G.; Hanigan, I.V.; Johnston, F.H.; Hisham, A.R.; Broome, R.; Gaskin, C.; Jalaludin, B. The impact of heat on mortality and morbidity in the Greater Metropolitan Sydney Region: A case crossover analysis. Environ. Health 2013, 12, 98. [Google Scholar] [CrossRef]
  23. Zanobetti, A.; Peters, A. Disentangling interactions between atmospheric pollution and weather. J. Epidemiol. Community Health 2015, 69, 613–615. [Google Scholar] [CrossRef]
  24. Gordon, C. Role of environmental stress in the physiological response to chemical toxicants. Environ. Res. 2003, 92, 1–7. [Google Scholar] [CrossRef]
  25. Qian, Z.; He, Q.; Lin, H.M.; Kong, L.; Bentley, C.M.; Liu, W.; Zhou, D. High temperatures enhanced acute mortality effects of ambient particle pollution in the ‘oven’ city of Wuhan, China. Environ. Health Perspect. 2008, 116, 1172–1178. [Google Scholar] [CrossRef]
  26. Stafoggia, M.; Schwartz, J.; Forastiere, F.; Perucci, C.A.; The SISTI Group. Does temperature modify the association between air pollution and mortality? A multicity case-crossover analysis in Italy. Am. J. Epidemiol. 2008, 167, 1476–1485. [Google Scholar] [CrossRef]
  27. Li, G.; Zhou, M.; Cai, Y.; Zhang, Y.; Pan, X. Does temperature enhance acute mortality effects of ambient particle pollution in Tianjin City, China. Sci. Total Environ. 2011, 409, 1811–1817. [Google Scholar] [CrossRef]
  28. Cheng, Y.; Kan, H. Effect of the interaction between outdoor air pollution and extreme temperature on daily mortality in Shanghai, China. J. Epidemiol. 2012, 22, 28–36. [Google Scholar] [CrossRef]
  29. Meng, X.; Zhang, Y.; Zhao, Z.; Duan, X.; Xu, X.; Kan, H. Temperature modifies the acute effect of particulate air pollution on mortality in eight Chinese cities. Sci. Total Environ. 2012, 435–436, 215–221. [Google Scholar] [CrossRef]
  30. Burkart, K.; Canário, P.; Breitner, S.; Schneider, A.; Scherber, K.; Andrade, H.; Alcoforado, M.J.; Endlicher, W. Interactive short-term effects of equivalent temperature and air pollution on human mortality in Berlin and Lisbon. Environ. Pollut. 2013, 183, 54–63. [Google Scholar] [CrossRef]
  31. Analitis, A.; Michelozzi, P.; D’Ippoliti, D.; de’Donato, F.; Menne, B.; Matthies, F.; Atkinson, R.W.; Iñiguez, C.; Basagaña, X.; Schneider, A.; et al. Effects of heat waves on mortality: Effect modification and confounding by air pollutants. Epidemiology 2014, 25, 15–22. [Google Scholar] [CrossRef]
  32. Breitner, S.; Wolf, K.; Devlin, R.B.; Diaz-Sanchez, D.; Peters, A.; Schneider, A. Short-term effects of air temperature on mortality and effect modification by air pollution in three cities of Bavaria, Germany: A time-series analysis. Sci. Total Environ. 2014, 485-486, 49–61. [Google Scholar] [CrossRef]
  33. Li, L.; Yang, J.; Guo, C.; Chen, P.Y.; Ou, C.Q.; Guo, Y. Particulate matter modifies the magnitude and time course of the non-linear temperature-mortality association. Environ. Pollut. 2015, 196, 423–430. [Google Scholar] [CrossRef]
  34. Hales, S.; Salmond, C.; Town, G.I.; Kjellstron, T.; Woodward, A. Daily mortality in relation to weather and air pollution in Christchurch, New Zealand. Aust. N. Z. J. Public Health 2000, 24, 89–91. [Google Scholar] [CrossRef]
  35. Basu, R.; Feng, W.Y.; Ostro, B. Characterizing temperature and mortality in Nine California Counties. Epidemiology 2008, 19, 138–145. [Google Scholar] [CrossRef]
  36. Ren, C.; Williams, G.M.; Tong, S. Does particulate matter modify the association between temperature and cardiorespiratory diseases? Environ. Health Perspect. 2006, 114, 1690–1696. [Google Scholar] [CrossRef]
  37. IPCC. Managing the Risks of Extreme Events and Disasters to Advance Climate Change Adaptation. In A Special Report of Working Groups I and II of the Intergovernmental Panel on Climate Change; Field, C.B., Barros, V., Stocker, T.F., Qin, D., Dokken, D.J., Ebi, K.L., Mastrandrea, M.D., Mach, K.J., Plattner, G.-K., Allen, S.K., et al., Eds.; Cambridge University Press: Cambridge, UK; New York, NY, USA, 2012; p. 582. [Google Scholar]
  38. Cowan, T.; Purich, A.; Perkins, S.; Pezza, A.; Boschat, G.; Sadler, K. More frequent, longer and hotter heat waves for Australia in the Twenty-First Century. J. Clim. 2014, 27, 5851–5871. [Google Scholar] [CrossRef]
  39. Alexander, L.; Tebaldi, C. Climate and Weather Extremes: Observations, Modelling, And Projections. In The Future of the World’s Climate; Henderson-Sellers, A., McGuffie, K., Eds.; Elsevier: New York, NY, USA, 2012; pp. 253–288. [Google Scholar]
  40. Tong, S.; Ren, C.; Becker, N. Excess deaths during the 2004 heat wave in Brisbane, Australia. Int. J. Biometeorol. 2010, 54, 393–400. [Google Scholar] [CrossRef]
  41. Kent, S.T.; McClure, L.A.; Zaitchik, B.F.; Smith, T.T.; Gohlke, J.M. Heat waves and health outcomes in Alabama (USA): The importance of heat wave definition. Environ. Health Perspect. 2014, 122, 151–158. [Google Scholar] [CrossRef]
  42. NSW Office of Environment and Heritage. 2015b. Quality assurance for the air quality monitoring network. Available online: http://www.environment.nsw.gov.au/topics/air/understanding- air-quality-data/data-validation (accessed on 19 April 2018).
  43. Junger, W.L.; Ponce de Leon, A. Imputation of missing data in time series for air pollutants. Atmos. Environ. 2015, 102, 96–104. [Google Scholar] [CrossRef]
  44. Khalaj, B.; Lloyd, G.; Sheppeard, V.; Dear, K. The health impacts of heat waves in five regions of New South Wales, Australia: A case-only analysis. Int. Arch. Occup. Environ. Health 2010, 83, 833–842. [Google Scholar] [CrossRef]
  45. Maclure, M. The case-crossover design: A method for studying transient e ffects on the risk of acute events. Am. J. Epidemiol. 1991, 133, 144–153. [Google Scholar] [CrossRef]
  46. Janes, H.; Sheppard, L.; Lumley, T. Case-crossover analyses of air pollution exposure data: Referent selection strategies and their implications for bias. Epidemiology 2005, 16, 717–726. [Google Scholar] [CrossRef]
  47. Zhang, Y.; Nitschke, M.; Bi, P. Risk factors for direct heat-related hospitalization during the 2009 Adelaide heat wave: A case-crossover study. Sci. Total Environ. 2013, 442, 1–5. [Google Scholar] [CrossRef]
  48. Gronlund, C.J.; Zanobetti, A.; Schwartz, J.D.; Wellenius, G.A.; O’Neill, M.S. Heat, heat waves, and hospital admissions among the elderly in the United States, 1992–2006. Environ. Health Perspect. 2014, 122, 1187–1192. [Google Scholar] [CrossRef]
  49. Tong, S.; Wang, X.Y.; Guo, Y. Assessing the short-term effects of heatwaves on mortality and morbidity in Brisbane, Australia: Comparison of case-crossover and time series analyses. PLoS ONE 2012, 7, e37500. [Google Scholar] [CrossRef]
  50. Bell, M.L.; O’Neill, M.S.; Ranjit, N.; Borja-Aburto, V.H.; Cifuentes, L.A.; Gouveia, N.C. Vulnerability to heat-related mortality in Latin America: a case- crossover study in São Paulo, Brazil, Santiago, Chile and Mexico City, Mexico. Int. J. Epidemiol. 2008, 37, 796–804. [Google Scholar] [CrossRef]
  51. Barnett, A.G.; Dobson, A.J. Analysing seasonal health data. Statistics for Biology and Health; Springer: Berlin, Germany, 2010. [Google Scholar]
  52. Davis, R.E.; McGregor, G.R.; Enfield, K.B. Humidity: A review and primer on atmospheric moisture and human health. Environ. Res. 2016, 144, 106–116. [Google Scholar] [CrossRef]
  53. Kingsley, S.L.; Eliot, M.N.; Gold, J.; Vanderslice, R.R.; Wellenius, G.A. Current and projected heat-related morbidity and mortality in Rhode Island. Environ. Health Perspect. 2016, 124, 460–467. [Google Scholar] [CrossRef]
  54. Ren, C.; Tong, S. Temperature modifies the health effects of particulate matter in Brisbane, Australia. Int. J. Biometerol. 2006, 51, 87–96. [Google Scholar] [CrossRef]
  55. Qiu, H.; Yu, I.T.; Wang, X.; Tian, L.; Ah Tse, L.; Wai Wong, T. Cool and dry weather enhances the effects of air pollution on emergency IHD hospital admissions. Int. J. Cardiol. 2013, 168, 500–505. [Google Scholar] [CrossRef]
  56. Karagulian, F.; Belis, C.A.; Dora, C.F.C.; Prüss-Ustün, A.M.; Bonjour, S.; Adair-Rohani, H.; Amann, M. Contributions to cities’ ambient particulate matter (PM): A systematic review of local source contributions at the global level. Atmos. Environ. 2015, 120, 475–483. [Google Scholar] [CrossRef]
  57. World Health Organization. Concentration of particulate matter with an aerodynamic diameter of 10um or less (PM10) in nearly 3000 urban areas, 2016, 2008-2015. Available online: http://gamapserver.who.int/mapLibrary/Files/Maps/Global_pm10_cities.p ng?ua=1 (accessed on 2 December 2017).
  58. Guo, Y.; Gasparrini, A.; Armstrong, B.; Li, S.; Tawatsupa, B.; Tobias, A.; Lavigne, E.; de Sousa Zanotti Stagliorio Coelho, M.; Tobias, A.; Lavigne, E.; et al. Global variation in the effects of ambient temperature on mortality: A systematic evaluation. Epidemiology 2014, 25, 781–789. [Google Scholar] [CrossRef]
  59. Guo, Y.; Gasparrini, A.; Armstrong, B.G.; Tawatsupa, B.; Tobias, A.; Lavigne, E.; de Sousa Zanotti Stagliorio Coelho, M.; Pan, X.; Kim, H.; Hashizume, M. Heat wave and mortality: A multicountry, multicommunity study. Environ. Health Perspect. 2017, 125. [Google Scholar] [CrossRef]
  60. Gordon, C.J.; Mohler, F.S.; Watkinson, W.P.; Rezvani, A.H. Temperature regulation in laboratory mammals following acute toxic insult. Toxicology 1988, 53, 161–178. [Google Scholar] [CrossRef]
  61. Crandall, C.G.; González-Alonso, J. Cardiovascular function in the heat-stressed human. Acta Physiol. 2010, 199, 407–423. [Google Scholar] [CrossRef] [Green Version]
  62. Madaniyazi, L.; Zhou, Y.; Li, S.; Williams, G.; Jaakkola, J.J.K.; Liang, X.; Liu, Y.; Wu, S.; Guo, Y. Outdoor temperature, heart rate, and blood pressure in Chinese adults: Effect modification by individual characteristics. Sci. Rep. 2016, 6, 21003. [Google Scholar] [CrossRef]
  63. Barnett, A.G.; Sans, S.; Salomaa, V.; Kuulasmaa, K.; Dobson, A.J.; WHO MONICA Project. The effect of temperature on systolic blood pressure. Blood Press Monit. 2007, 12, 195–203. [Google Scholar] [CrossRef]
  64. Ren, C.; O’Neill, M.S.; Park, S.K.; Sparrow, D.; Vokonas, P.; Schwartz, J. Ambient temperature, air pollution, and heart rate variability in an aging population. Am. J. Epidemiol. 2011, 173, 1013–1021. [Google Scholar] [CrossRef]
  65. Nelin, T.D.; Joseph, A.M.; Gorr, M.W.; Wold, L.E. Direct and indirect effects of particulate matter on the cardiovascular system. Toxicol. Lett. 2012, 208, 293–299. [Google Scholar] [CrossRef] [Green Version]
  66. Kenney, W.L.; Munce, T.A. Aging and human temperature regulation. J. Appl. Physiol. 2003, 95, 2598–2603. [Google Scholar] [CrossRef]
  67. Sacks, J.D.; Stanek, L.W.; Luben, T.J.; Johns, D.O.; Buckley, B.J.; Brown, J.S.; Ross, M. Particulate matter induced health effects: Who is susceptible? Environ. Health Perspect. 2011, 119, 446–454. [Google Scholar] [CrossRef]
  68. NSW Health. Physical Activity in Adults. HealthStats NSW. 2017. Available online: http://www.healthstats.nsw.gov.au/Indicator/beh_phys_age/beh_phys_age _snap (accessed on 2 February 2018).
  69. Tong, S.; Wang, X.Y.; Barnett, A.G. Assessment of heat-related health impacts in Brisbane, Australia: Comparison of different heat wave definitions. PLoS ONE 2010, 5, e12155. [Google Scholar] [CrossRef]
  70. Anderson, G.B.; Bell, M.L. Weather-related mortality: How heat, cold and heat waves affect mortality in the United States. Epidemiology 2009, 20, 205–213. [Google Scholar] [CrossRef]
  71. D’Ippoliti, D.; Michelozzi, P.; Marino, C.; de’Donato, F.; Menne, B.; Katsouyanni, K.; Kirchmayer, U.; Analitis, A.; Medina-Ramón, M.; Paldy, A.; et al. The impact of heat waves on mortality in 9 European cities: results from the EuroHEAT project. Environ. Health 2010, 9, 37. [Google Scholar] [CrossRef]
  72. Kovats, S.; Hajat, S.; Wilkinson, P. Contrasting patterns of mortality and hospital admissions during hot weather and heat waves in Greater London, UK. Occup. Environ. Med. 2004, 61, 893–898. [Google Scholar] [CrossRef] [Green Version]
Figure 1. The association between heat wave days and “emergency” hospital admissions (EHAs) for six cardiovascular diseases with and without controlling for daily average particulate matter (PM10) at lag0 in the SSD during the warm season, 2001 to 2013. Note: Cond. Disorders is conduction disorders; Hyper. Diseases is hypertensive diseases; Isch. Heart Disease is Ischemic Heart Disease.
Ijerph 16 03270 g001
Table 1. Descriptive statistics for environmental variables in the SSD during the warm season, 2001 to 2013.
Environmental VariablesMean (SD) ValueMaximum ValueMinimum Value
Weather (Degrees Celsius (°C))
  Daily average maximum temperature 26.40 (4.38)43.9914.41
  Daily average mean temperature 21.34 (3.05)32.3812.47
  Daily average minimum temperature 16.27 (2.70)24.396.82
  Daily average dew-point temperature 14.92 (3.34)22.10−0.13
Ambient Air pollution
  Daily average ozone (pphm)3.78 (1.48)11.521.04
  Daily average PM10 (µg/m3)20.43 (11.48)222.304.57
  Daily average nitrogen dioxide (pphm)1.44 (0.59)4.560.29
Table 2. Descriptive statistics for EHAs for six cardiovascular diseases in the Sydney Statistical Division (SSD) during the warm season, 2001 to 2013.
ICD Code (ICD-10-AM)Total CountMedian (IQR) Daily ValueMaximum Daily ValueMinimum Daily Value
Cardiovascular Disease
Ischemic Heart Disease I20–I25
  All ages 68,33437 (31–43)7014
  0–64 years 28,49715 (12–19)343
  65 years and over 39,83722 (18–26)465
Heart FailureI50
  All ages 24,72113 (10–17)312
  0–64 years 34702 (1–3)90
  65 years and over 21,25111 (9–14)280
Cardiac ArrestI46
  All ages 18611 (0–2)60
  0–64 years 8020 (0–1)40
  65 years and over 10590 (0–1)40
Heart ArrhythmiaI47–I49
  All ages 32,68218 (14–21)365
  0–64 years 12,4617 (5–9)190
  65 years and over 20,22111 (8–14)251
Conduction Disorders I44–I45
  All ages 30701 (1–3)70
  0–64 years 6410 (0–1)40
  65 years and over 24291 (0–2)70
Hypertensive DiseasesI10–I15
  All ages 38592 (1–3)90
  0–64 years 15711 (0–1)60
  65 years and over 22881 (0–2)70
Table 3. Summary of heat wave characteristics for each heat wave definition used.
Heat Wave DefinitionTotal Number of Heat Wave DaysTotal Number of Heat Wave EventsAverage Intensity a of Heat Wave Day (°C)Average Duration of Heat Wave (in Days)
HWD01983835.192.58
HWD021134327.312.63
HWD031143920.752.92
a The average intensity was calculated using the temperature metric used in each heat wave definition.
Table 4. The effect of heat wave days on EHAs for six cardiovascular diseases on days with high levels of PM10 compared to days with low levels of PM10 in the SSD during the warm season, 2001 to 2013, for all ages. Effects are presented as odds ratios with their corresponding 95% confidence intervals.
HWD01HWD02HWD03
Lag0Lag1Lag0Lag1Lag0Lag1
Heat EffectHeat EffectHeat EffectHeat EffectHeat EffectHeat EffectHeat EffectHeat EffectHeat EffectHeat EffectHeat EffectHeat Effect
Low PM10 High PM10 Low PM10 High PM10 Low PM10 High PM10 Low PM10 High PM10 Low PM10 High PM10 Low PM10High PM10
Cardiovascular Disease
Ischemic Heart0.920.920.970.940.980.920.980.921.030.951.041.01
Disease(0.87, 0.98)(0.86, 0.98)(0.92, 1.02)(0.87, 1.01)(0.93, 1.03)(0.86, 0.97)(0.94, 1.03)(0.85, 0.99)(0.98, 1.07)(0.87, 1.03)(1.00, 1.08)(0.93, 1.09)
Heart Failure0.941.000.830.940.990.970.890.941.011.010.950.93
(0.85, 1.04)(0.90, 1.11)(0.76, 0.90)(0.83, 1.06)(0.90, 1.08)(0.87, 1.08)(0.83, 0.95)(0.83, 1.06)(0.93, 1.09)(0.88, 1.16)(0.89, 1.01)(0.80, 1.07)
Cardiac Arrest1.060.991.051.300.881.221.081.410.931.131.211.24
(0.73, 1.55)(0.69, 1.41)(0.77, 1.41)(0.86, 1.97)(0.62, 1.23)(0.86, 1.74)(0.84, 1.40)(0.93, 2.14)(0.68, 1.26)(0.70, 1.83)(0.95, 1.55)(0.75, 2.07)
Heart Arrhythmia0.951.010.990.940.981.020.990.971.000.961.060.96
(0.86, 1.04)(0.92, 1.10)(0.92, 1.06)(0.84, 1.04)(0.92, 1.06)(0.93, 1.12)(0.93, 1.05)(0.87, 1.08)(0.94, 1.07)(0.85, 1.08)(1.00, 1.12)(0.85, 1.09)
Conduction 0.841.040.910.920.900.960.940.871.110.890.890.86
Disorders(0.63, 1.12)(0.77, 1.41)(0.73, 1.13)(0.64, 1.33)(0.71, 1.14)(0.71, 1.30)(0.77, 1.13)(0.60, 1.25)(0.91, 1.37)(0.60, 1.31)(0.74, 1.07)(0.57, 1.30)
Hypertensive Diseases 0.860.870.910.920.880.820.910.910.901.100.861.30 *
(0.65, 1.13)(0.66, 1.16)(0.83, 1.25)(0.65, 1.30)(0.70, 1.12)(0.61, 1.09)(0.76, 1.09)(0.64, 1.29)(0.74, 1.10)(0.75, 1.60)(0.73, 1.02)(0.90, 1.89)
* Denotes a statistically significant positive interaction term p-value (<0.05).
Table 5. The effect of heat wave days on EHAs for six cardiovascular diseases on days with high levels of PM10 compared to days with low levels of PM10 in the SSD during the warm season, 2001 to 2013, for those aged 0–64 years and 65 years and over. Effects are presented as odds ratios with their corresponding 95% confidence intervals.
HWD01HWD02HWD03
Lag0Lag1Lag0Lag1Lag0Lag1
Heat EffectHeat EffectHeat EffectHeat EffectHeat EffectHeat EffectHeat EffectHeat EffectHeat EffectHeat EffectHeat EffectHeat Effect
Low PM10 High PM10 Low PM10 High PM10 Low PM10 High PM10 Low PM10 High PM10 Low PM10 High PM10 Low PM10 High PM10
Cardiovascular Disease
Ischemic Heart Disease
0–64 years0.970.941.031.001.020.921.000.941.071.011.081.09
(0.88, 1.07)(0.85, 1.03)(0.96, 1.11)(0.89, 1.11)(0.94, 1.11)(0.84, 1.02)(0.94, 1.07)(0.84, 1.05)(1.00, 1.15)(0.89, 1.14)(1.02, 1.15)(0.96, 1.23)
65 years and over0.890.900.930.890.950.910.970.900.990.901.000.95
(0.82, 0.96)(0.83, 0.98)(0.87, 0.99)(0.81, 0.98)(0.88, 1.01)(0.84, 0.99)(0.92, 1.03)(0.82, 0.99)(0.93, 1.05)(0.81, 1.01)(0.95, 1.06)(0.85, 1.06)
Heart Failure
0–64 years1.050.880.740.901.170.910.850.931.221.321.030.97
(0.80, 1.38)(0.66, 1.17)(0.59, 0.92)(0.64, 1.27)(0.93, 1.47)(0.68, 1.21)(0.71, 1.02)(0.67, 1.31)(1.001, 1.49)(0.92, 1.89)(0.87, 1.23)(0.66, 1.43)
65 years and over0.921.030.840.960.960.980.890.940.970.970.930.92
(0.83, 1.03)(0.92, 1.15)(0.77, 0.92)(0.83, 1.08)(0.87, 1.06)(0.88, 1.10)(0.83, 0.97)(0.82, 1.08)(0.90, 1.06)(0.83, 1.13)(0.87, 1.01)(0.78, 1.07)
Cardiac Arrest
0–64 years0.900.831.310.780.991.141.301.080.961.351.251.35
(0.52, 1.58)(0.47, 1.45)(0.84, 2.04)(0.40, 1.52)(0.60, 1.62)(0.67, 1.97)(0.89, 1.89)(0.56, 2.08)(0.62, 1.49)(0.68, 2.67)(0.88, 1.77)(0.63, 2.90)
65 years and over 1.191.110.911.85 *0.781.280.931.65 *0.900.961.181.16
(0.71, 2.01)(0.70, 1.78)(0.62, 1.34)(1.08, 3.16)(0.48, 1.25)(0.80, 2.05)(0.65, 1.32)(0.96, 2.84)(0.58, 1.38)(0.48, 1.89)(0.84, 1.67)(0.59, 2.29)
Heart Arrhythmia
0–64 years0.910.991.130.91 **0.961.071.070.910.960.951.030.84
(0.78, 1.06)(0.86, 1.14)(1.01, 1.27)(0.77, 1.09)(0.85, 1.05)(0.93, 1.24)(0.97, 1.18)(0.76, 1.08)(0.86, 1.06)(0.79, 1.15)(0.94, 1.13)(0.69, 1.03)
65 years and over0.971.020.910.950.990.990.941.011.030.971.071.05
(0.86, 1.09)(0.91, 1.15)(0.83, 0.998)(0.83, 1.09)(0.90, 1.09)(0.88, 1.11)(0.87, 1.01)(0.89, 1.16)(0.95, 1.12)(0.83, 1.13)(1.00, 1.15)(0.90, 1.23)
Conduction Disorders
0–64 years0.801.031.261.800.911.211.241.361.071.221.061.20
(0.41, 1.54)(0.52, 2.02)(0.77, 2.06)(0.83, 4.01)(0.54, 1.53)(0.63, 2.35)(0.81, 1.91)(0.61, 3.04)(0.67, 1.71)(0.53, 2.78)(0.72, 1.57)(0.52, 2.80)
65 years and over0.841.040.830.770.890.890.870.761.120.810.840.77
(0.61, 1.16)(0.74, 1.47)(0.65, 1.07)(0.51, 1.16)(0.68, 1.16)(0.63, 1.27)(0.70, 1.08)(0.50, 1.16)(0.89, 1.41)(0.52, 1.26)(0.68, 1.04)(0.48, 1.24)
Hypertensive Diseases
0–64 years0.890.960.890.930.911.161.061.221.111.881.081.82
(0.58, 1.36)(0.62, 1.48)(0.65, 1.24)(0.55, 1.56)(0.63, 1.31)(0.75, 1.78)(0.80, 1.39)(0.73, 2.03)(0.81, 1.52)(1.07, 3.28)(0.83, 1.40)(1.03, 3.20)
65 years and over0.840.821.110.920.870.620.820.740.790.740.741.02
(0.59, 1.21)(0.56, 1.19)(0.86, 1.44)(0.58, 1.44)(0.65, 1.18)(0.42, 0.93)(0.65, 1.05)(0.46, 1.18)(0.61, 1.02)(0.43, 1.25)(0.59, 0.92)(0.62, 1.68)
* Denotes a statistically significant positive interaction term p-value (<0.05). ** Denotes a statistically significant negative interaction term p-value (<0.05).

