Particulate Matter Emissions of Four Different Cigarette Types of One Popular Brand: Influence of Tobacco Strength and Additives

 , ,
, ,
Abstract
:1. Introduction
2. Materials and Methods
2.1. Tobacco Products
2.2. Automatic Environmental Tobacco Smoke Emitter (AETSE)
2.3. Smoking Protocol
2.4. Measurement Equipment
2.5. Data Processing
3. Results
4. Discussion
5. Conclusions
Author Contributions
Funding
Conflicts of Interest
References
- Drope, J.; Schluger, N.W.; Cahn, Z.; Drope, J.; Hamill, S.; Islami, F.; Liber, A.; Nargis, N.; Stoklosa, M. The Tobacco Atlas (6th Edition). Available online: https://files.tobaccoatlas.org/wp-content/uploads/2018/03/TobaccoAtlas_6thEdition_LoRes.pdf (accessed on 27 March 2018).
- Juranic, B.; Rakosec, Z.; Jakab, J.; Miksic, S.; Vuletic, S.; Ivandic, M.; Blazevic, I. Prevalence, habits and personal attitudes towards smoking among health care professionals. J. Occup. Med. Toxicol. 2017, 12, 20. [Google Scholar] [CrossRef]
- U.S. Public Health Service. The Health Consequences of Smoking—50 Years of Progress: A Report of the Surgeon General-Executive Summary. 2014. Available online: https://www.Surgeongeneral.Gov/library/reports/50-years-of-progress/full-report.Pdf (accessed on 27 March 2018).
- DKFZ. Passivrauchen-Ein Unterschätztes Gesundheitsrisiko. Available online: https://www.dkfz.de/de/tabakkontrolle/download/Publikationen/RoteReihe/Passivrauchen_Band_5_2Auflage.pdf (accessed on 27 March 2018).
- Avino, P.; Scungio, M.; Stabile, L.; Cortellessa, G.; Buonanno, G.; Manigrasso, M. Second-hand aerosol from tobacco and electronic cigarettes: Evaluation of the smoker emission rates and doses and lung cancer risk of passive smokers and vapers. Sci. Total Environ. 2018, 642, 137–147. [Google Scholar] [CrossRef] [PubMed]
- Van Deusen, A.; Hyland, A.; Travers, M.J.; Wang, C.; Higbee, C.; King, B.A.; Alford, T.; Cummings, K.M. Secondhand smoke and particulate matter exposure in the home. Nicotine Tob. Res. 2009, 11, 635–641. [Google Scholar] [CrossRef] [PubMed]
- Brunekreef, B.; Holgate, S.T. Air pollution and health. Lancet 2002, 360, 1233–1242. [Google Scholar] [CrossRef]
- Feleszko, W.; Zawadzka-Krajewska, A.; Matysiak, K.; Lewandowska, D.; Peradzynska, J.; Dinh, Q.T.; Hamelmann, E.; Groneberg, D.A.; Kulus, M. Parental tobacco smoking is associated with augmented IL-13 secretion in children with allergic asthma. J. Allergy Clin. Immunol. 2006, 117, 97–102. [Google Scholar] [CrossRef] [PubMed]
- Chi, M.C.; Guo, S.E.; Hwang, S.L.; Chou, C.T.; Lin, C.M.; Lin, Y.C. Exposure to indoor particulate matter worsens the symptoms and acute exacerbations in chronic obstructive pulmonary disease patients of southwestern taiwan: A pilot study. Int. J. Environ. Res. Public Health 2016, 14, 4. [Google Scholar] [CrossRef] [PubMed]
- Anderson, J.O.; Thundiyil, J.G.; Stolbach, A. Clearing the air: A review of the effects of particulate matter air pollution on human health. J. Med. Toxicol. 2012, 8, 166–175. [Google Scholar] [CrossRef]
- Ngoc, L.T.N.; Park, D.; Lee, Y.; Lee, Y.C. Systematic review and meta-analysis of human skin diseases due to particulate matter. Int. J. Environ. Res. Public Health 2017, 14, 1458. [Google Scholar] [CrossRef]
- Tagliabue, G.; Borgini, A.; Tittarelli, A.; van Donkelaar, A.; Martin, R.V.; Bertoldi, M.; Fabiano, S.; Maghini, A.; Codazzi, T.; Scaburri, A.; et al. Atmospheric fine particulate matter and breast cancer mortality: A population-based cohort study. BMJ Open 2016, 6, e012580. [Google Scholar] [CrossRef]
- Zhang, C.; Meng, Q.; Zhang, X.; Wu, S.; Wang, S.; Chen, R.; Li, X. Role of astrocyte activation in fine particulate matter-enhancement of existing ischemic stroke in sprague-dawley male rats. J. Toxicol. Environ. Health A 2016, 79, 393–401. [Google Scholar] [CrossRef]
- Protano, C.; Manigrasso, M.; Avino, P.; Vitali, M. Second-hand smoke generated by combustion and electronic smoking devices used in real scenarios: Ultrafine particle pollution and age-related dose assessment. Environ. Int. 2017, 107, 190–195. [Google Scholar] [CrossRef] [PubMed]
- Pope, C.A., 3rd. Epidemiology of fine particulate air pollution and human health: Biologic mechanisms and who’s at risk? Environ. Health Perspect. 2000, 108 (Suppl. 4), 713–723. [Google Scholar] [CrossRef]
- Brown, J.S.; Gordon, T.; Price, O.; Asgharian, B. Thoracic and respirable particle definitions for human health risk assessment. Part. Fibre Toxicol. 2013, 10, 12. [Google Scholar] [CrossRef] [PubMed] [Green Version]
- Kim, K.H.; Kabir, E.; Kabir, S. A review on the human health impact of airborne particulate matter. Environ. Int. 2015, 74, 136–143. [Google Scholar] [CrossRef]
- Donaldson, K.; Stone, V.; Clouter, A.; Renwick, L.; MacNee, W. Ultrafine particles. Occup. Environ. Med. 2001, 58, 211–216. [Google Scholar] [CrossRef] [PubMed] [Green Version]
- Manigrasso, M.; Natale, C.; Vitali, M.; Protano, C.; Avino, P. Pedestrians in traffic environments: Ultrafine particle respiratory doses. Int. J. Environ. Res. Public Health 2017, 14, 288. [Google Scholar] [CrossRef]
- U.S. Environmental Protection Agency. Particulate Matter (pm) Pollution. 2017. Available online: https://www.Epa.Gov/pm-pollution/particulate-matter-pm-basics#pm (accessed on 4 April 2018).
- Gerber, A.; Bigelow, A.; Schulze, M.; Groneberg, D.A. Brand cigarillos—A cheap and less harmful alternative to cigarettes? Particulate matter emissions suggest otherwise. Int. J. Environ. Res. Public Health 2015, 12, 428–438. [Google Scholar] [CrossRef] [PubMed]
- Wasel, J.; Boll, M.; Schulze, M.; Mueller, D.; Bundschuh, M.; Groneberg, D.A.; Gerber, A. Brand cigarillos: Low price but high particulate matter levels-is their favorable taxation in the european union justified? Int. J. Environ. Res. Public Health 2015, 12, 9141–9153. [Google Scholar] [CrossRef]
- Kant, N.; Muller, R.; Braun, M.; Gerber, A.; Groneberg, D. Particulate matter in second-hand smoke emitted from different cigarette sizes and types of the brand vogue mainly smoked by women. Int. J. Environ. Res. Public Health 2016, 13, 799. [Google Scholar] [CrossRef]
- Rustemeier, K.; Stabbert, R.; Haussmann, H.J.; Roemer, E.; Carmines, E.L. Evaluation of the potential effects of ingredients added to cigarettes. Part 2: Chemical composition of mainstream smoke. Food Chem. Toxicol. 2002, 40, 93–104. [Google Scholar] [CrossRef]
- PMI. Philip Morris International. 2018. Available online: https://www.Pmi.Com/ (accessed on 11 April 2018).
- UK University of Kentucky; Kentucky Tobacco Research and Development Center. 3r4f Preliminary Analysis. 2018. Available online: https://ctrp.Uky.Edu/resources/pdf/webdocs/3r4f%20preliminary%20analysis.Pdf (accessed on 11 April 2018).
- BMEL. Bundesministerium für Ernährung und Landwirtschaft. Tabakzusatzstoffe. Marlboro. Available online: https://service.Bmel.De/tabakerzeugnisse/index2.Php?Site_key=153 (accessed on 27 August 2018).
- PM. Philip Morris USA, Our Products & Ingredients. 2018. Available online: http://www.Altria.Com/our-companies/philipmorrisusa/our-products-and-ingredients/pages/default.Aspx (accessed on 17 May 2018).
- Schimpf-Ing. Electronics Development. 2015. Available online: http://www.Schimpf-ing.No/index_e.Html (accessed on 12 April 2018).
- Mueller, D.; Uibel, S.; Braun, M.; Klingelhoefer, D.; Takemura, M.; Groneberg, D.A. Tobacco smoke particles and indoor air quality (topiq)—The protocol of a new study. J. Occup. Med. Toxicol. 2011, 6, 35. [Google Scholar] [CrossRef] [PubMed]
- Gerber, A.; Hofen-Hohloch, A.V.; Schulze, J.; Groneberg, D.A. Tobacco smoke particles and indoor air quality (topiq-ii)—A modified study protocol and first results. J. Occup. Med. Toxicol. 2015, 10, 5. [Google Scholar] [CrossRef] [PubMed]
- Grimm. Grimm Aerosol Technik Gmbh& co.Kg Ainring. Portable Laser Aerosolspectrometer and Dust Monitor Model 1.108/1.109 (Manual). 2010. Available online: http://wmo-gaw-wcc-aerosol-physics.Org/files/opc-grimm-model-1.108-and-1.109.Pdf (accessed on 17 May 2018).
- Grimm. Grimm Aerosol Technik Gmbh& co.Kg Ainring. Grimm Software Für Optical Particle Counter Tragbares Aerosolspektrometer 1.108/1.109. 2012. Available online: http://wiki.Grimm-aerosol.De/images/c/c6/m_d_labview_software_rev_2p1.Pdf (accessed on 17 May 2018).
- CEN. European Committee for Standardization: Workplace Atmospheres-Size Fraction Definitions for Measurement of Airborne Particles; Report No. Bs en 481:1993; British Standards Institute: London, UK, 1993. [Google Scholar]
- Semple, S.; Apsley, A.; Azmina Ibrahim, T.; Turner, S.W.; Cherrie, J.W. Fine particulate matter concentrations in smoking households: Just how much secondhand smoke do you breathe in if you live with a smoker who smokes indoors? Tob. Control 2015, 24, e205–e211. [Google Scholar] [CrossRef] [PubMed]
- Weitzman, M.; Yusufali, A.H.; Bali, F.; Vilcassim, M.J.R.; Gandhi, S.; Peltier, R.; Nadas, A.; Sherman, S.; Lee, L.; Hong, Z.; et al. Effects of hookah smoking on indoor air quality in homes. Tob. Control 2016, 26, 586–591. [Google Scholar] [CrossRef] [PubMed] [Green Version]
- World Health Organization. Air Quality Guidelines for Particulate Matter, Ozone, Nitrogen Dioxide and Sulfur Dioxide. Global Update 2005. Summary of Risk Assessment. 2005. Available online: http://apps.Who.Int/iris/bitstream/handle/10665/69477/who_sde_phe_oeh_06.02_eng.Pdf (accessed on 8 July 2018).
- EPA; U.S. Environmental Protection Agency; U.S. Department of Energy (Doe). Fuel Economy Guide. 2018. Available online: https://www.Fueleconomy.Gov/feg/pdfs/guides/feg2018.Pdf (accessed on 18 July 2018).
- Sendzik, T.; Fong, G.T.; Travers, M.J.; Hyland, A. An experimental investigation of tobacco smoke pollution in cars. Nicotine Tob. Res. 2009, 11, 627–634. [Google Scholar] [CrossRef] [PubMed] [Green Version]
- McGrath, C.; Warren, N.; Biggs, P.; McAughey, J. Real-time measurement of inhaled and exhaled cigarette smoke: Implications for dose. J. Phys. Conf. Ser. 2009, 151, 012018. [Google Scholar] [CrossRef] [Green Version]
- Sahu, S.K.; Tiwari, M.; Bhangare, R.C.; Pandit, G.G. Particle size distribution of mainstream and exhaled cigarette smoke and predictive deposition in human respiratory tract. Aerosol Air Qual. Res. 2013, 13, 324–332. [Google Scholar] [CrossRef]
- Keil, U.; Prugger, C.; Heidrich, J. Passivrauchen. Public Health Forum 2016, 24, 84–87. [Google Scholar] [CrossRef]
- Nowak, D.; Raupach, T.; Radon, K.; Andreas, S. Passivrauchen als gesundheitsrisiko. Pneumologe 2008, 5, 386–392. [Google Scholar] [CrossRef]
- World Health Organization. Who Toblabnet Official Method Sop 01. Standard Operating Procedure for Intense Smoking of Cigarettes. 2012. Available online: http://apps.Who.Int/iris/bitstream/10665/75261/1/9789241503891_eng.Pdf (accessed on 19 July 2018).
- International Organization for Standardization. Iso/tr 17219:2013(en). Review of Human Smoking Behaviour and Recommendations for a New ISO Standard for the Machine Smoking of Cigarettes. 2013. Available online: https://www.Iso.Org/obp/ui/#iso:Std:Iso:Tr:17219:En (accessed on 19 July 2018).
- Hammond, D.; Wiebel, F.; Kozlowski, L.T.; Borland, R.; Cummings, K.M.; O’Connor, R.J.; McNeill, A.; Connolly, G.N.; Arnott, D.; Fong, G.T. Revising the machine smoking regime for cigarette emissions: Implications for tobacco control policy. Tob. Control 2007, 16, 8–14. [Google Scholar] [CrossRef] [PubMed]
- Liu, C.; McAdam, K.G.; Perfetti, T.A. Some recent topics in cigarette smoke science. Mini-Rev. Org. Chem. 2011, 8, 349–359. [Google Scholar] [CrossRef]
- Marian, C.; O’Connor, R.J.; Djordjevic, M.V.; Rees, V.W.; Hatsukami, D.K.; Shields, P.G. Reconciling human smoking behavior and machine smoking patterns: Implications for understanding smoking behavior and the impact on laboratory studies. Cancer Epidemiol. Prev. Biomark. 2009, 18, 3305–3320. [Google Scholar] [CrossRef] [PubMed]
- Wright, C. Standardized methods for the regulation of cigarette-smoke constituents. TrAC Trend Anal. Chem. 2015, 66, 118–127. [Google Scholar] [CrossRef] [Green Version]
- Shin, H.J.; Sohn, H.O.; Han, J.H.; Park, C.H.; Lee, H.S.; Lee, D.W.; Hwang, K.J.; Hyun, H.C. Effect of cigarette filters on the chemical composition and in vitro biological activity of cigarette mainstream smoke. Food Chem. Toxicol. 2009, 47, 192–197. [Google Scholar] [CrossRef] [PubMed]
- Government of Canada. Environment and Natural Resources. Common Air Contaminents. Particulate Matter. 2013. Available online: https://www.canada.ca/en/environment-climate-change/services/air-pollution/pollutants/common-contaminants/particulate-matter.html (accessed on 28 August 2018).
- Keith, C.H.; Derrick, J.C. Cigarette filter efficiency as measured with a homogeneous solid aerosol. Tob. Sci. 1965, 9, 116–120. [Google Scholar]
- Gaworski, C.L.; Dozier, M.M.; Gerhart, J.M.; Rajendran, N.; Brennecke, L.H.; Aranyi, C.; Heck, J.D. 13-week inhalation toxicity study of menthol cigarette smoke. Food Chem. Toxicol. 1997, 35, 683–692. [Google Scholar] [CrossRef]
- Gerharz, J.; Bendels, M.H.K.; Braun, M.; Klingelhofer, D.; Groneberg, D.A.; Mueller, R. Particulate matter emissions of different brands of mentholated cigarettes. J. Air Waste Manag. Assoc. 2018, 68, 608–615. [Google Scholar] [CrossRef]
- Wertz, M.S.; Kyriss, T.; Paranjape, S.; Glantz, S.A. The toxic effects of cigarette additives. Philip morris’ project mix reconsidered: An analysis of documents released through litigation. PLoS Med. 2011, 8, e1001145. [Google Scholar] [CrossRef]
- Keith, C.H.; Derrick, J.C. Measurement of the particle size distribution and concentration of cigarette smoke by the “conifuge”. J. Colloid Sci. 1960, 15, 340–356. [Google Scholar] [CrossRef]
- Nazaroff, W.W.; Klepeis, N.E. Indoor Environment: Airborne Particles and Settled Dust. Environmental Tobacco Smoke Particles; Wiley-VCH Verlag GmbH & Co. KG: Weinheim, Germany, 2003; pp. 245–274. [Google Scholar]
- Guerin, M.R.; Higgins, C.E.; Jenkins, R.A. Measuring environmental emissions from tobacco combustion—Sidestream cigarette-smoke literature-review. Atmos. Environ. 1987, 21, 291–297. [Google Scholar] [CrossRef]
- Ueno, Y.; Peters, L.K. Size and generation rate of sidestream cigarette-smoke particles. Aerosol Sci. Technol. 1986, 5, 469–476. [Google Scholar] [CrossRef]
- Manigrasso, M.; Vitali, M.; Protano, C.; Avino, P. Temporal evolution of ultrafine particles and of alveolar deposited surface area from main indoor combustion and non-combustion sources in a model room. Sci. Total Environ. 2017, 598, 1015–1026. [Google Scholar] [CrossRef] [PubMed]
- Haustein, K.O.; Groneberg, D.A. Tabakabhängigkeit. Gesundheitliche Schäden Durch Das Rauchen; Springer: Berlin/Heidelberg, Germany, 2008. [Google Scholar]
- Protano, C.; Cattaruzza, M.S.; Osborn, J.F.; Vitali, M. Indoor particulate matter and secondhand smoke: Simulation of an exposure scenario. Annali di Igiene 2014, 26, 186–189. [Google Scholar]
- Burkart, J.; Steiner, G.; Reischl, G.; Moshammer, H.; Neuberger, M.; Hitzenberger, R. Characterizing the performance of two optical particle counters (grimm opc1.108 and opc1.109) under urban aerosol conditions. J. Aerosol Sci. 2010, 41, 953–962. [Google Scholar] [CrossRef] [PubMed]
- Ohlwein, S.; Hoffmann, B.; Kappeler, R.; Joss, M.; Künzli, N. Health Effects of Ultrafine Particles. Systematic Literature Search and the Potential Transferability of the Results to the German Setting. Available online: https://www.umweltbundesamt.de/sites/default/files/medien/376/publikationen/uba_ufp_health_effects_haupt_final.pdf (accessed on 19 December 2018).
- Grimm, H.; Eatough, D.J. Aerosol measurement: The use of optical light scattering for the determination of particulate size distribution, and particulate mass, including the semi-volatile fraction. J. Air Waste Manag. Assoc. 2009, 59, 101–107. [Google Scholar] [CrossRef] [PubMed]
- United States Environmental Protection Agency. List of Designated Reference and Equivalent Methods. 16 June 2017. Available online: https://www3.Epa.Gov/ttn/amtic/files/ambient/criteria/amtic_list_june_2017_update_6-19-2017.Pdf (accessed on 7 August 2018).
- CEN. European Committee for Standardization. Cen/tc 264—Air Quality en 12341. Ambient Air—Standard Gravimetric Measurement Method for the Determination of the PM10 or PM2.5 Mass Concentration of Suspended Particulate Matter; British Standard Institute: London, UK, 2014; Available online: https://standards.Cen.Eu/dyn/www/f?P=204:110:0::::Fsp_project,fsp_org_id:29133,6245&cs=1dc6eb16dd302e384b46a7097aac67cb5 (accessed on 7 August 2018).
- Bolte, G.; Heitmann, D.; Kiranoglu, M.; Schierl, R.; Diemer, J.; Koerner, W.; Fromme, H. Exposure to environmental tobacco smoke in german restaurants, pubs and discotheques. J. Expo. Sci. Environ. Epidemiol. 2008, 18, 262–271. [Google Scholar] [CrossRef] [PubMed]
- Fromme, H.; Twardella, D.; Dietrich, S.; Heitmann, D.; Schierl, R.; Liebl, B.; Ruden, H. Particulate matter in the indoor air of classrooms—Exploratory results from munich and surrounding area. Atmos. Environ. 2007, 41, 854–866. [Google Scholar] [CrossRef]


| Ingredients & Dimensions | 3R4F Reference Cigarette | Marlboro Silver Blue | Marlboro Gold | Marlboro Red | Marlboro Red without Additives |
|---|---|---|---|---|---|
| Tar (mg) | 9.4 | 4 | 6 | 10 | 10 |
| Nicotine (mg) | 0.73 | 0.4 | 0.5 | 0.8 | 0.9 |
| Carbon monoxide (mg) | 12 | 5 | 7 | 10 | 10 |
| Additives | yes | yes | yes | yes | no |
| Filter length (mm) | 27 | 21 | 21 | 21 | 21 |
| Filter diameter (mm) | 8 | 8 | 8 | 8 | 8 |
| Cigarette length (mm) | 84 | 84 | 84 | 84 | 84 |
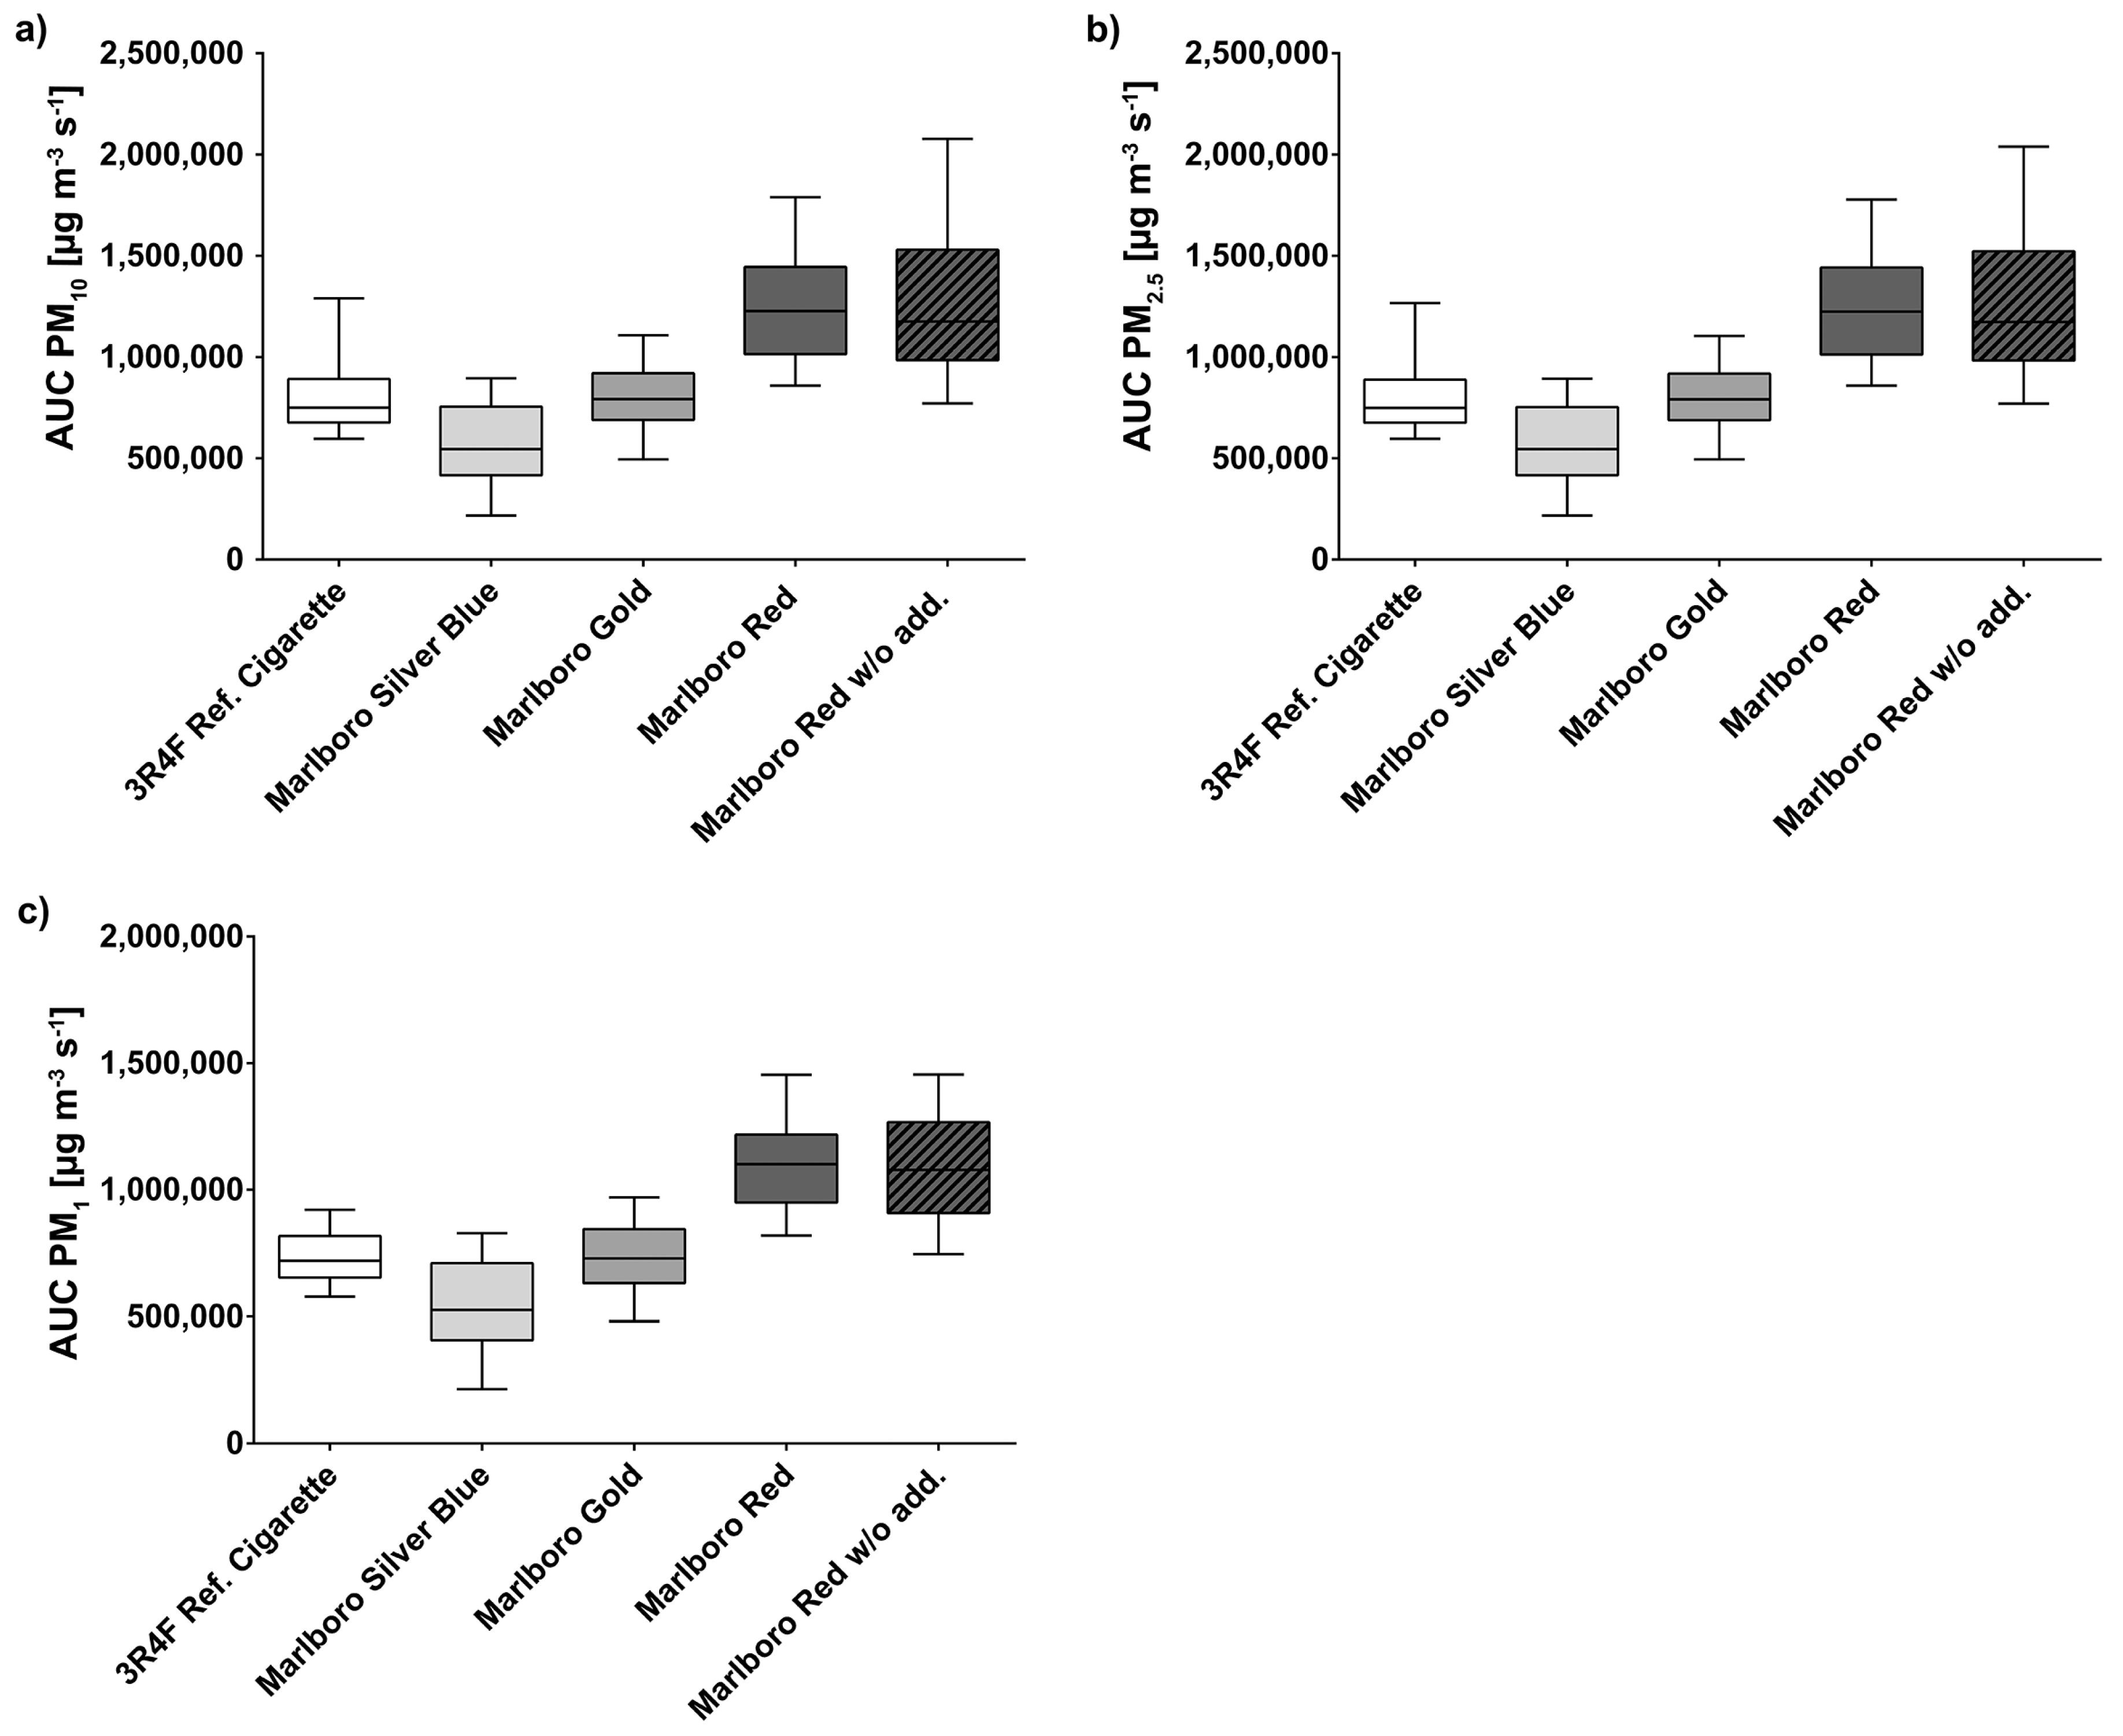
| 3R4F Reference Cigarette | Marlboro Silver Blue | Marlboro Gold | Marlboro Red | Marlboro Red w/o add. | |
|---|---|---|---|---|---|
| AUC PM10 (µg·m−3·s−1) | 792,720 ± 152,480 | 578,280 ± 193,768 | 806,440 ± 157,991 | 1234,440 ± 258,690 | 1,256,570 ± 342,629 |
| AUC PM2.5 (µg·m−3·s−1) | 790,730 ± 148,547 | 577,440 ± 193,224 | 804,940 ± 157,426 | 1,230,380 ± 255,426 | 1,251,390 ± 335,957 |
| AUC PM1 (µg·m−3·s−1) | 733,960 ± 94,781 | 546,230 ± 169,955 | 742,580 ± 135,493 | 1,093,950 ± 173,391 | 1,088,220 ± 202,603 |
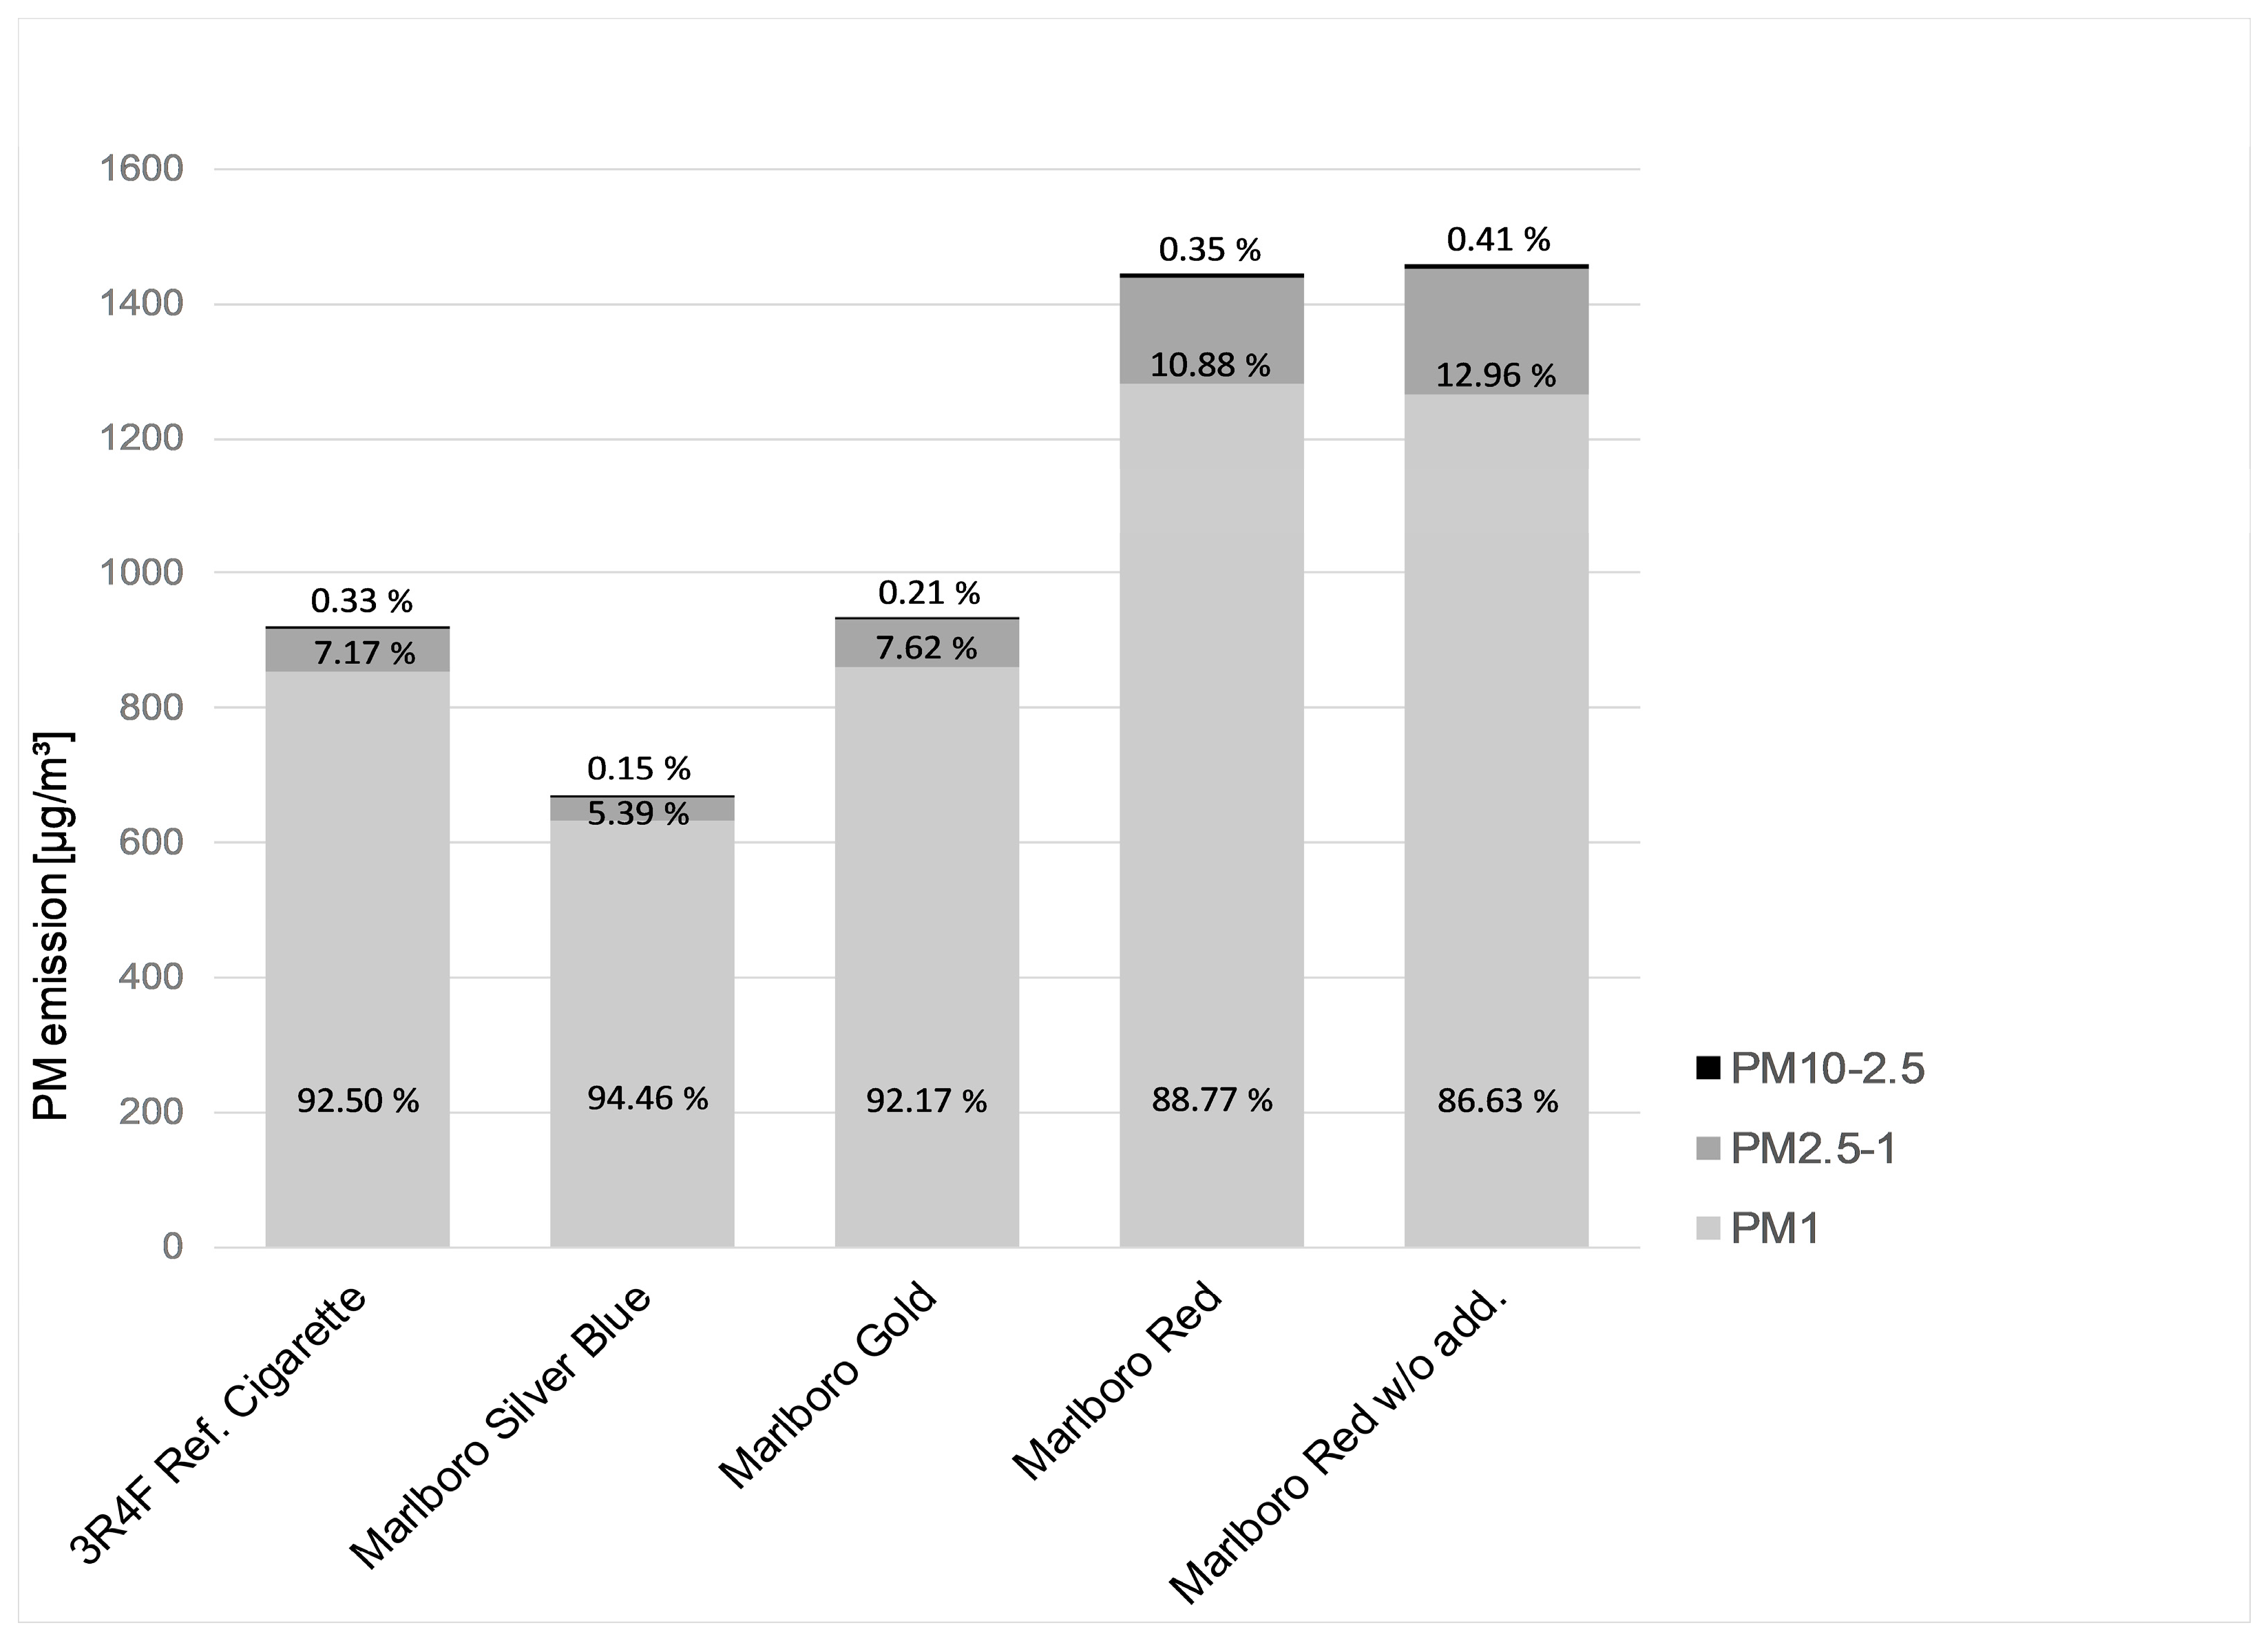
| Cmean PM10 (µg·m−3) | 921 ± 176 | 668 ± 223 | 932 ± 183 | 1443 ± 307 | 1458 ± 397 |
| Cmean PM2.5 (µg·m−3) | 918 ± 172 | 667 ± 223 | 930 ± 182 | 1438 ± 303 | 1452 ± 389 |
| Cmean PM1 (µg·m−3) | 852 ± 109 | 631 ± 196 | 859 ± 157 | 1281 ± 215 | 1263 ± 238 |
| Paired Comparisons of Tobacco Products | AUC PM10 | AUC PM2.5 | AUC PM1 |
|---|---|---|---|
| 3R4F vs. Marlboro red w/o add. | **** | **** | **** |
| 3R4F vs. Marlboro red | **** | **** | **** |
| 3R4F vs. Marlboro gold | ns | ns | ns |
| 3R4F vs. Marlboro silver blue | * | * | ** |
| Marlboro red vs. Marlboro red w/o additives | ns | ns | ns |
| Marlboro red vs. Marlboro gold | **** | **** | **** |
| Marlboro red vs. Marlboro silver blue | **** | **** | **** |
| Marlboro gold vs. Marlboro red w/o add. | **** | **** | **** |
| Marlboro gold vs. Marlboro silver blue | * | * | ** |
| Marlboro silver blue vs. Marlboro red w/o additives | **** | **** | **** |
© 2019 by the authors. Licensee MDPI, Basel, Switzerland. This article is an open access article distributed under the terms and conditions of the Creative Commons Attribution (CC BY) license (http://creativecommons.org/licenses/by/4.0/).
Share and Cite
Braun, M.; Koger, F.; Klingelhöfer, D.; Müller, R.; Groneberg, D.A. Particulate Matter Emissions of Four Different Cigarette Types of One Popular Brand: Influence of Tobacco Strength and Additives. Int. J. Environ. Res. Public Health 2019, 16, 263. https://doi.org/10.3390/ijerph16020263
Braun M, Koger F, Klingelhöfer D, Müller R, Groneberg DA. Particulate Matter Emissions of Four Different Cigarette Types of One Popular Brand: Influence of Tobacco Strength and Additives. International Journal of Environmental Research and Public Health. 2019; 16(2):263. https://doi.org/10.3390/ijerph16020263
Chicago/Turabian StyleBraun, Markus, Friedemann Koger, Doris Klingelhöfer, Ruth Müller, and David A. Groneberg. 2019. "Particulate Matter Emissions of Four Different Cigarette Types of One Popular Brand: Influence of Tobacco Strength and Additives" International Journal of Environmental Research and Public Health 16, no. 2: 263. https://doi.org/10.3390/ijerph16020263