
Unusually High Risks of COVID-19 Mortality with Age-Related Comorbidities: An Adjusted Meta-Analysis Method to Improve the Risk Assessment of Mortality Using the Comorbid Mortality Data

Abstract
:1. Introduction
2. Methods
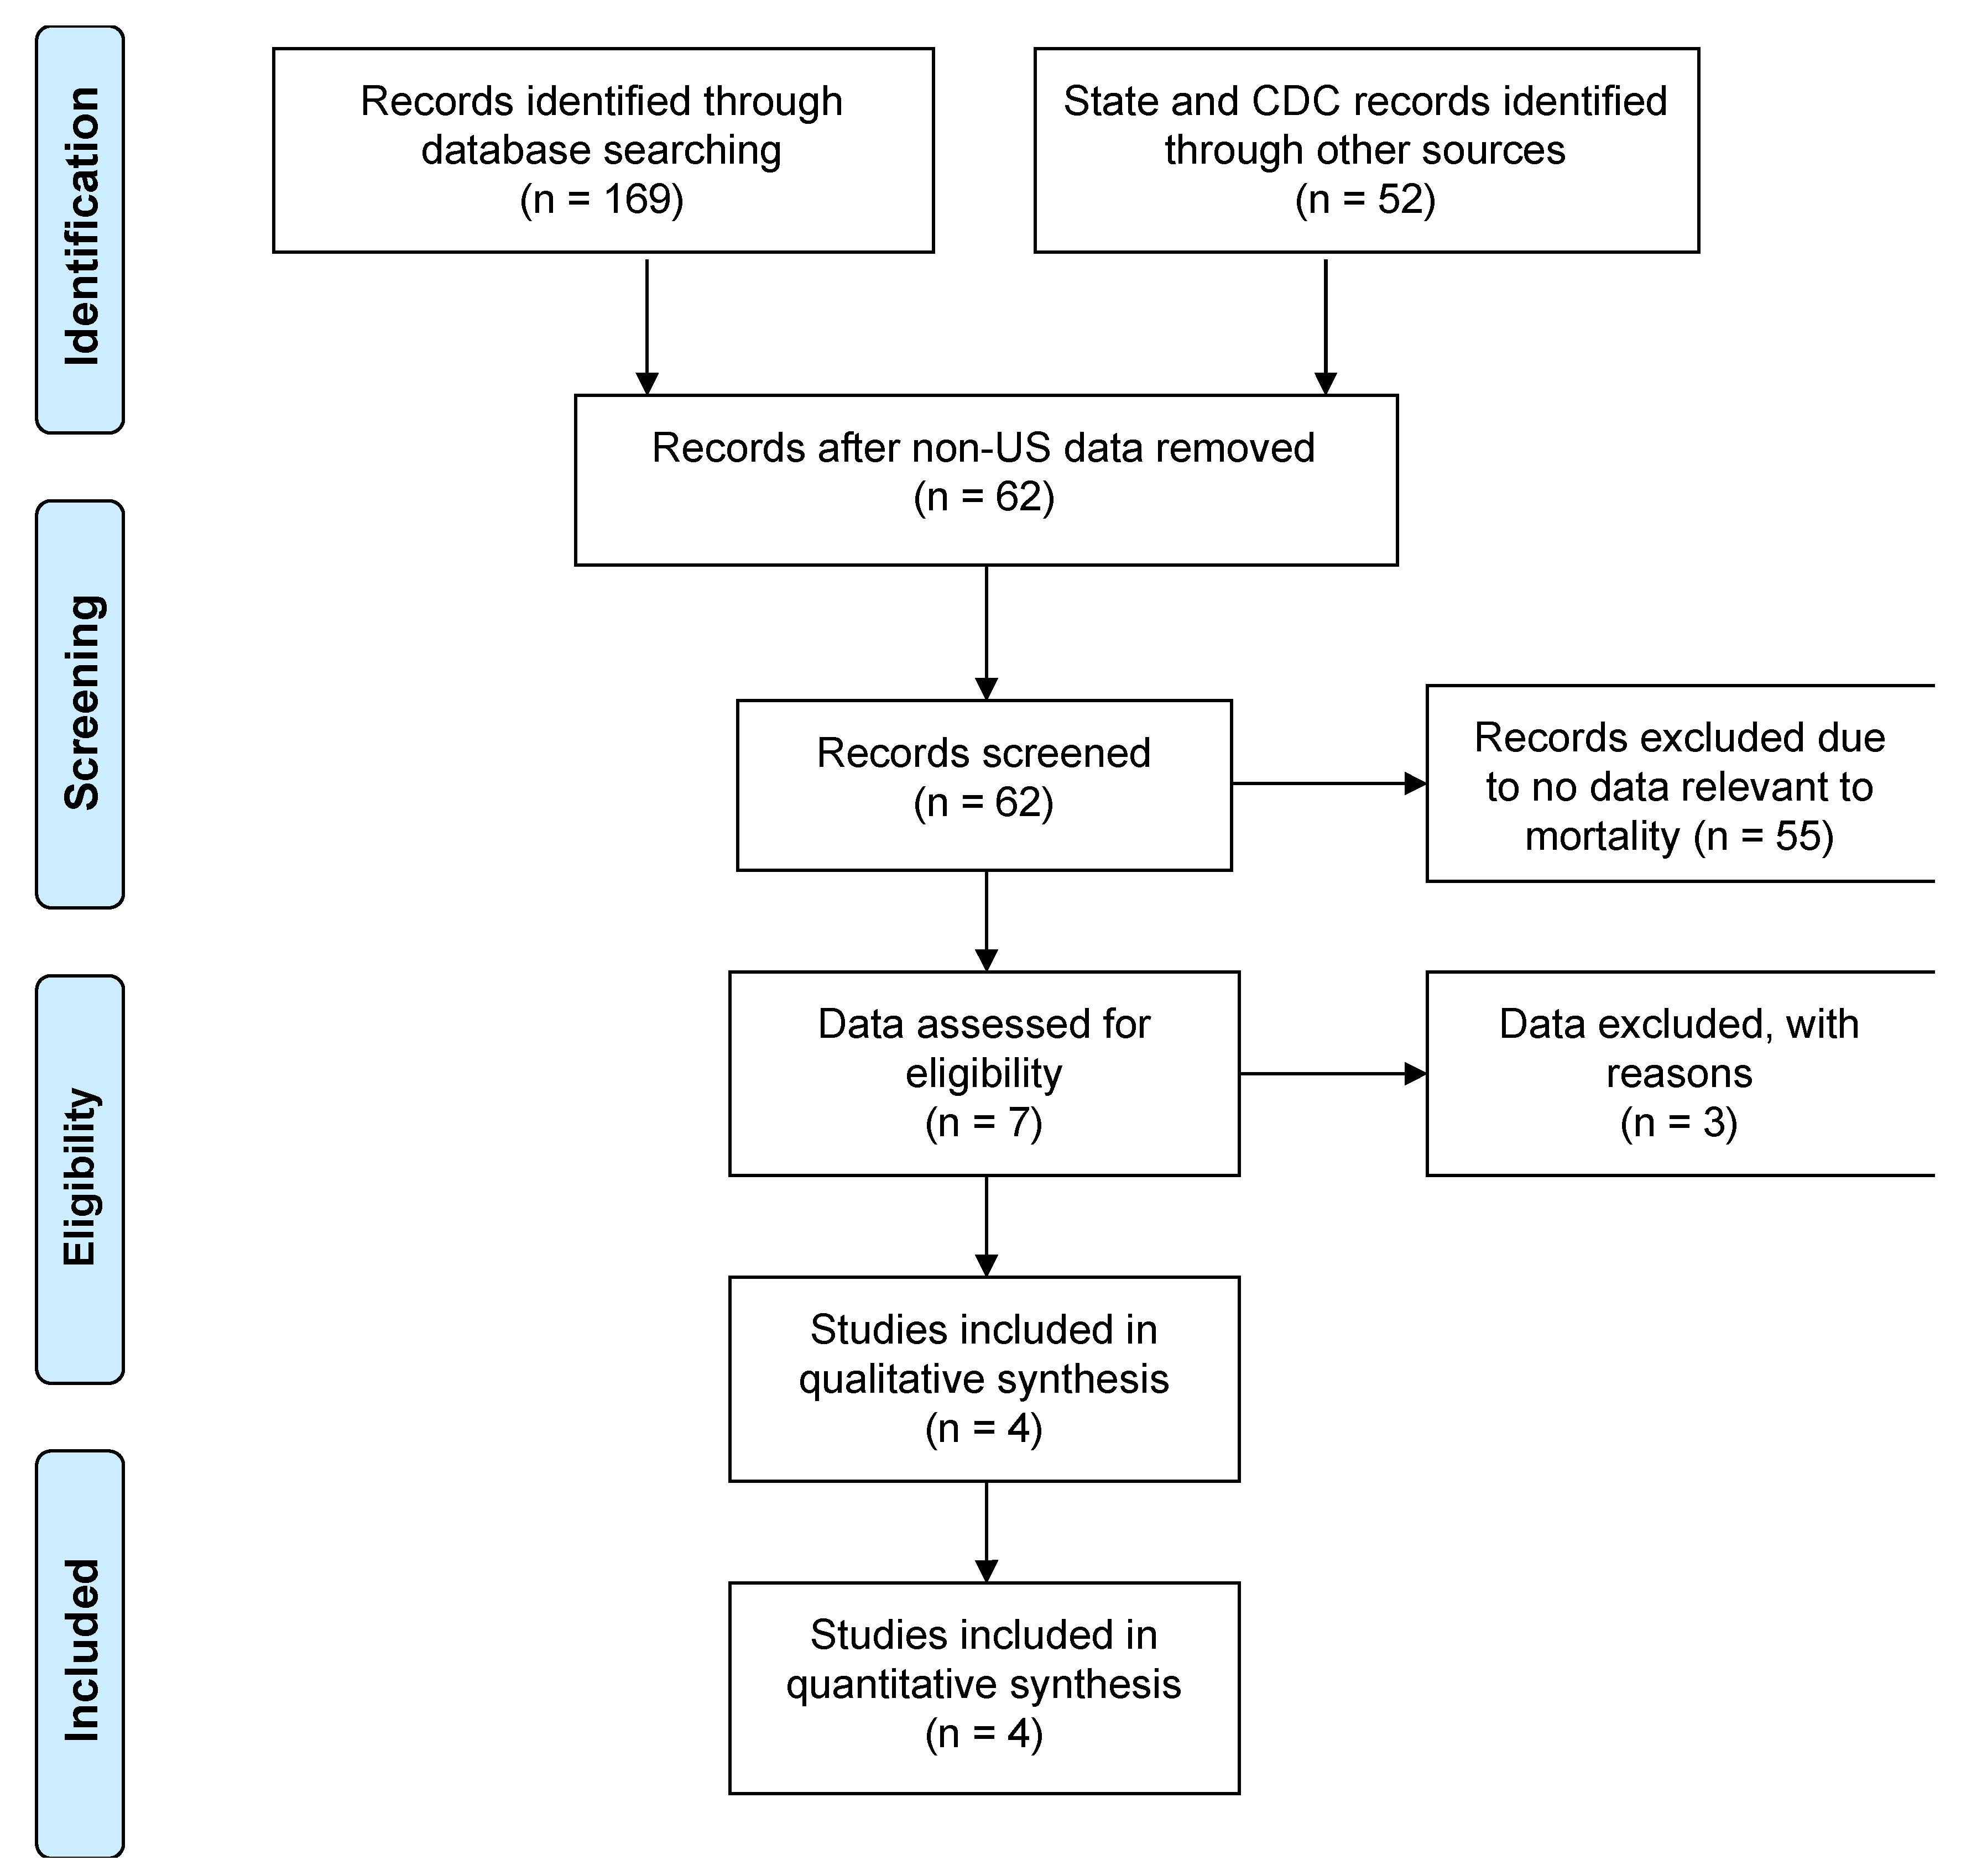
2.1. Eligibility Criteria, Information Sources and Study Selection
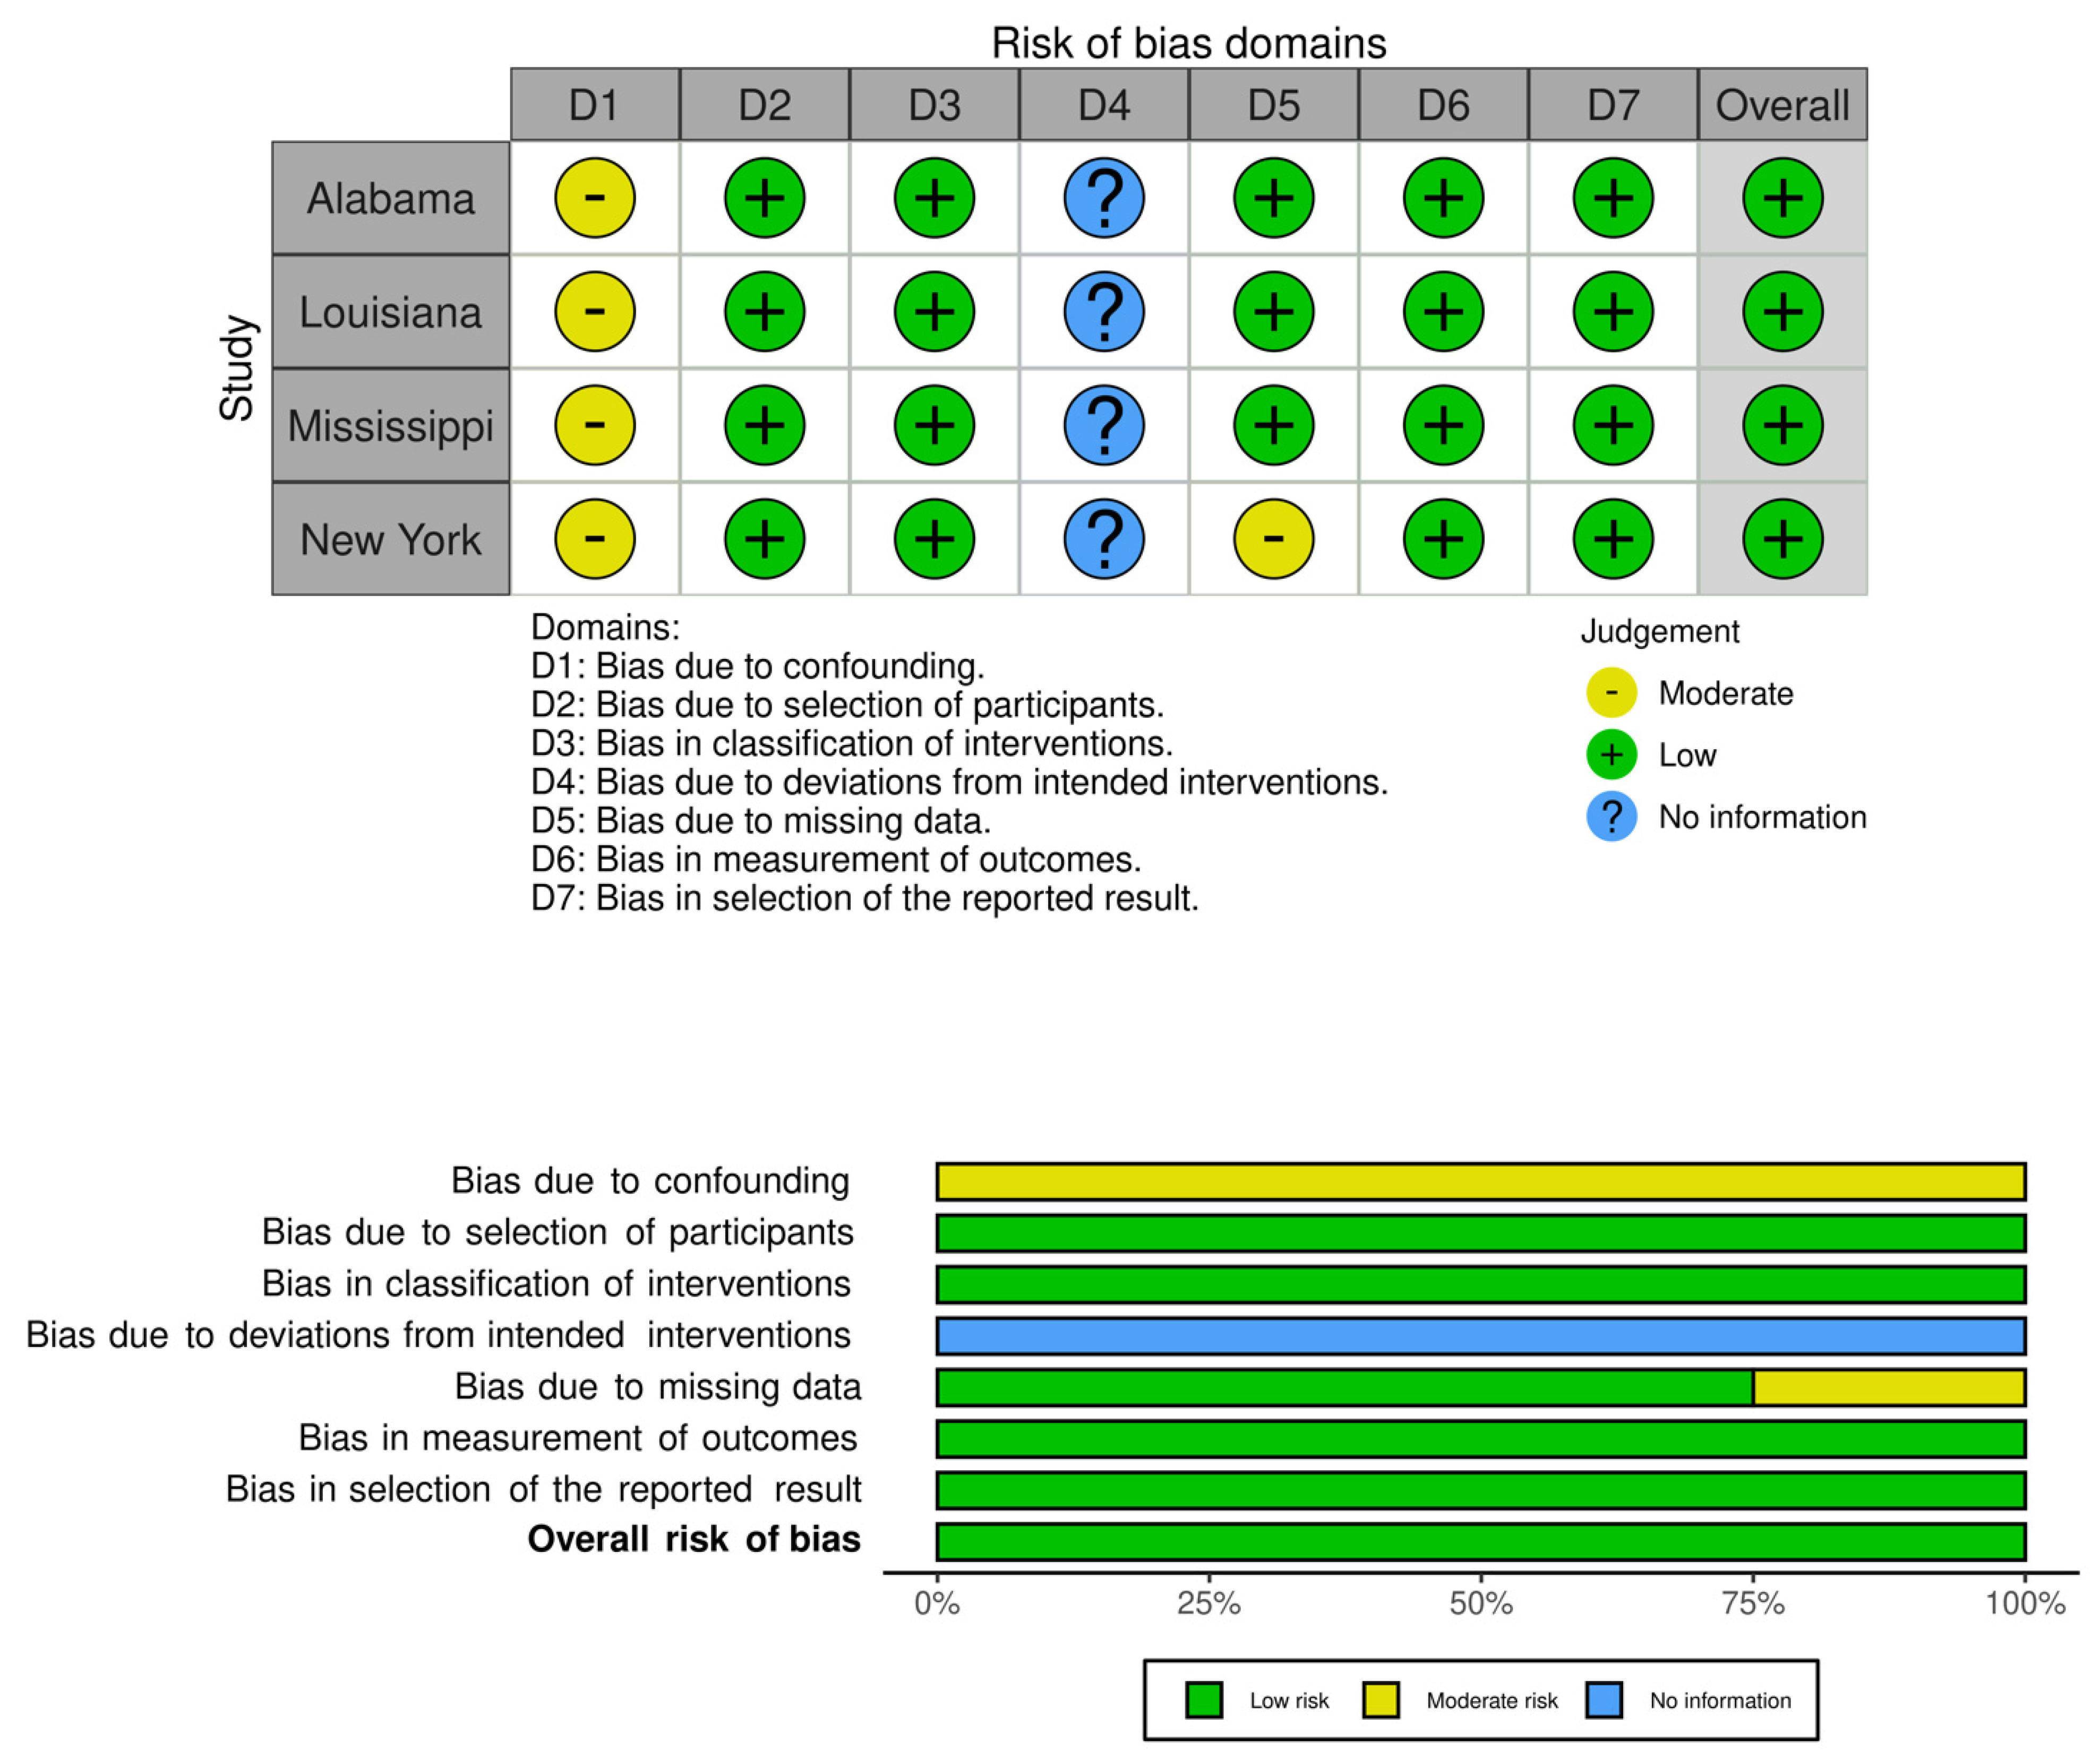
2.2. Data Collection and Risk of Bias Assessment
2.3. Synthesis of Results and Summary Measures
3. Results
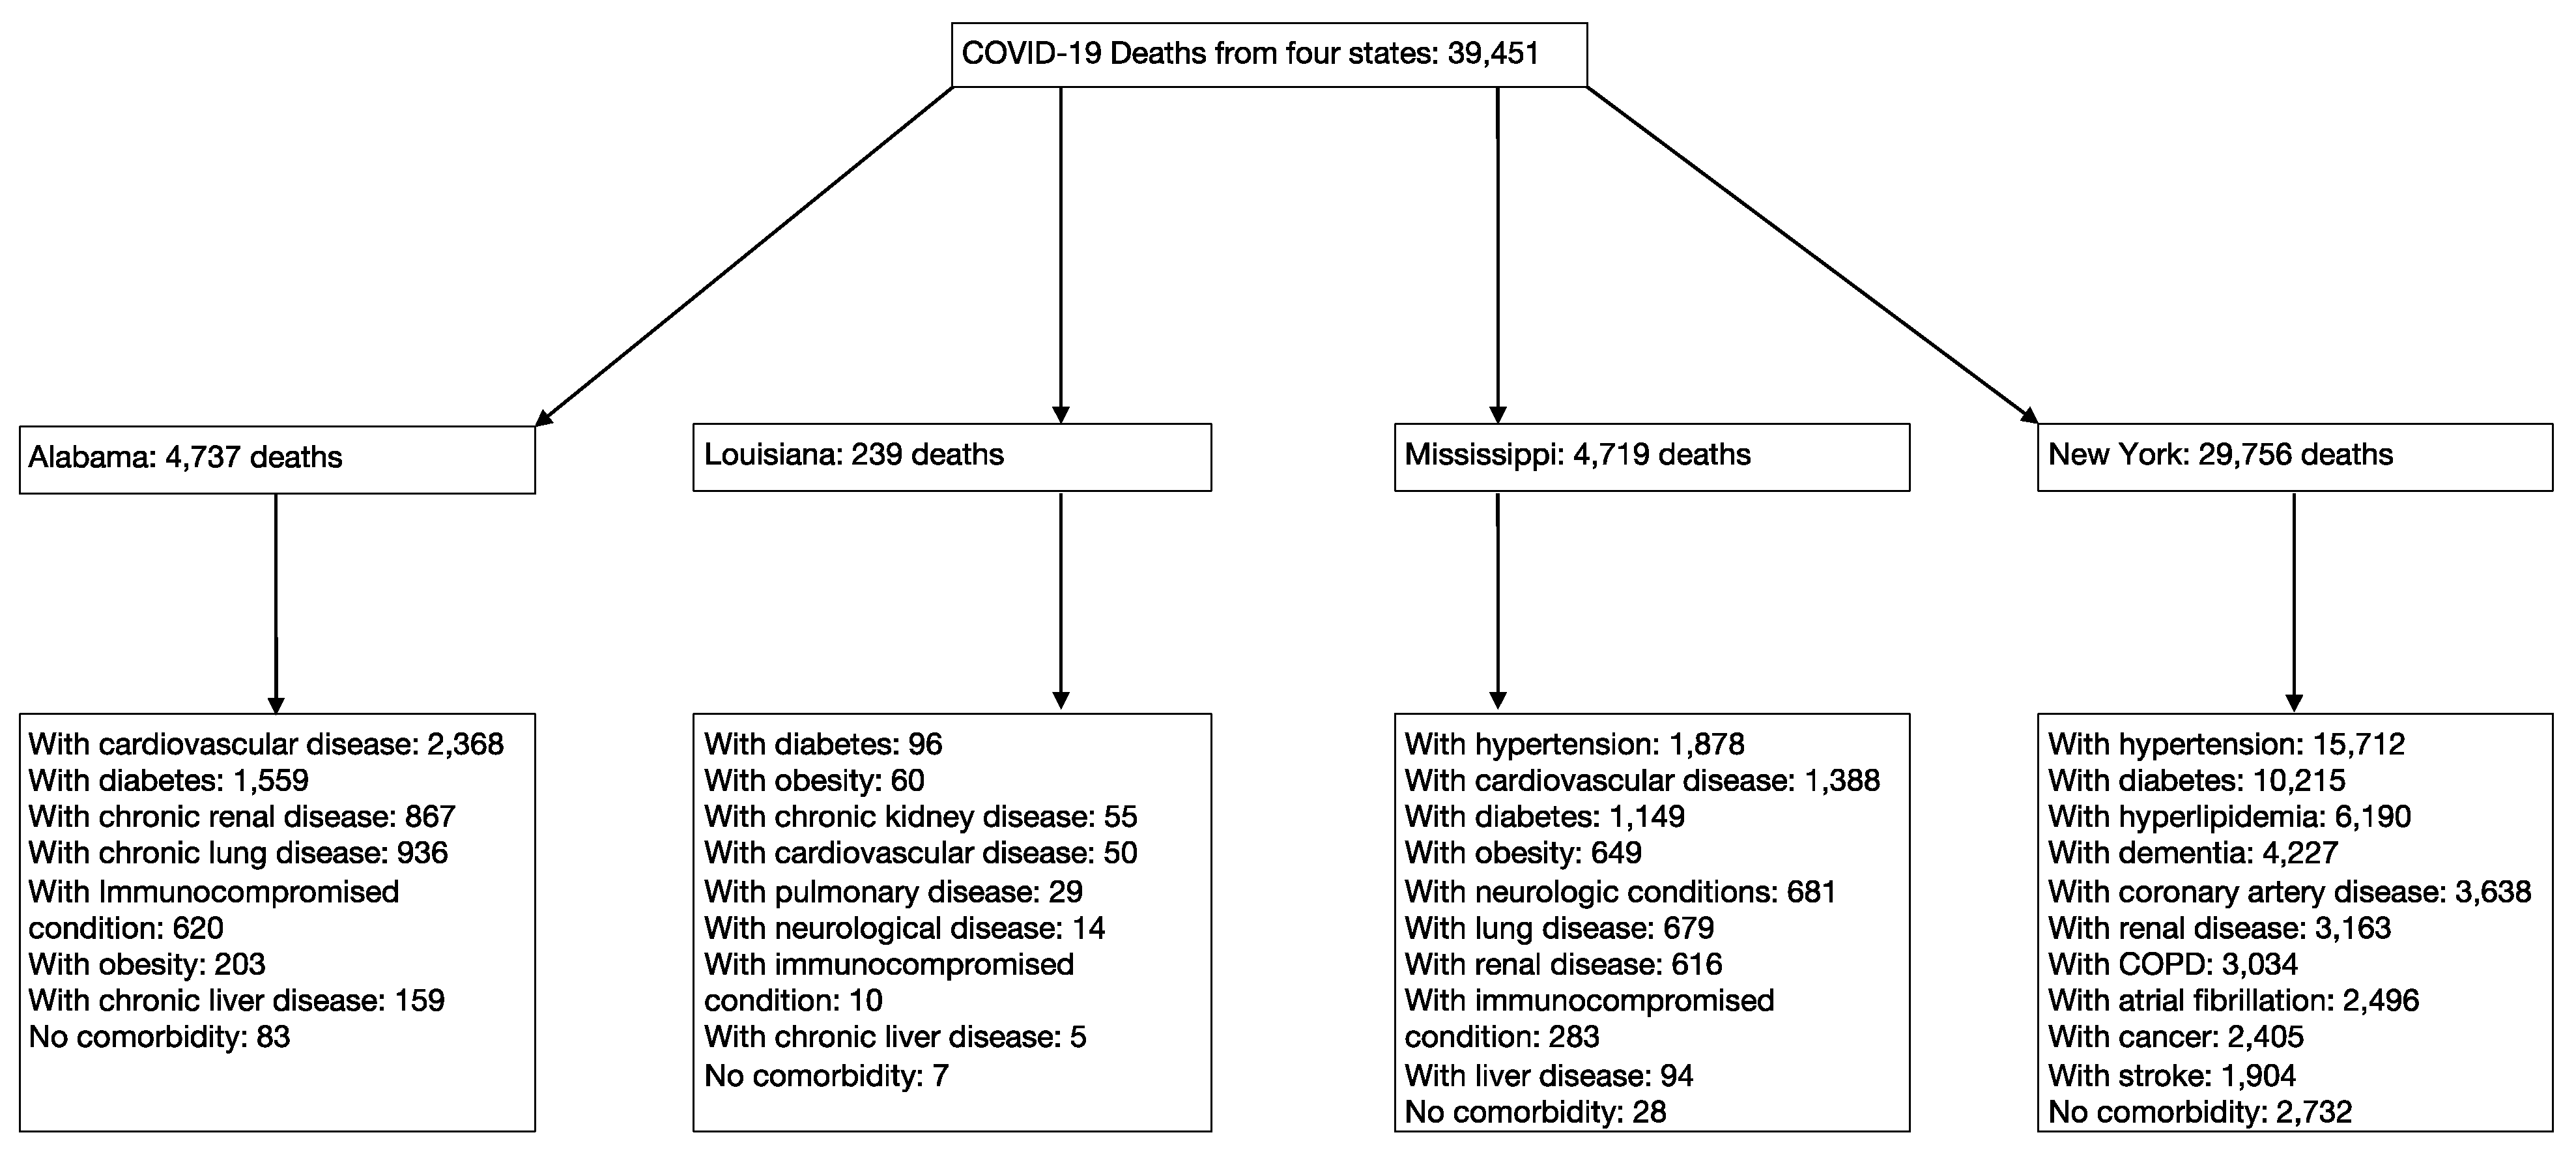
3.1. Study Selection and Characteristics
3.2. Synthesis of Results and Risk of Bias Assessment
4. Discussion
5. Conclusions
Supplementary Materials
Author Contributions
Funding
Institutional Review Board Statement
Informed Consent Statement
Data Availability Statement
Acknowledgments
Conflicts of Interest
References
- Fang, L.; Karakiulakis, G.; Roth, M. Are patients with hypertension and diabetes mellitus at increased risk for COVID-19 infection? Lancet Respir. Med. 2020, 8. [Google Scholar] [CrossRef]
- Dong, E.; Du, H.; Gardner, L. An interactive web-based dashboard to track COVID-19 in real time. Lancet Infect Dis. 2020, 20, 533–534. [Google Scholar] [CrossRef]
- The Centers for Disease Control and Prevention (CDC). People with Certain Medical Conditions. COVID-19. Available online: https://www.cdc.gov/coronavirus/2019-ncov/need-extra-precautions/people-with-medical-conditions.html (accessed on 18 August 2020).
- The Centers for Disease Control and Prevention (CDC). Underlying Medical Conditions Associated with High Risk for Severe COVID-19: Information for Healthcare Providers. Available online: https://www.cdc.gov/coronavirus/2019-ncov/hcp/clinical-care/underlyingconditions.html (accessed on 29 December 2020).
- Moher, D.; Liberati, A.; Tetzlaff, J.; Altman, D.G.; The PRISMA Group. Preferred Reporting Items for Systematic Reviews and Meta-Analyses: The PRISMA Statement. PLoS Med. 2009, 6, e1000097. [Google Scholar] [CrossRef] [PubMed] [Green Version]
- Alabama Public Health. Data and Surveillance. Available online: https://www.alabamapublichealth.gov/covid19/data.html (accessed on 29 December 2020).
- Mississippi State Department of Health. Interactive Charts: COVID-19 Epidemiological Charts and Trends. Available online: https://msdh.ms.gov/msdhsite/_static/14,21995,420,873.html (accessed on 29 December 2020).
- New York State Department of Health. Workbook: NYS-COVID19-Tracker. (n.d.). Available online: https://covid19tracker.health.ny.gov/views/NYS-COVID19-Tracker/NYSDOHCOVID-19Tracker-Fatalities?%3Aembed=yes&%3Atoolbar=no&%3Atabs=n (accessed on 30 December 2020).
- Louisiana Department of Health. Updates for 3/31/2020. (n.d.). Available online: https://ldh.la.gov/index.cfm/newsroom/detail/5522 (accessed on 17 December 2020).
- Sterne, J.A.C.; Hernán, M.A.; Reeves, B.C.; Savović, J.; Berkman, N.D.; Viswanathan, M.; Henry, D.; Altman, D.G.; Ansari, M.T.; Boutron, I.; et al. ROBINS-I: A tool for assessing risk of bias in non-randomized studies of interventions. BMJ 2016, 355, i4919. [Google Scholar] [CrossRef] [PubMed] [Green Version]
- Higgins, J.P.T.; Thomas, J.; Chandler, J.; Cumpston, M.; Li, T.; Page, M.J.; Welch, V.A. (Eds.) Cochrane Handbook for Systematic Reviews of Interventions, 2nd ed.; John Wiley & Sons. Cochrane: Chichester, UK, 2019. [Google Scholar]
- Miller, L.E.; Bhattacharyya, R.; Miller, A.L. Diabetes mellitus increases the risk of hospital mortality in patients with Covid-19: Systematic review with meta-analysis. Medicine 2020, 99, e22439. [Google Scholar] [CrossRef] [PubMed]
- Li, J.; Yue, J.; Zhang, S.; Wu, J.; Lian, R.; Zhang, R.; Cheng, P. Medicine (Balti (2020) Relationship between digestive diseases and COVID-19 severity and mortality: A protocol for systematic review and meta-analysis. Medicine 2020, 99, e23353. [Google Scholar] [CrossRef] [PubMed]
- World Health Organization (WHO). What Are Neurological Disorders and How Many People Are Affected by Them? (n.d.). 2016. Available online: https://www.who.int/news-room/q-a-detail/what-are-neurological-disorders (accessed on 29 December 2020).
- The Centers for Disease Control and Prevention (CDC). Weekly Updates by Select Demographic and Geographic Characteristics. Available online: https://www.cdc.gov/nchs/nvss/vsrr/covid_weekly/index.htm (accessed on 31 March 2021).
- Pennsylvania Department of Health. Weekly Report for Deaths Attributed to COVID-19. Available online: https://www.health.pa.gov/topics/Documents/Diseases%20and%20Conditions/COVID-19%20Death%20Reports/Weekly%20Report%20of%20Deaths%20Attributed%20to%20COVID-19%20--%202020-05-17.pdf?mod=article_inline (accessed on 17 May 2020).
- McGuinness, L.A.; Higgins, J. Risk-of-bias VISualization (robvis): An R package and Shiny web app for visualizing risk-of-bias assessments. Res. Synth. Methods 2021, 12, 55–61. [Google Scholar] [CrossRef]
- Matsushita, K.; Ding, N.; Kou, M.; Hu, X.; Chen, M.; Gao, Y.; Honda, Y.; Zhao, D.; Dowdy, D.; Mok, Y.; et al. The Relationship of COVID-19 Severity with Cardiovascular Disease and Its Traditional Risk Factors: A Systematic Review and Meta-Analysis. Glob. Heart 2020, 15, 64. [Google Scholar] [CrossRef] [PubMed]
- Guo, X.; Zhu, Y.; Hong, Y. Decreased Mortality of COVID-19 With Renin-Angiotensin-Aldosterone System Inhibitors Therapy in Patients with Hypertension: A Meta-Analysis. Hypertension 2020, 76, e13–e14. [Google Scholar] [CrossRef] [PubMed]
- Wu, T.; Zuo, Z.; Kang, S.; Jiang, L.; Luo, X.; Xia, Z.; Liu, J.; Xiao, X.; Ye, M.; Deng, M. Multi-organ Dysfunction in Patients with COVID-19: A Systematic Review and Meta-analysis. Aging Dis. 2020, 11, 874–894. [Google Scholar] [CrossRef] [PubMed]
- Zhang, J.; Wu, J.; Sun, X.; Xue, H.; Shao, J.; Cai, W.; Jing, Y.; Yue, M.; Dong, C. Association of hypertension with the severity and fatality of SARS-CoV-2 infection: A meta-analysis. Epidemiol. Infect. 2020, 148, e106. [Google Scholar] [CrossRef] [PubMed]
- Barbagallo, M.; Resnick, L.M.; Dominguez, L.J.; Licata, G. Diabetes mellitus, hypertension and ageing: The ionic hypothesis of ageing and cardiovascular-metabolic diseases. Diabetes Metab. 1997, 23, 281–294. [Google Scholar] [PubMed]
- Yabluchanskiy, A.; Ungvari, Z.; Csiszar, A.; Tarantini, S. Advances and challenges in geroscience research: An update. Physiol. Int. 2018, 105, 298–308. [Google Scholar] [CrossRef] [PubMed]
- Nia, B.V.; Kang, C.; Tran, M.G.; Lee, D.; Murakami, S. Meta Analysis of Human AlzGene Database: Benefits and Limitations of Using C. elegans for the Study of Alzheimer’s Disease and Co-morbid Conditions. Front. Genet. 2017, 8, 55. [Google Scholar] [CrossRef] [Green Version]
- Le, D.; Crouch, N.; Villanueva, A.; Ta, P.; Dmitriyev, R.; Tunzi, M.; Murakami, S. Evidence-Based Genetics and Identification of Key Human Alzheimer’s Disease Alleles with Co-morbidities. J. Neurol. Exp. Neurosci. 2020, 6, 20–24. [Google Scholar] [CrossRef]
- Harrison, S.L.; Fazio-Eynullayeva, E.; Lane, D.A.; Underhill, P.; Lip, G.Y.H. Comorbidities associated with mortality in 31,461 adults with COVID-19 in the United States: A federated electronic medical record analysis. PLoS Med. 2020, 17, e1003321. [Google Scholar] [CrossRef] [PubMed]


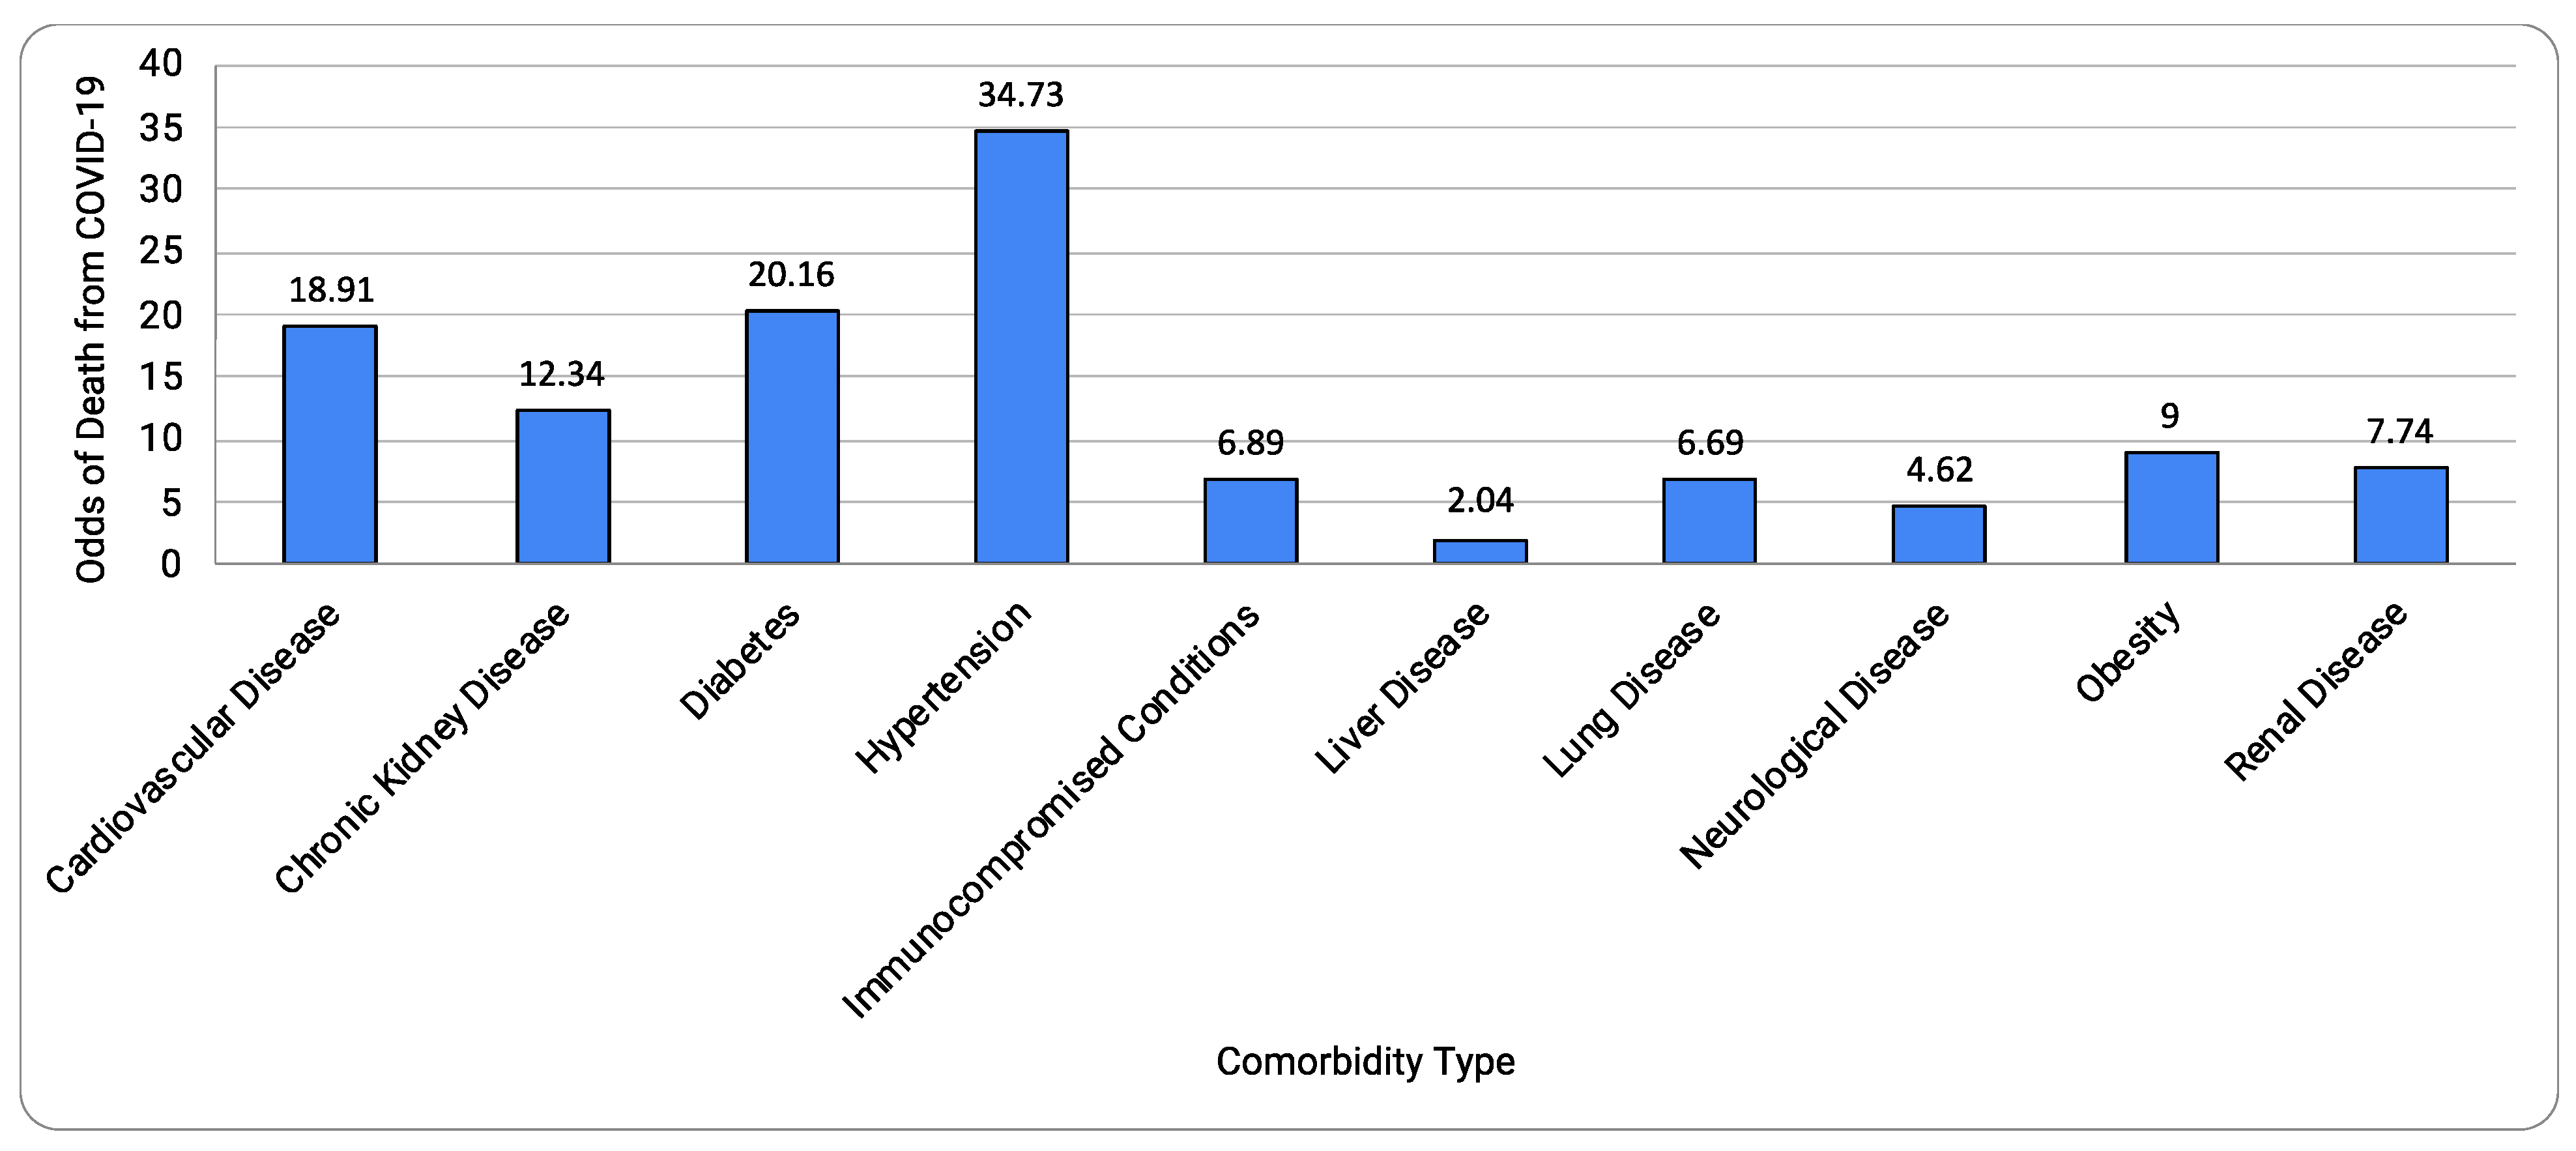
| Comorbidity Type | OR (95% CI) | p | I2 | Heterogeneity p |
|---|---|---|---|---|
| Cardiovascular Disease | 18.91 (2.88, 124.38) | 0.002 | 100% | <0.00001 |
| Chronic Kidney Disease | 12.34 (9.90, 15.39) | <0.00001 | 0% | 0.58 |
| Diabetes | 20.16 (5.55, 73.18) | <0.00001 | 99% | <0.00001 |
| Hypertension | 34.73 (3.63, 331.91) | 0.002 | 99% | <0.00001 |
| Immunocompromised | 6.89 (3.89, 12.20) | <0.00001 | 81% | 0.006 |
| Liver Disease | 2.04 (3.89, 12.20) | 0.02 | 77% | 0.01 |
| Lung Disease | 6.69 (1.06, 42.26) | 0.04 | 100% | <0.00001 |
| Neurological Disease | 4.62 (0.55, 38.63) | 0.16 | 99% | <0.00001 |
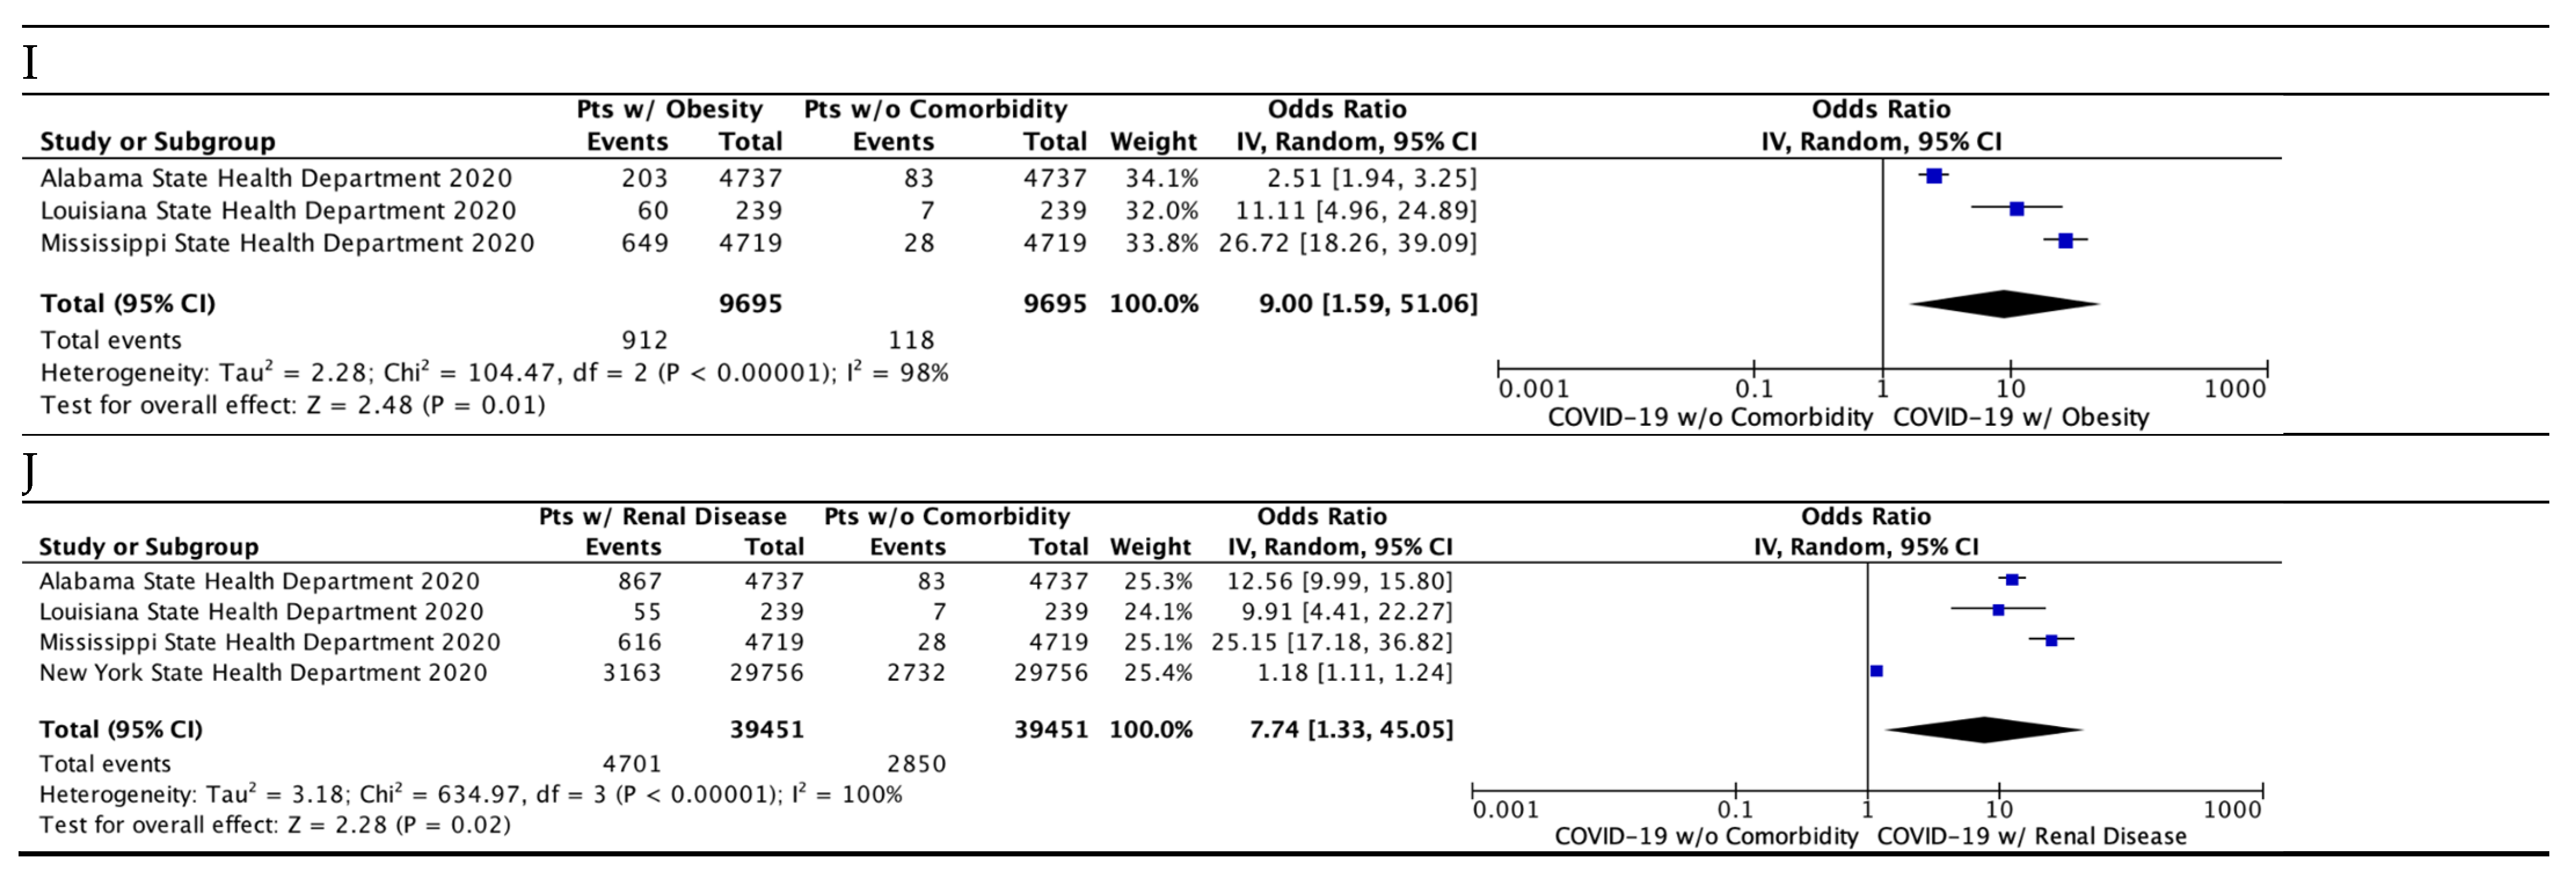
| Obesity | 9.00 (1.59, 51.06) | 0.01 | 98% | <0.00001 |
| Renal Disease | 7.74 (1.33, 45.05) | 0.02 | 100% | <0.00001 |
| All Comorbidities Combined | 1113.59 (157.59, 7888.28) | <0.00001 | 100% | <0.00001 |
Publisher’s Note: MDPI stays neutral with regard to jurisdictional claims in published maps and institutional affiliations. |
© 2021 by the authors. Licensee MDPI, Basel, Switzerland. This article is an open access article distributed under the terms and conditions of the Creative Commons Attribution (CC BY) license (https://creativecommons.org/licenses/by/4.0/).
Share and Cite
Antos, A.; Kwong, M.L.; Balmorez, T.; Villanueva, A.; Murakami, S. Unusually High Risks of COVID-19 Mortality with Age-Related Comorbidities: An Adjusted Meta-Analysis Method to Improve the Risk Assessment of Mortality Using the Comorbid Mortality Data. Infect. Dis. Rep. 2021, 13, 700-711. https://doi.org/10.3390/idr13030065
Antos A, Kwong ML, Balmorez T, Villanueva A, Murakami S. Unusually High Risks of COVID-19 Mortality with Age-Related Comorbidities: An Adjusted Meta-Analysis Method to Improve the Risk Assessment of Mortality Using the Comorbid Mortality Data. Infectious Disease Reports. 2021; 13(3):700-711. https://doi.org/10.3390/idr13030065
Chicago/Turabian StyleAntos, Andrew, Ming Lai Kwong, Timothy Balmorez, Alyssa Villanueva, and Shin Murakami. 2021. "Unusually High Risks of COVID-19 Mortality with Age-Related Comorbidities: An Adjusted Meta-Analysis Method to Improve the Risk Assessment of Mortality Using the Comorbid Mortality Data" Infectious Disease Reports 13, no. 3: 700-711. https://doi.org/10.3390/idr13030065