Article

An Integrated Hydrological Modelling Approach to Evaluate the Capacity of Keenjhar Lake by Using STELLA

1
Civil & Environmental Engineering Department, Universiti Teknologi PETRONAS, Persiaran UTP, Seri Iskandar 32610, Malaysia
2
Department of Civil Engineering, Ghulam Ishaq Khan Institute of Engineering Sciences and Technology, Topi 23640, Pakistan
3
Department of Agricultural Engineering, Khwaja Freed University of Engineering and Information Technology, Rahim Yar Khan 64200, Pakistan
4
Faculty of Agriculture and Environmental Sciences, University of Rostock, 18059 Rostock, Germany
*
Author to whom correspondence should be addressed.
Hydrology 2022, 9(5), 90; https://doi.org/10.3390/hydrology9050090
Submission received: 2 April 2022 / Revised: 5 May 2022 / Accepted: 9 May 2022 / Published: 17 May 2022
(This article belongs to the Special Issue Accounting for Climate Change in Water and Agriculture Management)

Abstract

:
Due to overexploitation and lower rainfall rates, it is essential to study the detailed water balance of the Keenjhar lake by considering the climate change impacts and higher water demands linked with the population growth. A hydrological model of Keenjhar Lake is developed based on a system dynamic approach using STELLA (Structural Thinking and Experiential Learning Laboratory with Animation). The model (STELLA) developed in the current research study comprises the following three sub-systems: population, water supply, and water demand. The hydrological and climate data for the period of seventeen years (2000–2016) is used in the current study. The monthly water budget of the Keenjhar Lake is determined by inflow components such as rainfall and the Kalri-Baghar Feeder (K.B.F) (upper) and outflow components such as evaporation, the K.B. Feeder (lower), and the Keenjhar-Gujju (K.G) canal from the lake. The water balance results revealed that the contribution of direct rainfall and the annual inflow components to the lake are 22.03% and 77.91%, respectively. Whereas the evaporation, outflow to K.B.F lower and water abstraction to the K.G. Canal constituted about 5.78%, 92.55%, and 1.57% of the total annual outflow from the lake, respectively. Moreover, the annual inflow components of the water budget of the lake showed a declining trend while the outflow components (water abstraction) intimated an increasing trend. The study results also acknowledged that the demand for water can increase from 3 × 1010 ft3/yr up to 1.2 × 1011 ft3/yr by the year 2050 (influence of overdrawing of water due to population growth), and water supply may decrease to 9.066 × 1010 ft3 (rainfall depletion due to climate change). A detailed water balance explains the main water loss components and will help in developing better water management practices and well-informed policy decisions.

1. Introduction

Many countries are facing climate change-related problems as it has disordered the precipitation patterns, runoff trends, water management approaches, expenditure, and time required to adapt and implement the remedial measures [1,2,3,4]. The availability of freshwater is a national issue for many countries throughout the world [5,6]. Information regarding the water balance components of lakes and reservoirs is crucial for managing demand and supply as it can provide guidelines to stakeholders and policymakers by providing essential information to efficiently utilize the water resources [7].
Large metropolitan cities all around the globe are struggling to meet the ever-rising water demands. Karachi is the largest metropolitan city in Pakistan with a population of over 15 million. Due to the rapid growth in the population and shrinking water resources, there is a continuing and growing shortage of drinking water resources. Karachi Water and Sewerage Board (KW&SB) [8] is responsible for arranging water supply for the metropolitan area and has constructed an independent lined channel, the K.G Canal, which supplies water from Keenjhar Lake with a discharge capacity of 1382 cusecs. In addition, the lake supplies water for drinking and irrigation purposes to the Thatta District, situated on the right bank of the River Indus. To meet the requirements of the irrigation sector, K.B. Feeder lower is used. Keenjhar Lake, the second-largest freshwater lake in the country, is continuously losing its capacity due to overexploitation and decreasing precipitation rates, and it is becoming difficult to fulfill the water requirements of Karachi and Thatta cities at the desired level. Failure to meet the water supply demands would result in great disruption and chaos to the life activities in the largest metropolitan of Pakistan. Consequently, it is essential to estimate the capacity of Keenjhar Lake and to develop a water-balance model for the reservoir to ascertain the future water demands and supply [9,10,11,12].
Multiple water budget studies have been conducted across the globe to help decision-makers formulate policies for the efficient use of water resources. Kebede et al. [13] studied the water budget of Lake Tana in Ethiopia and determined the measured outflow, the estimation of the runoff, evaporation, and the rainfall that entered the lake. Through hydrological modeling, the monthly lake level variation model from 1960 to 1990 was developed. A study found that during the past 50 years, there has been a 20% variation in rainfall in the Blue Nile Basin; however, the level of the lake has remained constant. The analysis indicates that a continuous 7 to 8-year reduction in rainfall would be required to change the lake level drastically. Gibbson et al. [14] developed a water balance model for the Great Slave Lake in Canada, which predicts the frequency and amplitude of annual water level fluctuations. Annual water balance based on hydrological monitoring (1964–1998) revealed that 74% of the inflow into the Great Slave Lake originates from the Peace-Athabasca catchments that enter the lake via the Slave River. An estimated 94% of water losses occurred by outflow to the Mackenzie River, and the remaining 6% were contributed by evaporation from the lake surface. Bublaku et al. [15] studied the water balance of Badovc Lake in Kosovo during the period from 2013 to 2014. A decrease of 106 m³ of the lake’s physical volume due to the sedimentation on the lake bottom was revealed by the recent bathymetric survey. Hecky et al. [16] conducted a study on Lake Victoria in Africa to compute pollution loadings of the catchment and atmosphere. The water balance of the lake was calculated by analyzing the hydrological and meteorological data from the years 1950 to 2004. The results indicate that the annual discharge contribution to Lake Victoria is 21.4% through Tanzania, while Kenya provides about 37% and Uganda about 4.2%. Salim Khoso et al. [17] conducted a study on water scarcity, its causes, impacts, and remedial measures in Pakistan. It was suggested that the authorities need to consider balancing the competing demands between urban and rural areas by considering the economy and the environment. Popovska et al. [18] assessed the vulnerability of the Strumica River basin by analyzing the effect of climate change on water resources. The water balance model was developed by using the data of precipitation and runoff from 2000 to 2010 and projected/forecasted the conditions in 2025. Balali et al. [19] have studied a system dynamics approach for modeling groundwater depletion dynamics under different economic and climate change scenarios. The vulnerability of groundwater balance is forecasted under dry, normal, and wet climate conditions and also different scenarios of irrigation water and energy pricing policies. Results revealed that the implementation of economic policies on irrigation water and energy pricing can significantly affect groundwater exploitation and its volume balance. Waseem at el. [20] uses available low-frequency monitored flow and water quality data in combination with integrated hydrological and hydraulic modeling to represent the surface water and groundwater hydrology and NO3-N loads in the Tollense River catchment. The water balance results showed that 60–65% of total precipitation is lost via evapotranspiration. A total of 85–95% of surface water discharge in the river and its tributaries are fed by groundwater via base flow. Multiple studies have used a STELLA-based model to simultaneously predict hydrological processes, N uptake, and biomass production [21,22,23,24,25].
A water-balance model can help in understanding the problem and selecting the best practices and solutions by establishing a sustainable level of water withdrawal. Therefore, it is important to look at the historical trends and the natural water levels of Keenjhar Lake to produce a management framework. The integrated modeling method plays an important role in evaluating the water crisis [26,27,28,29,30,31,32,33]. One of the most appropriate tools for environmental modeling is the system dynamics (SD) method, which was developed in the 1950s by Jay Forrestor and his associates. In this study, the system dynamics method is used to develop a dynamic simulation model. The basic difference between system dynamics and other modeling methods is the way the flows and stocks affect each other through feedback loops are considered. The stocks and flows together display and affect system properties that cannot be accredited to any of the individual components that make up a system. There are several available software packages that use the principle of system dynamics, such as STELLA, WEAP, PowerSim, VenSim, etc. Overall, the aforementioned models are essential research tools and have improved our understanding of water balance estimation. However, they have been criticized for being too abstract and difficult to understand, use, and apply; for requiring too much input data and time entering data, and for requiring advanced training. It is noted that the STELLA software has been widely used in biological, ecological, and environmental studies [34,35,36]. The software produces finite difference equations that describe the graphical model and allows users to select a numerical analysis method to apply to the system, either the Euler method or various Runge–Kutta methods (either second- or fourth-order) [37]. System dynamics is the theory of system structures and a set of tools for representing complex systems and analyzing their dynamic behavior. The SD approach is a policy-based methodology that evaluates the effect of policy changes on a system. The most important feature of this approach is to elucidate the endogenous structure of the system under study to see how different elements of the system relate to one another and to experiment with changing relations within the considered system when different decisions are included. The SD approach is an appropriate technique for simulating complex problems in integrated water resources [38].
In the present study, STELLA 10.1 software created by iseesystems was effectively utilized to prepare the proposed model that includes water demand, supply, and storage as input parameters. STELLA allows the user to communicate how a system works—what goes into the system, how those inputs impact the system, and what the outcomes are. The research objectives of the current study include (i) developing a water balance model of Keenjhar Lake; (ii) evaluating Keenjhar Lake’s capacity to meet future water demands for the metropolitan area of Karachi. The resulted model provides improved water resource management tools enriched with a better-informed decision management system for the Keenjhar Lake to achieve economic and social objectives.

2. Materials and Methods
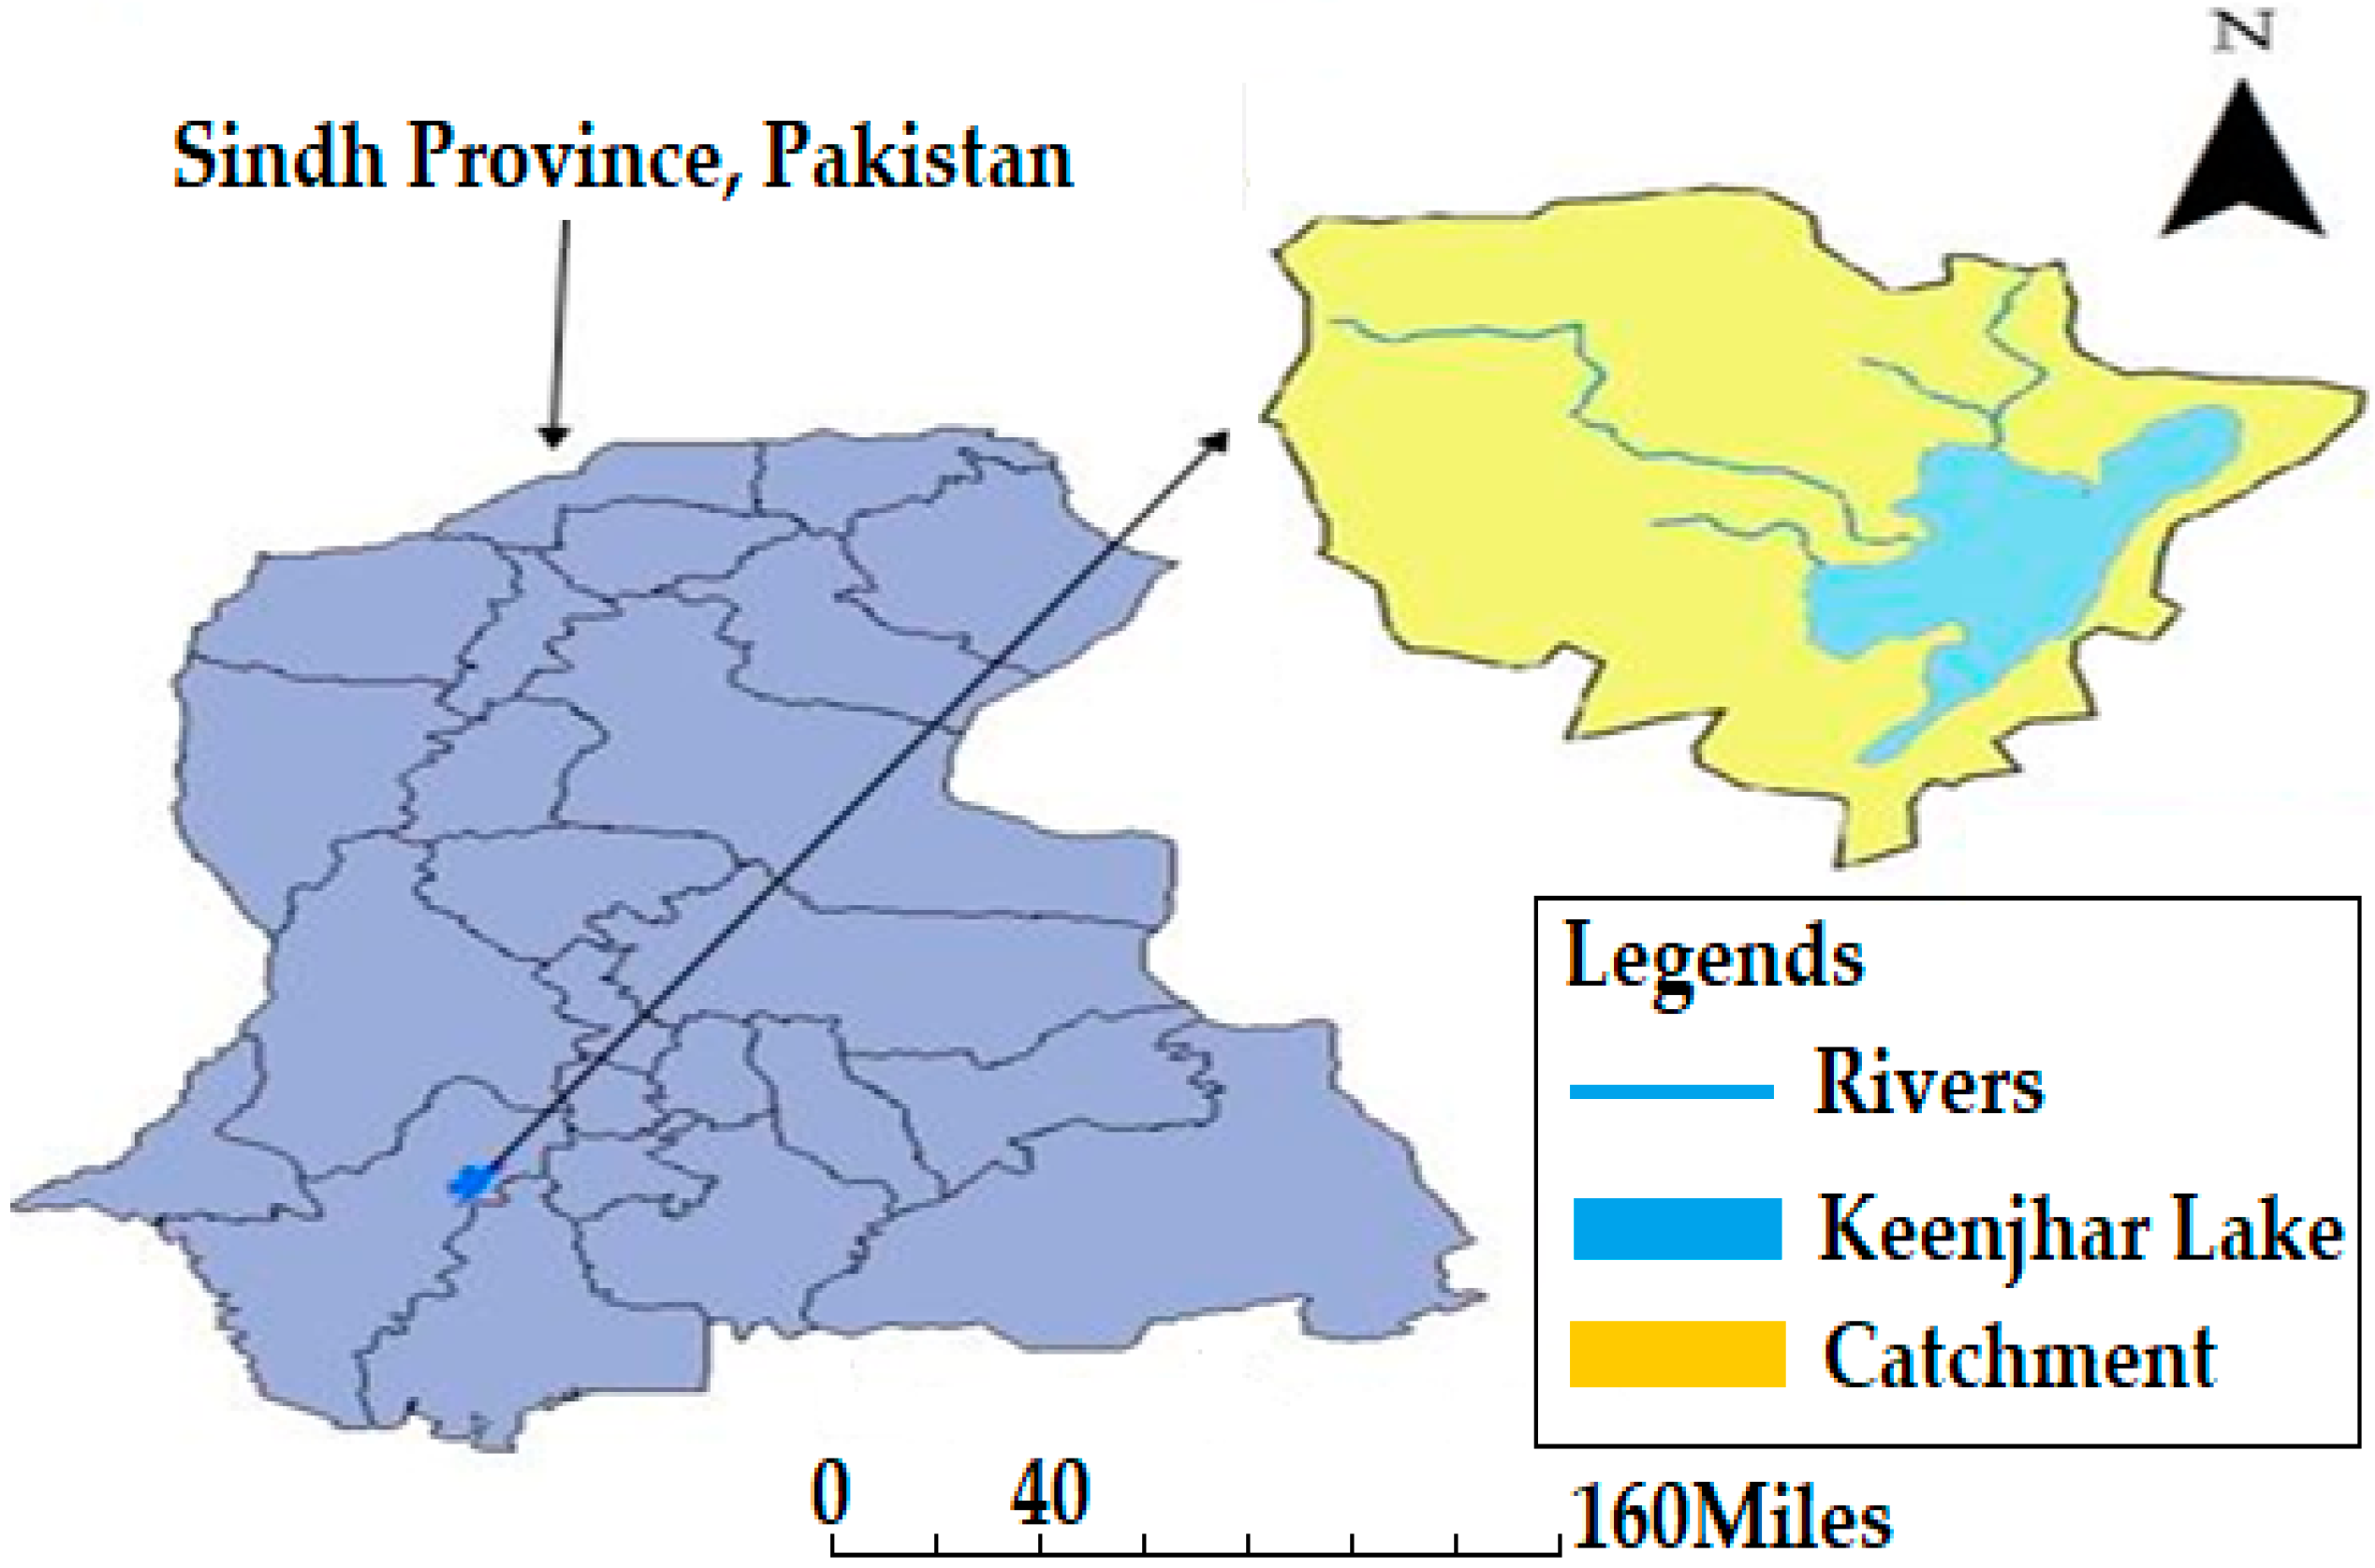
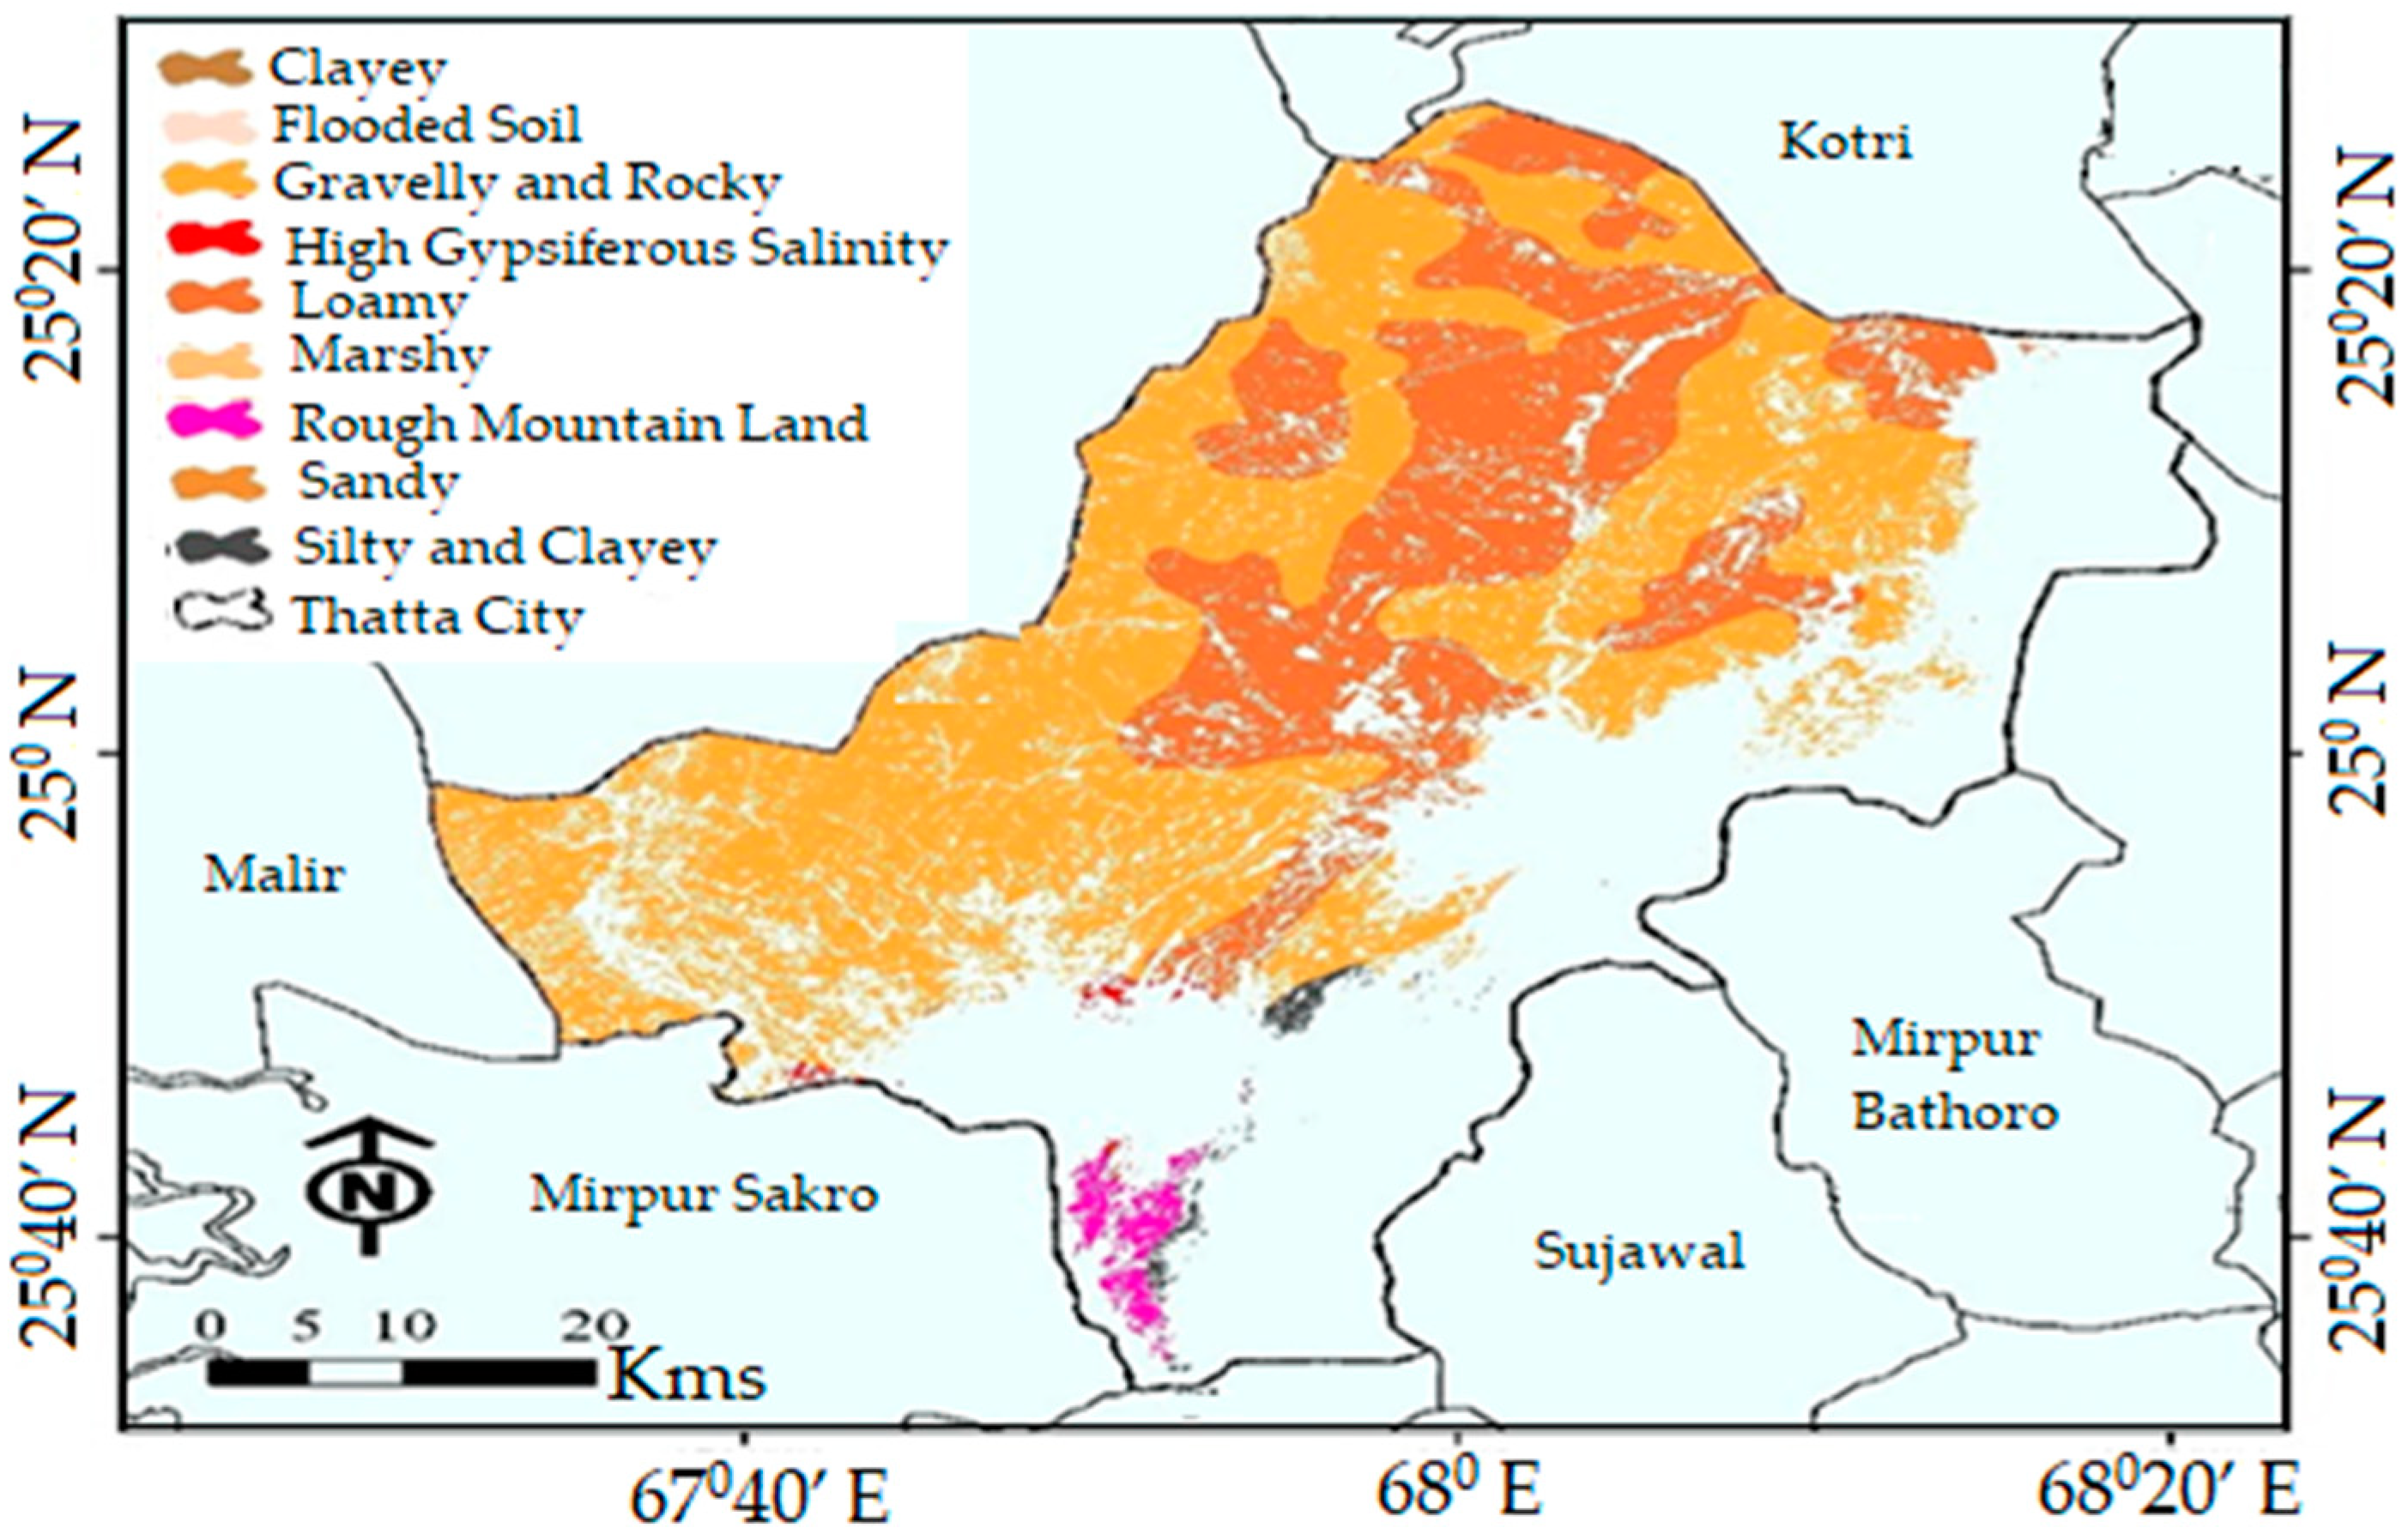
2.1. Study Area

Keenjhar Lake is located (24°57′ N 68°03′ E) in Thatta District of Pakistan. The lake is considered as the major source of drinking water supply for more than 15 million people in Karachi City and about 0.15 million people in Thatta [27]. The average annual rainfall in the area is 175 mm, which mostly falls during the monsoon season. The area experiences very hot summer and cold winter and the climate of the area is characterized as subtropical [11]. The area of lake is mainly covered by rocky, gravelly, and loamy soils. The lake is fed by the K.B Feeder originating from Kotri Barrage, which arrives at the northwest corner of the lake. It is also fed by many other small seasonal streams that enter the western and northern shores. K.B Feeder is 38 miles in length and its designed discharge is 9100 cusecs at the head [28]. The maximum length of the lake is 24 km while the maximum width is 6 km. The total surface area of the lake is 13,468 ha (33,280 acres) with a total water volume of 0.53 × 10⁶ acre-ft (650 hm3). The average depth of the lake is 1 m and ranges maximum up to 7.9 m (26 ft) [30]. In 1977, due to the Sindh wildlife protection ordinance, Keenjhar Lake was declared a wildlife sanctuary. The sanctuary includes the lake and the area along the Indus Highway. Enriched with biological diversity, Keenjhar Lake is one of the popular locations for recreation and also serves as a breeding place for migratory birds [31]. The location of the study area is shown in Figure 1.

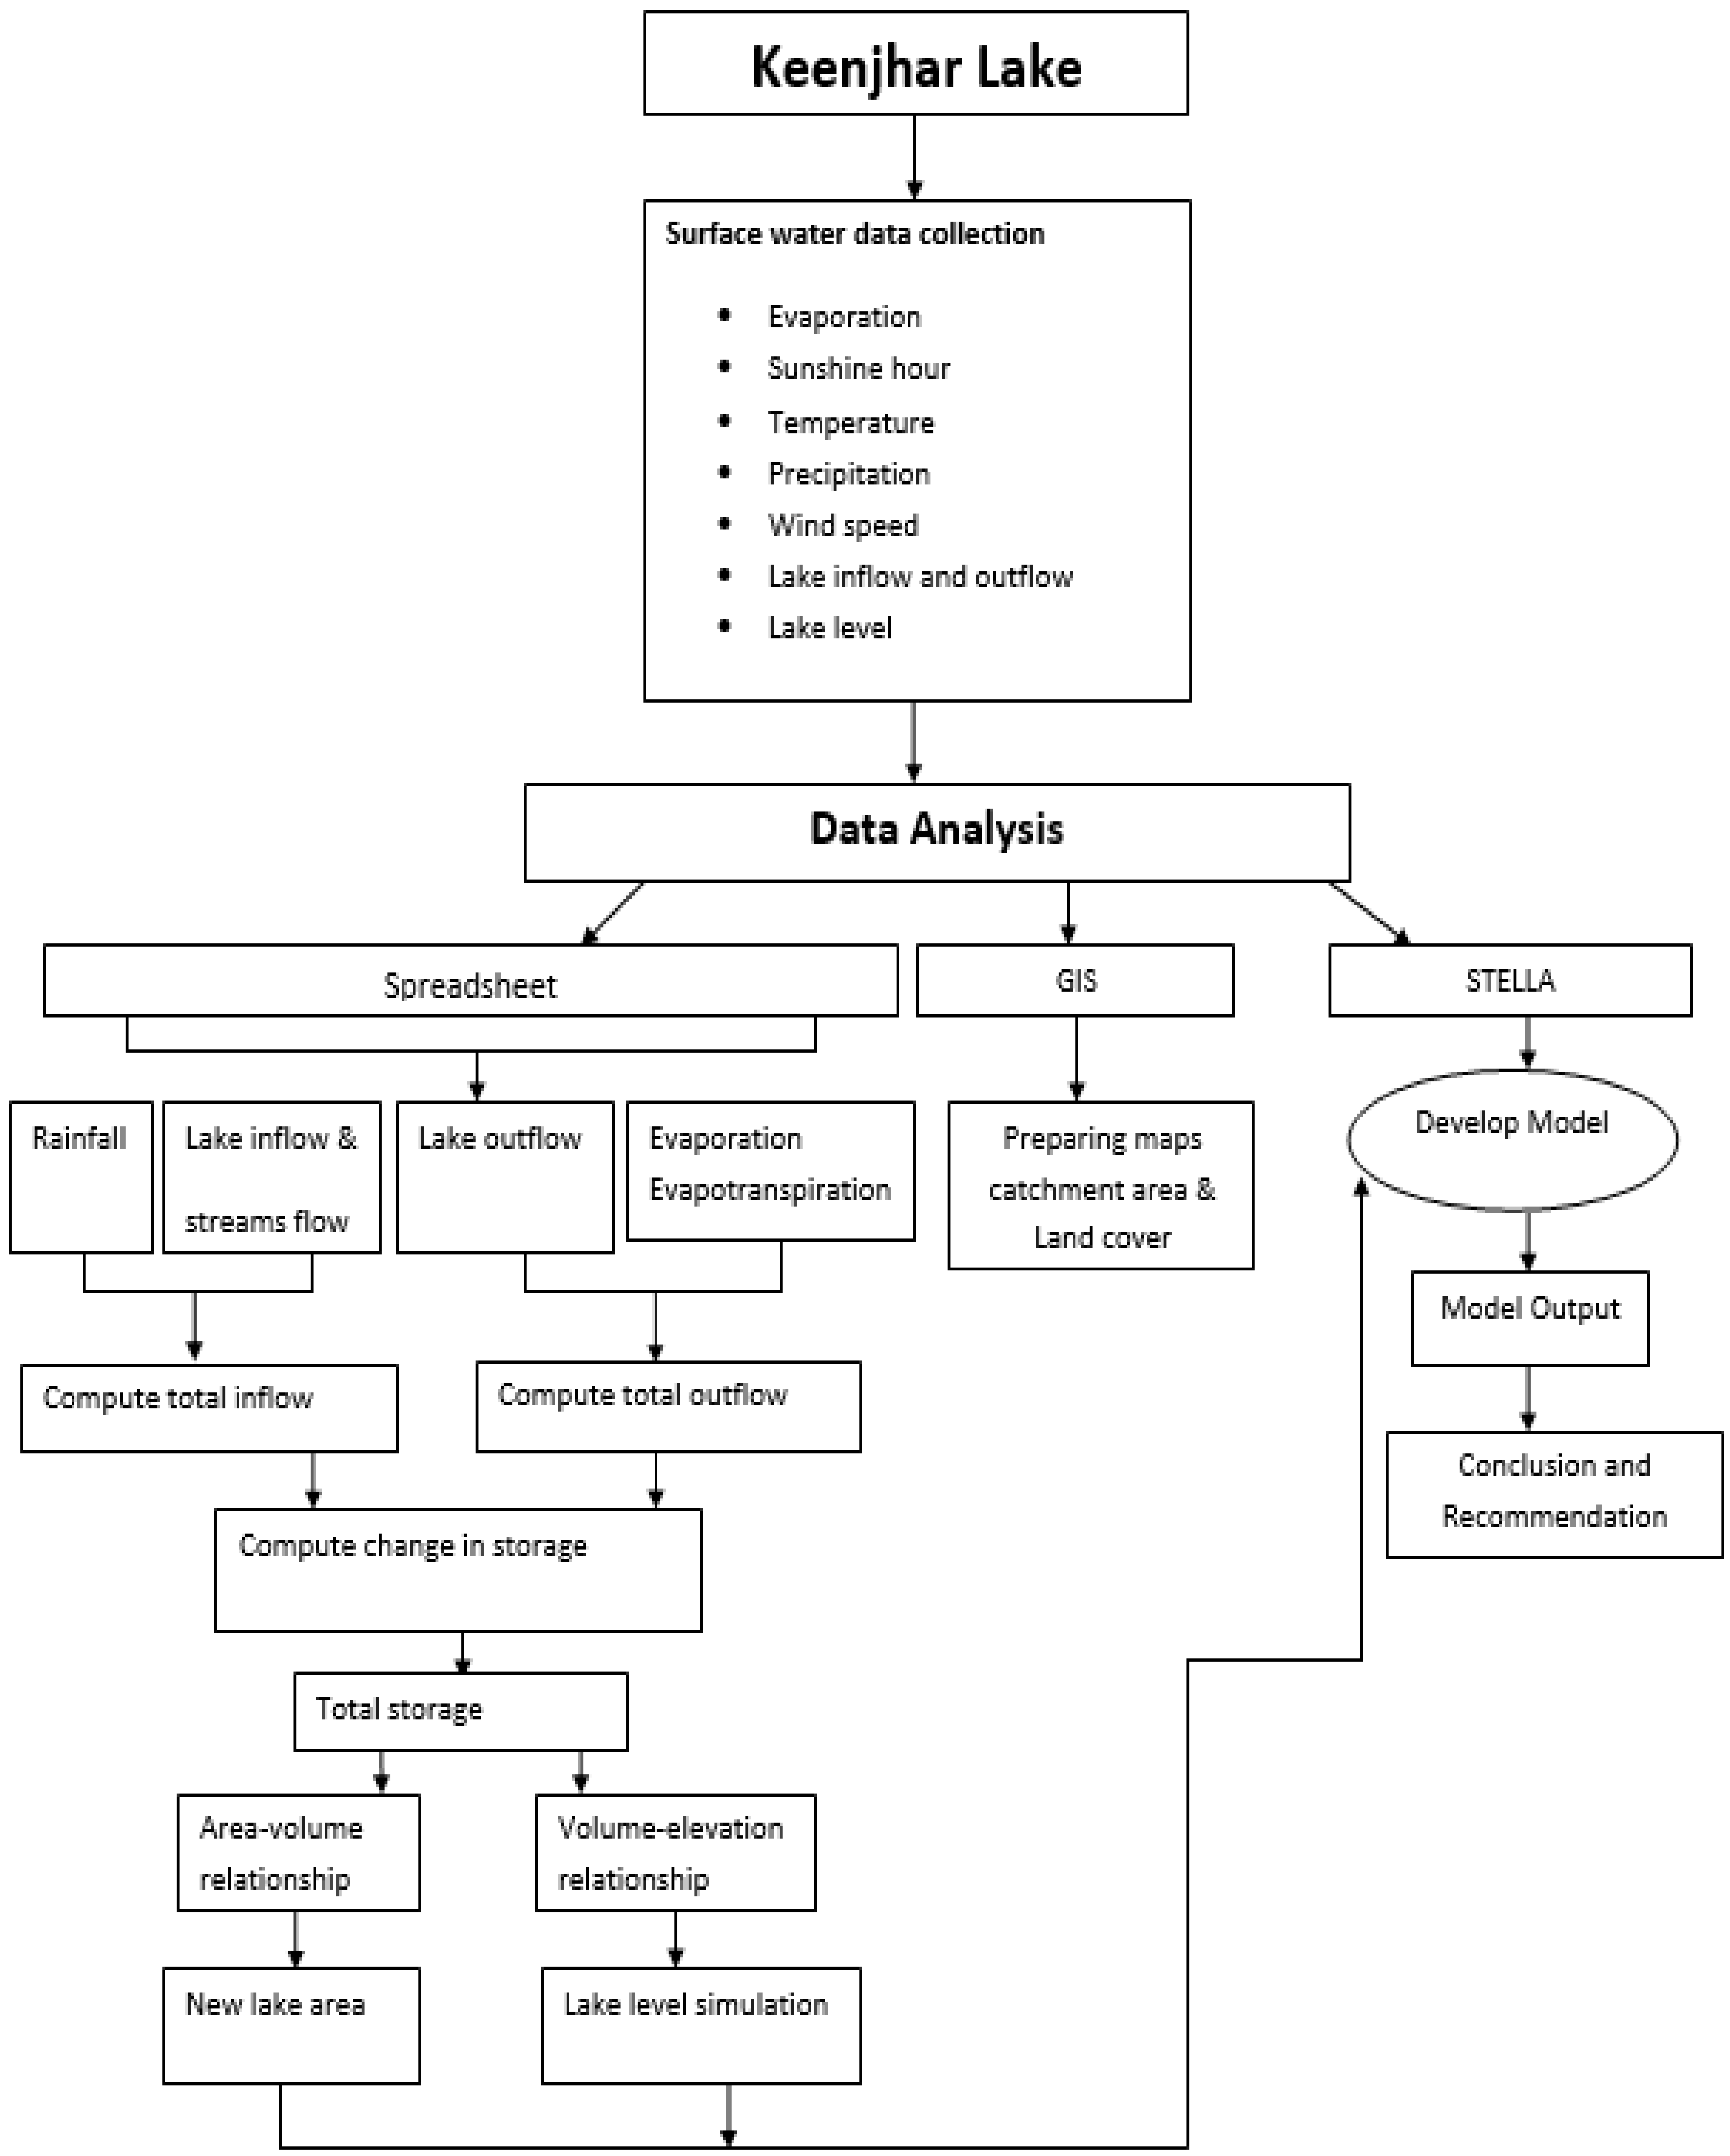
2.2. Methodological Framwork

In this study the mentioned objectives were achieved based on methodological framework explained in Figure 2. Initially a robust analysis of the available time-series data was conducted to understand the problem’s extent and to find important relationships between different parameters.

2.3. Data Collection

The time series of hydrological, meteorological, and land use parameters have been collected for the assessment of water balance of Keenjhar Lake.

2.3.1. Hydrological and Climate Data

Daily discharge data of Keenjhar Lake and lake water levels of gauging stations for the last 17 years (2000–2016) were collected from Sindh Irrigation department. On the other hand, daily and monthly meteorological data of rainfall and temperature (maximum and minimum) for last 17 years were collected from the Pakistan Meteorological Department (PMD). Additionally, daily and monthly evaporation, relative humidity, wind speed, and sunshine hours for the last 17 years were collected from the Tando Jam Meteorological Station. The average annual rainfall in the area is 175 mm, which mostly falls during the monsoon. The maximum temperature during the summer is 47 °C and the average minimum temperature between the ranges of 1 and 2 °C during January. Table 1a shows mean monthly flow and Table 1b shows the mean monthly evaporation and evapotranspiration of the Keenjhar Lake. Summary of collected data at monthly temporal resolution is shown in Figure 3.

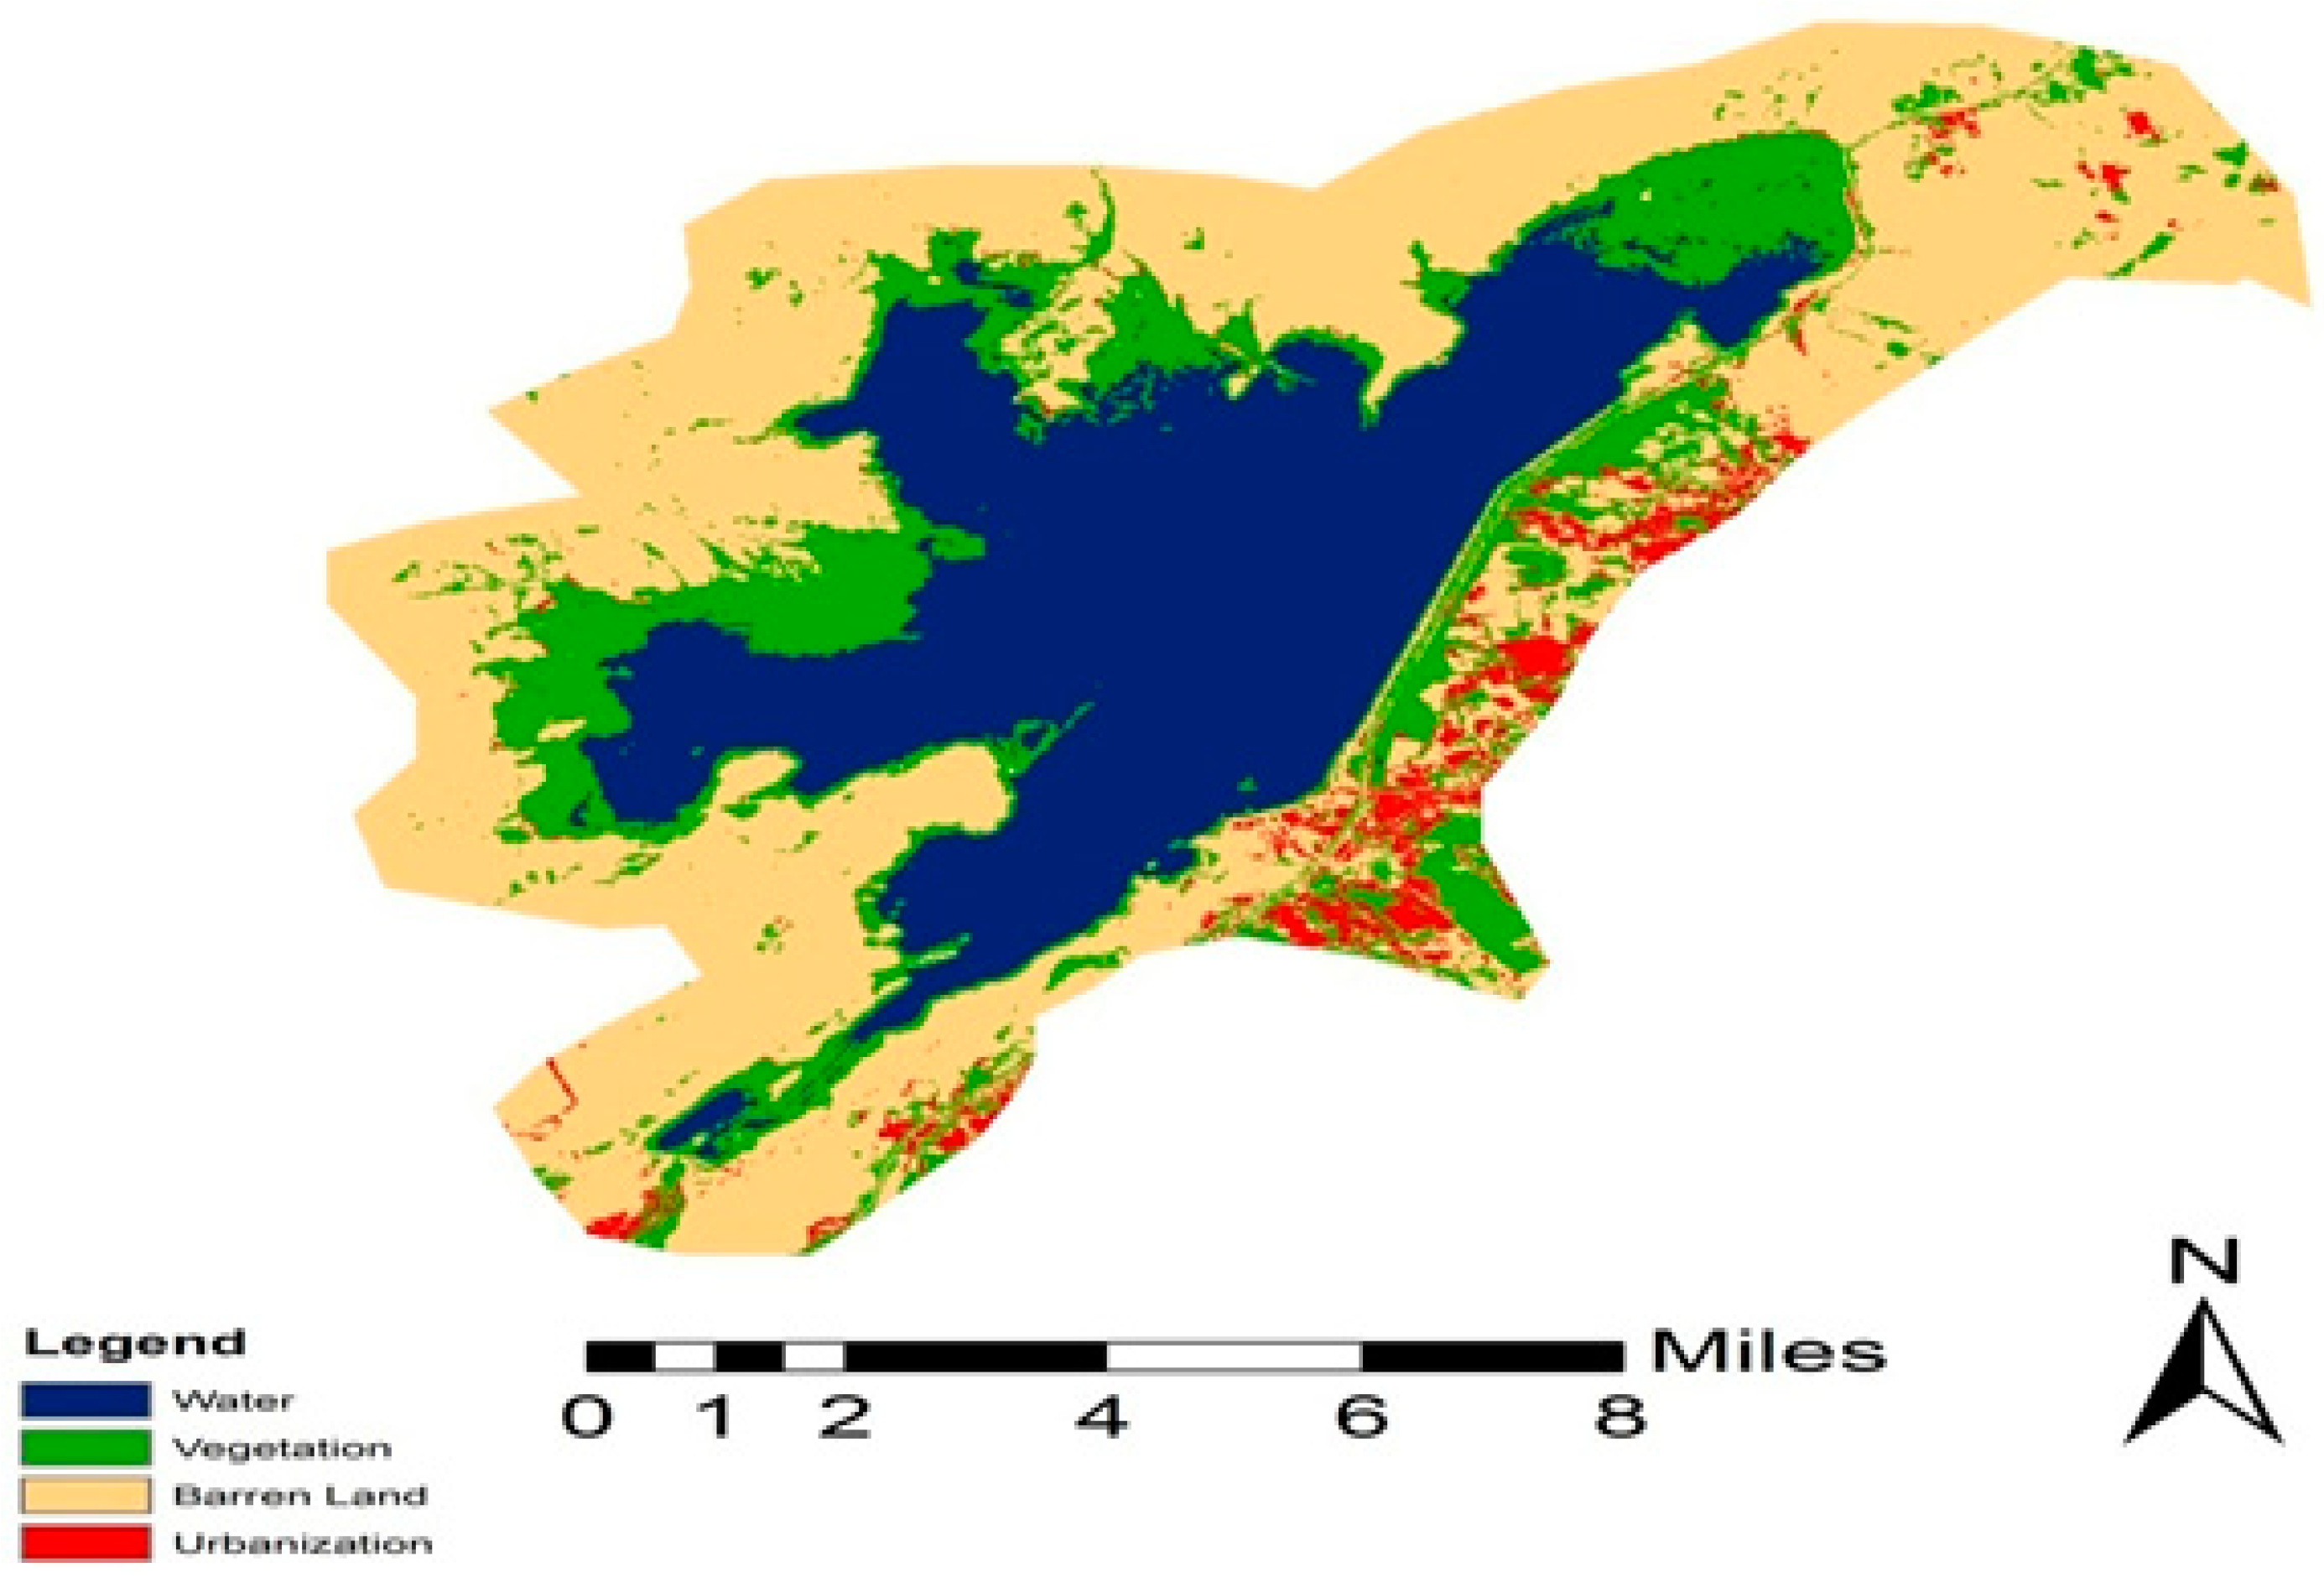
2.3.2. Land Cover/Land Use

The catchment area of the Keenjhar Lake is mostly characterized by mountainous regions, and only limited area is covered by forest. Figure 4 shows the land cover map of the Keenjhar Lake, which was classified at a spatial resolution of 15 m by supervised land use/land cover classification. Major land-use type is barren land (65.89%), whereas vegetation, urbanization, and water are 25.5%, 4.66%, and 3.93%, respectively. The satellite data covering the study area was obtained from Global Visualization Viewer (GLOVIS).

2.3.3. Soil Data

Thatta has diversified soil types ranging from sandy, loam, clayey to the saline, flooded, and mountain soils. The area of lake is mostly covered by rocky, gravelly, and loamy soils, and small area is covered by mountains. Area-wise distribution of soil is found as rocky and gravelly: 1326 km2; loamy soil: 672 km2; rough mountain land: 26 km2 and the rest 33 km2 include marshy, saline, flooded, and clayey soil as shown in Figure 5.

2.3.4. Inhabitants Data

According to the census of 1998 the population of District Thatta was 1,113,194, which has increased at a growth rate of 2.26% per year. The population estimated for 2016 is 1,665,931, which shows an increment of about 43% in last 18 years starting from year 1998 [10]. According to the UN report, the population of Karachi is increasing with a growth rate of 5% per year but during the years 1998 to 2011 the population grew from 9.8 million to 21.2 million with an increment of 115%. The population of Karachi has been estimated for the year 2016 as 17,121,000 [29]. Information about water sources for domestic water supply and irrigation was collected from relevant district offices, water supply offices, and through the literature survey. Summary of the data used in this study is shown in Table 2.

2.4. Governing Equations

2.4.1. Water Balance

A water balance represents an inventory of water for a specific body of water during a certain time period. This states that for any arbitrary volume and during any period of time the difference between total input and output will be balanced by the change of water storage within the volume [13,40]. Equations of water balance are based on the principle that the difference between the water inflow and outflow of water at a given time during the hydrological system of lake is equal to change in water storage of that system. All the lake’s water gains and losses and measuring the corresponding change in the lake level over the same period are taken into account in order to compute the lake water budget, as it appears in the following equation:
ΔS/Δt = Inflow − Outflow
where, ΔS and Δt represent the change in storage and time duration, respectively.

2.4.2. Estimation of Evapotranspiration

The pan evaporation data 2000–2016 has been collected from the meteorological station located at TandoJam, while the modified Penman method was used to estimate evapotranspiration. The modified Penman formula can be stated as follows:
ET0 = C × (W × Rn) + (1 − W) × f(u) × (ea − ed)
where ET0 = Reference crop evapotranspiration (mm/day); W × Rn = Represents radiation term, and (1 − W) × f(u) × (ea − ed) = aerodynamic term; W = temperature and elevation related weighting factor for the effect of radiation; Rn = net radiation; Rn = (Rns − Rnl) in mm/day; Rns = the net incoming shortwave solar radiation; Rns = n/N × 0.5 + 25 × Ra × 0.75; Ra = extra-terrestrial radiation expressed in equivalent evaporation in mm/day; n = actual duration of bright sunshine (sunshine hour); N = maximum possible duration of bright sunshine; Rnl = the net long wave radiation; Rnl = f (n/N) × f(ed) × f(t)
f(t) = correction factors for temperature (It depends on different values of temperature).
f(ed) = mean actual vapor pressure; f(ed) = e d × 0.044 0.34
ed = mean actual vapor pressure of air in millibar; ed = ea × RH (mean)/100
RH = relative humidity
ea = saturation vapor pressure in millibar at the mean air temperature in degrees centigrade
Δe = ea − ed
(1 − W) = a temperature and elevation related weighting factor and the effect of wind humidity on ET.
f(u) = a wind related function U2; f(u) = (U2/100 + 1) × 0.27
U2 = wind velocity
The adjustment weather factor ‘C’ and wind-related function f(u) are the important variations made in the modified Penman formula. This method gives very satisfactory value to crop ET. Computation technique is given in a solved problem subsequently and the constant value has been taken from [32].

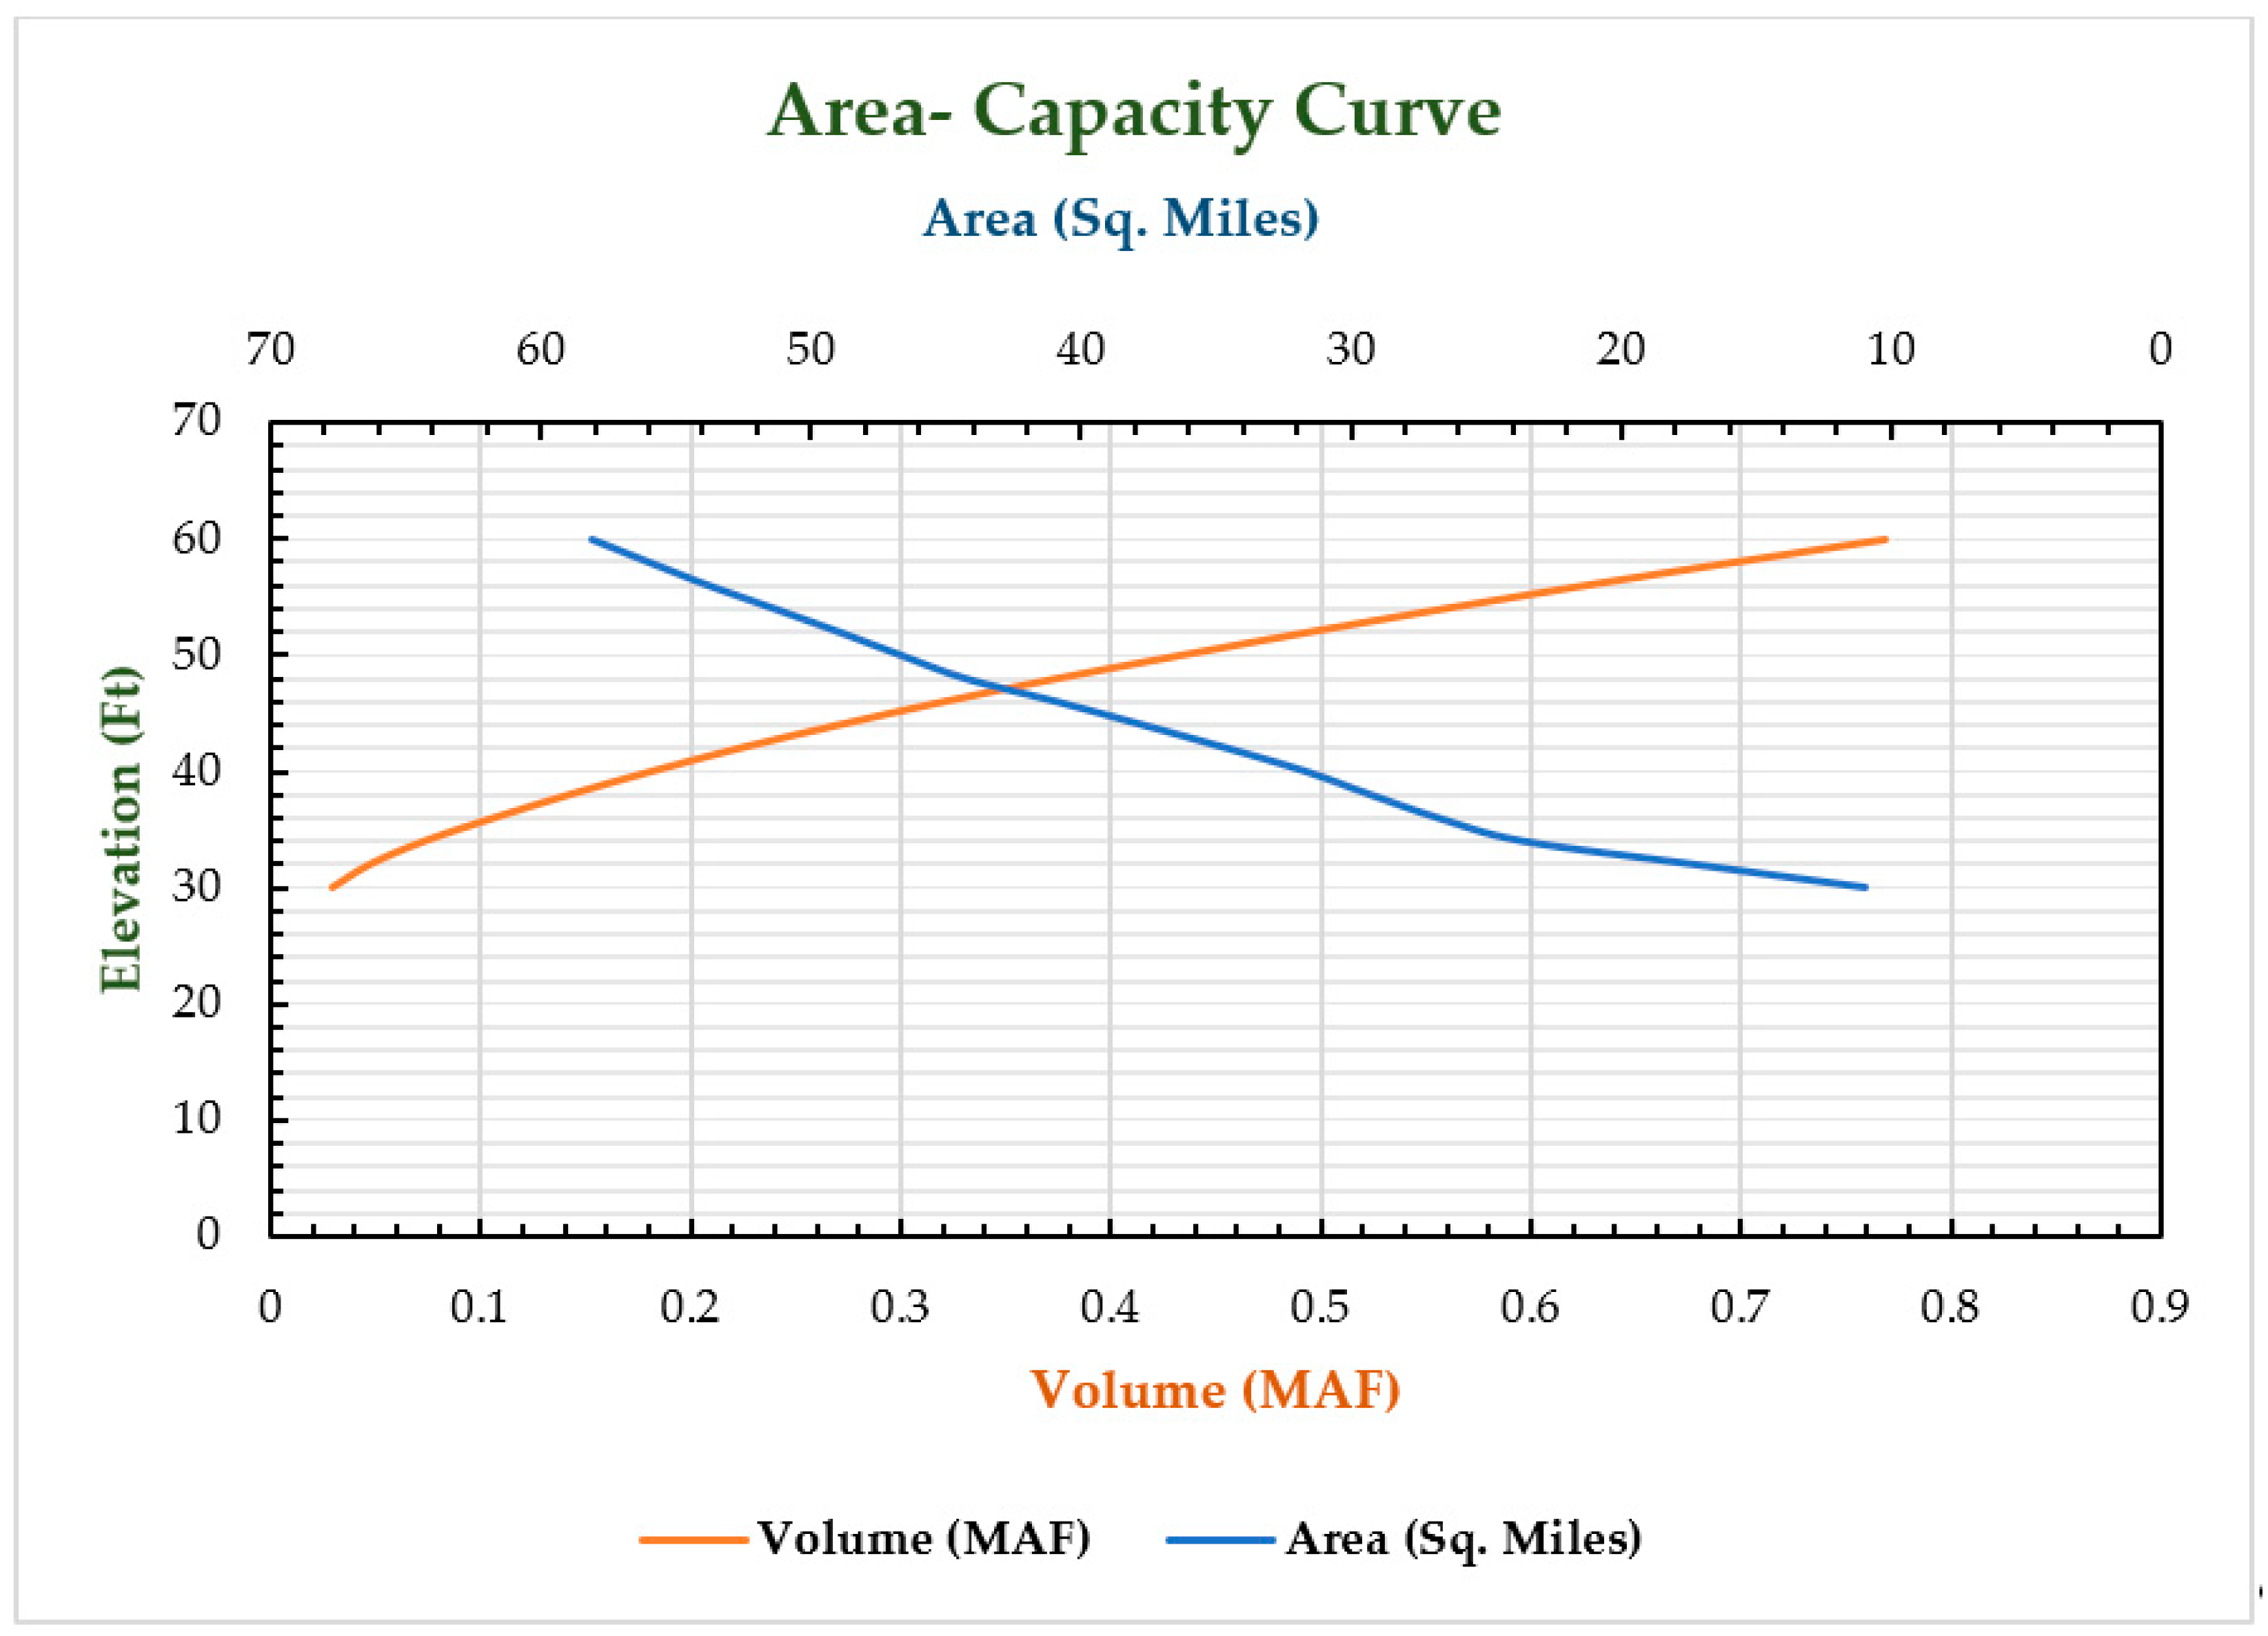
2.4.3. Lake Bathymetry

Bathymetry is the science of hydrology concerned with the measurement of volume or capacity of water bodies by following the depth patterns associated with the surface of water and to the floor of the body in conjunction with its topography. Bathymetric topographic maps represent the three-dimensional shape of the floor surface and in detail integrated contour lines or isobaths lines on the map. Integration of global positioning system (GPS) and echo sounder data with geographic information system (GIS) software is a cost-effective way to determine the current storage capacity and map the bathymetry of a reservoir. This GIS technique uses various GIS tools including method incorporation of spatially distributed field data, GRID, TIN, and Arc Map as analyst tools [32,41,42]. A database model was created to process all the survey data into GIS software. Field book data was entered into computer in the format of DBF files of northing, easting, and depth for individual cross-sections. The DBF files were used to generate the point coverage. A Triangulated Irregular Network (TIN) surface was generated from the bathymetric data. The TIN surface was used to produce contour plan using a 1-ft contour interval. The contour lines were plotted over the Landsat ETM+Satellite image to assess any errors or anomalies. Bathymetric data has been collected from the National Engineering Services of Pakistan (NESPAK) as a series of cross-section lines across the lake surface area perpendicular to the longitudinal axis of the reservoir streamlines. The lines are 500 to 1000 ft apart depending upon the local morphology of the lake. This data has been collected by using fiberglass turbo engine powerboat with a handheld echo sounder, a handheld GPS MAGELLAN explores with a 3-m accuracy. Water depths have been collected at discrete points approximately at 100 ft intervals depending on water depth, both speed, and other operational parameters. The accuracy of echo sounder was found to be 0.05 to 0.1 ft. Hence error range of the bathymetric data was found to be negligible. The depths with corresponding locations were entered into field book simultaneously. Horizontal location was recorded in the form of a set of Easting and Northing coordinates on Universal Transverse Mercator projection Zone 42 using WGS 1984 Datum. At the reservoir site, point features, including impoundment structure elevation, water’s edge, and additional land features, have been collected.

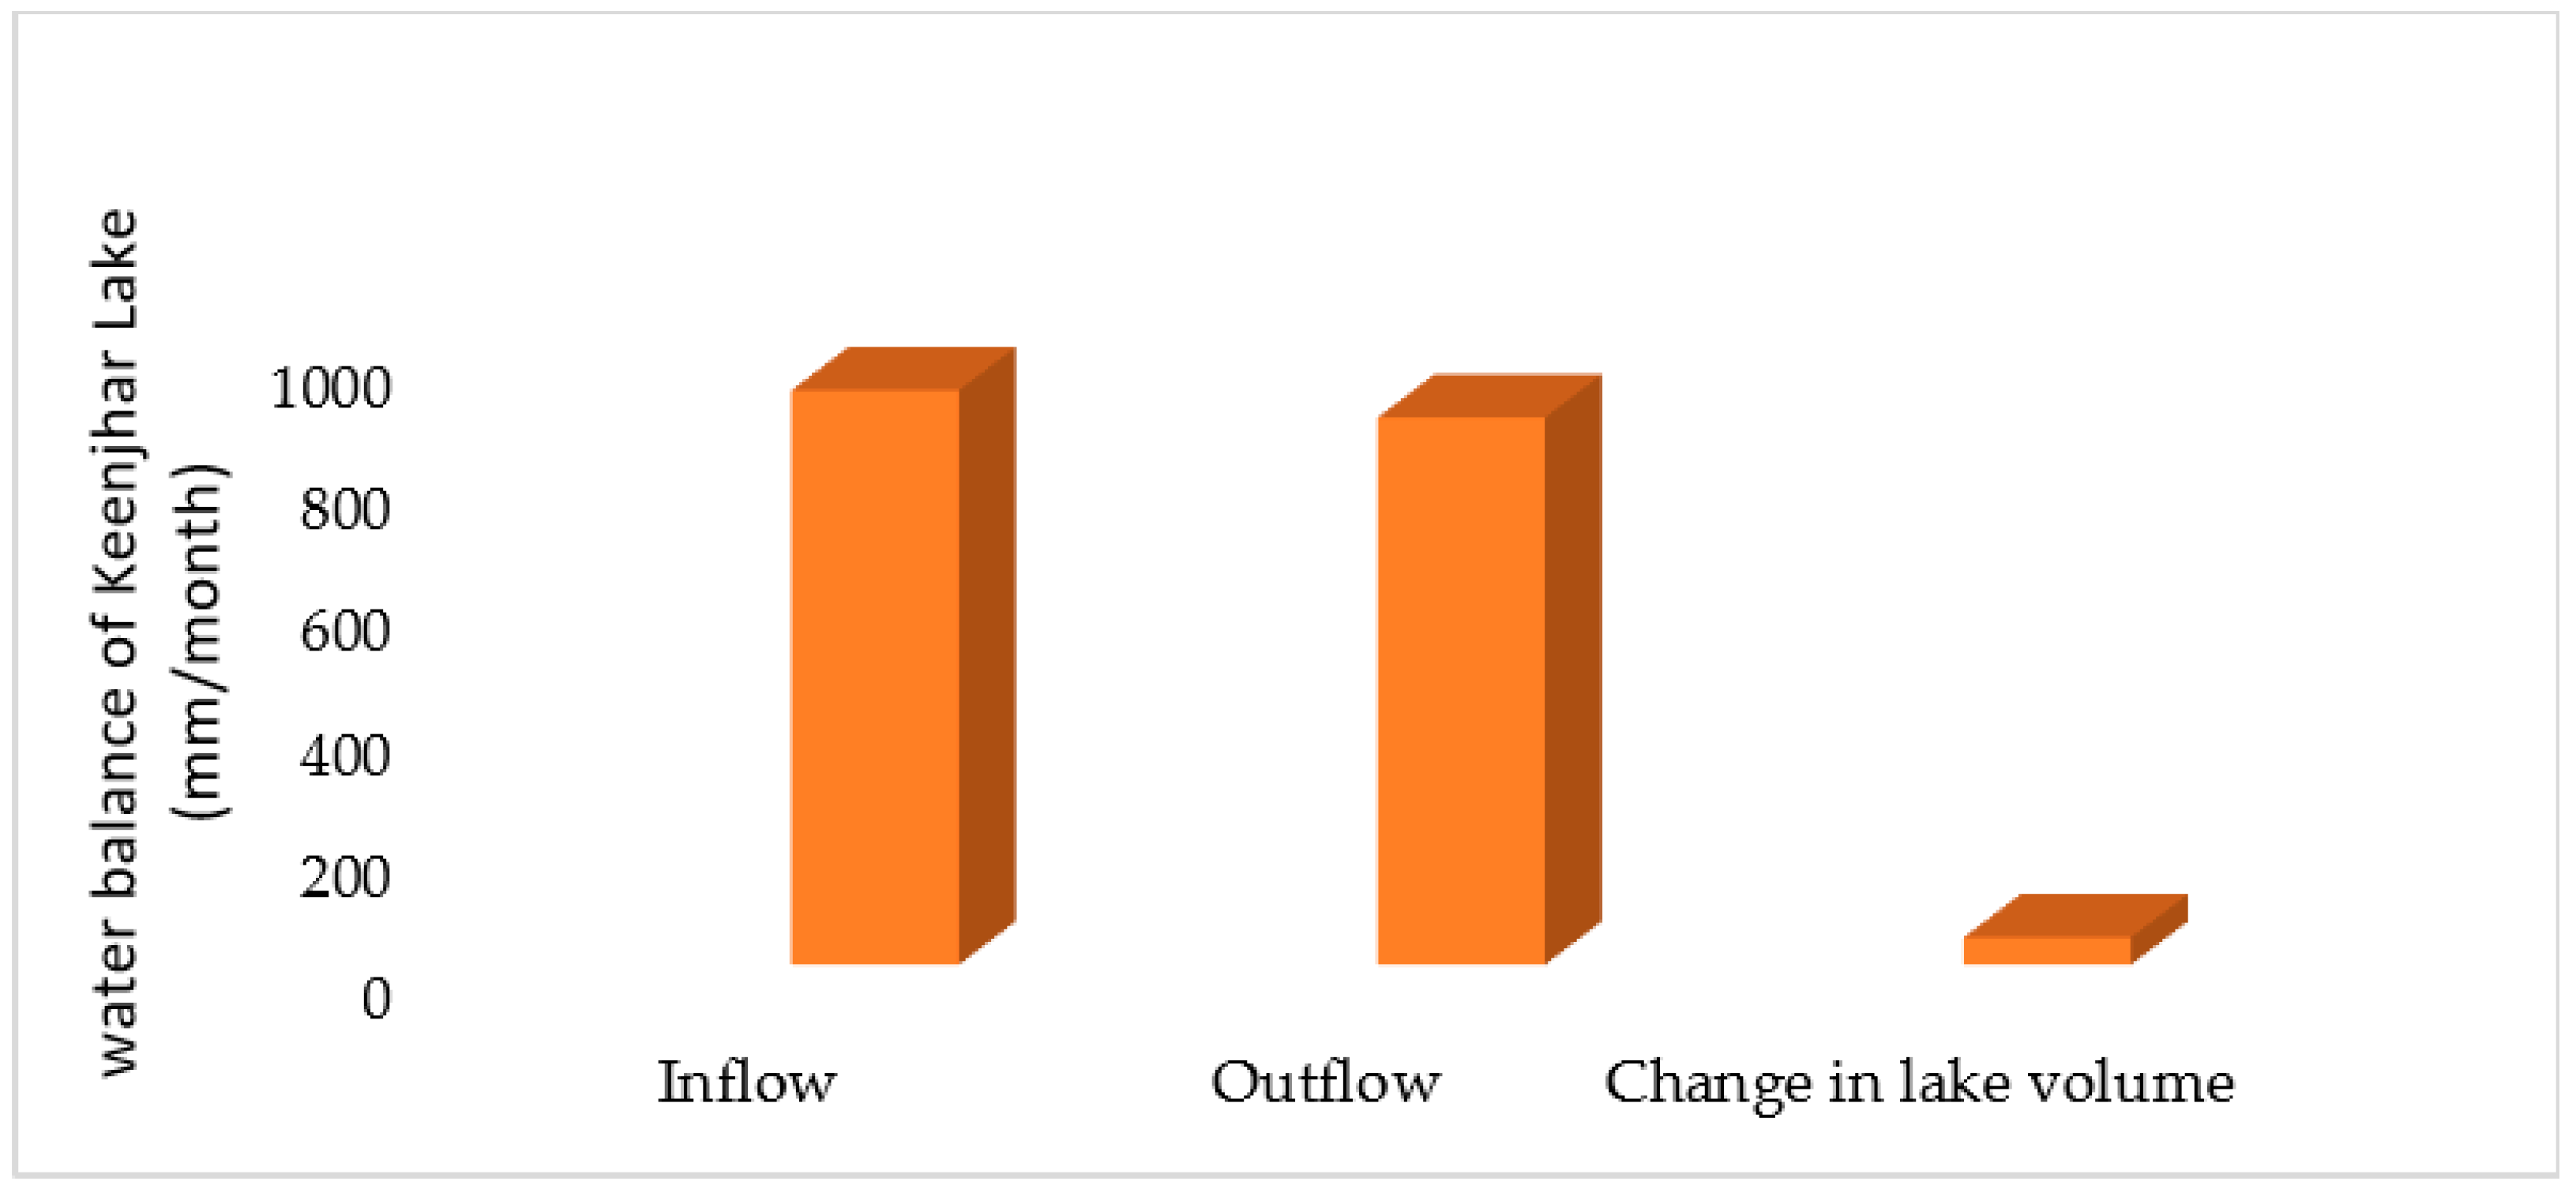
2.5. Water Balance for Keenjhar Lake

Water balance was developed for Keenjhar Lake on an annual basis for a duration of 17 years (2000–2016). The water balance model equation was used to compute the area, depth, and volume of the lake. The purpose of water balance is to assess the Keenjhar Lake’s temporal changeability in water level area and calculate the volume on the monthly and annual time interval. The water balance equation can be written as follows:
ΔV = P + R − A − E
where ΔV = change in lake volume; P = precipitation on the lake; R = surface runoff from the catchment (inflow); A = abstraction from the lake (outflow); E = water evaporation from the lake.

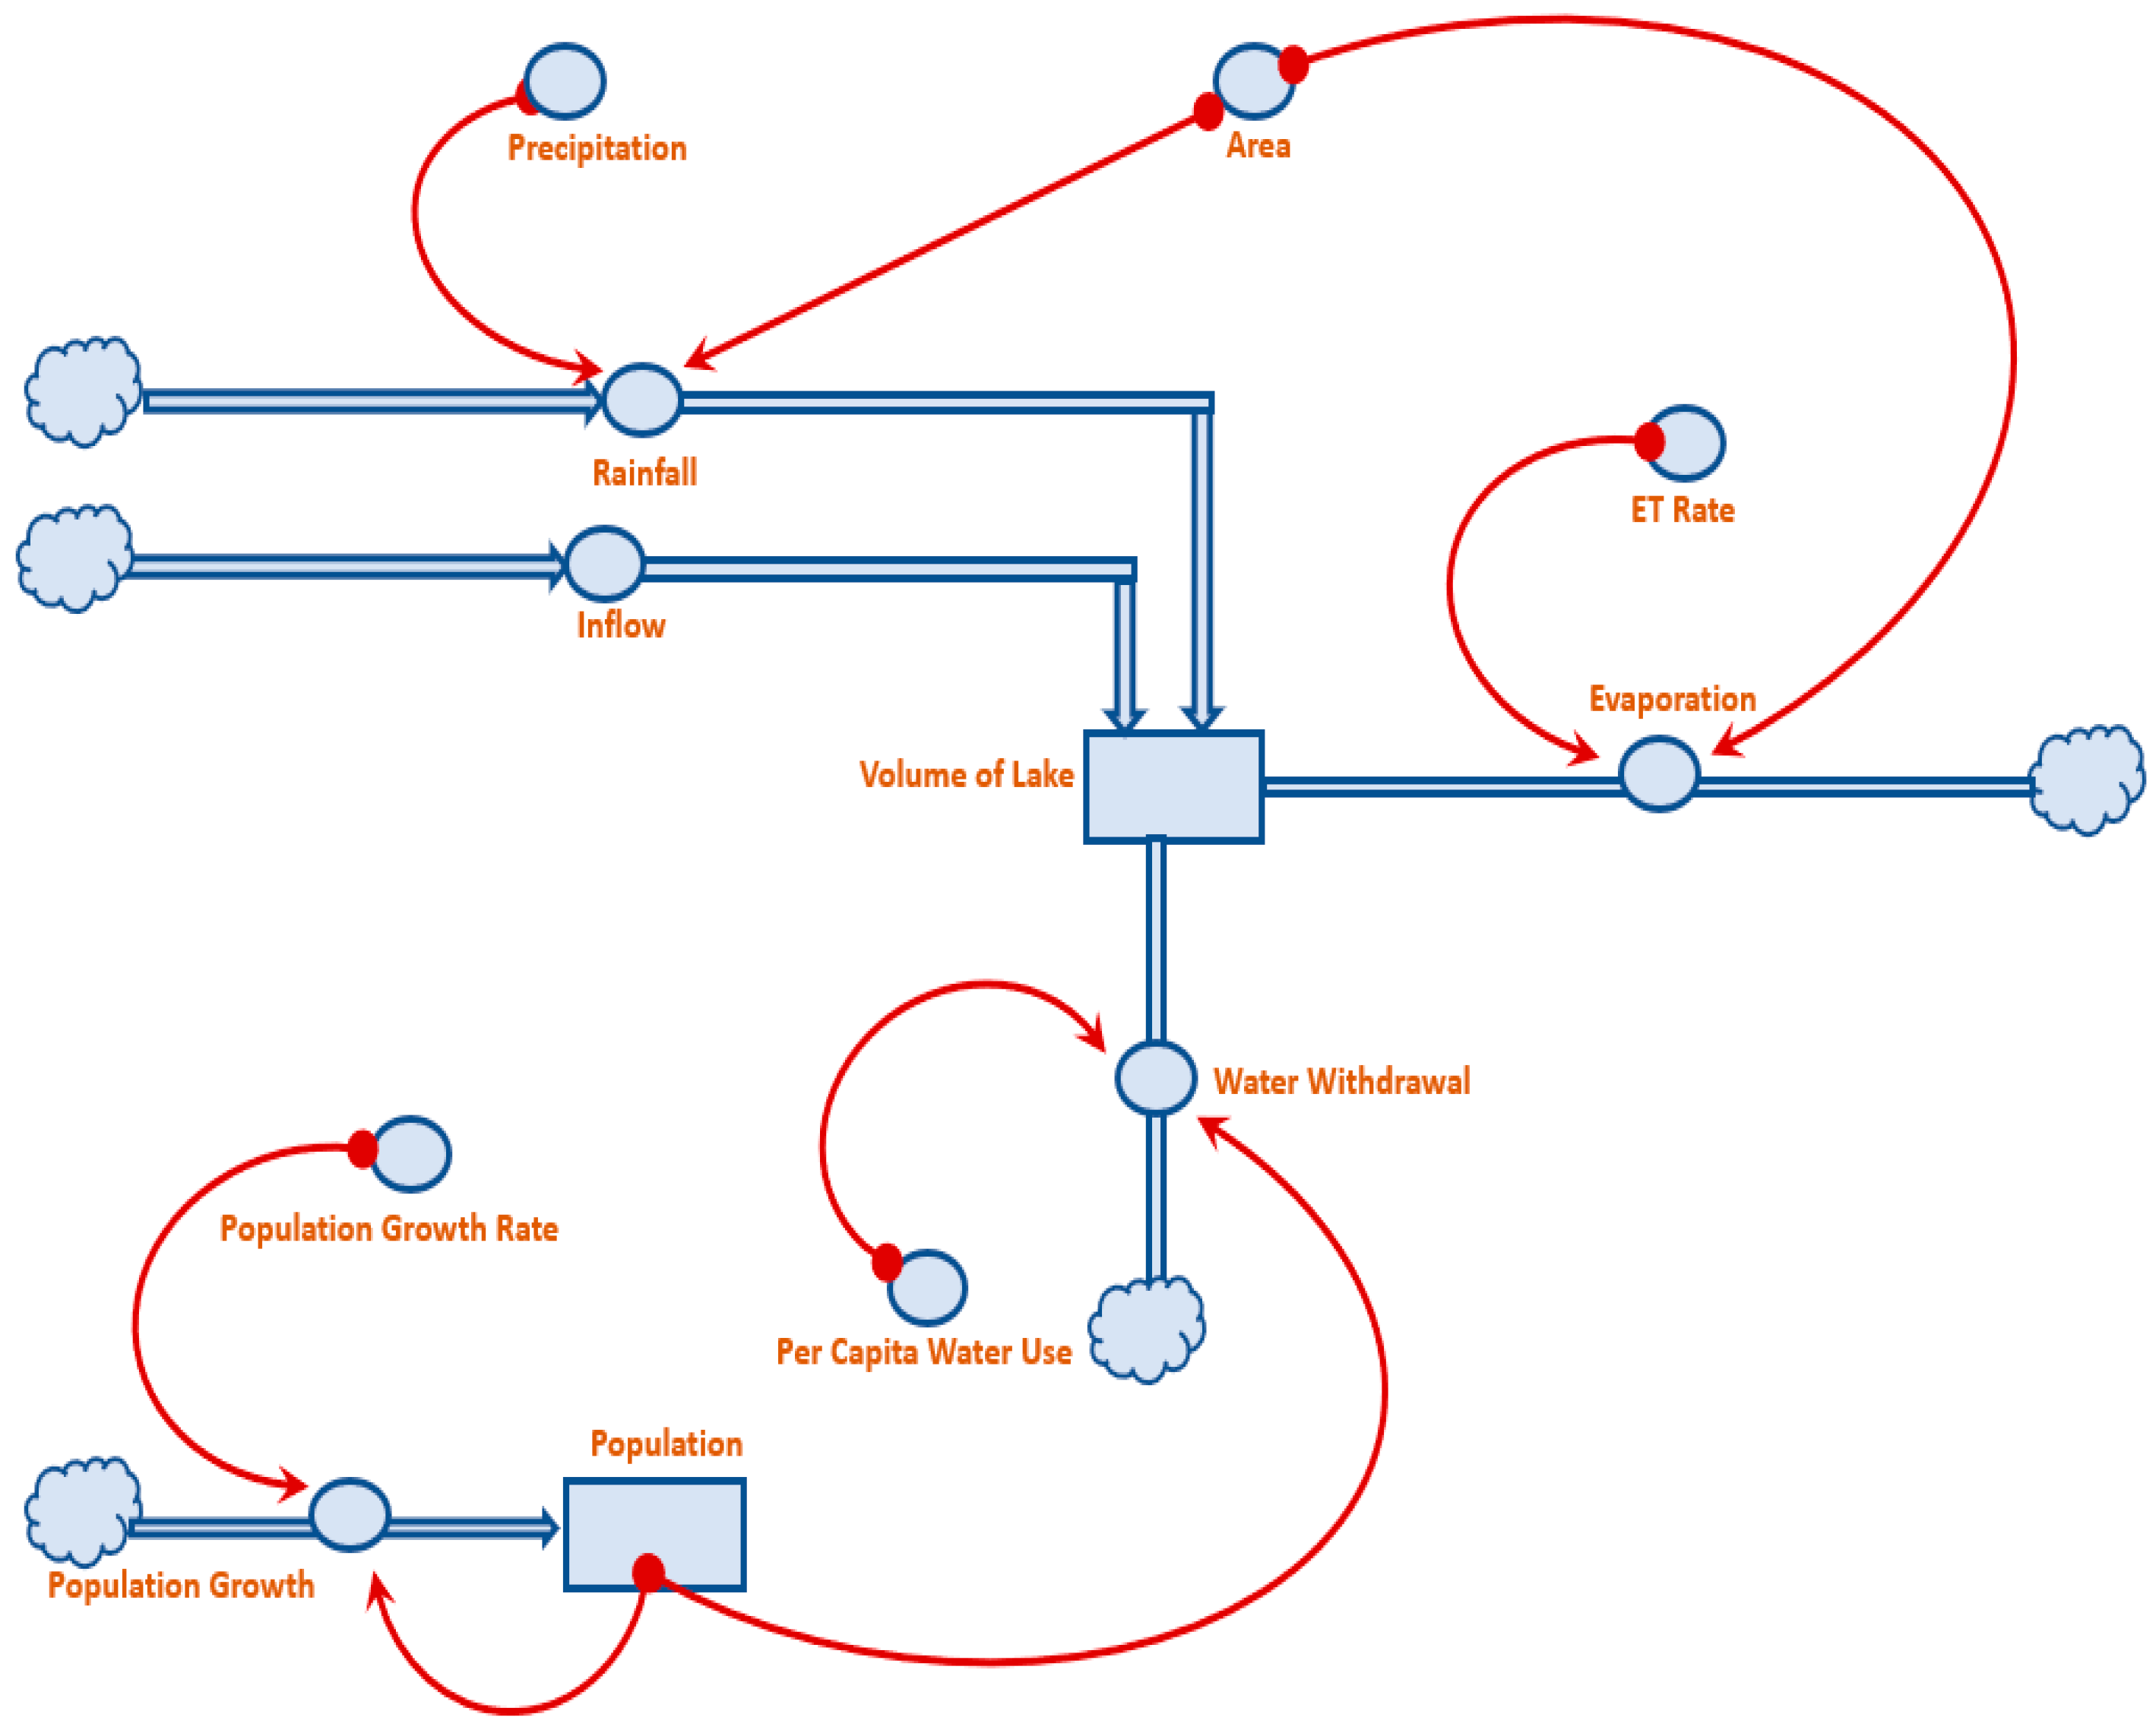
2.6. System Dynamics Modeling Approach

Governing equations and the associated assumptions, as well as conditions, were incorporated into the STELLA model. STELLA is a computer software program used to develop models for research and education with applications in economics, sciences, and engineering. Detailed descriptions of the STELLA software can be found in Isee Systems (www.iseesystems.com accessed 10 March 2019). The STELLA model normally has the following four basic components (Figure 6), (1) stocks, the state variables used to calculate the information accumulation in the stock and the flows into and out of the stock; (2) flows, the exchange variables that control the arrival or departure of information between the state variables; (3) converters, the auxiliary variables that can be represented by constant values or by values dependent on other variables or functions of various categories; (4) connectors, which connect among modeling features, variables, and elements [21].
System dynamics Model construction was carried out by using STELLA software version (10.1). The modeling process involves creating conceptual diagrams, which include input parameters, important variables, and their calibration and equations with the available data. Model sensitivity to changing parameters was tested and then simulated to examine feasible future changes in the Keenjhar Lake level. The following stocks were constrained by the non-negativity condition in the software system, such as population, years, and lake volume. The connector in the diagram involves important mathematical relationships. The scenarios were predictable from the base year 2017 to 2050. There are five scenarios tested in the model, which are as follows: Scenerio 01: Base Line; Scenerio 02: Maximum population growth rate; Scenerio 03: Minimum population growth rate; Scenario 04: High rainfall; Scenario 05: Low rainfall. The conceptual model of the Keenjhar Lake is shown in Figure 6. Conceptual model of the Keenjhar Lake contains important mathematical relationships.

2.7. Model Calibration and Validation

The modeling process involves creating conceptual diagrams, which include input parameters, important variables, and their calibration and equations with the available data. Model sensitivity to changing parameters was tested and then simulated to examine feasible future changes in the Keenjhar Lake level. Model calibration is the process of obtaining the best fit between the observed data and predicted results by adjusting the input parameter values within a reasonable range, while model validation is the same process using the calibrated model without making any changes to the input parameter values. In this study, we used the observed inflow and outflow data for model calibration and validation. With very good R2, low p values, and reasonable NRMSE, we concluded that the STELLA model developed in this study performed well in predicting Keenjhar Lake water balance.

2.8. Lake Volume Estimation

Surface area volume and elevation curves were generated for the Keenjhar Lake. Arc Scene was deployed to generate visual model. In addition, it was used to produce the initial point data as well as the final TIN and contour data. The final TIN was converted to a grid format and combined with a Digital Elevation Model (DEM) used in Arc Scene. The bathymetry model of the lake was built along with elevation, area, and volume. The reservoir capacity of Keenjhar Lake at the proposed conservation level of 57 ft is 660,000 acre-ft. Figure 7 exhibits the area capacity curve of the lake. According to the criterion of storage capacity, the Keenjhar Lake reservoir falls into the category of major reservoirs, whereas according to height of embankment criteria, it falls into the category of minor reservoirs [43].

3. Results

All components of the water balance were estimated, and the water balance of Keenjhar Lake is shown in Table 3. The result of lake water balance reveals that the contribution of direct rainfall and K.B.F (Upper) to the annual inflow components to the lake are about 22.03% and 77.91%, respectively. Evaporation, outflow to K.B.F Lower, and water abstraction to K.G. Canal constituted about 5.78%, 92.55%, and 1.57%, respectively, of the total annual outflow from the lake. The annual water balance of Keenjhar Lake is shown in Figure 8.

3.1. Water Volume Simulations by STELLA

The simulated graph presents a comparison between the trends of the selected variables at particular scales and codes. During the model, calibration results were compared with basic calculations. In STELLA, Euler’s Integration was chosen at the interval of the years when the results of the model were compared with fundamental mathematical equations.

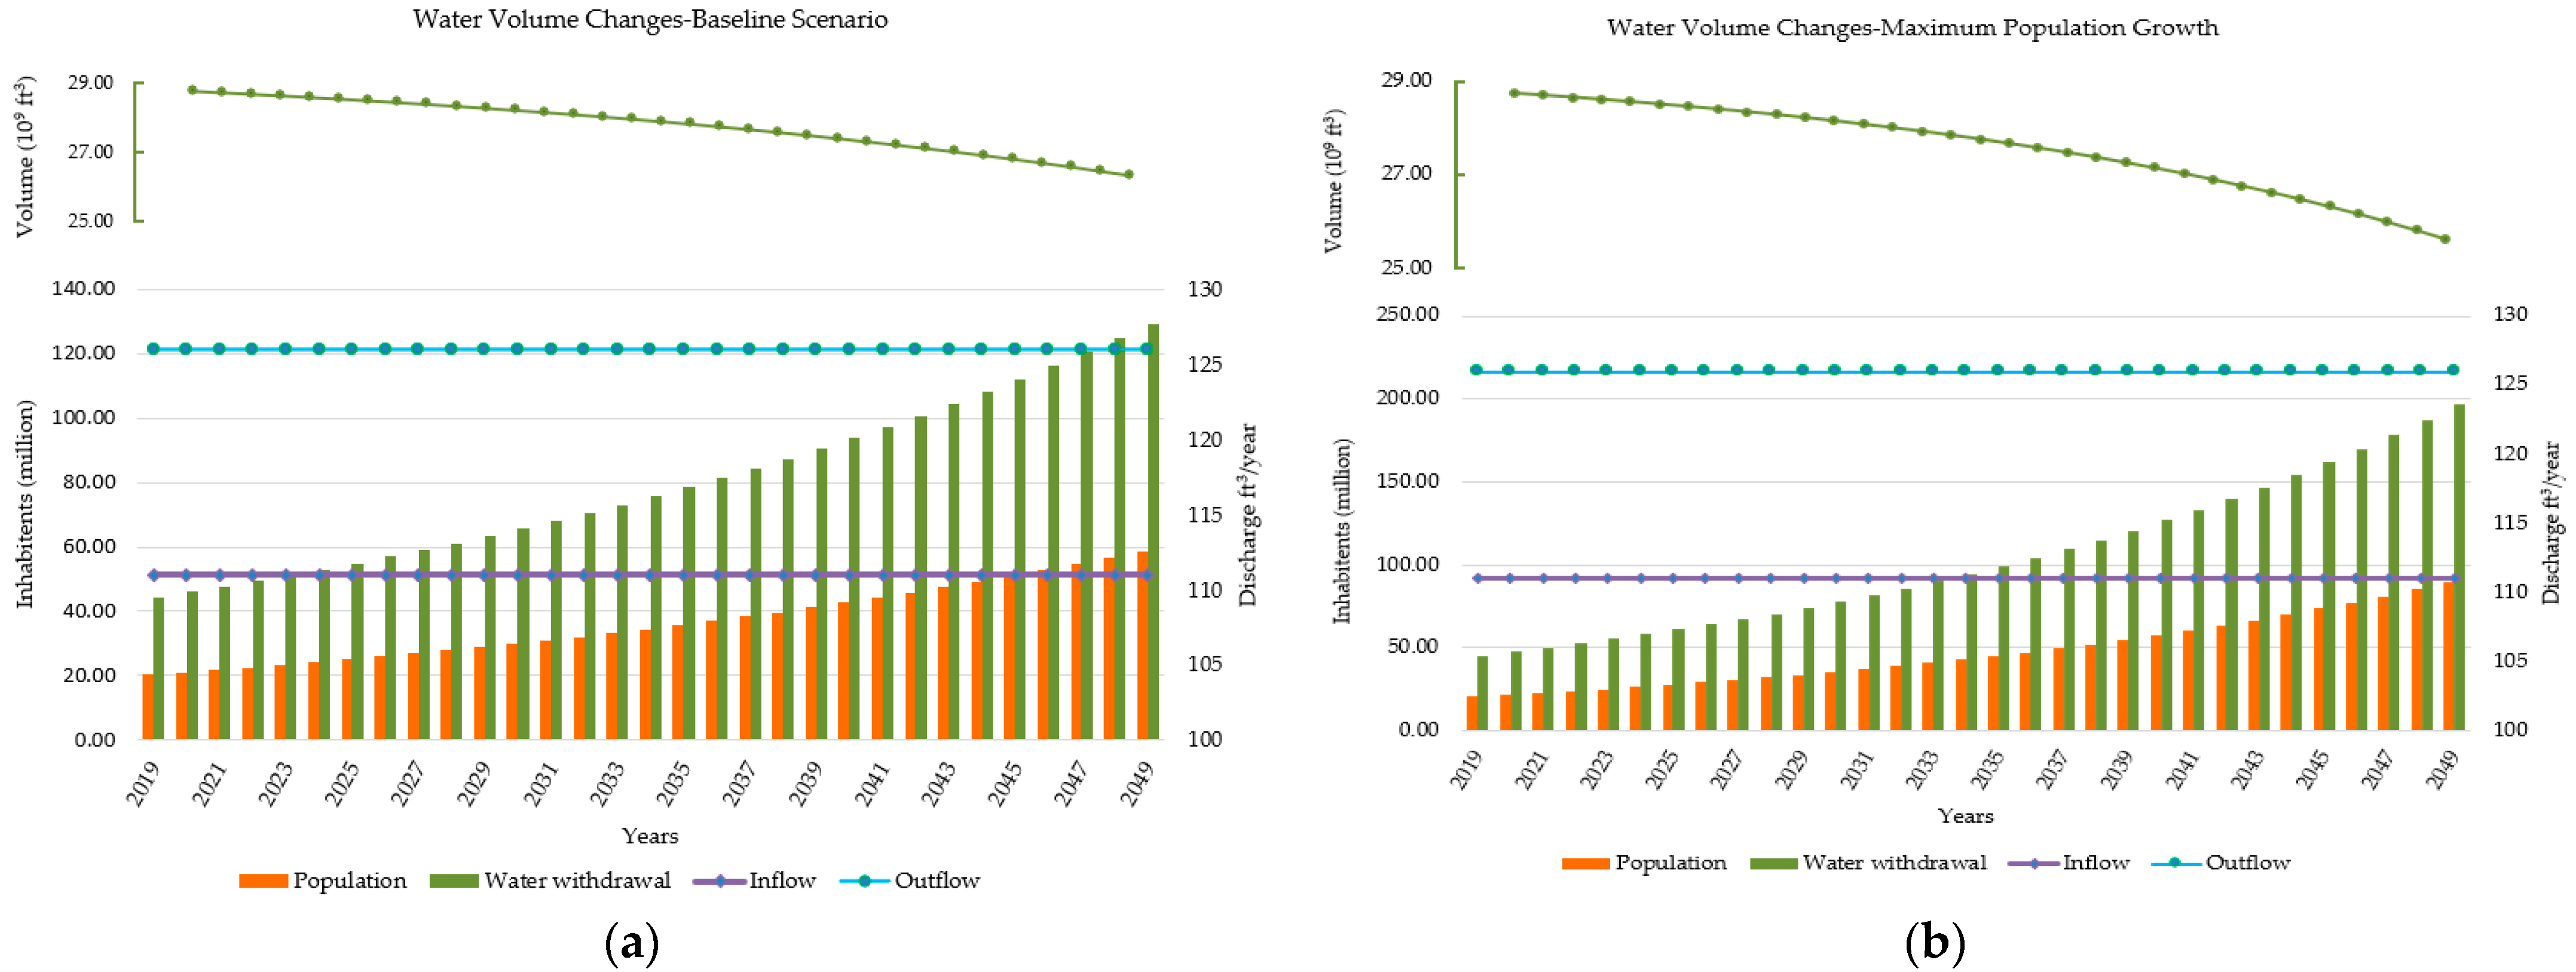
3.1.1. Scenario 1 (Water Volume Changes-Base Line Scenario)

According to the Pakistan statistical census [10] and the UN report [29], the population of the Karachi and Thatta were estimated to be about 14,552,850. Based on the UN report and Pakistan’s statistical census population data population was projected for 2017–2050. The results were similar to those obtained by using a net growth rate of 3.63%. Results show that the population of the study area will rise to 50 million in 2050. Simulated water volume changes regarding lake inflow and water withdrawal are in ft3/year, and the volume of the lake in ft3 is shown in Figure 9a. It also shows that lake volume decreased from 9.066 × 1017 ft3 to 9.066 × 1017 ft3. The inflow of water remained constant at 3.784 × 1010 ft3/yr and the withdrawal of water increased from 3 × 1010 ft3/yr to 1.2 × 1011 ft3/yr. Based on simulated values when the withdrawal of water and population growth were not considered in the model. It shows that all variables almost remain constant. A very small change occurs in evaporation and rainfall. Evaporation decreases from 180 ft3/yr to 179 ft3/yr, rainfall decreases from 10,992 ft3/yr to 10,991 ft3/yr, and the inflow of water remains constant at 3.784 × 1010 ft3/yr.
The function curve of Inflow Lake was added to the model of Keenjhar Lake as shown in Figure 9a. It was analyzed that the population in the study area shows a high growth rate. The result of this growth rate assumption will be water abstraction from the Keenjhar lake and will have a negative effect on the water volume of the lake. Effective and sustainable solutions must be considered for the long-term control of such growth factors.
A bathymetry survey was conducted by NESPAK in August 2006. The result of the survey shows that Keenjhar lake had a volume of 660,000 acre ft. A model was prepared based on the observed climatic conditions for the long term with the addition of population growth. A possible recovery of the lake water volume at 3 ft3 was simulated for 34 years. It was simulated that water withdrawal increased from 3 × 1010 ft3/yr to 1.2 × 1011 ft3/yr. The simulation showed a recovery to equilibrium gained by the 34th year. To test the long-term effects of outflows, a Keenjhar Lake discharge was used at 1.2 × 1011 ft3/yr and then the model was run for 34 years for results as shown in Figure 9a. The projected annual water per capita consumption was adjusted as an effect of economic growth on water consumption and can be added to the model structure. The simulation also recommends that reducing global warming and increasing the population can add a considerable amount to lake sustainability. Apart from the socio-economic damages, the reduction in the lake depth is also affecting the ecological integrity.

3.1.2. Scenario 2 (Water Volume Changes-Maximum Population Growth Rate)

In this scenario, the maximum population growth rate of 5% was taken. The result of this model is shown in Figure 9b, which entails that the population will reach 80 million by 2050. Due to the increase in population, water withdrawal from the lake increases rapidly and will change the volume of the lake. Simulated values in Figure 9b of lake trend for the years 2017–2050 show that lake water withdrawal will increase from 0 ft3/year to 2 × 1011 ft3/year with an increase of population from 10 million to 80 million.

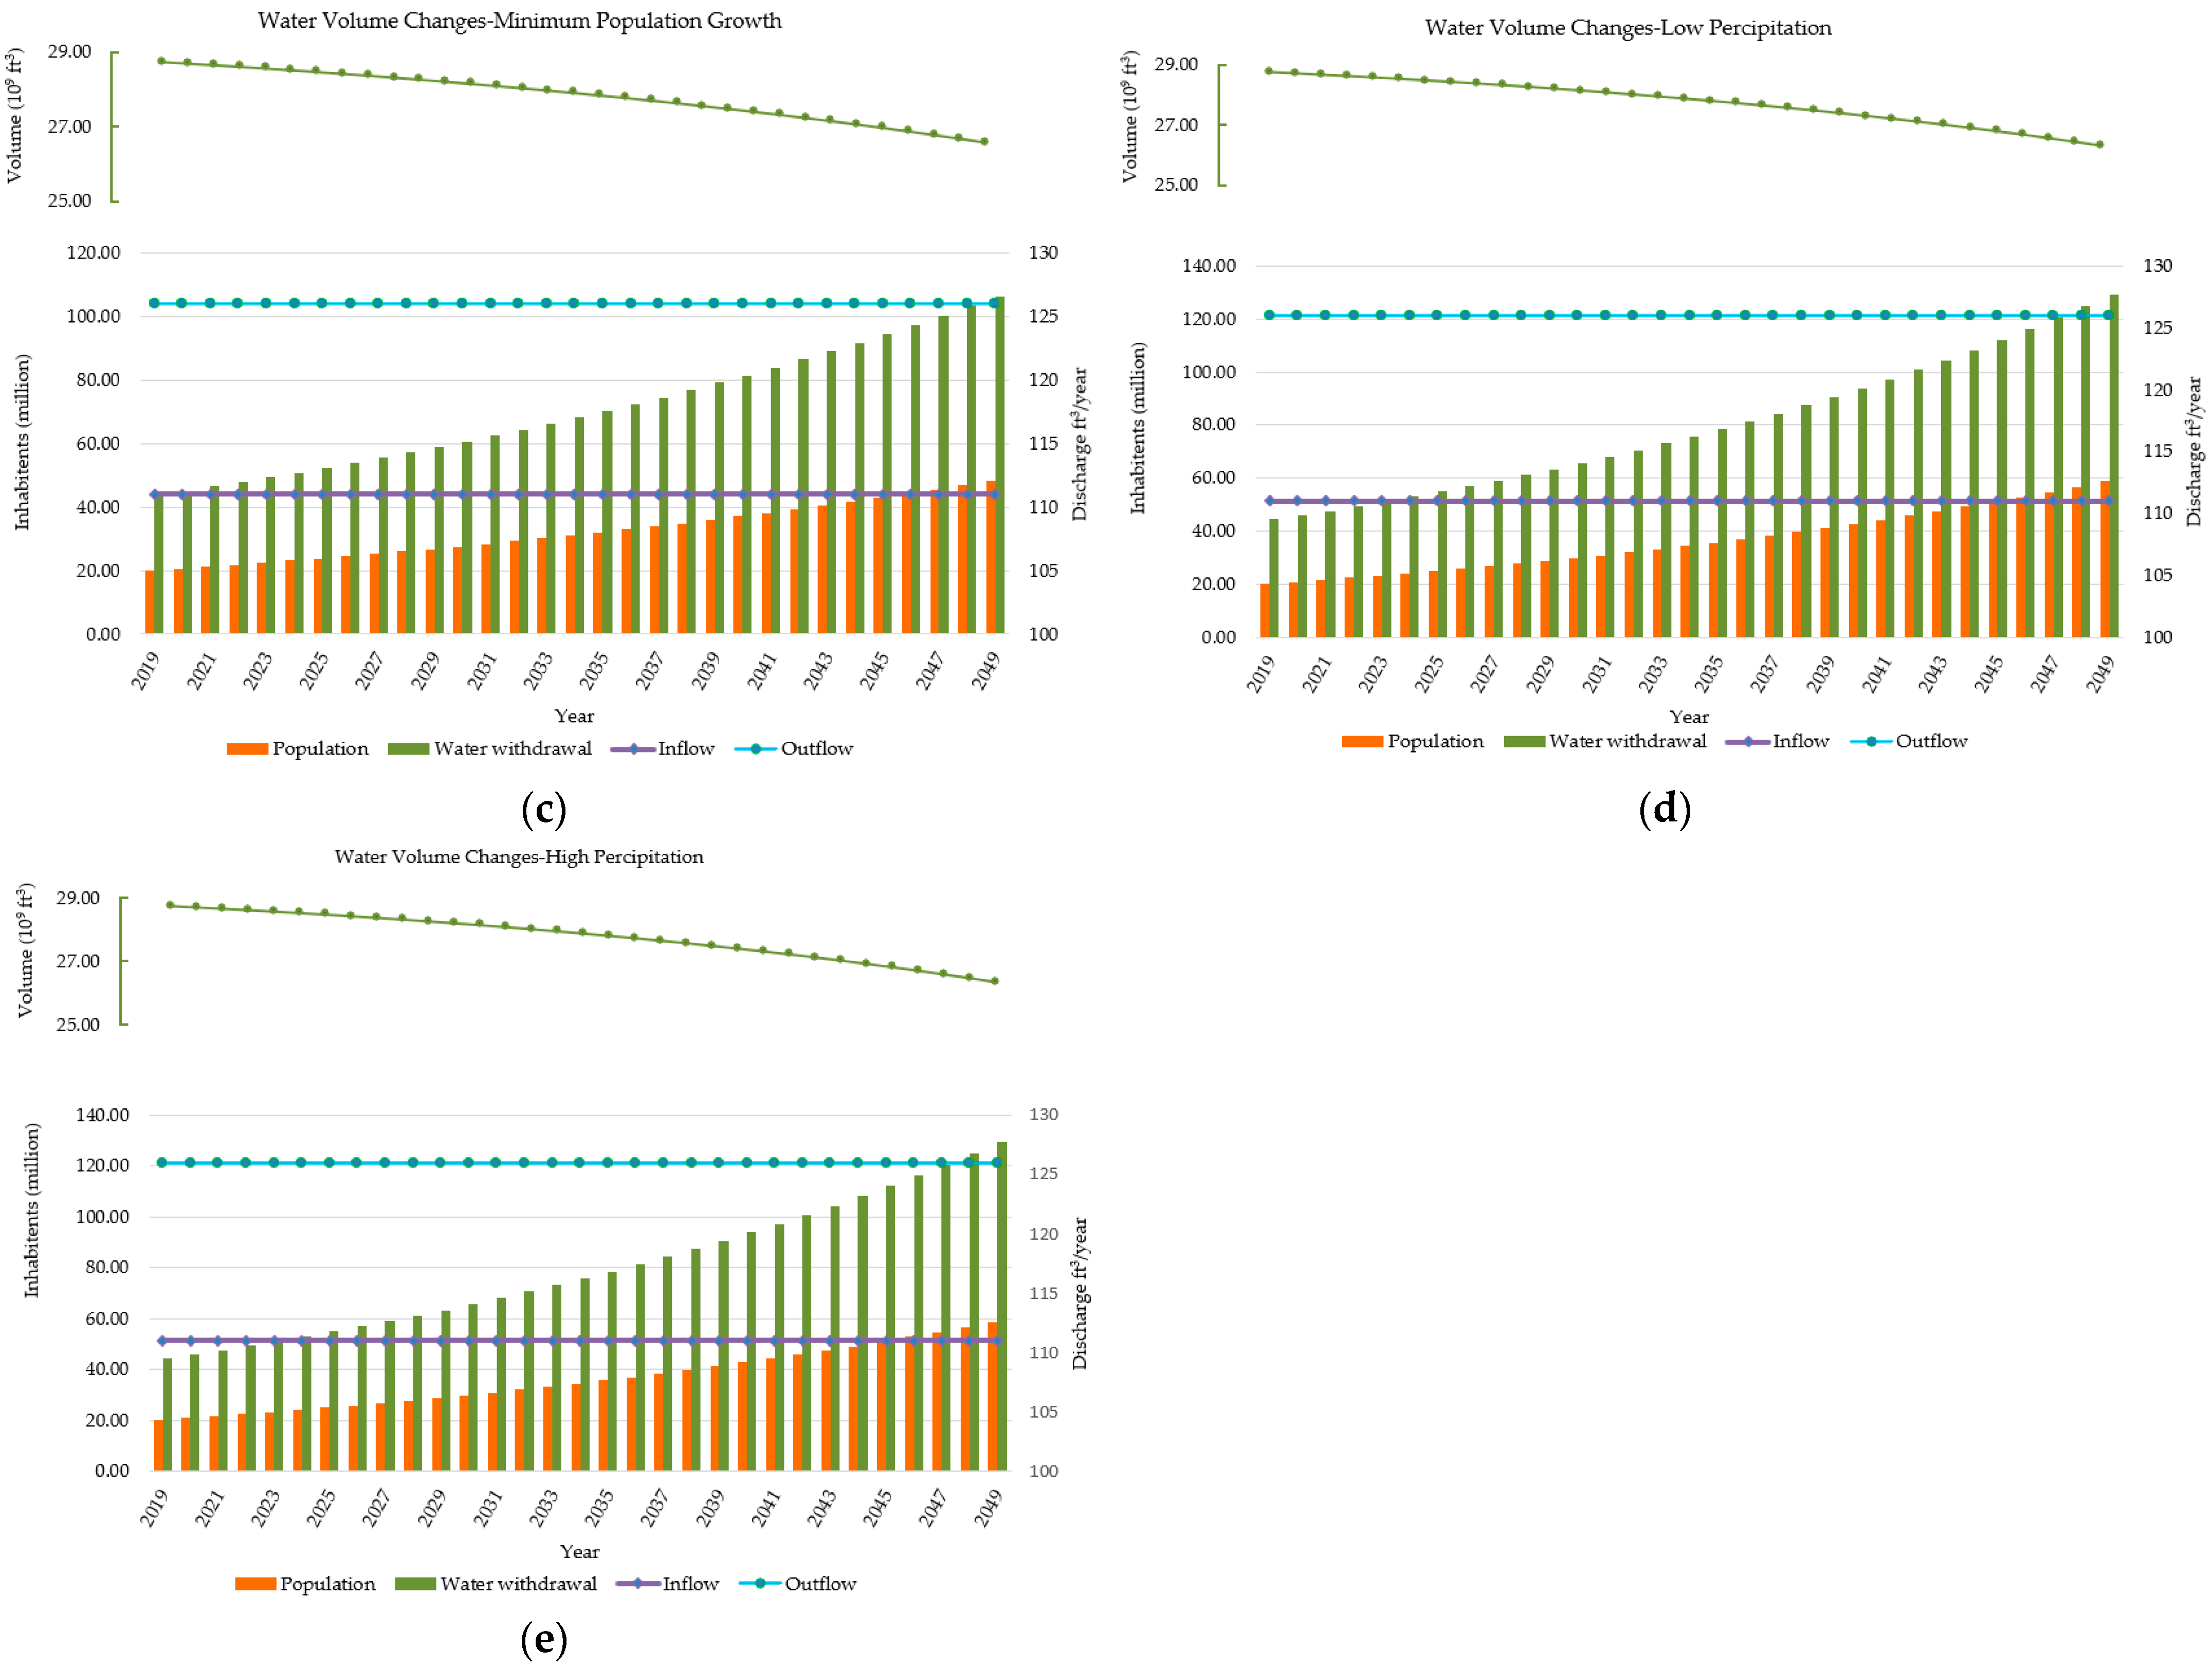
3.1.3. Scenario 3 (Water Volume Changes-Minimum Population Growth Rate)

In this scenario, a minimum population growth rate of 3% was taken. The results of the model in Figure 9c show that the population will increase from 10 million to 40 million, and water withdrawal will increase from 3 × 10¹⁰ to 1 × 1011 ft3/year.

3.1.4. Scenario 4 (Water Volume Changes-High Rainfall)

In this scenario, a 20% increase in rainfall from the original value was considered. The results in Figure 9d present that there is no change in the lake volume and inflow values. The withdrawal of water changes from 3 × 10¹⁰ to 1 × 1011 ft3/year. The simulated values of lake trend from 2017 to 2050 with consideration of water withdrawal and population growth in the model resulted that rainfall remained almost constant at 1120 ft3/year and water withdrawal increased from 3 × 10¹⁰ to 1 × 1011 ft3/year.

3.1.5. Scenario 5 (Water Volume Changes-Low Rainfall)

In this scenario, a 20% decrease in rainfall from the original value was considered. The result present in Figure 9e shows that there is no change in inflow, rainfall, and population values. The simulated values of lake trend for 2017–2050 with water withdrawal and population show that the rainfall almost remains constant at 10,771 ft3/year and water withdrawal increased from 3 × 10¹⁰ to 1 × 1011 ft3/year.

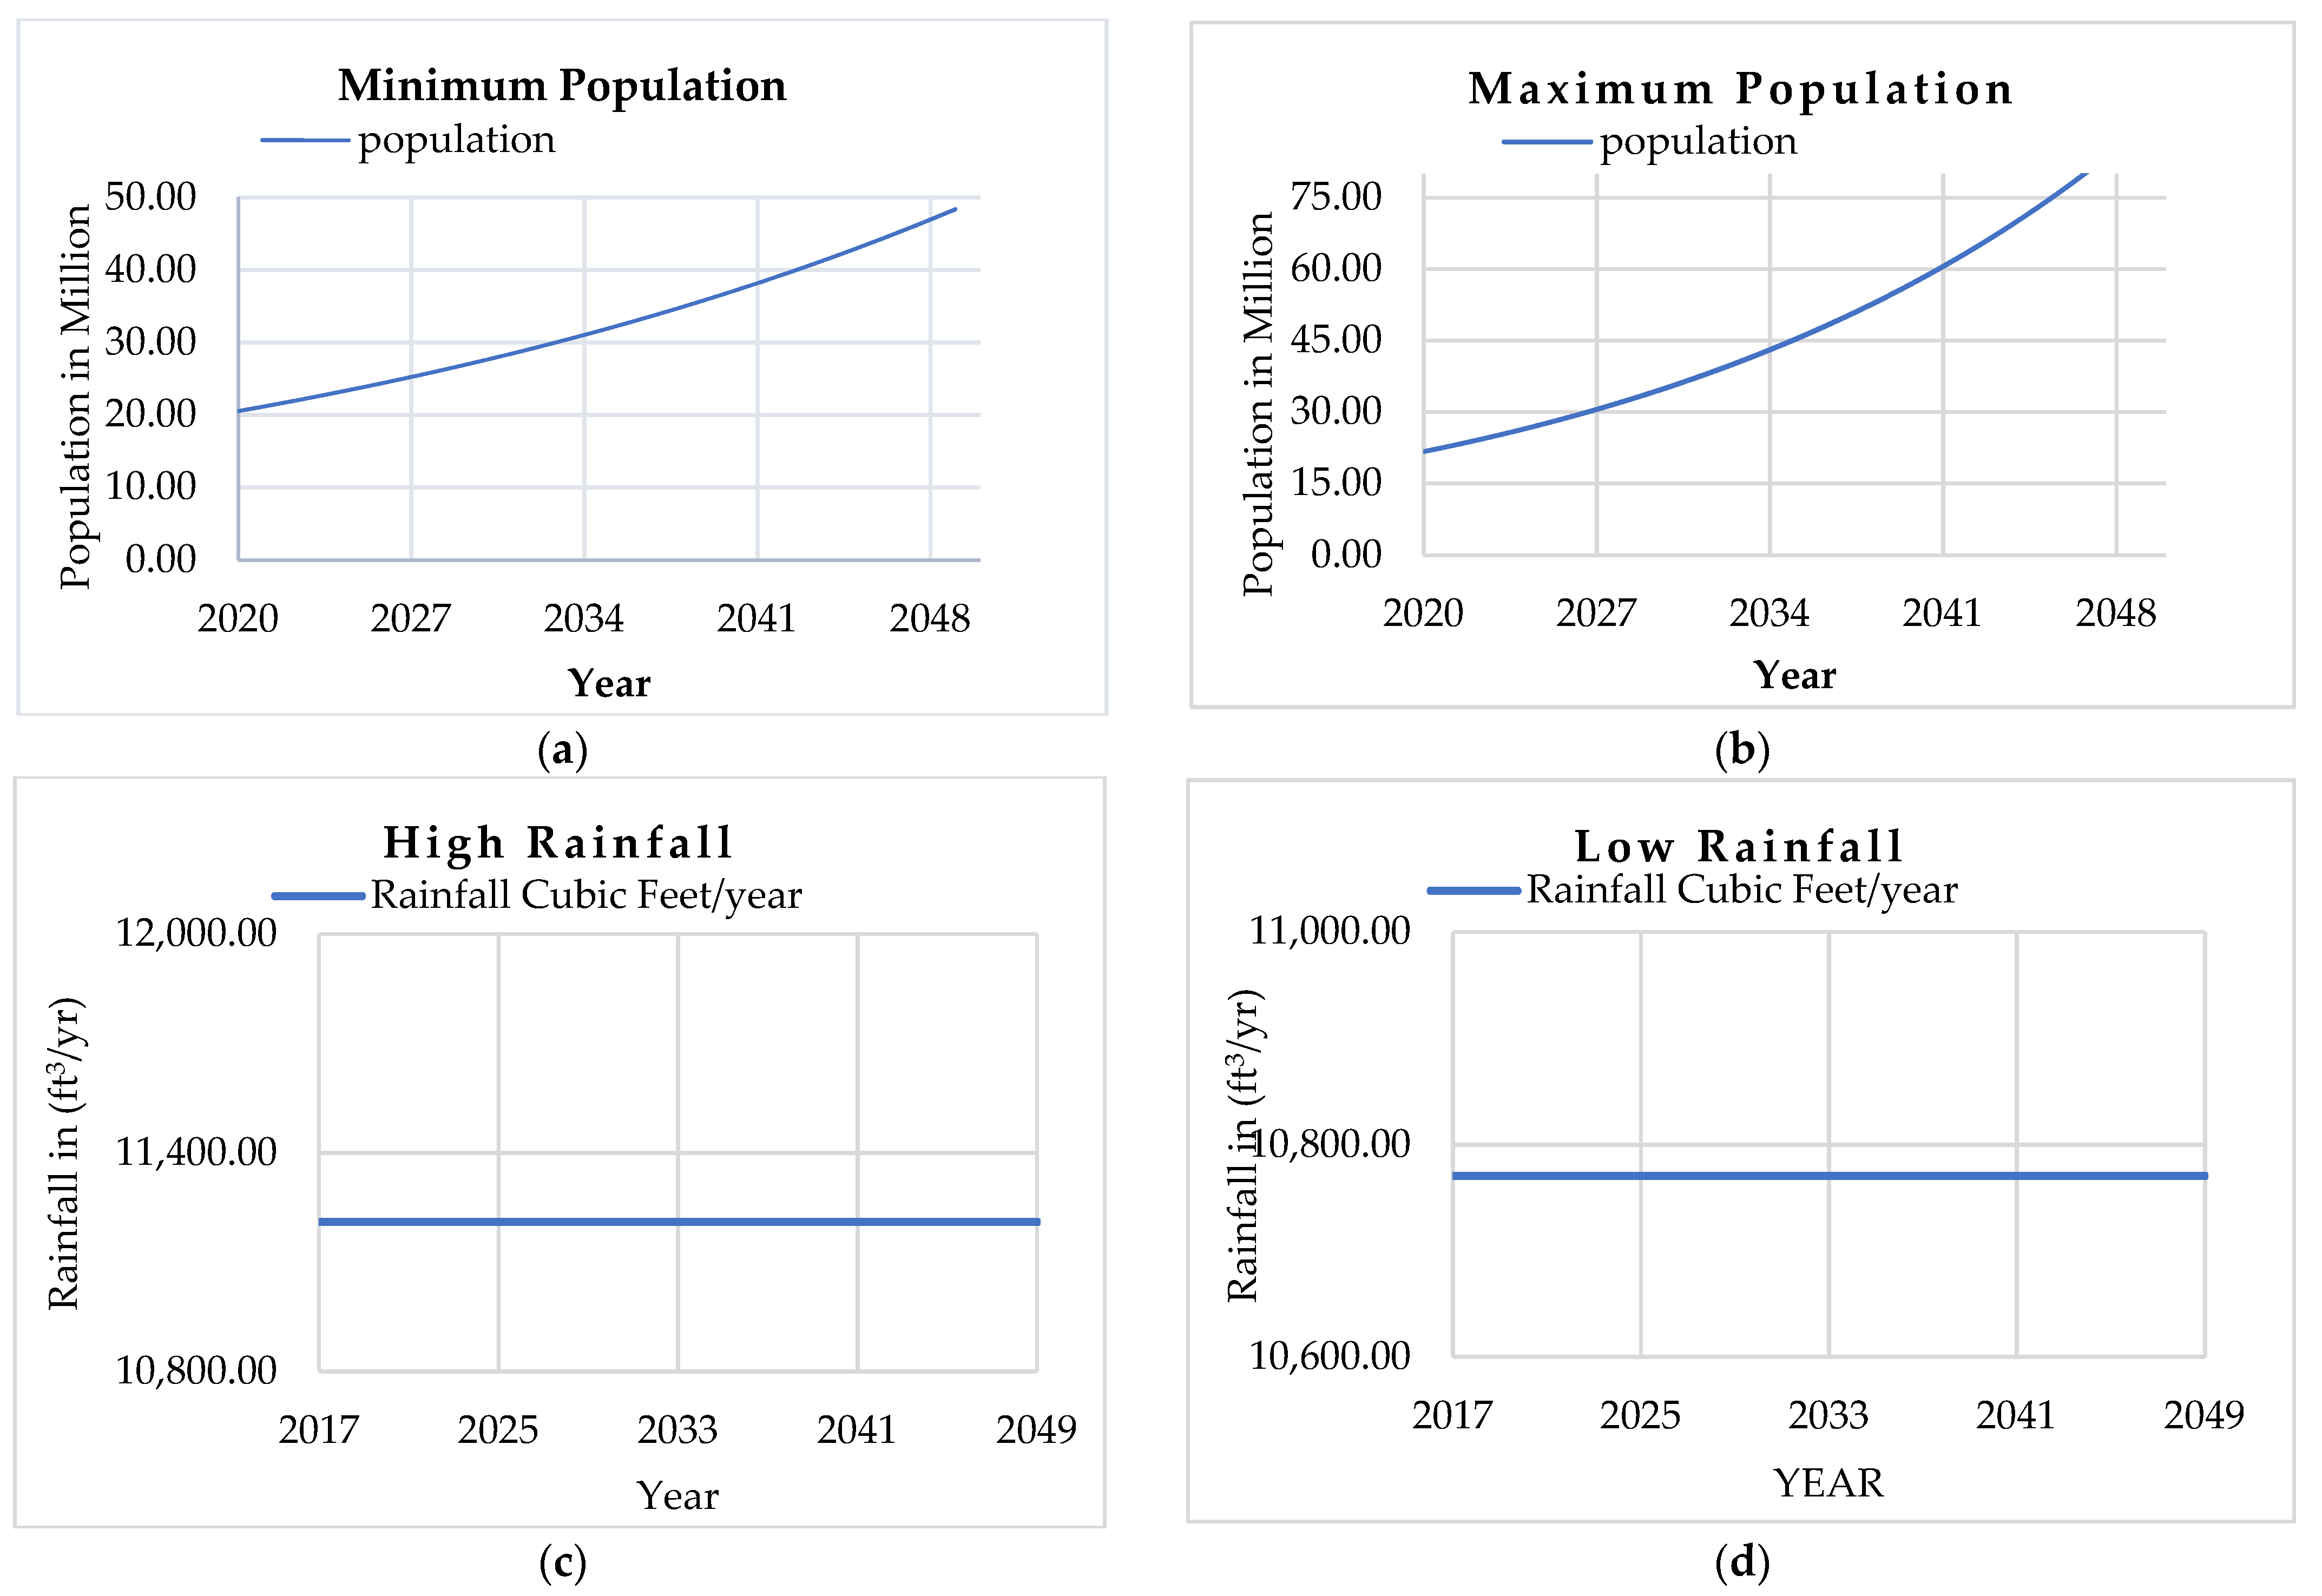
3.2. Scenarios Comparison

  • Maximum Population vs. Minimum Population
The results obtained from all the above-mentioned scenarios revealed that in the first scenario, the net growth rate for the baseline was 3.63%, which projected the population of the area around Keenjhar Lake to rise by 50 million by the year 2050. This population growth rate of the area gives a high growth rate and a large size of the current population. This shows a significant amount of water abstraction from Keenjhar Lake, which has a considerable effect on the overall water volume of the lake. This presents that the discharge of Keenjhar Lake is not effective for sustainable water flows in the long-term. In the second scenario, a maximum population growth rate of 5% is considered. The results are shown in Figure 10a, which shows an increase of the population by 80 million people by the year 2050. This increase in population has a considerable effect on the water withdrawal from the lake due to high water demand, which results in a decrease in the water volume of Keenjhar Lake. A minimum population net growth rate of 3% is taken for the third scenario. The result is shown in Figure 10b, which shows a population decrease of 40 million people in the overall population and resulting in less withdrawal of water from the lake.
  • High Rainfall vs. Low Rainfall
In the fourth scenario, the rainfall rate is increased by 20% more than the original value. This does not show any considerable change in the lake volume since the inflow and outflow remain the same. In the final fifth scenario for low rainfall, the percentage of rainfall was decreased by 20% from the original value. It was observed that the volume of the lake does not change; hence, the inflow and outflow values remain the same as well as the population. The result is shown in Figure 10c,d, which shows the scenarios with high and low rainfall.

4. Discussion

The integrated modeling method plays an important role in evaluating the water crisis. Knowing the economic and ecological effects are essential for monitoring and managing lakes [26,44,45]. An environmental model can help in understanding the crisis and can also help in choosing the best practices and solutions by establishing a sustainable level of water withdrawal. Based on the results of the modeling, the alternatives and more sustainable economic potential of the area can be proposed. Therefore, it is important to look at the historic trends and the natural water level of Keenjhar Lake and to produce a water balance model using the STELLA software. The tool derived from STELLA is suitable to model a massive system with a reasonable degree of accuracy. The model is an integration of disparate data, science, and decision-making.
A water balance represents an inventory of water for a specific body of water during a certain time period. The study of water balance is the application of the principle of conservation of mass, often referred to as the continuity equation in hydrology. This states that for any arbitrary volume and during any period of time, the difference between total input and output will be balanced by the change of water storage within the volume. Water balance estimation is one of the main subjects in hydrology and is a means of a solution to important theoretical and practical hydrological problems. Based on the water balance approach, it is possible to make a quantitative evaluation of water resources and their change under the influence of human activities. An understanding of the water balance is also extremely important for studies of the hydrological cycle. With water balance data, it is possible to compare individual sources of water in a system over different periods of time and to establish the degree of their effect on variations in the water regime.
Further, the initial analysis used to compute individual water balance components and the coordination of these components in the balance equation makes it possible to identify deficiencies in the distribution of observational stations and to discover systematic errors in measurements.
Since the commissioning of Keenjhar Lake, it has never been filled to its maximum conservation. Mainly due to reasons that in the early period of operation, the demand for water supply to Karachi and the planned canal irrigated area was low and that did not necessitate filling of the lake to its maximum conservation level every year. There was inadequate maintenance of the lake bunds, and the Irrigation Department Sindh could not take the risk of raising the lake level beyond R.L. 50.3, which was considered to be safe in relation to the existing weak condition of the lake bunds. The necessity of redesigning the lake bunds has now been unquestionably established by historical events. The Irrigation Department intends to raise and strengthen the bund of Keenjhar Lake to the top level of RL 65.0 and strengthen it with stone pitching.
As part of the flood is to be passed through the existing outlets, it is necessary that the gates of the outlet structures, including escapes, should be kept at a high level of maintenance, particularly during the flood season. Similarly, the channels should be in a condition to take discharge as per design discharge capacity. During the passage of a major flood event, the supply to Keenjhar Lake would be stopped immediately and it is assumed that the KB Feeder Link and KB Feeder Lower would be utilized to discharge floodwater up to their design capacities. This would involve the operation of the escape structure on KB Feeder Link.
During the modeling process, some relationships and factors, including the subsystems, are not computed, which include the impact of climate change on surface runoff of the lake, water price, and relations between socioeconomics and the water environment. The constructed model is limited because some of the data are difficult to collect, especially data on the lake inflow component from the hill torrents of adjoining areas into Keenjhar Lake. The groundwater inflow and outflow from the lake were difficult to obtain from the collected data and available information and treated as the residual of the net groundwater flux. Consequently, the related simulation results are difficult to verify. In addition, for the reason, of the different numerical standards for each department, the uncertainty of the system dynamic model was intensified.
Although spatial variability in land cover or land use features within the ungauged catchment of Keenjhar Lake will exert some impacts on the catchment inflow. The landuse changes such as agriculture, forestry practices, and soil properties can affect superficiality [7]. While a simple but reliable approach was used to estimate the ungauged hydrology of the lake’s catchment, surface parameters and field measurements hydrogeological were limited. In the present study, despite these uncertainties and limitations, the present method is sufficient for the first time to develop and recognize the hydrological processes of the complex Keenjhar Lake system. Based on our results, future management approaches for the lake system that deem surface water and groundwater as a joint resource will be considered necessary to include groundwater modeling as a component of the lake hydrodynamic models. In the future study of the sustainable use of water resources, numerous mathematical models may be combined with system dynamics models in order to utilize their individual strengths. Eventually, the trend estimates of water resource consumption are required to be made further accurate and reasonable.

5. Conclusions

This research study is based on the objective of developing a water balance model for Keenjhar Lake both monthly and annually. In addition, to evaluate the capacity of the lake to meet future water demands for the Karachi region. The following conclusions are derived from this study:
  • The bathymetry model of the lake was constructed along with elevation, area, and volume. The reservoir capacity of Keenjhar Lake at the conservation level of 57 ft. is 660,000 acre-feet, while the height of its embankment above the natural surface level at the dike location is about 35 ft;
  • The model was created with the water inflows such as discharge and rainfall, and the water outflow, such as water withdrawal for Karachi, outflow for Thatta, and evaporation. Obtained values of the water balance model of the lake were used for the simulation in STELLA;
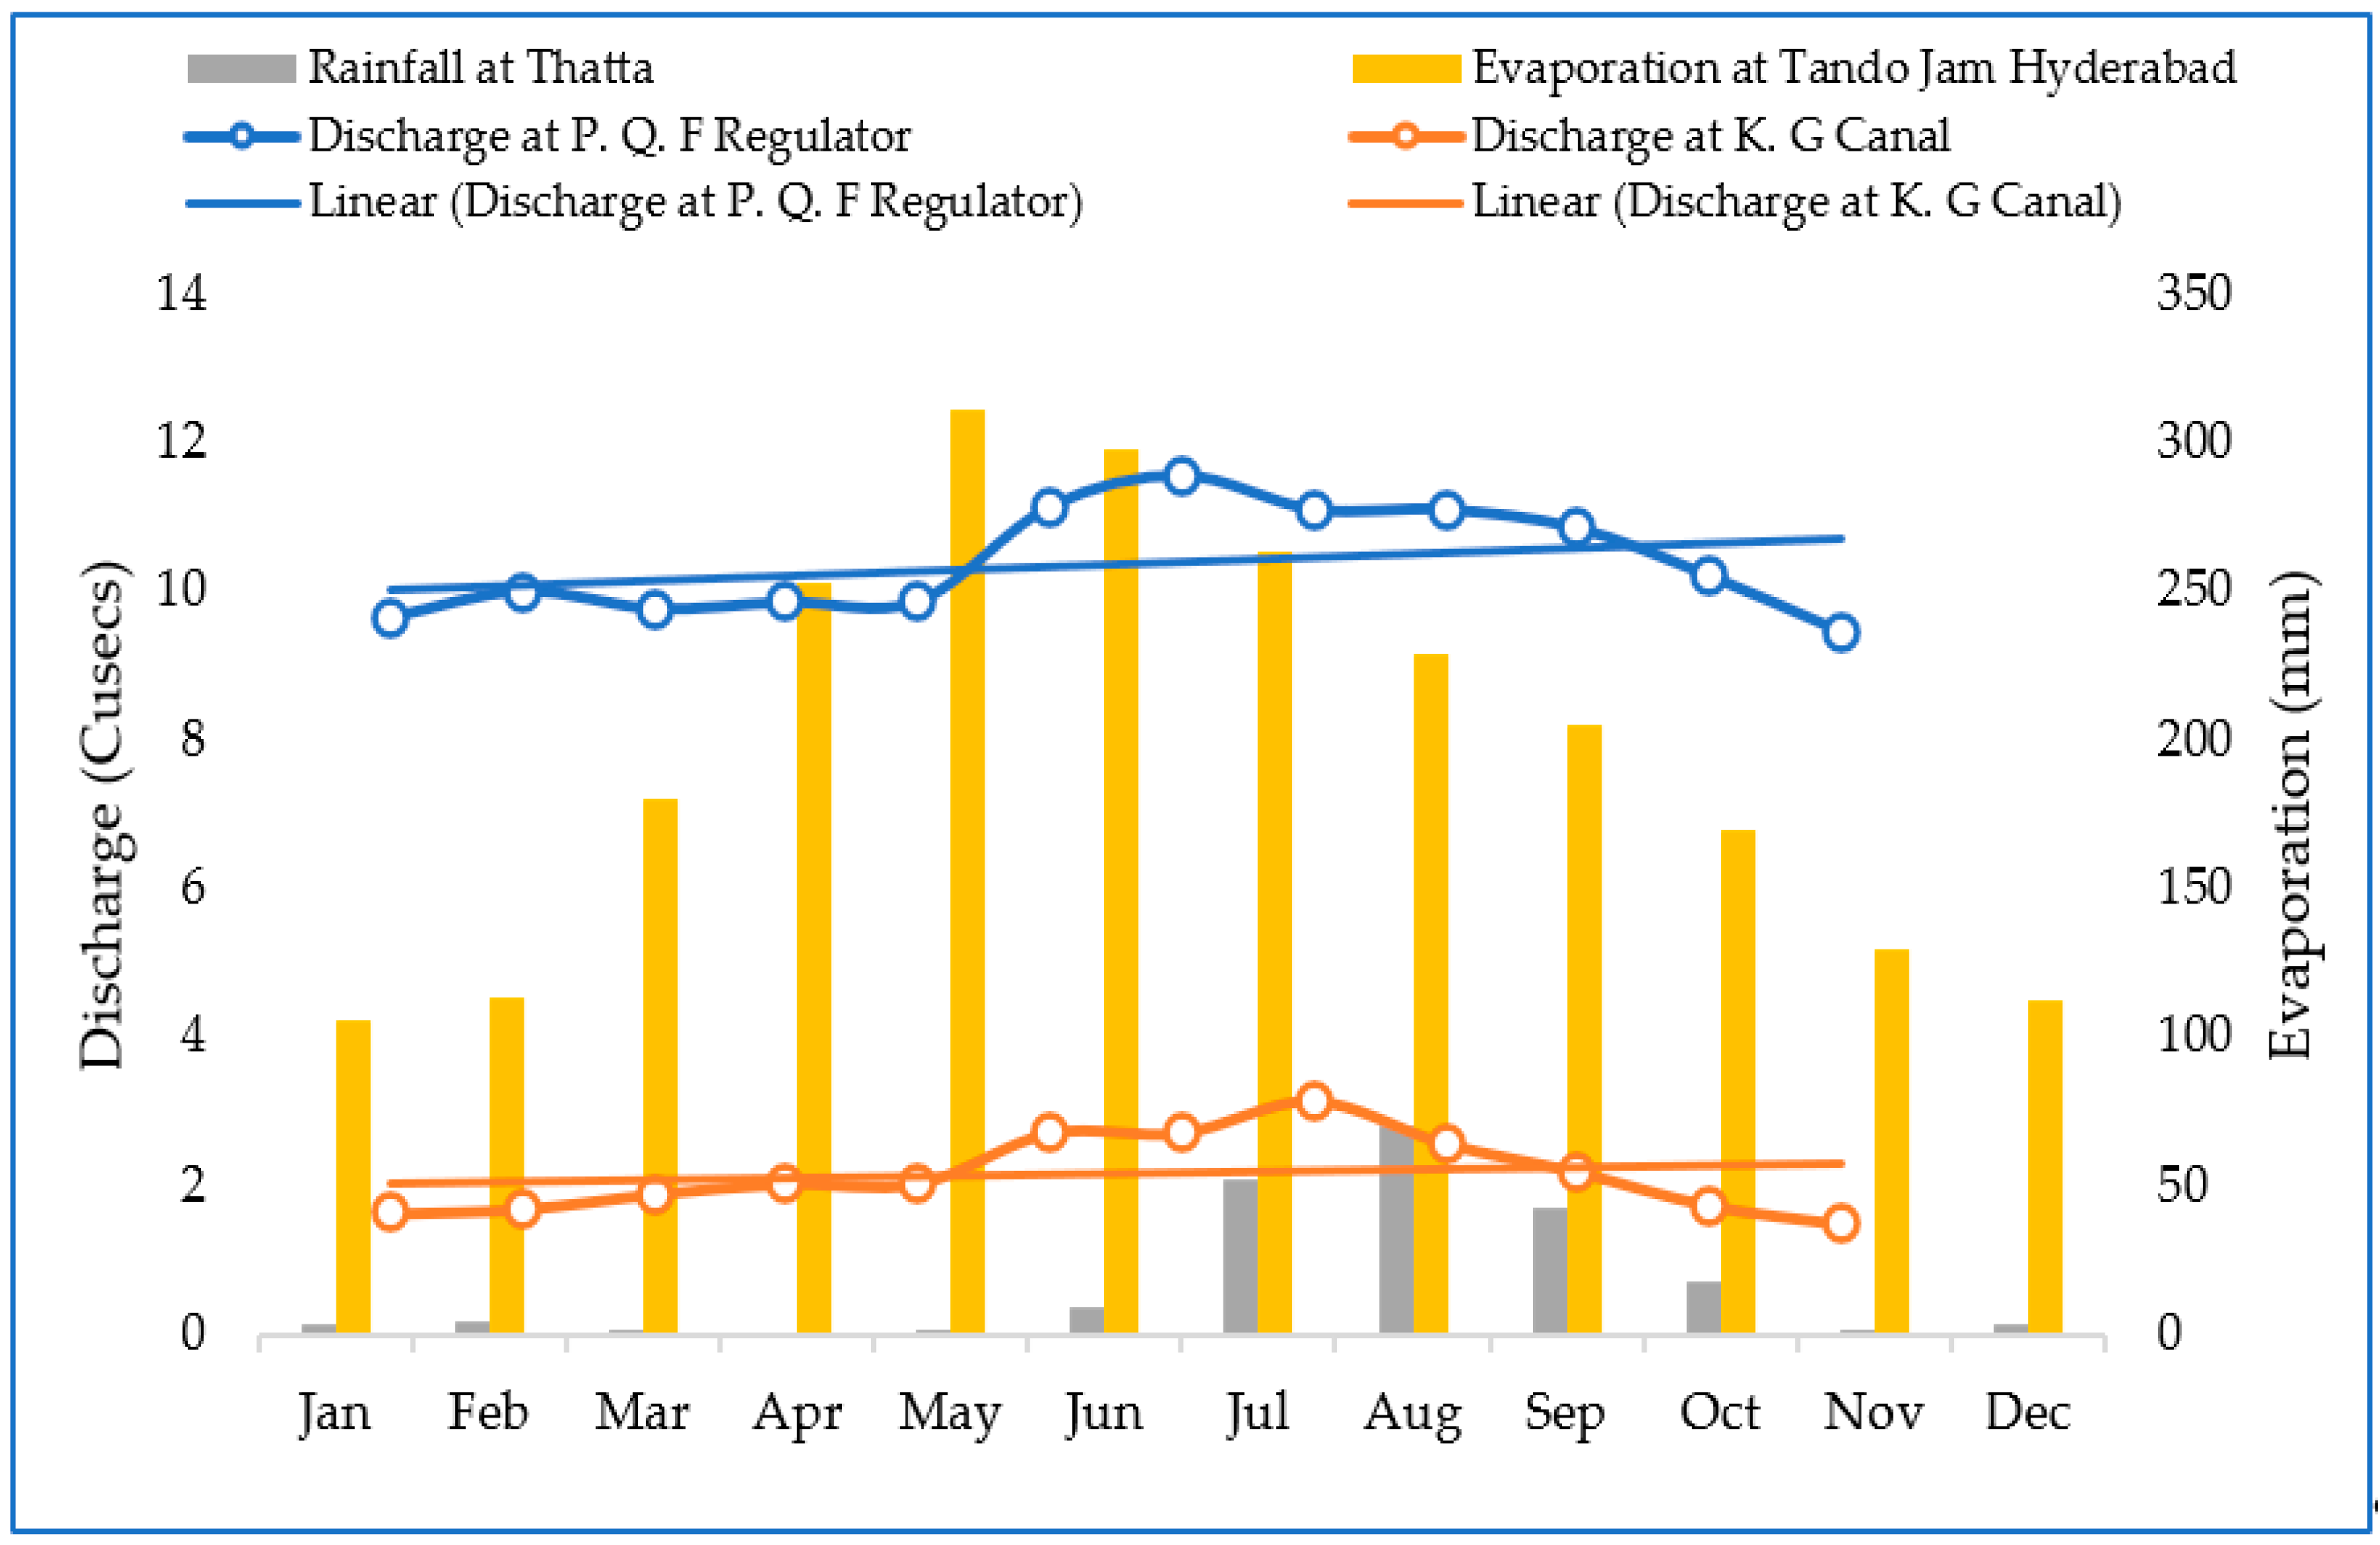
  • It is concluded that contributors to the inflow to the lake are K.B.F. Upper and rainfall. K.B.F. Upper was 77.91%; Rainfall was 22.03%;
  • Evaporation, outflow to K.B.F Lower and water abstraction to K.G. Canal constituted about 5.78%, 92.55%, and 1.57% of the outflow, respectively;
  • The annual fluctuations occurred due to the droughts and floods, but this does not demonstrate the reasons for the fluctuation. It might be due to the accumulation of sediments in the basin of the lake;
  • The model showed the combined influence of the main components of the water balance of the lake under different assumptions. The STELLA modeling moves toward the extensive simulation of changing water volume;
  • The conceptual model of the Keenjhar Lake showed overpopulation in the study area, which increases to 50 million by the year 2050. This will cause serious problems for the environment and water sustainability. The water volume of the lake is decreased further if water is overdrawn from the lake at the outlets. This would highly affect the future water demand for Karachi;
  • The solution to water management is to make policies for efficient usage of water, decentralize the system, and rainfall water harvesting. Since the Karachi region is mainly dependent on Keenjhar Lake for utilizing fresh water, the government needs to take the necessary steps and effective policies to manage the water balance of the lake in fulfilling freshwater demand.

Author Contributions

Conceptualization, S.S. and M.W.; methodology, S.S.; software, S.S. and M.M.W.; validation, S.S., M.W. and M.K.L.; formal analysis, S.S.; investigation, S.S. and M.W.; data curation, H.A.W., M.I. and K.R.; writing—original draft preparation, S.S.; writing—review and editing, M.W., M.M.W., K.R. and H.A.W.; visualization, S.S., M.W. and M.I.; supervision, M.K.L.; funding acquisition, M.K.L. All authors have read and agreed to the published version of the manuscript.

Funding

The APC is funded by Open Access Department University of Rostock, Germany.

Institutional Review Board Statement

Not applicable.

Informed Consent Statement

Not applicable.

Data Availability Statement

Not applicable.

Acknowledgments

The authors of study would like to thank US-Pakistan Center for Advanced Studies in Water (USPCASW), Mehran University of Engineering and Technology (MUET), Jamshoro for support and providing me the platform for conducting this research. Moreover, we would like to thank the University of Utah, for their technical support.

Conflicts of Interest

The authors declare no conflict of interest.

References

  1. Zhang, D.; Sial, M.; Ahmad, N.; Filipe, J.A.; Thu, P.; Zia-Ud-Din, M.; Caleiro, A. Water Scarcity and Sustainability in an Emerging Economy: A Management Perspective for Future. Sustainability 2020, 13, 144. [Google Scholar] [CrossRef]
  2. Payus, C.; Huey, L.A.; Adnan, F.; Rimba, A.B.; Mohan, G.; Chapagain, S.K.; Roder, G.; Gasparatos, A.; Fukushi, K. Impact of Extreme Drought Climate on Water Security in North Borneo: Case Study of Sabah. Water 2020, 12, 1135. [Google Scholar] [CrossRef]
  3. Gosling, S.N.; Arnell, N.W. A global assessment of the impact of climate change on water scarcity. Clim. Chang. 2016, 134, 371–385. [Google Scholar] [CrossRef] [Green Version]
  4. Hristov, J.; Barreiro-Hurle, J.; Salputra, G.; Blanco, M.; Witzke, P. Reuse of treated water in European agriculture: Potential to address water scarcity under climate change. Agric. Water Manag. 2021, 251, 106872. [Google Scholar] [CrossRef]
  5. Basson, M.; Van Rooyen, J. Practical application of probabilistic approaches to the management of water resource systems. J. Hydrol. 2001, 241, 53–61. [Google Scholar] [CrossRef]
  6. Liu, K.K.; Li, C.H.; Cai, Y.P.; Xu, M.; Xia, X.H. Comprehensive evaluation of water resources security in the Yellow River basin based on a fuzzy multi-attribute decision analysis approach. Hydrol. Earth Syst. Sci. 2014, 18, 1605–1623. [Google Scholar] [CrossRef] [Green Version]
  7. Tian, Y.; Li, C.; Yi, Y.; Wang, X.; Shu, A. Dynamic Model of a Sustainable Water Resources Utilization System with Coupled Water Quality and Quantity in Tianjin City. Sustainability 2020, 12, 4254. [Google Scholar] [CrossRef]
  8. Noman, A.; Saleemullah, K.; Water, E. Public Private Partnerships and the Poor—Case Report 2: Bulk Water Consumers of the Karachi Water and Sewerage Board, p. 35. January 2003. Available online: /articles/book/Public_private_partnerships_and_the_poor_-_case_report_2_bulk_water_consumers_of_the_Karachi_water_and_sewerage_board/9457253/1 (accessed on 16 February 2022).
  9. Lashari, K.H.; Korai, A.L.; Sahato, G.A.; Kazi, T.G. Limnological Studies of Keenjhar Lake, District, Thatta, Sindh, Pakistan. J. Anal. Environ. Chem. 2009, 10, 39–47. Available online: https://www.researchgate.net/publication/264887734 (accessed on 16 February 2022).
  10. Pakistan Emergency Situational Analysis (PESA), District Thatta. September 2014. Available online: https://reliefweb.int/report/pakistan/pakistan-emergency-situational-analysis-district-thatta-september-2014 (accessed on 16 February 2022).
  11. Keenjhar Lake Resort Project Report Development of a Tourist Resort under Public Private Partnership at Keenjhar Lake, Thatta. Available online: https://www.yumpu.com/en/document/view/29872886/keenjhar-lake-resort-project-sindh-board-of-investment (accessed on 16 February 2022).
  12. Dars, B.A.; Narejo, N.T.; Dayo, A. Relative condition factor and length-weight relationship of a carp, labeo gonius (HAMILTON) from keenjhar lake, district Thatta, Sindh, Pakistan. Sindh Univ. Res. J. 2010, 42. Available online: https://sujo-old.usindh.edu.pk/index.php/SURJ/article/view/1289 (accessed on 16 February 2022).
  13. Kebede, S.; Travi, Y.; Alemayehu, T.; Marc, V. Water balance of Lake Tana and its sensitivity to fluctuations in rainfall, Blue Nile basin, Ethiopia. J. Hydrol. 2006, 316, 233–247. [Google Scholar] [CrossRef]
  14. Gibson, J.J.; Prowse, T.D.; Peters, D.L. Hydro climatic controls on water balance and water level variability in Great Slave Lake. Hydrol. Process. 2006, 20, 4155–4172. [Google Scholar] [CrossRef]
  15. Bublaku, S.; Beqiraj, A. Assessment of water balance for Badovc Lake, Kosovo. WIT Trans. Ecol. Environ. 2015, 196, 53–63. [Google Scholar]
  16. Hecky, R.; Mngodo, R.; Sangale, F.; Sewagudde, S.; Mwanuzi, F.; Okongu, J. Water Balanceof Lake Tana with fluctuations in rainfall for Blue Nile catchment. Ethiop. J. Hydrol. 2005, 316, 200–205. [Google Scholar]
  17. Khoso, S.; Wagan, H.; Tunio, H.; Ansari, A. An overview on emerging water scarcity in Pakistan, its causes, impacts and remedial measures. J. Appl. Eng. Sci. 2015, 13, 35–44. [Google Scholar] [CrossRef]
  18. Popovska, C.V. Water Balance Model for Vulnerability Assessment of Water Resources in Strumica River Basin. Irrig. Drain. Syst. Eng. 2014, 3, 127. [Google Scholar] [CrossRef] [Green Version]
  19. Balali, H.; Viaggi, D. Applying a System Dynamics Approach for Modeling Groundwater Dynamics to Depletion under Different Economical and Climate Change Scenarios. Water 2015, 7, 5258–5271. [Google Scholar] [CrossRef] [Green Version]
  20. Waseem, M.; Kachholz, F.; Klehr, W.; Tränckner, J. Suitability of a Coupled Hydrologic and Hydraulic Model to Simulate Surface Water and Groundwater Hydrology in a Typical North-Eastern Germany Lowland Catchment. Appl. Sci. 2020, 10, 1281. [Google Scholar] [CrossRef] [Green Version]
  21. Ouyang, Y.; Feng, G.; Renninger, H.; Leininger, T.D.; Parajuli, P.; Grace, J.M. A STELLA-Based Model to Simultaneously Predict Hydrological Processes, N Uptake and Biomass Production in a Eucalyptus Plantation. Forests 2021, 12, 515. [Google Scholar] [CrossRef]
  22. Mayes, M.; Caylor, K.K.; Singer, M.B.; Stella, J.C.; Roberts, D.; Nagler, P. Climate sensitivity of water use by riparian woodlands at landscape scales. Hydrol. Process. 2020, 34, 4884–4903. [Google Scholar] [CrossRef]
  23. Elshorbagy, A.; Jutla, A.; Kells, J. Simulation of the hydrological processes on reconstructed watersheds using system dynamics. Hydrol. Sci. J. 2007, 52, 538–562. [Google Scholar] [CrossRef]
  24. Ouyang, Y.; Paz, J.O.; Feng, G.; Read, J.J.; Adeli, A.; Jenkins, J.N. A Model to Estimate Hydrological Processes and Water Budget in an Irrigation Farm Pond. Water Resour. Manag. 2017, 31, 2225–2241. [Google Scholar] [CrossRef]
  25. Ouyang, Y.; Xu, D.; Leininger, T.D.; Zhang, N. A system dynamic model to estimate hydrological processes and water use in a eucalypt plantation. Ecol. Eng. 2016, 86, 290–299. [Google Scholar] [CrossRef]
  26. Ahmad, S.; Prashar, D. Evaluating Municipal Water Conservation Policies Using a Dynamic Simulation Model. Water Resour. Manag. 2010, 24, 3371–3395. [Google Scholar] [CrossRef]
  27. The Scramble for Karachi’s Scarce Water Resources. Available online: ///G:/water%20balance/water%20balance/Herald%20Exclusive_%20Tapping%20into%20trouble%20-%20Pakistan%20-%20DAWN.COM.html (accessed on 15 December 2019).
  28. Sindh Resilience Project (SRP) Executive Summary Environmental and Social Impact Assessment. Sindh Irrigation and Power Department. Available online: https://www.afdb.org/en/documents/category/executive-summary-environmental-and-social-impact-assessments?page=3 (accessed on 14 December 2019).
  29. UN World Urbanization Prospects. Available online: http://worldpopulationreview.com/world-cities/karachi-population/ (accessed on 15 December 2019).
  30. Phul, A.M.; Lashari, B.K.; Laghari, Q. Remodeling of Kalri Baghar Feeder. Mehran Univ. Res. J. Eng. Technol. 2010, 29, 689–696. [Google Scholar]
  31. Nergis, Y.; Yahya, S.M.; Ur Rahman, A.; Siddiqui, S.A. Appraisal of Water Quality of Keenjhar Lake by using Statistical Techniques and Water Quality Index. Asian J. Biochem. Pharm. Res. 2013, 3, 4. [Google Scholar]
  32. FAO; WHO; Codex Alimentarius Commision. Procedural Manual, 24th ed.; Organizing Nonprint Materials: Rome, Italy, 2015; pp. 65–79. Available online: https://www.fao.org/3/i4354e/i4354e.pdf (accessed on 16 February 2022).
  33. Milne, J.A.; Sear, D.A. Modelling river channel topography using GIS. Int. J. Geogr. Inf. Sci. 1997, 11, 499–519. [Google Scholar] [CrossRef]
  34. Costanza, R.; Voinov, A.; Bourmans, R.; Maxwell, T.; Villa, F.; Voinov, H.; Wainger, L. Integrated ecological economic modeling of the patuxent river watershed, Maryland. Ecol. Monographs 2002, 72, 203–231. [Google Scholar]
  35. Wynn, T.M.; Liehr, S.K. Development of a constructed subsurface-flow wetland simulation model. Ecol. Eng. 2001, 16, 519–536. [Google Scholar] [CrossRef]
  36. Mayo, A.; Bigambo, T. Nitrogen transformation in horizontal subsurface flow constructed wetlands I: Model development. Phys. Chem. Earth Parts A B C 2005, 30, 658–667. [Google Scholar] [CrossRef]
  37. Taffe, W.J. Simulation and modelling with Stella: A general education course. ACM SIGCSE Bull. 1991, 23, 87–91. [Google Scholar] [CrossRef]
  38. Richmond, B.; Peterson, S. An introduction to Systems Thinking. Lebanon, NH: High Performance Systems., Incorporated. Available online: https://www.colorado.edu/center/mortenson/sites/default/files/attached-files/stella_ist_0.pdf (accessed on 16 February 2022).
  39. Arslan, M.; Arjumand, Z.Z.; Saad, M. Identification of Suitable Sites for Plantation of Biofuel Source Jatropha C. using Geospatial Techniques. J. Space Technol. 2015, 5, 55–62. [Google Scholar]
  40. Bublaku, S.; Beqiraj, A. Water Balance and Water Loss Implications in Badovc Lake, Kosovo. J. Geogr. Earth Sci. 2015, 3, 87–97. [Google Scholar] [CrossRef] [Green Version]
  41. Yanbing, W.; Lixin, W.U.; Wenzhong, S.; Xiaomeng, L. On 3D GIS spatial modeling. In Proceedings of the ISPRS Workshop on Updating Geo-Spatial Databases with Imagery & the 5th ISPRS Workshop on DMGISs on 3D GIS Spatial Modeling, Urumqi, China, 28–29 August 2007. [Google Scholar]
  42. Yang, J.; Townsend, R.D.; Daneshfar, B. Applying the HEC-RAS model and GIS techniques in river network floodplain delineation. Can. J. Civ. Eng. 2006, 33, 19–28. [Google Scholar] [CrossRef]
  43. Engineering Design and Monitoring & Evaluation Consultancy Services for ‘Assuring Water Supply to Karachi Upgrading Keenjhar Lake System Inception Report’. National Engineering Service Pakistan (NESPAK) 2014. Available online: http://www.nespak.com.pk/pdf/MD-Report-2014.pdf (accessed on 16 February 2022).
  44. Stokes, S. Water Quality Dynamics of Lake James in the Catawba River Basin of North Carolina. Ph.D. Thesis, Clemson University, Clemson, SC, USA, 2007. [Google Scholar]
  45. Adero, N.J.; Kiema, J.B.K. Flow-based structural modelling and dynamic simulation of lake water levels. In Handbook of Research on Hydroinformatics: Technologies, Theories and Applications; IGI Global: Hershey, PA, USA, 2011; pp. 316–331. [Google Scholar]
Figure 1. Description of study area.
Hydrology 09 00090 g001
Figure 2. Methodological framework adopted in current study.
Hydrology 09 00090 g002
Figure 3. Summary of collected hydrological and climate data in the study area.
Hydrology 09 00090 g003
Figure 4. Land cover map of Keenjhar Lake.
Hydrology 09 00090 g004
Figure 5. Soil map of the Thatta district [39].
Hydrology 09 00090 g005
Figure 6. Conceptual model of the Keenjhar Lake by Stella software.
Hydrology 09 00090 g006
Figure 7. Area, volume, and elevation curve of Keenjhar Lake.
Hydrology 09 00090 g007
Figure 8. Annual water balance of Keenjhar Lake.
Hydrology 09 00090 g008
Figure 9. Simulated water volume changes in Keenjhar Lake with scenario (a) base line; (b) maximum population growth; (c) minimum population growth; (d) high rainfall; (e) low rainfall.
Hydrology 09 00090 g009aHydrology 09 00090 g009b
Figure 10. Simulated scenarios comparison (a) maximum population growth; (b) minimum population growth; (c) high rainfall; (d) low rainfall.
Hydrology 09 00090 g010
Table 1. (a) Long term mean monthly flow of Keenjhar Lake; (b) long term mean monthly evaporation and evapotranspiration of Keenjhar Lake.
(a)
SchemeMean Monthly Flow (Cusecs)
JanFebMarAprMayJunJulAugSepOctNovDecAnnual
K.G Canal1.631.691.892.032.032.712.713.142.572.191.741.4926.4
K.B.Feeder (lower)9.65109.769.859.8611.1411.5611.111.110.8510.219.46125.99
Total11.2811.6911.6511.8811.8913.8514.2714.2413.6713.0411.9510.95152.39
(b)
Mean Monthly Evaporation and Evapotranspiration
JanFebMarAprMayJunJulAugSepOctNovDecAnnual
Evaporation105.15112.89179.97252.35310.67297.58263.7228.61204.59170.04129.49111.812366.9
ET68.5475.64122.31166.91221.72197.38170.98152.13142.51121.6987.9168.341596.12
Table 2. Summary of the data used in this study and the sources from where the data is obtained.
Type of DataSourcesResolution/Method
Climate data (min. and max. temperature, humidity, wind Speed, Solar radiation, Sunshine hours, precipitation, evaporation)Pakistan Materological DepartmentAverage daily
Evapotranspiration-Penmaan Montieth Mthod
Soil dataLiterature-
Land use/land coverGLOVISImage classification with Arc-GIS
Lake water levelsSindh Irrigation departmentAverage daily
Lake inflow dataSindh Irrigation departmentAverage daily
Lake abstraction ratesSindh Irrigation departmentAverage daily
Lake outflow dataSindh Irrigation departmentAverage daily
PopulationPakistan Statistical census-
Domestic water supplyMuncipality office/Literature-
Hydraulic dataSindh Irrigation department-
Bathymetric dataNESPAK-
TopographyNESPAK-
Table 3. Mean monthly water balance of Keenjhar Lake (2000–2016).
MonthLake Level (m)Inflow (mm/month)Outflow (mm/month)Change in Lake Volume (mm/month)
Jan15.169.288.480.8
Feb15.39.618.571.04
Mar15.226.4410.35−3.91
Apr14.845.6811.84−6.16
May14.785.7813.64−7.86
Jun14.3912.4313.97−1.54
Jul13.9955.513.3642.14
Aug14.1474.0112.4461.57
Sep14.946.6812.0734.61
Oct15.2123.9611.0912.87
Nov15.787.519.23−1.72
Dec15.7710.148.211.93
Annual14.95936.79892.2844.51
Publisher’s Note: MDPI stays neutral with regard to jurisdictional claims in published maps and institutional affiliations.

