
The Boundary between Two Modes of Gas Evolution: Oscillatory (H2 and O2) and Conventional Redox (O2 Only), in the Hydrocarbon/H2O2/Cu(II)/CH3CN System

Abstract
:1. Introduction
2. Materials and Methods
3. Results and Discussion
3.1. Preliminary Experiments and Evolution of Molecular Hydrogen
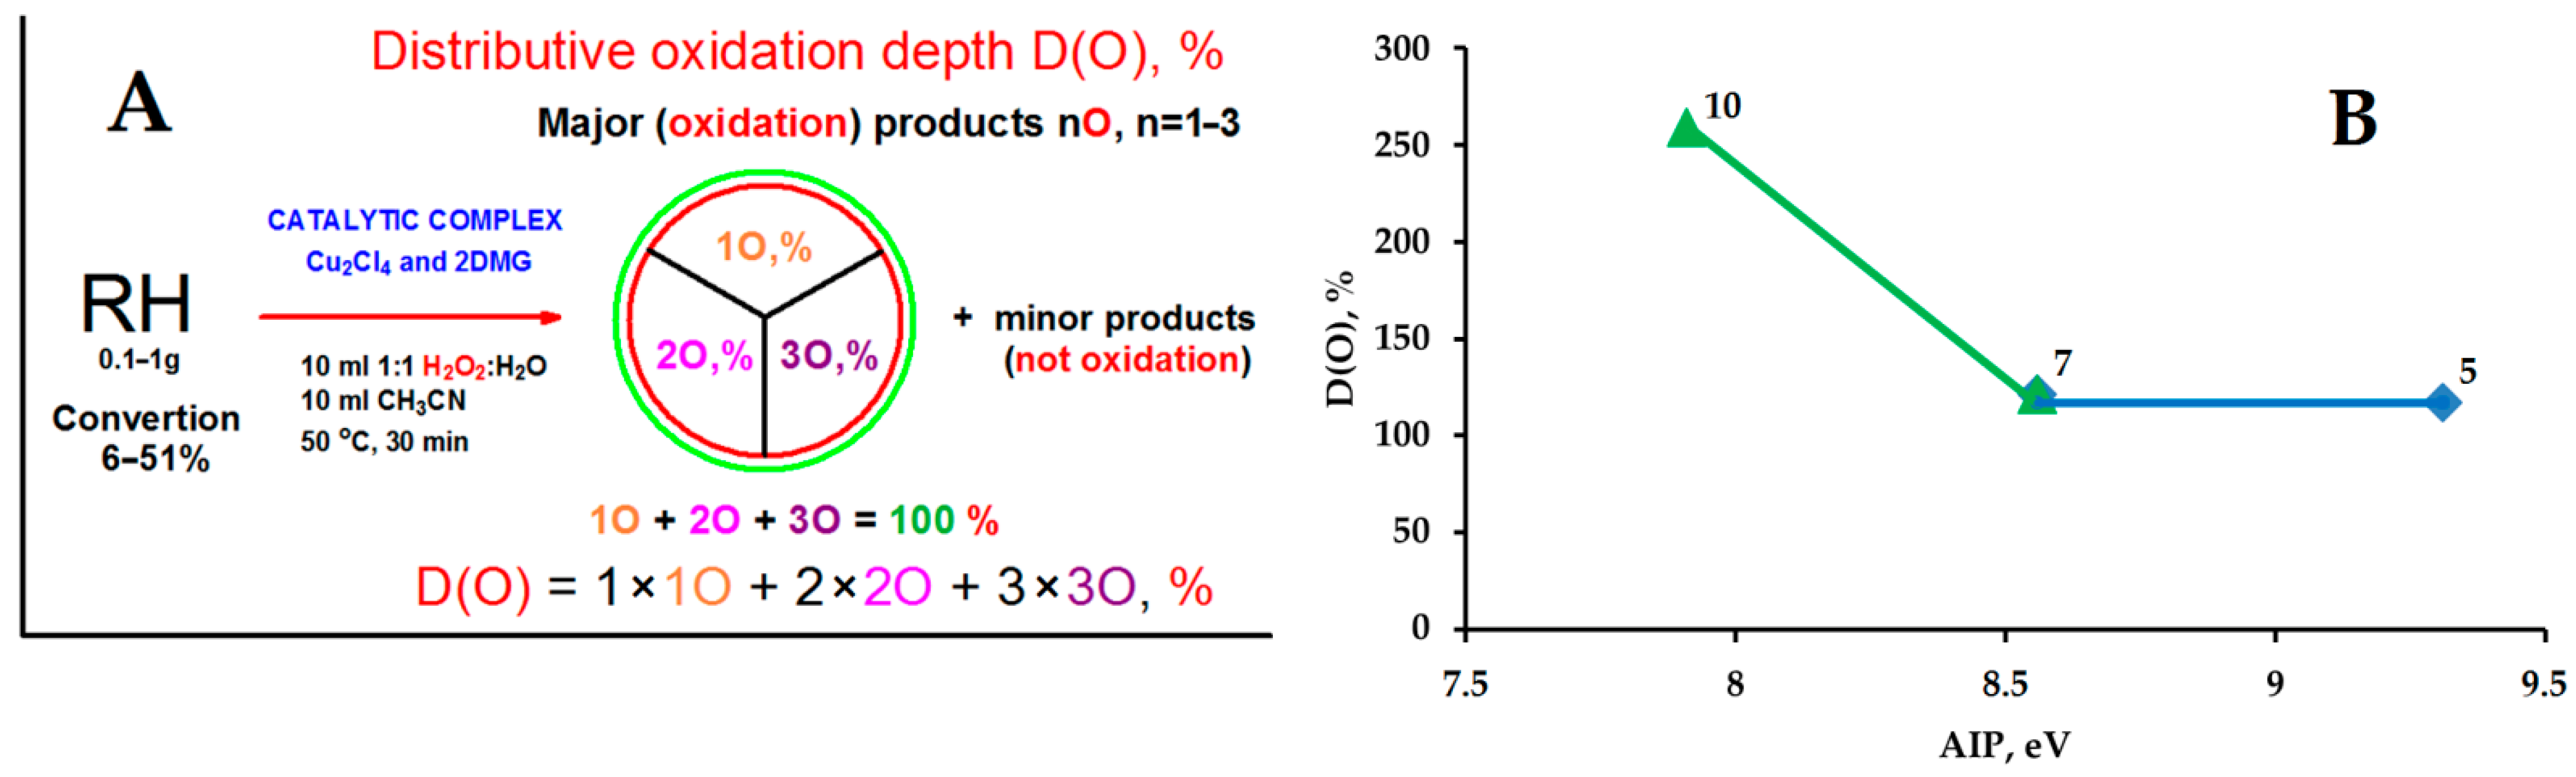
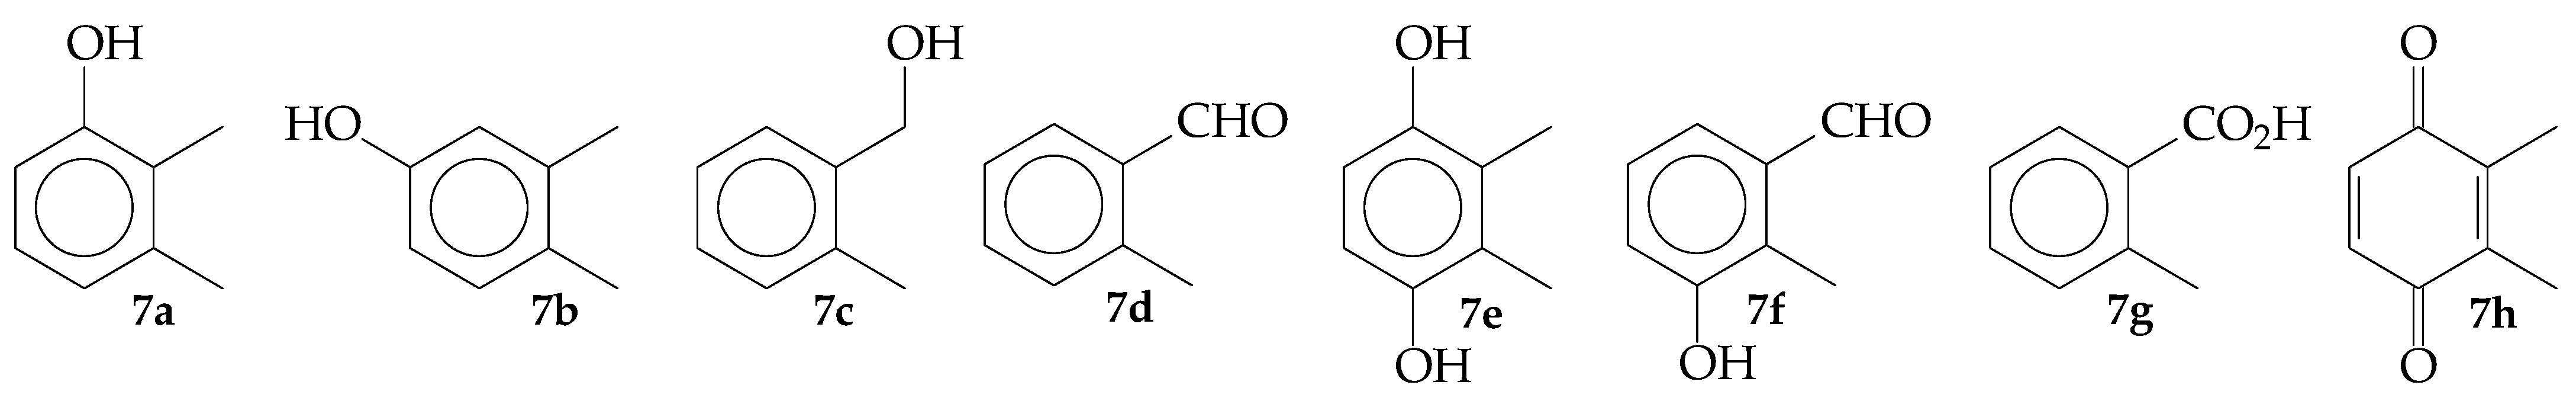
3.2. Experiments in the Presence of Hydrocarbons and the Evolution of Molecular Oxygen
3.3. Some Additional Experiments and the Oscillatory Mode of Gas Evolution

3.4. Catalytic Forms of Copper and Identification of Component X
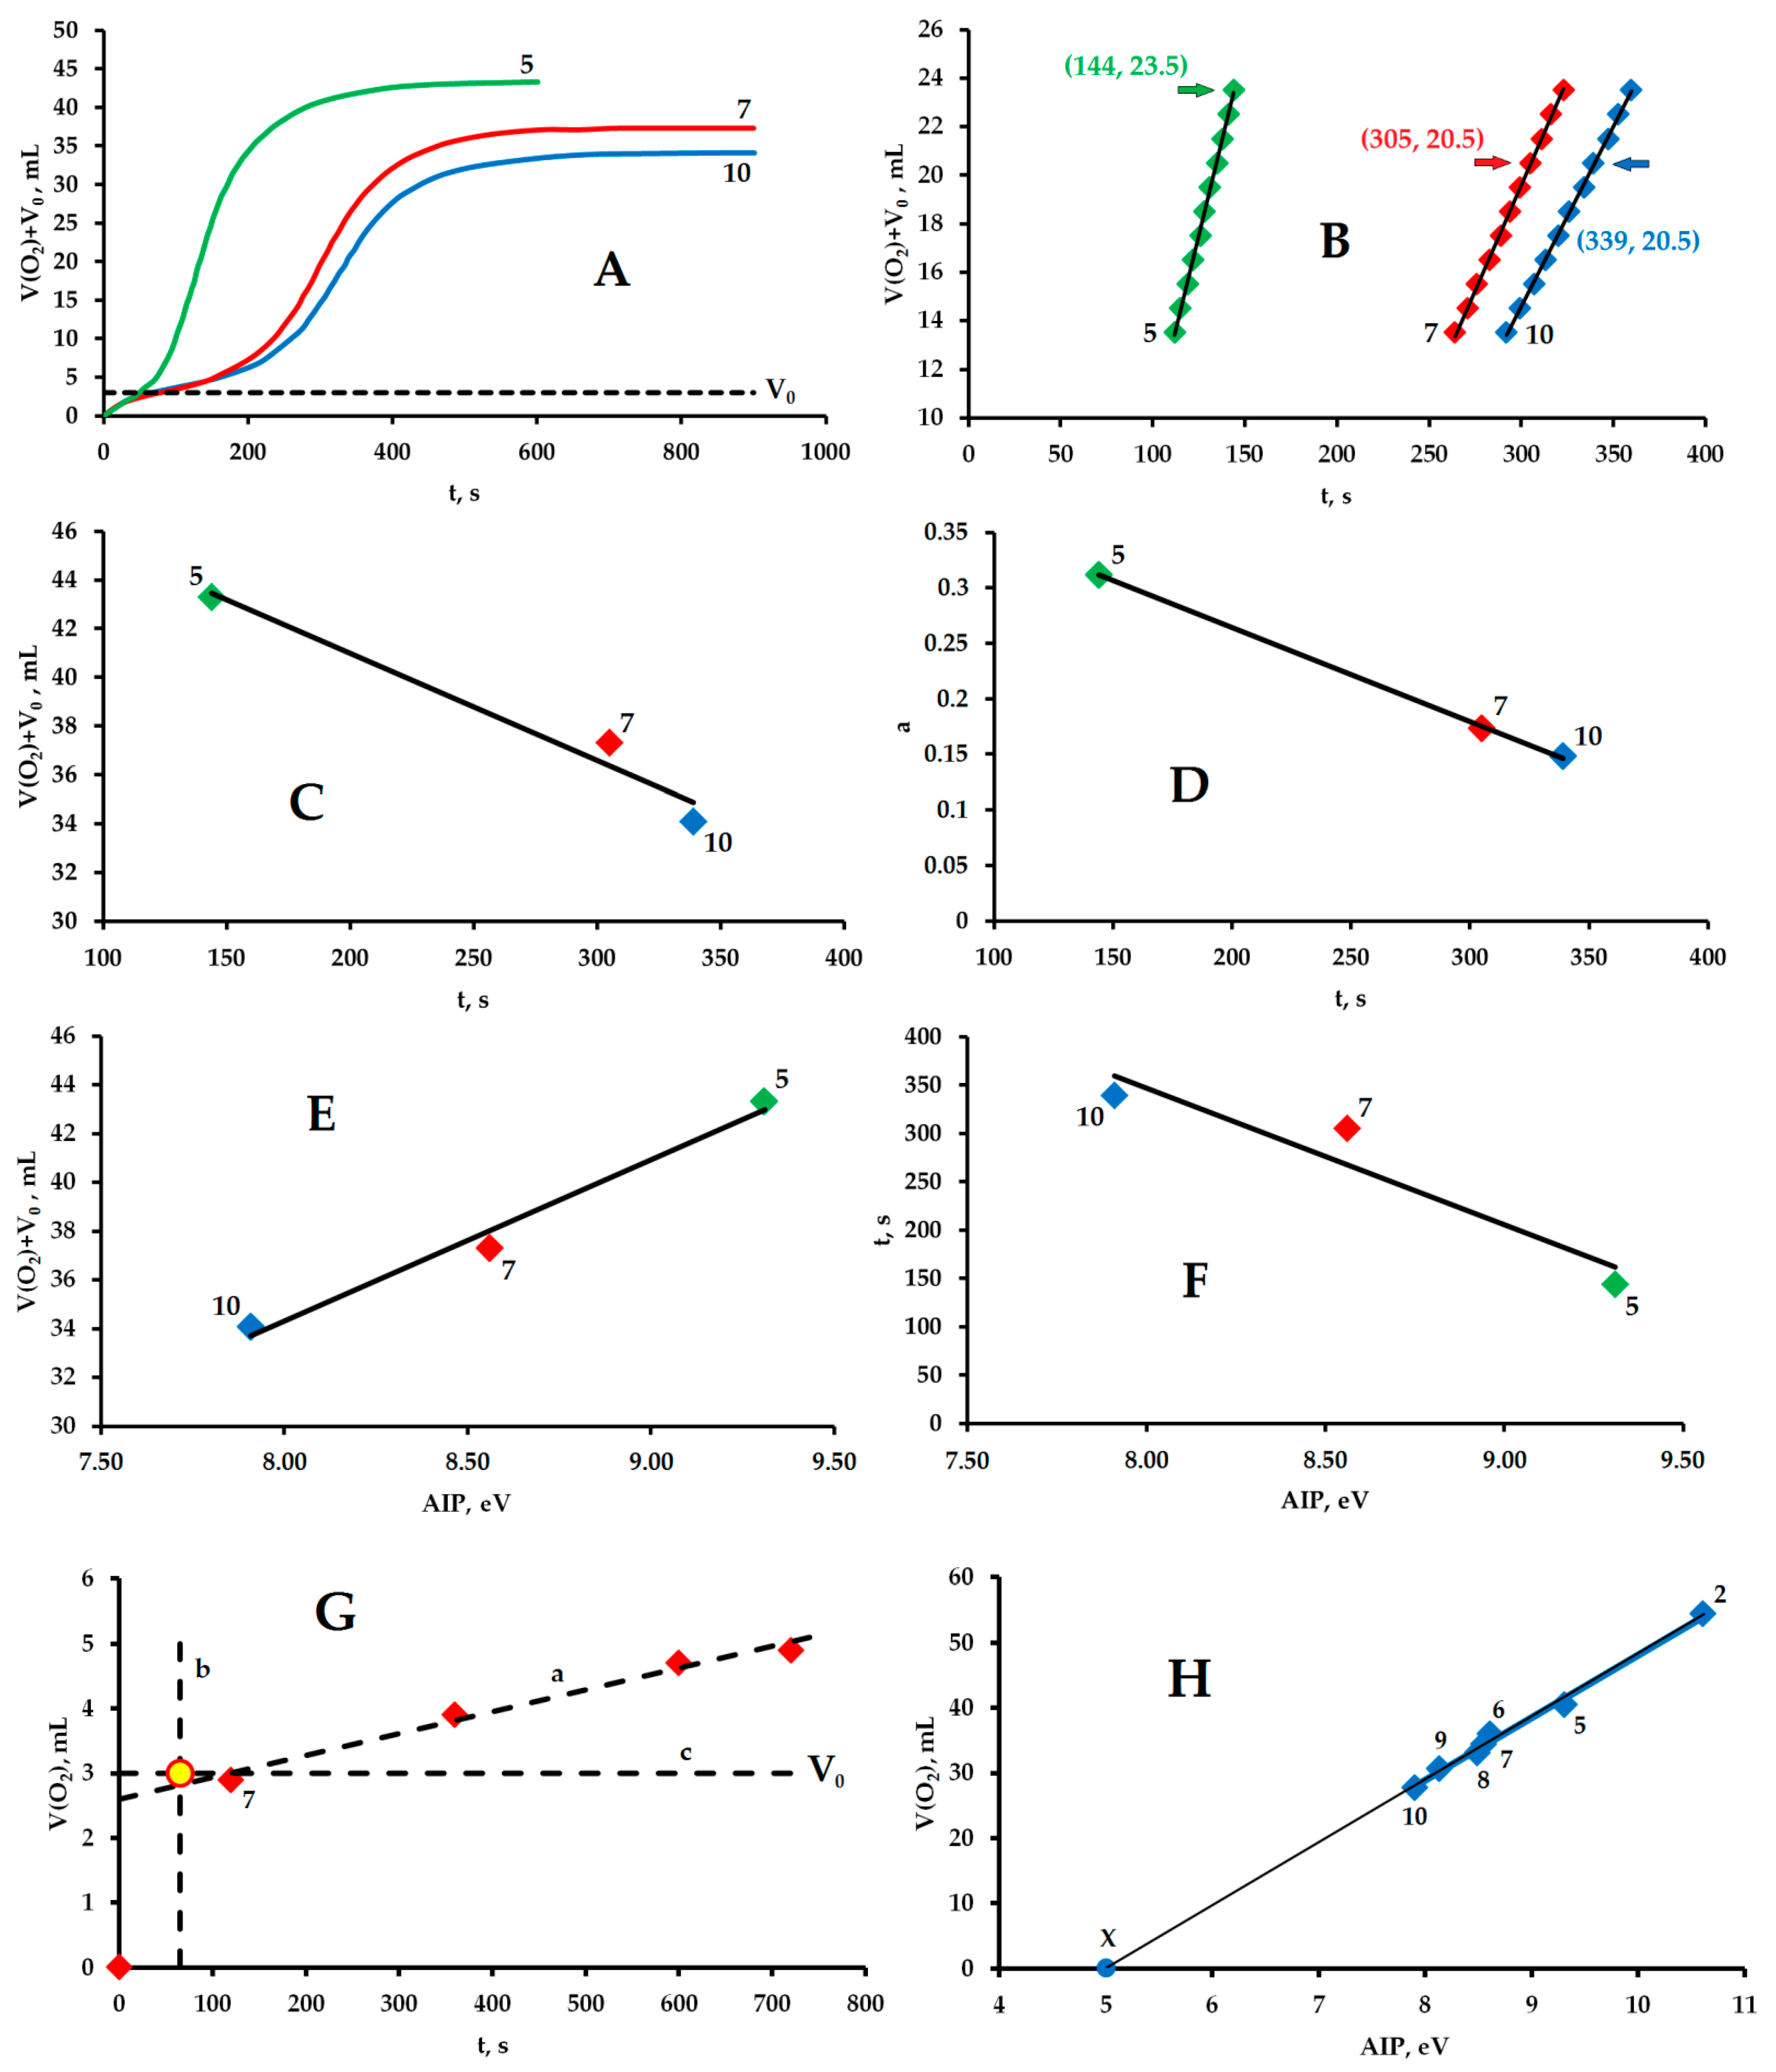
3.5. Initiation of the Reaction of Molecular Oxygen Evolution by the SET Mechanism
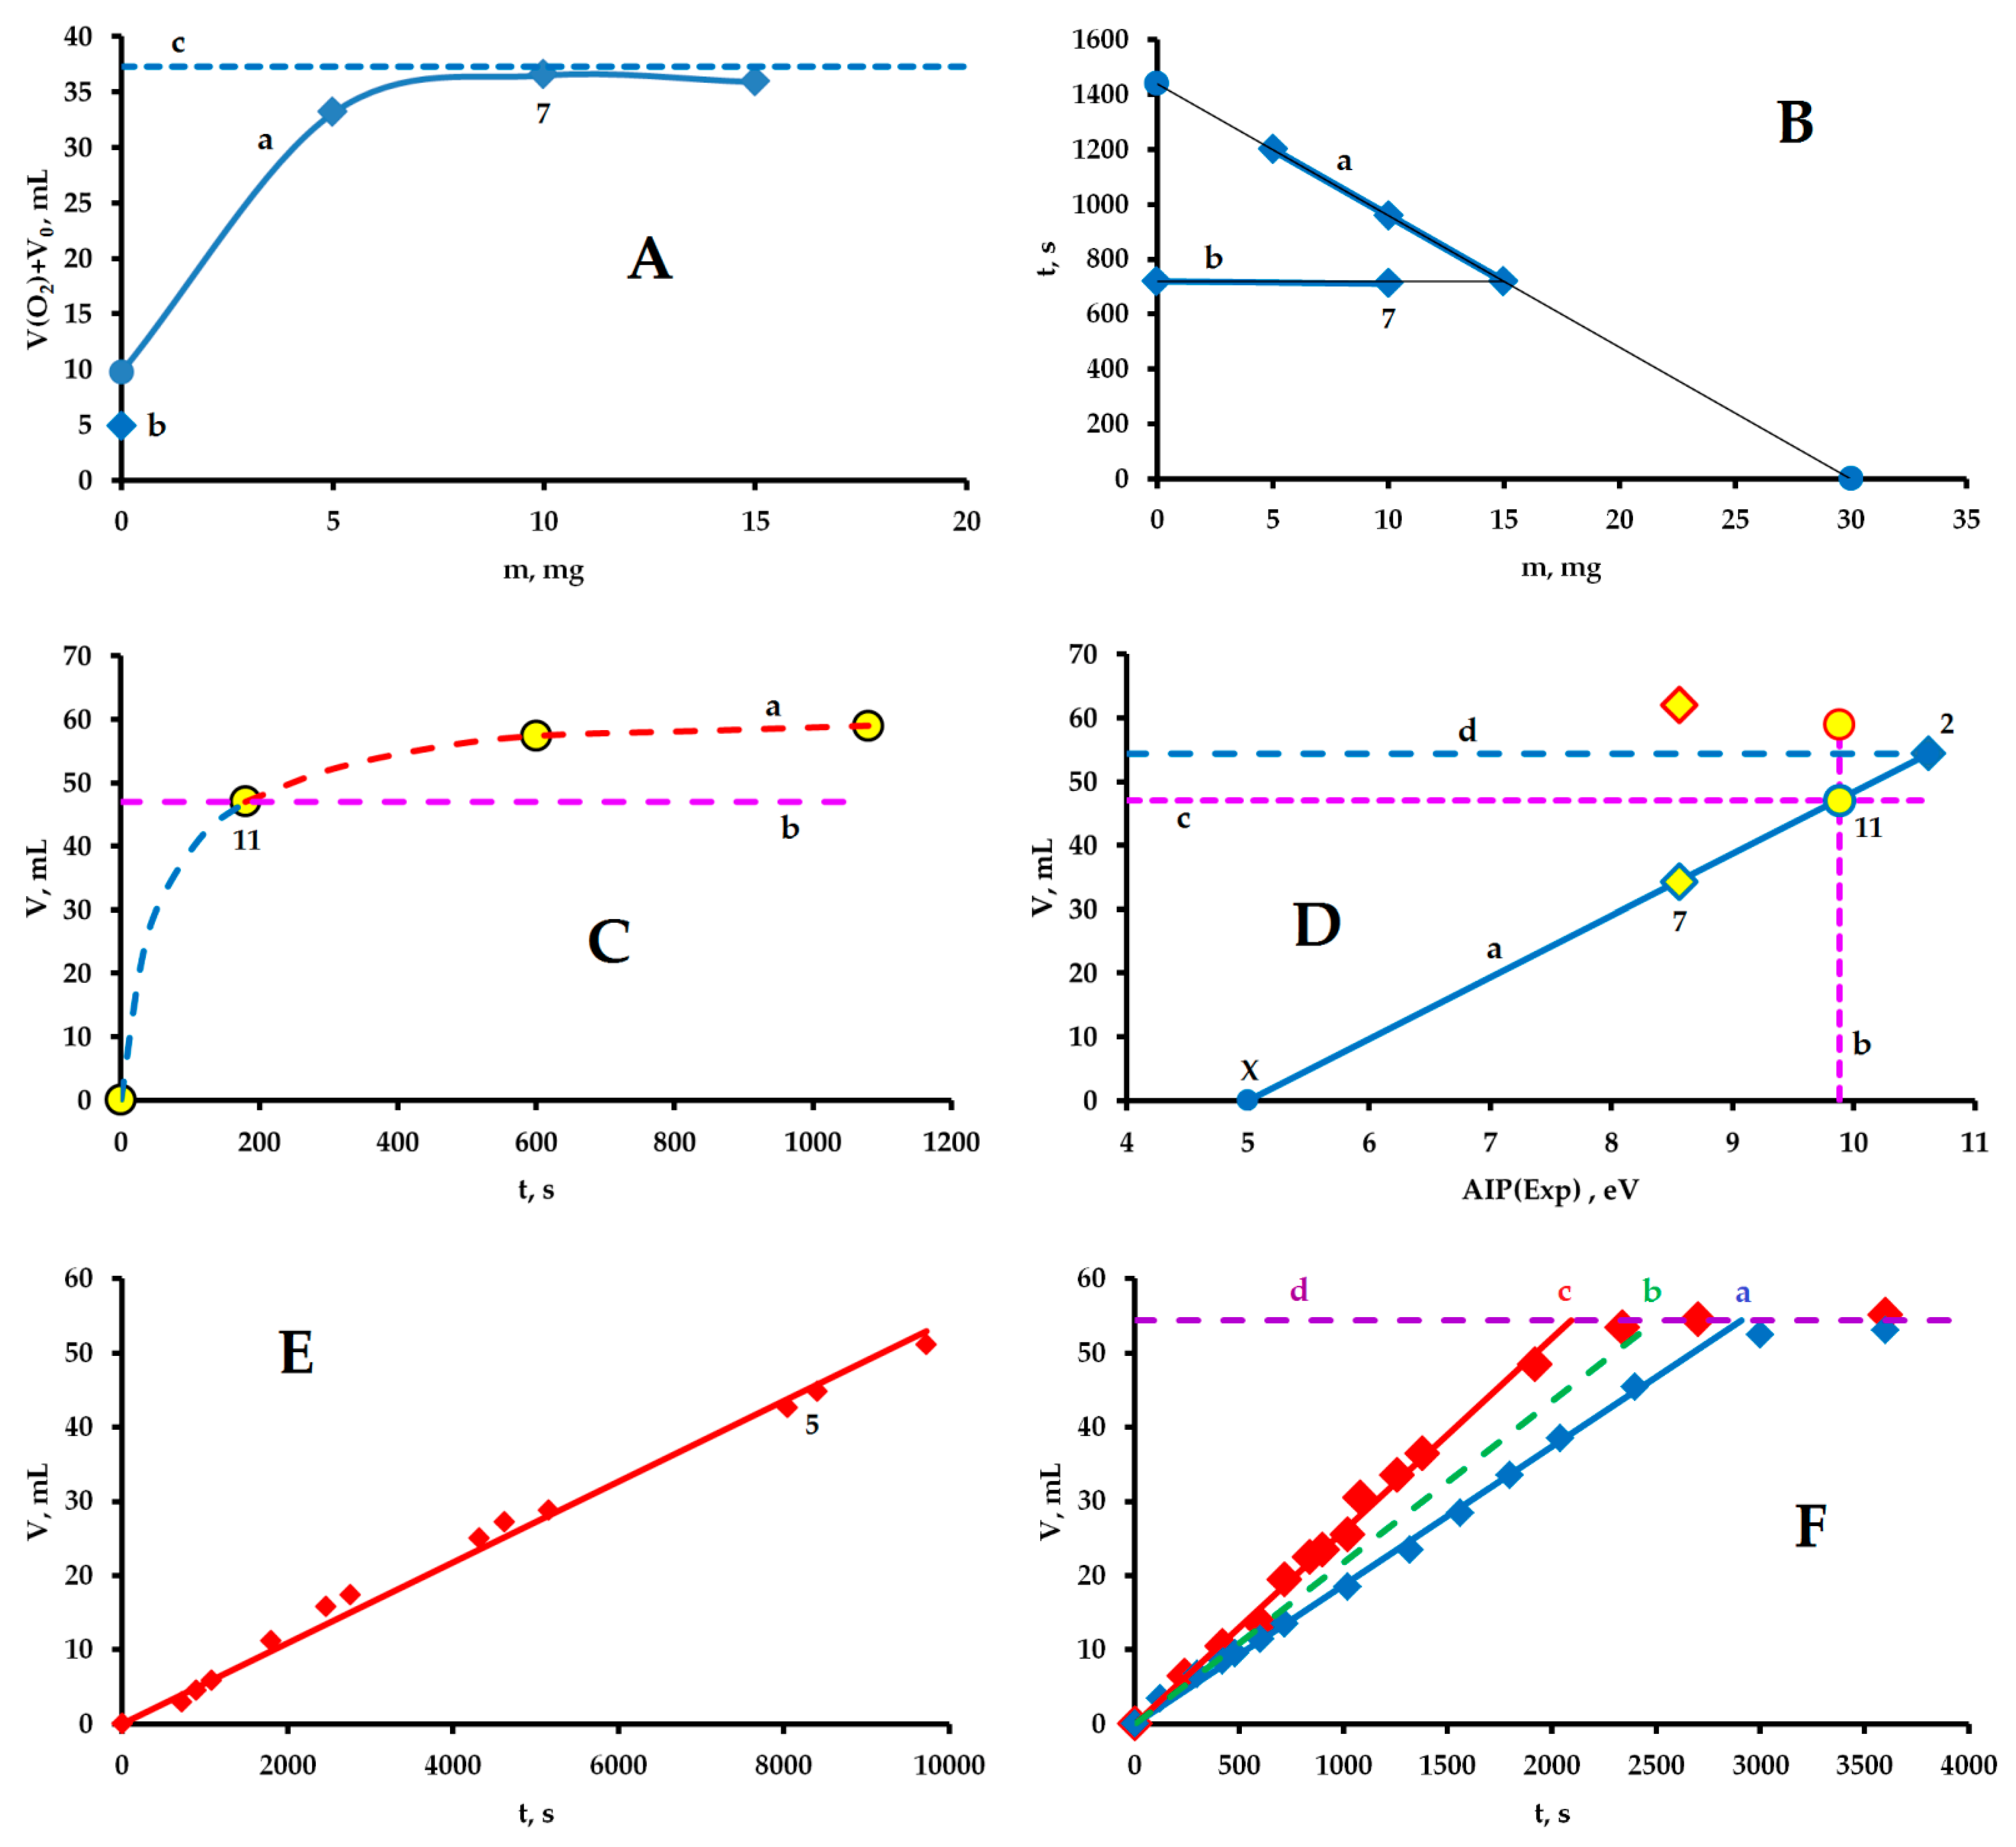
3.6. Two Chemical Processes Involving Cu3Cl5 and Cu3Cl4 Molecules
3.7. Evolution of Molecular Hydrogen and Oxygen in an Oscillatory Mode
4. Conclusions
Supplementary Materials
Author Contributions
Funding
Institutional Review Board Statement
Informed Consent Statement
Data Availability Statement
Conflicts of Interest
References
- Nikolaidis, P.; Poullikkas, A. A comparative overview of hydrogen production processes. Renew. Sustain. Energy Rev. 2017, 67, 597–611. [Google Scholar] [CrossRef]
- Zhang, L.; Zhou, M.; Wang, A.; Zhang, T. Selective hydrogenation over supported metal catalysts: From nanoparticles to single atoms. Chem. Rev. 2020, 120, 683–733. [Google Scholar] [CrossRef] [PubMed]
- Yu, X.; Tong, Y.; Yang, Y. Activated dissociation of H2 on Cu(001): The role of quantum tunneling. arXiv 2022, arXiv:2211.06157. [Google Scholar] [CrossRef]
- Akhmetov, N.S. General and Inorganic Chemistry; Cheighton, H.C., Ed.; Rosinkin, A., Translator; MIR Publishers: Moscow, Russia, 1983. [Google Scholar]
- Zhang, Y.P.; Cheng, C.H.; Kim, J.T.; Stanojevic, J.; Eyler, E.E. Dissociation energies of molecular hydrogen and the hydrogen molecular ion. Phys. Rev. Lett. 2004, 92, 203003. [Google Scholar] [CrossRef] [PubMed]
- Martin, J.D.D.; Hepburn, J.W. Electric field induced dissociation of molecules in Rydberg-like highly vibrationally excited ion-pair states. Phys. Rev. Lett. 1997, 79, 3154–3157. [Google Scholar] [CrossRef] [Green Version]
- Ruscic, B.; Wagner, A.F.; Harding, L.B.; Asher, R.L.; Feller, D.; Dixon, D.A.; Peterson, K.A.; Song, Y.; Qian, X.; Ng, C.-Y.; et al. On the enthalpy of formation of hydroxyl radical and gas-phase bond dissociation energies of water and hydroxyl. J. Phys. Chem. A 2002, 106, 2727–2747. [Google Scholar] [CrossRef] [Green Version]
- Ruscic, B.; Pinzon, R.E.; Morton, M.L.; Srinivasan, N.K.; Su, M.-C.; Sutherland, J.W.; Michael, J.V. Active thermochemical tables: Accurate enthalpy of formation of hydroperoxyl radical, HO2. J. Phys. Chem. A 2006, 110, 6592–6601. [Google Scholar] [CrossRef]
- Chase, M.W., Jr. NIST-JANAF Thermochemical Table, 4th ed.; American Chemical Society: Washington, DC, USA, 1998. Available online: http://www.nist.gov/srd/monogr.cfm (accessed on 26 November 2022).
- Luo, Y.-R. Comprehensive Handbook of Chemical Bond Energies, 1st ed.; CRC Press: Boca Raton, FL, USA, 2007. [Google Scholar] [CrossRef]
- Cook, B. An introduction to fuel cells and hydrogen technology. Eng. Sci. Educ. J. 2002, 11, 205–216. [Google Scholar] [CrossRef] [Green Version]
- Stambouli, A.B.; Traversa, E. Fuel cells, an alternative to standard sources of energy. Renew. Sustain. Energy Rev. 2002, 6, 297–306. [Google Scholar] [CrossRef]
- Mekhilef, S.; Saidur, R.; Safari, A. Comparative study of different fuel cell technologies. Renew. Sustain. Energy Rev. 2012, 16, 981–989. [Google Scholar] [CrossRef]
- Lu, Y.; Mi, Y.; Li, J.; Qi, F.; Yan, S.; Dong, W. Recent progress in semiconductor-ionic conductor nanomaterial as a membrane for low-temperature solid oxide fuel cells. Nanomaterials 2021, 11, 2290. [Google Scholar] [CrossRef]
- Kumar, S.S.; Himabindu, V. Hydrogen production by PEM water electrolysis—A review. Mater. Sci. Energy Technol. 2019, 2, 442–454. [Google Scholar] [CrossRef]
- Aktar, A.; Ahmmed, S.; Hossain, J.; Ismail, A.B.M. Solution-processed synthesis of copper oxide (CuxO) thin films for efficient photocatalytic solar water splitting. ACS Omega 2020, 5, 25125–25134. [Google Scholar] [CrossRef]
- Jakhar, M.; Kumar, A.; Ahluwalia, P.K.; Tankeshwar, K.; Pandey, R. Engineering 2D materials for photocatalytic water-splitting from a theoretical perspective. Materials 2022, 15, 2221. [Google Scholar] [CrossRef]
- Dittmeyer, R.; Grunwaldt, J.D.; Pashkova, A. A review of catalyst performance and novel reaction engineering concepts in direct synthesis of hydrogen peroxide. Catal. Today 2015, 248, 149–159. [Google Scholar] [CrossRef]
- Menegazzo, F.; Signoretto, M.; Ghedini, E.; Strukul, G. Looking for the “dream catalyst” for hydrogen peroxide production from hydrogen and oxygen. Catalysts 2019, 9, 251. [Google Scholar] [CrossRef] [Green Version]
- Ricciardulli, T.; Gorthy, S.; Adams, J.S.; Thompson, C.; Karim, A.M.; Neurock, M.; Flaherty, D.W. Effect of Pd coordination and isolation on the catalytic reduction of O2 to H2O2 over PdAu bimetallic nanoparticles. J. Am. Chem. Soc. 2021, 143, 5445–5464. [Google Scholar] [CrossRef]
- Staykov, A.; Kamachi, T.; Ishihara, T.; Yoshizawa, K. Theoretical study of the direct synthesis of H2O2 on Pd and Pd/Au surfaces. J. Phys. Chem. C 2008, 112, 19501–19505. [Google Scholar] [CrossRef]
- Todorovic, R.; Meyer, R.J. A comparative density functional theory study of the direct synthesis of H2O2 on Pd, Pt and Au surfaces. Catal. Today 2011, 160, 242–248. [Google Scholar] [CrossRef]
- Tian, P.; Ding, D.; Sun, Y.; Xuan, F.; Xu, X.; Xu, J.; Han, Y.F. Theoretical study of size effects on the direct synthesis of hydrogen peroxide over palladium catalysts. J. Cat. 2019, 369, 95–104. [Google Scholar] [CrossRef]
- Song, X.; Sun, K.; Hao, X.; Su, H.Y.; Ma, X.; Xu, Y. Facet-dependent of catalytic selectivity: The case of H2O2 direct synthesis on Pd surfaces. J. Phys. Chem. C 2019, 123, 26324–26337. [Google Scholar] [CrossRef]
- Ranganathan, S.; Sieber, V. Recent advances in the direct synthesis of hydrogen peroxide using chemical catalysis—A review. Catalysts 2018, 8, 379. [Google Scholar] [CrossRef] [Green Version]
- Hiroki, A.; LaVerne, J.A. Decomposition of hydrogen peroxide at water-ceramic oxide interfaces. J. Phys. Chem. B 2005, 109, 3364–3370. [Google Scholar] [CrossRef] [PubMed]
- Tatsuoka, T.; Koga, N. Energy diagram for the catalytic decomposition of hydrogen peroxide. J. Chem. Educ. 2013, 90, 633–636. [Google Scholar] [CrossRef]
- Serra-Maia, R.; Bellier, M.; Chastka, S.; Tranhuu, K.; Subowo, A.; Rimstidt, J.D.; Usov, P.M.; Morris, A.J.; Michel, F.M. Mechanism and kinetics of hydrogen peroxide decomposition on platinum nanocatalysts. ACS Appl. Mater. Interfaces 2018, 10, 21224–21234. [Google Scholar] [CrossRef]
- Anikin, O.V.; Bolotov, A.V.; Minkhanov, I.F.; Varfolomeev, M.A.; Tazeev, A.R.; Chalin, V.V.; Lutfullin, A.A.; Abusalimov, E.M. Factors influencing hydrogen peroxide decomposition dynamics for thermochemical treatment of bottomhole zone. J. Pet. Explor. Prod. Technol. 2022, 12, 2587–2598. [Google Scholar] [CrossRef]
- Chowdhury, S.H.; Ahsan, M.; Kabir, M.H.; Alam, S.S.; Hasnat, M.A. Decomposition of hydrogen peroxide using chemical and catalytic methods: A reactor-based approach. Asian, J. Chem. 2022, 34, 1263–1268. [Google Scholar] [CrossRef]
- Perry, S.C.; Pangotra, D.; Vieira, L.; Csepei, L.I.; Sieber, V.; Wang, L.; Ponce de León, C.; Walsh, F.C. Electrochemical synthesis of hydrogen peroxide from water and oxygen. Nat. Rev. Chem. 2019, 3, 442–458. [Google Scholar] [CrossRef]
- Xia, C.; Back, S.; Ringe, S.; Jiang, K.; Chen, F.; Sun, X.; Siahrostami, S.; Chang, K.; Wang, H. Confined local oxygen gas promotes electrochemical water oxidation to hydrogen peroxide. Nat. Catal. 2020, 3, 125–134. [Google Scholar] [CrossRef]
- Huang, A.; Delima, R.S.; Kim, Y.; Lees, E.W.; Parlane, F.G.L.; Dvorak, D.J.; Rooney, M.B.; Jansonius, R.P.; Fink, A.G.; Zhang, Z.; et al. Direct H2O2 synthesis, without H2 gas. J. Am. Chem. Soc. 2022, 144, 14548–14554. [Google Scholar] [CrossRef]
- Walling, C.; Goosen, A. Mechanism of the ferric ion catalyzed decomposition of hydrogen peroxide. Effect of organic substrates. J. Am. Chem. Soc. 1973, 95, 2987–2991. [Google Scholar] [CrossRef]
- Kremer, M.L. “Complex” versus “free radical” mechanism for the catalytic decomposition of H2O2 by ferric ions. Int. J. Chem. Kinet. 1985, 17, 1299–1314. [Google Scholar] [CrossRef]
- Stanbury, D.M. The principle of detailed balancing, the iron-catalyzed disproportionation of hydrogen peroxide, and the Fenton reaction. Dalton Trans. 2022, 51, 2135–2157. [Google Scholar] [CrossRef]
- Mochida, I.; Takeshita, K. Transition metal ions on molecular sieves. II. Catalytic activities of transition metal ions on molecular sieves for the decomposition of hydrogen peroxide. J. Phys. Chem. 1974, 78, 1653–1657. [Google Scholar] [CrossRef]
- Ram, R.N.; Gupta, J.R.P.; Prasad, R.B. Gasometric study of kinetics of decomposition of hydrogen peroxide catalysed by Cu(II). Indian J. Chem. 1979, 17A, 29–31. Available online: http://nopr.niscair.res.in/bitstream/123456789/51497/1/IJCA%2017A%281%29%2029-31.pdf (accessed on 26 November 2022).
- Perez-Benito, J.F. Reaction pathways in the decomposition of hydrogen peroxide catalyzed by copper(II). J. Inorg. Biochem. 2004, 98, 430–438. [Google Scholar] [CrossRef]
- Perez-Benito, J.F. Copper(II)-catalyzed decomposition of hydrogen peroxide: Catalyst activation by halide ions. Mon. Chem. 2001, 132, 1477–1492. [Google Scholar] [CrossRef]
- Xing, G.; Pham, A.N.; Miller, C.J.; Waite, T.D. pH-dependence of production of oxidants (Cu(III) and/or HO•) by copper-catalyzed decomposition of hydrogen peroxide under conditions typical of natural saline waters. Geochim. Cosmochim. Acta 2018, 232, 30–47. [Google Scholar] [CrossRef]
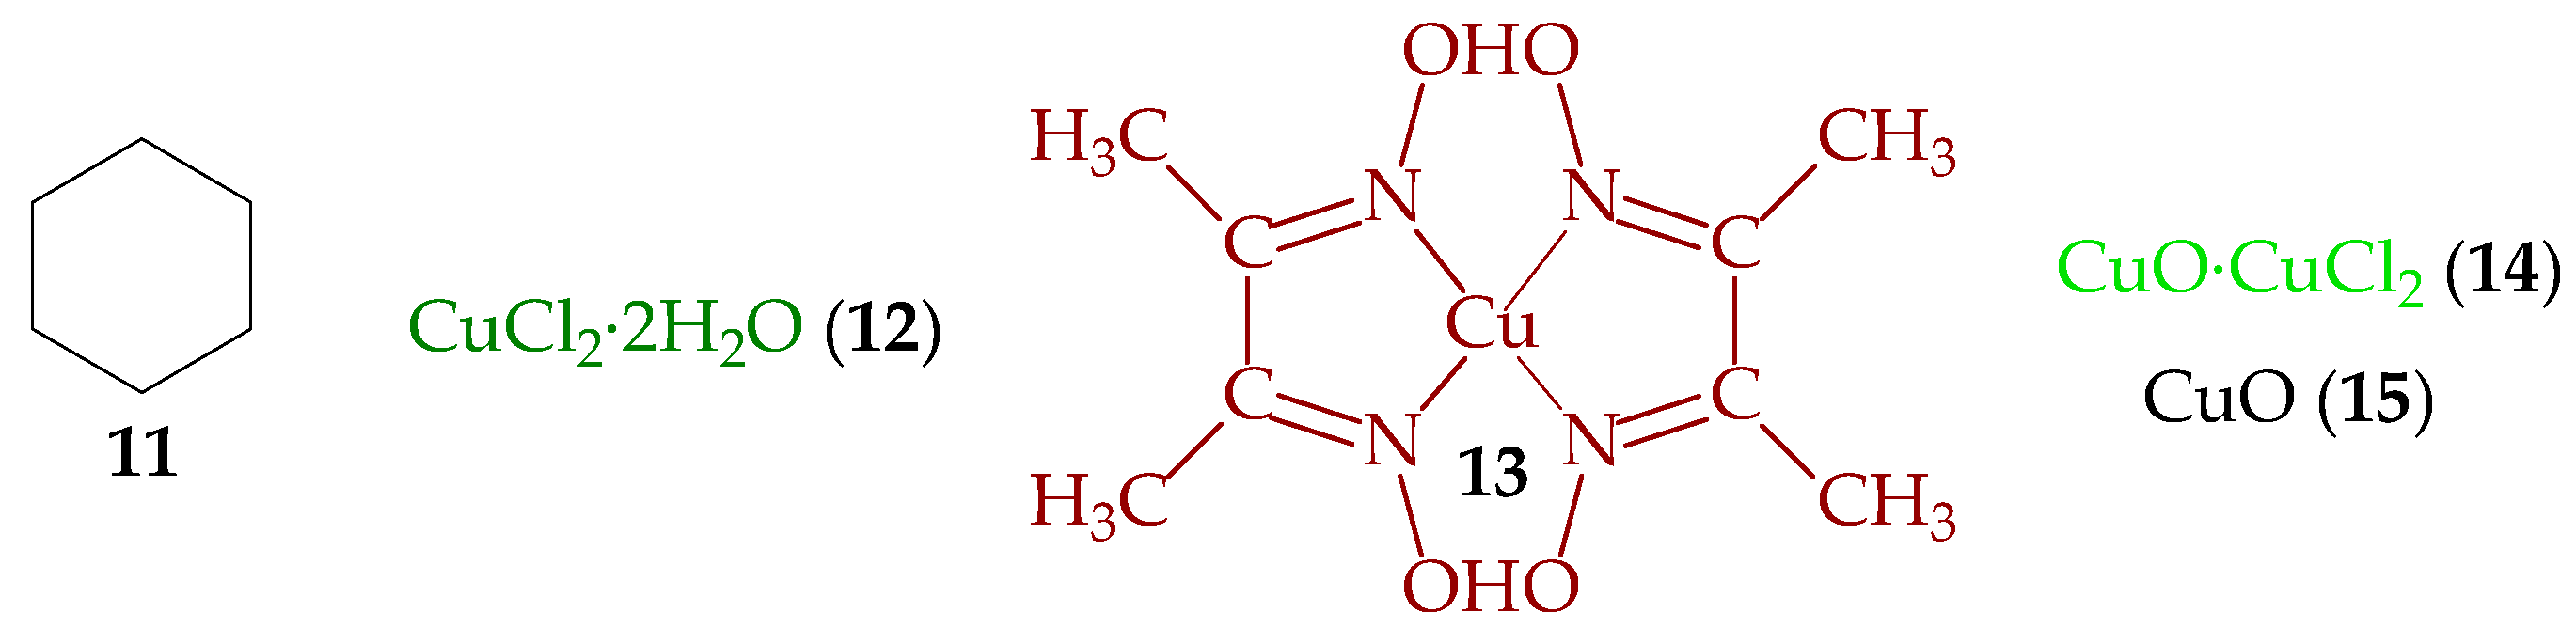
- Shchapin, I.Y.; Ramazanov, D.N.; Nekhaev, A.I.; Borisov, R.S.; Buravlev, E.A.; Maximov, A.L. One-stage catalytic oxidation of adamantane to tri-, tetra-, and penta-ols. Catalysts 2021, 11, 1017. [Google Scholar] [CrossRef]
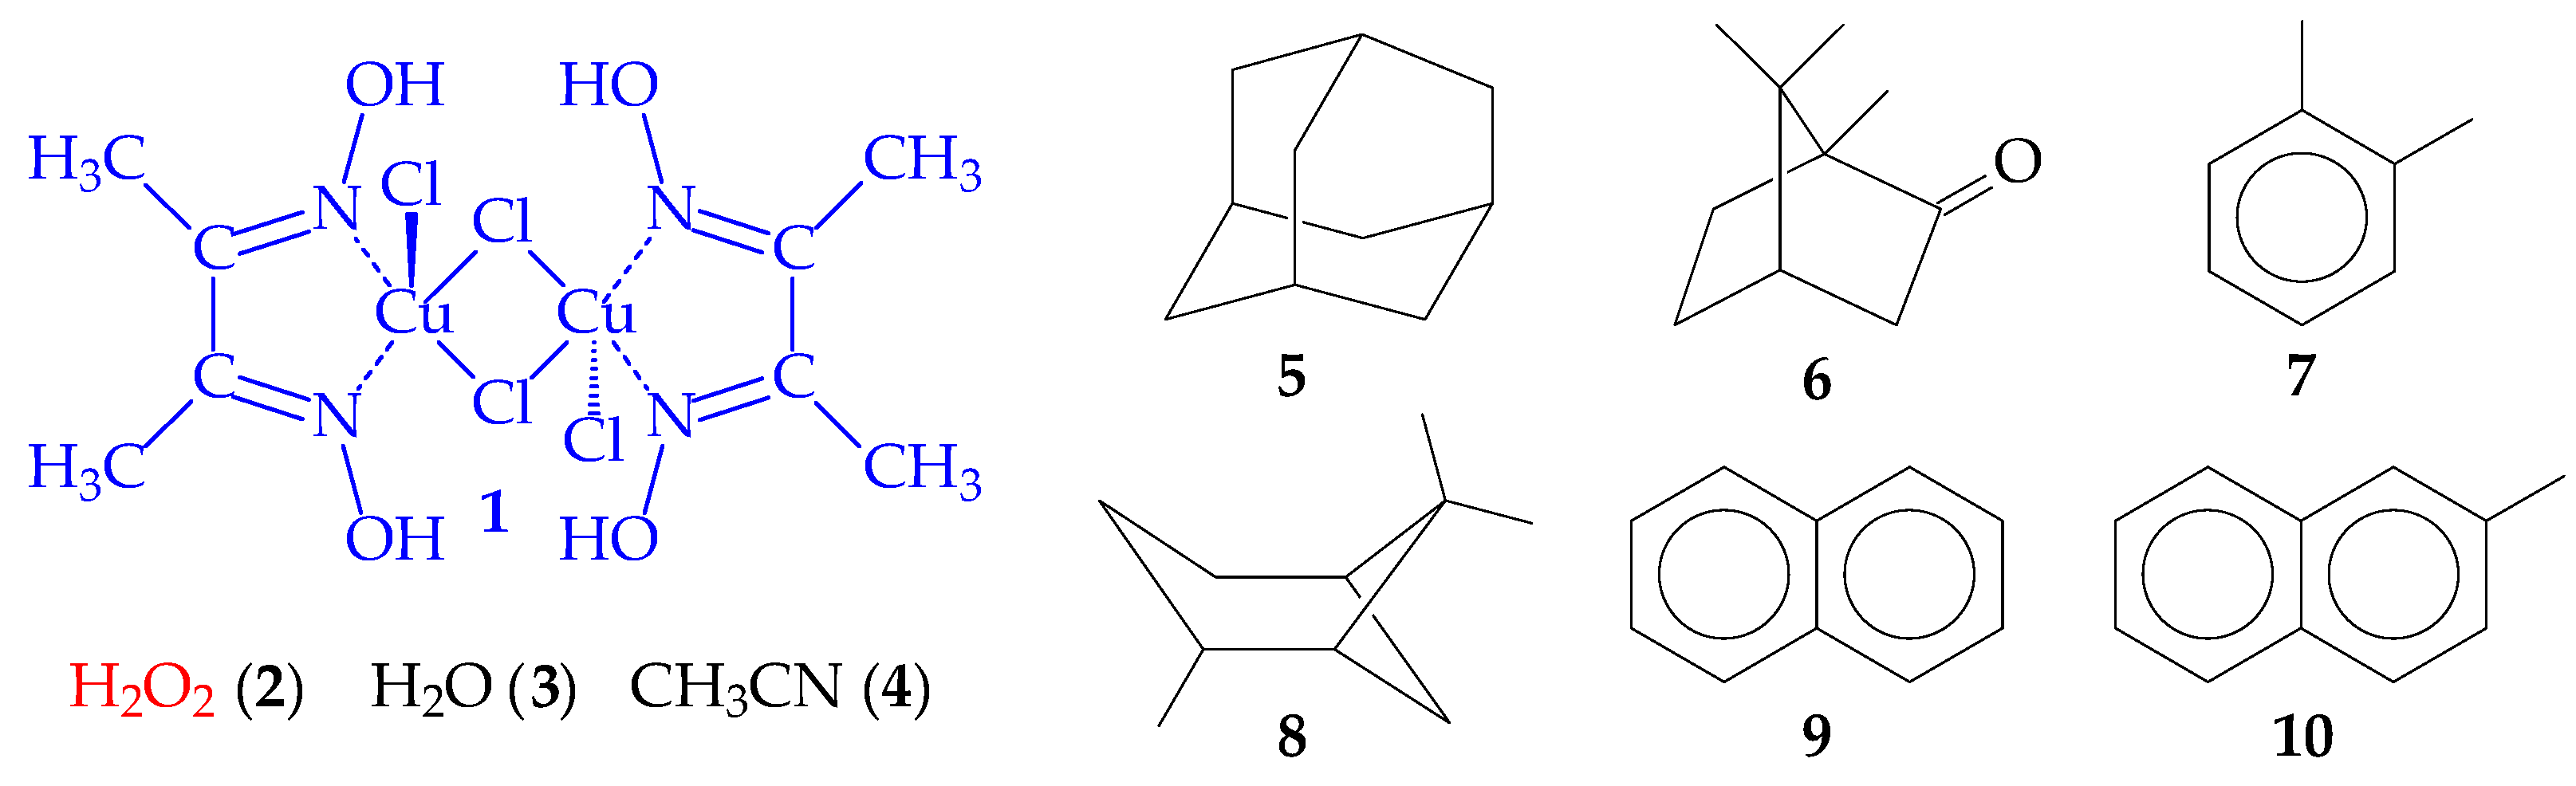
- Shchapin, I.Y.; Nekhaev, A.I.; Ramazanov, D.N.; Al-Yusufi, M.; Samoilov, V.O.; Maximov, A.L. Hydrocarbon oxidation depth: H2O2/Cu2Cl4·2DMG/CH3CN system. Catalysts 2022, 12, 409. [Google Scholar] [CrossRef]
- Svedung, D.H. The crystal structure of copper dimethylglyoxime dichloride. Acta Chem. Scand. 1969, 23, 2865–2878. [Google Scholar] [CrossRef]
- Neese, F. The ORCA program system. WIREs Comput. Mol. Sci. 2012, 2, 73–78. [Google Scholar] [CrossRef]
- Neese, F. ORCA—An Ab Initio, DFT and Semiempirical SCF-MO Package—Version 3.0.1; Max-Plank-Institute for Chemical Energy Conversion: Ruhr, Germany, 2013; Available online: https://orcaforum.kofo.mpg.de/ (accessed on 26 November 2022).
- Chemcraft—Graphical software for visualization of quantum chemistry computations. Available online: https://www.chemcraftprog.com (accessed on 26 November 2022).
- Megnamisi-Belombe, M.; Novotny, M.A. Superexchange in copper(II) dimers. 1. Synthesis, characterization, and magnetic behavior of the novel di-µ-bromo-bis[bromo(dimethylglyoxime)copper(II)],[CuBr2(dmgH)]2. Inorg. Chem. 1980, 19, 2470–2473. [Google Scholar] [CrossRef]
- Cozar, O.; Znamirovschi, V.; David, L.; Giurgiu, L.; Zsako, J. ESR investigation of some copper(II)-dioxime-dichloride compounds. J. Appl. Magn. Reson. 1992, 3, 849–857. [Google Scholar] [CrossRef]
- Kitiphaisalnont, P.; Boonyang, U.; Boonperm, K.; Siripaisarnpipat, S. Unexpected formation of copper dimethylglyoxime dimer from the reaction of cuprous chloride and tetradentate buthylene-bridged diiminedioxime ligand. Chiang Mai J. Sci. 2015, 42, 712–717. Available online: http://epg.science.cmu.ac.th/ejournal/ (accessed on 26 November 2022).
- Egneus, B. Investigations of dioximes and their metal complexes: A survey of the literature since 1963. Talanta 1972, 19, 1387–1419. [Google Scholar] [CrossRef]
- Rodríguez, M.; Llobet, A.; Corbella, M. A theoretical analysis of how geometrical distortions on Cu(μ-Cl)2Cu dimers influence their electronic and magnetic properties. Polyhedron 2000, 19, 2483–2491. [Google Scholar] [CrossRef]
- Rodríguez-Fortea, A.; Alemany, P.; Alvarez, S.; Ruiz, E. Exchange coupling in halo-bridged dinuclear Cu(II) compounds: A density functional study. Inorg. Chem. 2002, 41, 3769–3778. [Google Scholar] [CrossRef]
- Willett, R.D.; Rundle, R.E. Crystal structure of Cu2Cl4(CH3CN)2, Cu3Cl6(CH3CN)2, and Cu5Cl10(C3H7OH)2. J. Chem. Phys. 1964, 40, 838–847. [Google Scholar] [CrossRef]
- Barnes, J.C. Studies of some complexes of copper(II) halides with organic donors. J. Inorg. Nucl. Chem. 1969, 31, 95–106. [Google Scholar] [CrossRef]
- Liu, C.; Talham, D.R.; Park, J.H.; Čižmár, E.; Meisel, M.W. Ferromagnetic dimer interactions in Cu2Cl4(CH3CN)2. J. Chem. Phys. 2004, 120, 1140–1141. [Google Scholar] [CrossRef]
- Rapoport, E.; Pistorius, C.W.F.T. Phase diagrams of the cuprous halides to high pressures. Phys. Rev. 1968, 172, 838–847. [Google Scholar] [CrossRef]
- Boyce, J.B.; Hayes, T.M.; Mikkelsen, J.C., Jr. Extended-x-ray-absorption-fine-structure investigation of mobile-ion density in superionic AgI, CuI, CuBr, and CuCl. Phys. Rev. B 1981, 23, 2876–2896. [Google Scholar] [CrossRef]
- Schwab, C.; Goltzené, A. Cuprous halides. Prog. Cryst. Growth Charact. 1982, 5, 233–276. [Google Scholar] [CrossRef]
- Graneli, B.; Dahlborg, U.; Fischer, P. Neutron poweder diffraction investigation of γ-and β-copper chloride in the temperature range 8–686 K. Solid State Ion. 1988, 28, 284–293. [Google Scholar] [CrossRef]
- Slack, G.A.; Andersson, P. Pressure and temperature effects on the thermal conductivity of CuCl. Phys. Rev. B 1982, 26, 1873–1884. [Google Scholar] [CrossRef]
- Ahn, D.; Park, S.-H. Cuprous halides semiconductors as a new means for highly efficient light-emitting diodes. Sci. Rep. 2016, 6, 20718. [Google Scholar] [CrossRef] [Green Version]
- Ko, Y.J.; Wang, H.; Pradhan, K.; Koirala, P.; Kandalam, A.K.; Bowen, K.H.; Jena, P. Superhalogen properties of CumCln clusters: Theory and experiment. J. Chem. Phys. 2011, 135, 244312. [Google Scholar] [CrossRef] [Green Version]
- Calvi, R.M.D.; Andrews, D.H.; Lineberger, W.C. Negative ion photoelectron spectroscopy of copper hydrides. Chem. Phys. Lett. 2007, 442, 12–16. [Google Scholar] [CrossRef]
- Ho, J.; Ervin, K.M.; Lineberger, W.C. Photoelectron spectroscopy of metal cluster anions: Cu−n, Ag−n, and Au−n. J. Chem. Phys. 1990, 93, 6987–7002. [Google Scholar] [CrossRef]
- Wang, L.S.; Wu, H.; Desai, S.R.; Lou, L. Electronic structure of small copper oxide clusters: From Cu2O to Cu2O4. Phys. Rev. B 1996, 53, 8028. [Google Scholar] [CrossRef] [PubMed]
- Leopold, D.G.; Ho, J.; Lineberger, W.C. Photoelectron spectroscopy of mass–selected metal cluster anions. I. Cu−n, n = 1–10. J. Chem. Phys. 1987, 86, 1715–1726. [Google Scholar] [CrossRef]
- Trainham, R.; Fletcher, G.D.; Larson, D.J. One- and two-photon detachment of the negative chlorine ion. J. Phys. B 1987, 20, L777. [Google Scholar] [CrossRef]
- Maier, J.P.; Turner, D.W. Steric inhibition of resonance studied by molecular photoelectron spectroscopy Part 3. Anilines, phenols and related compounds. J. Chem. Soc. Faraday Trans. 2 1973, 69, 521–531. [Google Scholar] [CrossRef]
- Zhelyazkova, B.G. The influence of the solvent on the reaction of cupric chloride with N, N-dimethylaniline. Inorg. Nucl. Chem. Lett. 1981, 17, 141–145. [Google Scholar] [CrossRef]
- Sumalekshmy, S.; Gopidas, K.R. Reaction of aromatic amines with Cu(ClO4) 2 in acetonitrile as a facile route to amine radical cation generation. Chem. Phys. Lett. 2005, 413, 294–299. [Google Scholar] [CrossRef]
- Sreenath, K.; Suneesh, C.V.; Ratheesh Kumar, V.K.; Gopidas, K.R. Cu(II)-mediated generation of triarylamine radical cations and their dimerization. An easy route to tetraarylbenzidines. J. Org. Chem. 2008, 73, 3245–3251. [Google Scholar] [CrossRef]
- Sreenath, K.; Suneesh, C.V.; Gopidas, K.R.; Flowers, R.A. Generation of triarylamine radical cations through reaction of triarylamines with Cu(II) in acetonitrile. A kinetic investigation of the electron-transfer reaction. J. Phys. Chem. A 2009, 113, 6477–6483. [Google Scholar] [CrossRef]
- Sreenath, K.; Thomas, T.G.; Gopidas, K.R. Cu(II) mediated generation and spectroscopic study of the tris (4-anisyl) amine radical cation and dication. Unusually shielded chemical shifts in the dication. Org. Lett. 2011, 13, 1134–1137. [Google Scholar] [CrossRef]
- Malkondu, S.; Erdemir, S. A triphenylamine based multi-analyte chemosensor for Hg2+ and Cu2+ ions in MeCN/H2O. Tetrahedron 2014, 70, 5494–5498. [Google Scholar] [CrossRef]
- Thomas, T.G.; Shekar, S.C.; Swathi, R.S.; Gopidas, K.R. Triazatruxene radical cation: A trigonal class III mixed valence system. RSC Adv. 2017, 7, 821–825. [Google Scholar] [CrossRef]
- Boess, E.; Van Hoof, M.; Birdsall, S.L.; Klussmann, M. Investigating the oxidation step in the CuCl2-catalyzed aerobic oxidative coupling reaction of N-aryl tetrahydroisoquinolines. J. Org. Chem. 2019, 85, 1972–1980. [Google Scholar] [CrossRef] [Green Version]
- Morgante, P.; Dughera, S.; Ghigo, G. Aerobic CuCl2-catalyzed dehydrogenative cross-coupling of tertiary amines. A combined computational and experimental study. J. Phys. Chem. A 2019, 123, 2796–2814. [Google Scholar] [CrossRef]
- Winter, B.; Weber, R.; Widdra, W.; Dittmar, M.; Faubel, M.; Hertel, I.V. Full valence band photoemission from liquid water using EUV synchrotron radiation. J. Phys. Chem. A 2004, 108, 2625–2632. [Google Scholar] [CrossRef]
- Perry, C.F.; Zhang, P.; Nunes, F.B.; Jordan, I.; von Conta, A.; Wörner, H.J. Ionization energy of liquid water revisited. J. Phys. Chem. Lett. 2020, 11, 1789–1794. [Google Scholar] [CrossRef]
- Barth, S.; Oncák, M.; Ulrich, V.; Mucke, M.; Lischke, T.; Slavicek, P.; Hergenhahn, U. Valence ionization of water clusters: From isolated molecules to bulk. J. Phys. Chem. A 2009, 113, 13519–13527. [Google Scholar] [CrossRef]
- Thürmer, S.; Seidel, R.; Winter, B.; Ončák, M.; Slavíček, P. Flexible H2O2 in water: Electronic structure from photoelectron spectroscopy and ab initio calculations. J. Phys. Chem. A 2011, 115, 6239–6249. [Google Scholar] [CrossRef]
- Cabral, B.J.C. Dynamics, magnetic properties, and electron binding energies of H2O2 in water. J. Chem. Phys. 2017, 146, 234502. [Google Scholar] [CrossRef]
- Ashmore, F.S.; Burgess, A.R. Study of some medium size alcohols and hydroperoxides by photoelectron spectroscopy. J. Chem. Soc. Faraday Trans. 2 1977, 73, 1247–1261. [Google Scholar] [CrossRef]
- Schio, L.; Alagia, M.; Dias, A.A.; Falcinelli, S.; Zhaunerchyk, V.; Lee, E.P.F.; Mok, D.K.W.; Dyke, J.M.; Stranges, S. A Study of H2O2 with threshold photoelectron spectroscopy (TPES) and electronic structure calculations: Redetermination of the first adiabatic ionization energy (AIE). J. Phys. Chem. A 2016, 120, 5220–5229. [Google Scholar] [CrossRef]
- Ferreira, C.; Martiniano, H.F.; Cabral, B.J.C.; Aquilanti, V. Electronic excitation and ionization of hydrogen peroxide–water clusters: Comparison with water clusters. Int. J. Quantum Chem. 2011, 111, 1824–1835. [Google Scholar] [CrossRef]
- Foner, S.N.; Hudson, R.L. Mass spectrometry of the HO2 free radical. J. Chem. Phys. 1962, 36, 2681–2688. [Google Scholar] [CrossRef]
- Tang, X.; Lin, X.; Garcia, G.A.; Loison, J.-C.; Fittschen, C.; Röder, A.; Schleier, D.; Gu, X.; Zhang, W.; Nahon, L. Threshold photoelectron spectroscopy of the HO2 radical. J. Chem. Phys. 2020, 153, 124306. [Google Scholar] [CrossRef] [PubMed]
- Thompson, W.E.; Lugez, C.L.; Jacox, M.E. The infrared spectrum of HOOH+ trapped in solid neon. J. Chem. Phys. 2012, 137, 144305. [Google Scholar] [CrossRef] [PubMed] [Green Version]
- Pysanenko, A.; Pluhařová, E.; Vinklárek, I.S.; Rakovský, J.; Poterya, V.; Kočišek, J.; Fárník, M. Ion and radical chemistry in (H2O2)N clusters. Phys. Chem. Chem. Phys. 2020, 22, 15312–15320. [Google Scholar] [CrossRef]
- Yamasaki, S.; Tachikawa, H. Intracluster reaction dynamics of ionized micro-hydrated hydrogen peroxide (H2O2): A direct ab initio molecular dynamics study. ACS Omega 2022, 7, 33866–33872. [Google Scholar] [CrossRef]
- Del Rio, W.A.; Fortenberry, R.C. Rotational and vibrational fingerprints of the oxywater cation (H2OO+), a possible precursor to abiotic O2. J. Molec. Spectrosc. 2019, 364, 111183. [Google Scholar] [CrossRef]
- Fortenberry, R.C.; Trabelsi, T.; Westbrook, B.R.; Del Rio, W.A.; Francisco, J.S. Molecular oxygen generation from the reaction of water cations with oxygen atoms. J. Chem. Phys. 2019, 150, 201103. [Google Scholar] [CrossRef]
- de Petris, G.; Cartoni, A.; Cipollini, R.; Troiani, A. A novel route to H2O2+• ions via direct generation of the oxywater cation H2OO+•. Int. J. Mass Spectrom. 2006, 249–250, 311–316. [Google Scholar] [CrossRef]
- Franz, J.; Francisco, J.S.; Peyerimhoff, S.D. Production of singlet oxygen atoms by photodissociation of oxywater. J. Chem. Phys. 2009, 130, 084304. [Google Scholar] [CrossRef]
- Xu, S.; Jirasek, V.; Lukes, P. Molecular dynamics simulations of singlet oxygen atoms reactions with water leading to hydrogen peroxide. J. Phys. D Appl. Phys. 2020, 53, 2755204. [Google Scholar] [CrossRef]
- Weiss, J. The Free radical mechanism in the reactions of hydrogen peroxide. Adv. Catal. 1952, 4, 343–365. [Google Scholar] [CrossRef]
- Simpson, J.A.; Cheeseman, K.H.; Smith, S.E.; Dean, R.T. Free-radical generation by copper ions and hydrogen peroxide. Biochem. J. 1988, 254, 519–523. [Google Scholar] [CrossRef] [Green Version]
- Hanna, P.M.; Mason, R.P. Direct evidence for inhibition of free radical formation from Cu(I) and hydrogen peroxide by glutathione and other potential ligands using the EPR spin-trapping technique. Arch. Biochem. Biophys. 1992, 295, 205–213. [Google Scholar] [CrossRef]
- Assaf, E.; Fittschen, C. Cross section of OH radical overtone transition near 7028 cm−1 and measurement of the rate constant of the reaction of OH with HO2 radicals. J. Phys. Chem. A 2016, 120, 7051–7059. [Google Scholar] [CrossRef]
- Abd Elhamid, M.H.; Ateya, B.G.; Weil, K.G.; Pickering, H.W. Calculation of the hydrogen surface coverage and rate constants of the hydrogen evolution reaction from polarization data. J. Electrochem. Soc. 2000, 147, 2148–2150. [Google Scholar] [CrossRef]
- Wang, L.; Jiang, J.; Ma, J.; Pang, S.; Zhang, T. A review on advanced oxidation processes homogeneously initiated by copper(II). Chem. Eng. J. 2022, 427, 131721. [Google Scholar] [CrossRef]
- Thiebaud, J.; Aluculesei, A.; Fittschen, C. Formation of HO2 radicals from the photodissociation of H2O2 at 248 nm. J. Chem. Phys. 2007, 126, 186101. [Google Scholar] [CrossRef]
- Hargittai, M.; Schwerdtfeger, P.; Réffy, B.; Brown, R. The molecular structure of different species of cuprous chloride from gas-phase electron diffraction and quantum chemical calculations. Chem. Eur. J. 2003, 9, 327–333. [Google Scholar] [CrossRef]
- Tian, Z.; Cheng, L. First principles study on the structural evolution and properties of (MCl)n (n = 1 − 12, M = Cu, Ag) clusters. RSC Adv. 2016, 6, 30311–30319. [Google Scholar] [CrossRef]
- Plitt, H.S.; Bär, M.R.; Ahlrichs, R.; Schnöckel, H. [Cu(η2-H2)Cl], a model compound for H2 complexes. Ab initio calculations and identification by IR spectroscopy. Angew. Chem. Int. Ed. Engl. 1991, 30, 832–834. [Google Scholar] [CrossRef]
- Belyung, D.P.; Hranisavljevic, J.; Kashireninov, O.E.; Santana, G.M.; Fontijn, A.; Marshall, P. Laser-induced fluorescence and mass spectrometric studies of the Cu + HCl reaction over a wide temperature range. Formation of HCuCl. J. Phys. Chem. 1996, 100, 17835–17839. [Google Scholar] [CrossRef] [Green Version]
- Mårtensson, P.; Larsson, K.; Carlsson, J.O. Atomic layer epitaxy of copper: An ab initio investigation of the CuCl/H2 process: I. Adsorption of CuCl on Cu(111). Appl. Surf. Sci. 1998, 136, 137–146. [Google Scholar] [CrossRef]
- Mårtensson, P.; Larsson, K.; Carlsson, J.O. Atomic layer epitaxy of copper: An ab initio investigation of the CuCl/H2 process: II. Reaction energies. Appl. Surf. Sci. 1999, 148, 9–16. [Google Scholar] [CrossRef]
- Mårtensson, P.; Larsson, K.; Carlsson, J.O. Atomic layer epitaxy of copper: An ab initio investigation of the CuCl/H2 process: III. Reaction barriers. Appl. Surf. Sci. 2000, 157, 92–100. [Google Scholar] [CrossRef]
- Zhang, L.; Zhou, M.; Chen, M.; Qin, Q. Dioxygen bound to copper and nickel halides: Matrix-isolation FTIR and DFT studies on ClCu(O2) and ClNi(O2) molecules. Chem. Phys. Lett. 2000, 325, 447–452. [Google Scholar] [CrossRef]
- Xia, F.F.; Yi, H.B.; Zeng, D. Hydrates of Cu2+ and CuCl+ in dilute aqueous solution: A density functional theory and polarized continuum model investigation. J. Phys. Chem. A 2010, 114, 8406–8416. [Google Scholar] [CrossRef]
- Suleiman, I.A.; Mackie, J.C.; Kennedy, E.M.; Radny, M.W.; Dlugogorski, B.Z. Quantum chemical study of copper(II) chloride and the Deacon reaction. Chem. Phys. Lett. 2011, 501, 215–220. [Google Scholar] [CrossRef]
- Zhang, R.; Liu, H.; Wang, B.; Ren, J.; Li, Z. Adsorption and dissociation of O2 on CuCl(1 1 1) surface: A density functional theory study. Appl. Surf. Sci. 2011, 258, 408–413. [Google Scholar] [CrossRef]
- Kawaguchi, K.; Ito, H.; Kuwahara, T.; Higuchi, Y.; Ozawa, N.; Kubo, M. Atomistic mechanisms of chemical mechanical polishing of a Cu surface in aqueous H2O2: Tight-binding quantum chemical molecular dynamics simulations. ACS Appl. Mater. Interfaces 2016, 8, 11830–11841. [Google Scholar] [CrossRef]
- Garg, P.; Rawat, K.S.; Bhattacharyya, G.; Kumar, S.; Pathak, B. Hexagonal CuCl monolayer for water splitting: A DFT study. ACS Appl. Nano Mater. 2019, 2, 4238–4246. [Google Scholar] [CrossRef]
- Wen, J.; Ma, T.; Zhang, W.; van Duin, A.C.; van Duin, D.M.; Hu, Y.; Lu, X. Atomistic insights into Cu chemical mechanical polishing mechanism in aqueous hydrogen peroxide and glycine: ReaxFF reactive molecular dynamics simulations. J. Phys. Chem. C 2019, 123, 26467–26474. [Google Scholar] [CrossRef]
- Wu, P.; Yan, S.; Fang, W.; Wang, B. Molecular mechanism of the mononuclear copper complex-catalyzed water oxidation from cluster-continuum model calculations. ChemSusChem 2022, 15, e202102508. [Google Scholar] [CrossRef]
- Wang, F.; Xia, C.; de Visser, S.P.; Wang, Y. How does the oxidation state of palladium surfaces affect the reactivity and selectivity of direct synthesis of hydrogen peroxide from hydrogen and oxygen gases? A density functional study. J. Am. Chem. Soc. 2018, 141, 901–910. [Google Scholar] [CrossRef] [Green Version]
- Sun, K.; Song, X.; Hao, X.; Su, H.-Y.; Xu, Y. Application of coverage-dependent micro-kinetic study to investigate direct H2O2 synthesis mechanism on Pd(111) surface. Theor. Chem. Acc. 2020, 139, 170. [Google Scholar] [CrossRef]
- Chen, L.; Medlin, J.W.; Grönbeck, H. On the reaction mechanism of direct H2O2 formation over Pd catalysts. ACS Catal. 2021, 11, 2735–2745. [Google Scholar] [CrossRef]
- Kim, M.-C.; Han, S.S. Electrochemically modeling a nonelectrochemical system: Hydrogen peroxide direct synthesis on palladium catalysts. J. Phys. Chem. Lett. 2021, 12, 4490–4495. [Google Scholar] [CrossRef]
- Han, G.-H.; Lee, S.-H.; Hwang, S.-Y.; Lee, K.-Y. Advanced development strategy of nano catalyst and DFT calculations for direct synthesis of hydrogen peroxide. Adv. Energy Mater. 2021, 11, 2003121. [Google Scholar] [CrossRef]
- Orbán, M.; Epstein, I.R. Chemical oscillators in group VIA: The Cu(II)-catalyzed reaction between hydrogen peroxide and thiosulfate ion. J. Am. Chem. Soc. 1987, 109, 101–106. [Google Scholar] [CrossRef]
- Kurin-Csörgei, K.; Orbán, M.; Rábai, G.; Epstein, I.R. Model for the oscillatory reaction between hydrogen peroxide and thiosulfate catalysed by copper(II) ions. J. Chem. Soc. Faraday Trans. 1996, 92, 2851–2855. [Google Scholar] [CrossRef]
- Gao, J.; Li, Q.; Yang, W.; Liu, X.; Ren, J.; Yang, H.; Deng, H. Determination of L-valine based on an oscillating chemical reaction. Electroanalysis 2002, 14, 1191–1196. [Google Scholar] [CrossRef]
- Pekala, K.; Jurczakowski, R.; Orlik, M. On the interpretation of the potentiometric response of the inert solid electrodes in the monitoring of the oscillatory processes involving hydrogen peroxide. J. Solid State Electrochem. 2010, 14, 27–34. [Google Scholar] [CrossRef]
- Sorouraddin, M.H.; Iranifam, M.; Amini, K. A new enhanced oscillating chemiluminescence system with increased chemiluminescence intensity and oscillation time. J. Fluoresc. 2008, 18, 443–451. [Google Scholar] [CrossRef] [PubMed]
- Gentili, P.L.; Micheau, J.-C. Light and chemical oscillations: Review and perspectives. J. Photochem. Photobiol. C Photochem. Rev. 2020, 43, 100321. [Google Scholar] [CrossRef]
- Jingyan, S.; Yuwen, L.; Jie, L.; Zhiyong, W.; Cunxin, W. Calorimetry studies of a chemical oscillatory system. J. Therm. Anal. Cal. 2007, 90, 761–767. [Google Scholar] [CrossRef]
- Kashima-Tanaka, M.; Tsujimoto, Y.; Yamazaki, M. Quantification of hydroxyl radical generated from the Fe2+-H2O2 and Cu2+-H2O2 reaction systems by electron spin resonance stop and flow technique. Int. J. Oral-Med. Sci. 2002, 1, 67–73. [Google Scholar] [CrossRef]
- Nakanishi, S.; Mukouyama, Y.; Nakato, Y. Control of the period of an electrochemical oscillation by atomic-or nanometer-scale modifications and structural changes of electrode surfaces in a system of H2O2 reduction at Pt electrodes. J. Electrochem. Soc. 2001, 148, E405. [Google Scholar] [CrossRef]
- Mukouyama, Y.; Hara, D.; Kawasaki, H.; Kikuchi, M.; Yamada, Y.; Nakanishi, S. Bifurcation behavior in oscillations during H2O2 reduction at Pt electrodes. ECS Transactions 2017, 75, 113–121. [Google Scholar] [CrossRef]
- Okada, H.; Mizuochi, R.; Sakurada, Y.; Nakanishi, S.; Mukouyama, Y. Electrochemical oscillations (named oscillations H and K) during H2O2 reduction on Pt electrodes induced by a local pH increase at the electrode surface. J. Electrochem. Soc. 2021, 168, 076512. [Google Scholar] [CrossRef]
- Voeikov, V.L.; Koldunov, V.V.; Kononov, D.S. New oscillatory process in aqueous solutions of compounds containing carbonyl and amino groups. Kinet. Catal. 2001, 42, 606–608. [Google Scholar] [CrossRef]
- Ji, L.; Wang, H.; Hou, X. Complexation amplified pH oscillation in metal involved systems. J. Phys. Chem. A 2012, 116, 7462–7466. [Google Scholar] [CrossRef]
- Jędrusiak, M.; Matyszczak, G.; Orlik, M. On the phase shifts in the dynamics of the H2O2–Na2S2O3–H2SO4–CuSO4 oscillator revealed by comparison of potentiometric responses of different indicator electrodes. Int. J. Chem. Kin. 2017, 49, 250–258. [Google Scholar] [CrossRef]
- Kurin-Csörgei, K.; Poros-Tarcali, E.; Molnár, I.; Orbán, M.; Szalai, I. Chemical oscillations with sodium perborate as oxidant. Front. Chem. 2020, 8, 561788. [Google Scholar] [CrossRef]
- Kiatisevi, S.; Maisch, S. Study of the oscillation and luminol chemiluminescence in the H2O2–KSCN–CuSO4–NaOH system. Chem. Phys. Lett. 2010, 499, 173–177. [Google Scholar] [CrossRef]
- Orbán, M.; Kurin-Csörgei, K.; Rábai, G.; Epstein, I.R. Mechanistic studies of oscillatory copper(II) catalyzed oxidation reactions of sulfur compounds. Chem. Eng. Sci. 2000, 55, 267–273. [Google Scholar] [CrossRef]


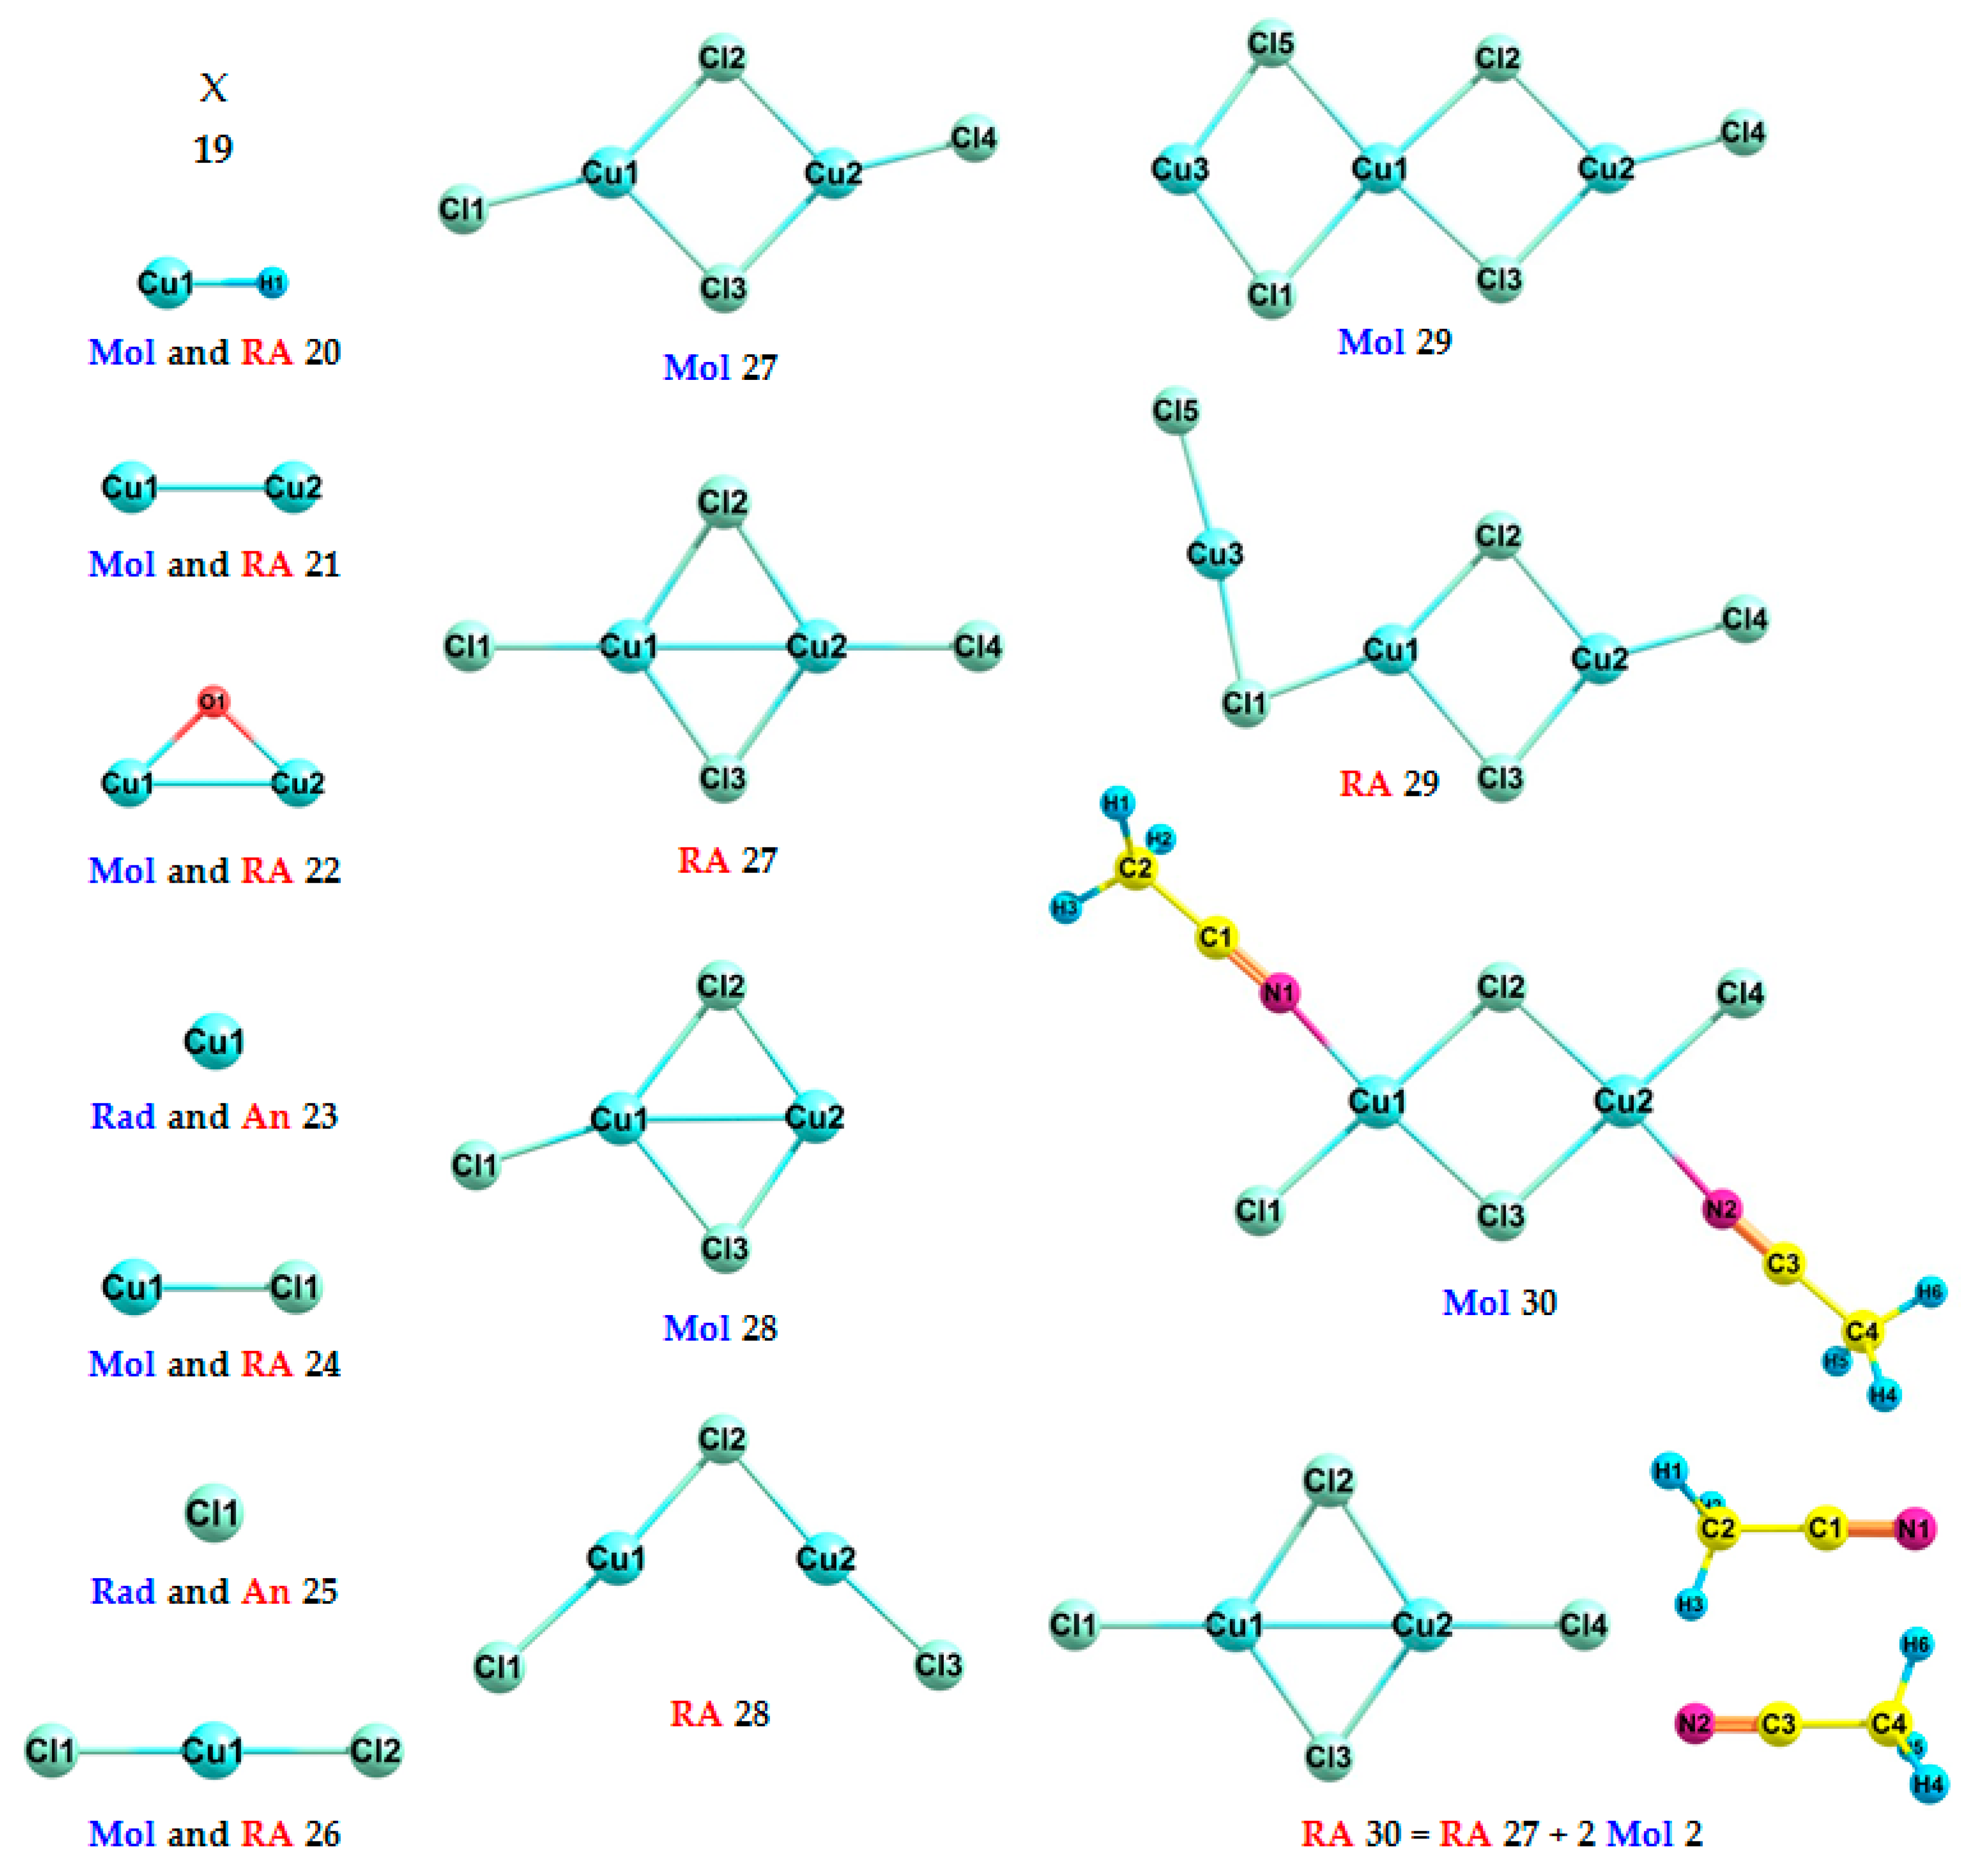
| Formula | No. | Exp. | DFT | A·DFT+B | E(Mol or Radical) | E(RA or Anion) |
|---|---|---|---|---|---|---|
| X | 19 | 5.00 | 4.66 | 5.00 | - | - |
| CuH | 20 | 0.444 ± 0.006 [64] | −0.21 | 0.34 | −1640.833185884078 | −1640.825562232613 |
| Cu2 | 21 | 0.88 ± 0.02 [65] | 0.45 | 0.97 | −3280.540332075323 | −3280.557003438048 |
| Cu2O | 22 | 1.10 ± 0.03 [66] | 0.6 | 1.12 | −3355.687224138422 | −3355.709345013066 |
| Cu | 23 | 1.235 ± 0.005 [67] | 0.67 | 1.18 | −1640.236451203338 | −1640.261078219124 |
| CuCl | 24 | - | 0.91 | 1.41 | −2100.368056439018 | −2100.401477462000 |
| Cl | 25 | 3.6127 ± 0.0001 [68] | 3.27 | 3.67 | −459.996618462930 | −460.116771209037 |
| CuCl2 | 26 | 4.3 ± 0.1 [63] | 4.00 | 4.37 | −2560.458515677480 | −2560.605611152270 |
| Cu2Cl4 | 27 | 4.6 ± 0.1 [63] | 4.32 | 4.67 | −5120.975980754558 | −5121.134650902112 |
| Cu2Cl3 | 28 | 5.0 ± 0.2 [63] | 4.36 | 4.70 | −4660.897876026251 | −4661.057919072903 |
| Cu3Cl5 | 29 | - | 4.68 | 5.02 | −7221.407385765084 | −7221.579242854321 |
| Cu2Cl4·2AN | 30 | - | 3.07 | 3.48 | −5386.306768478984 | −5386.419549320808 |
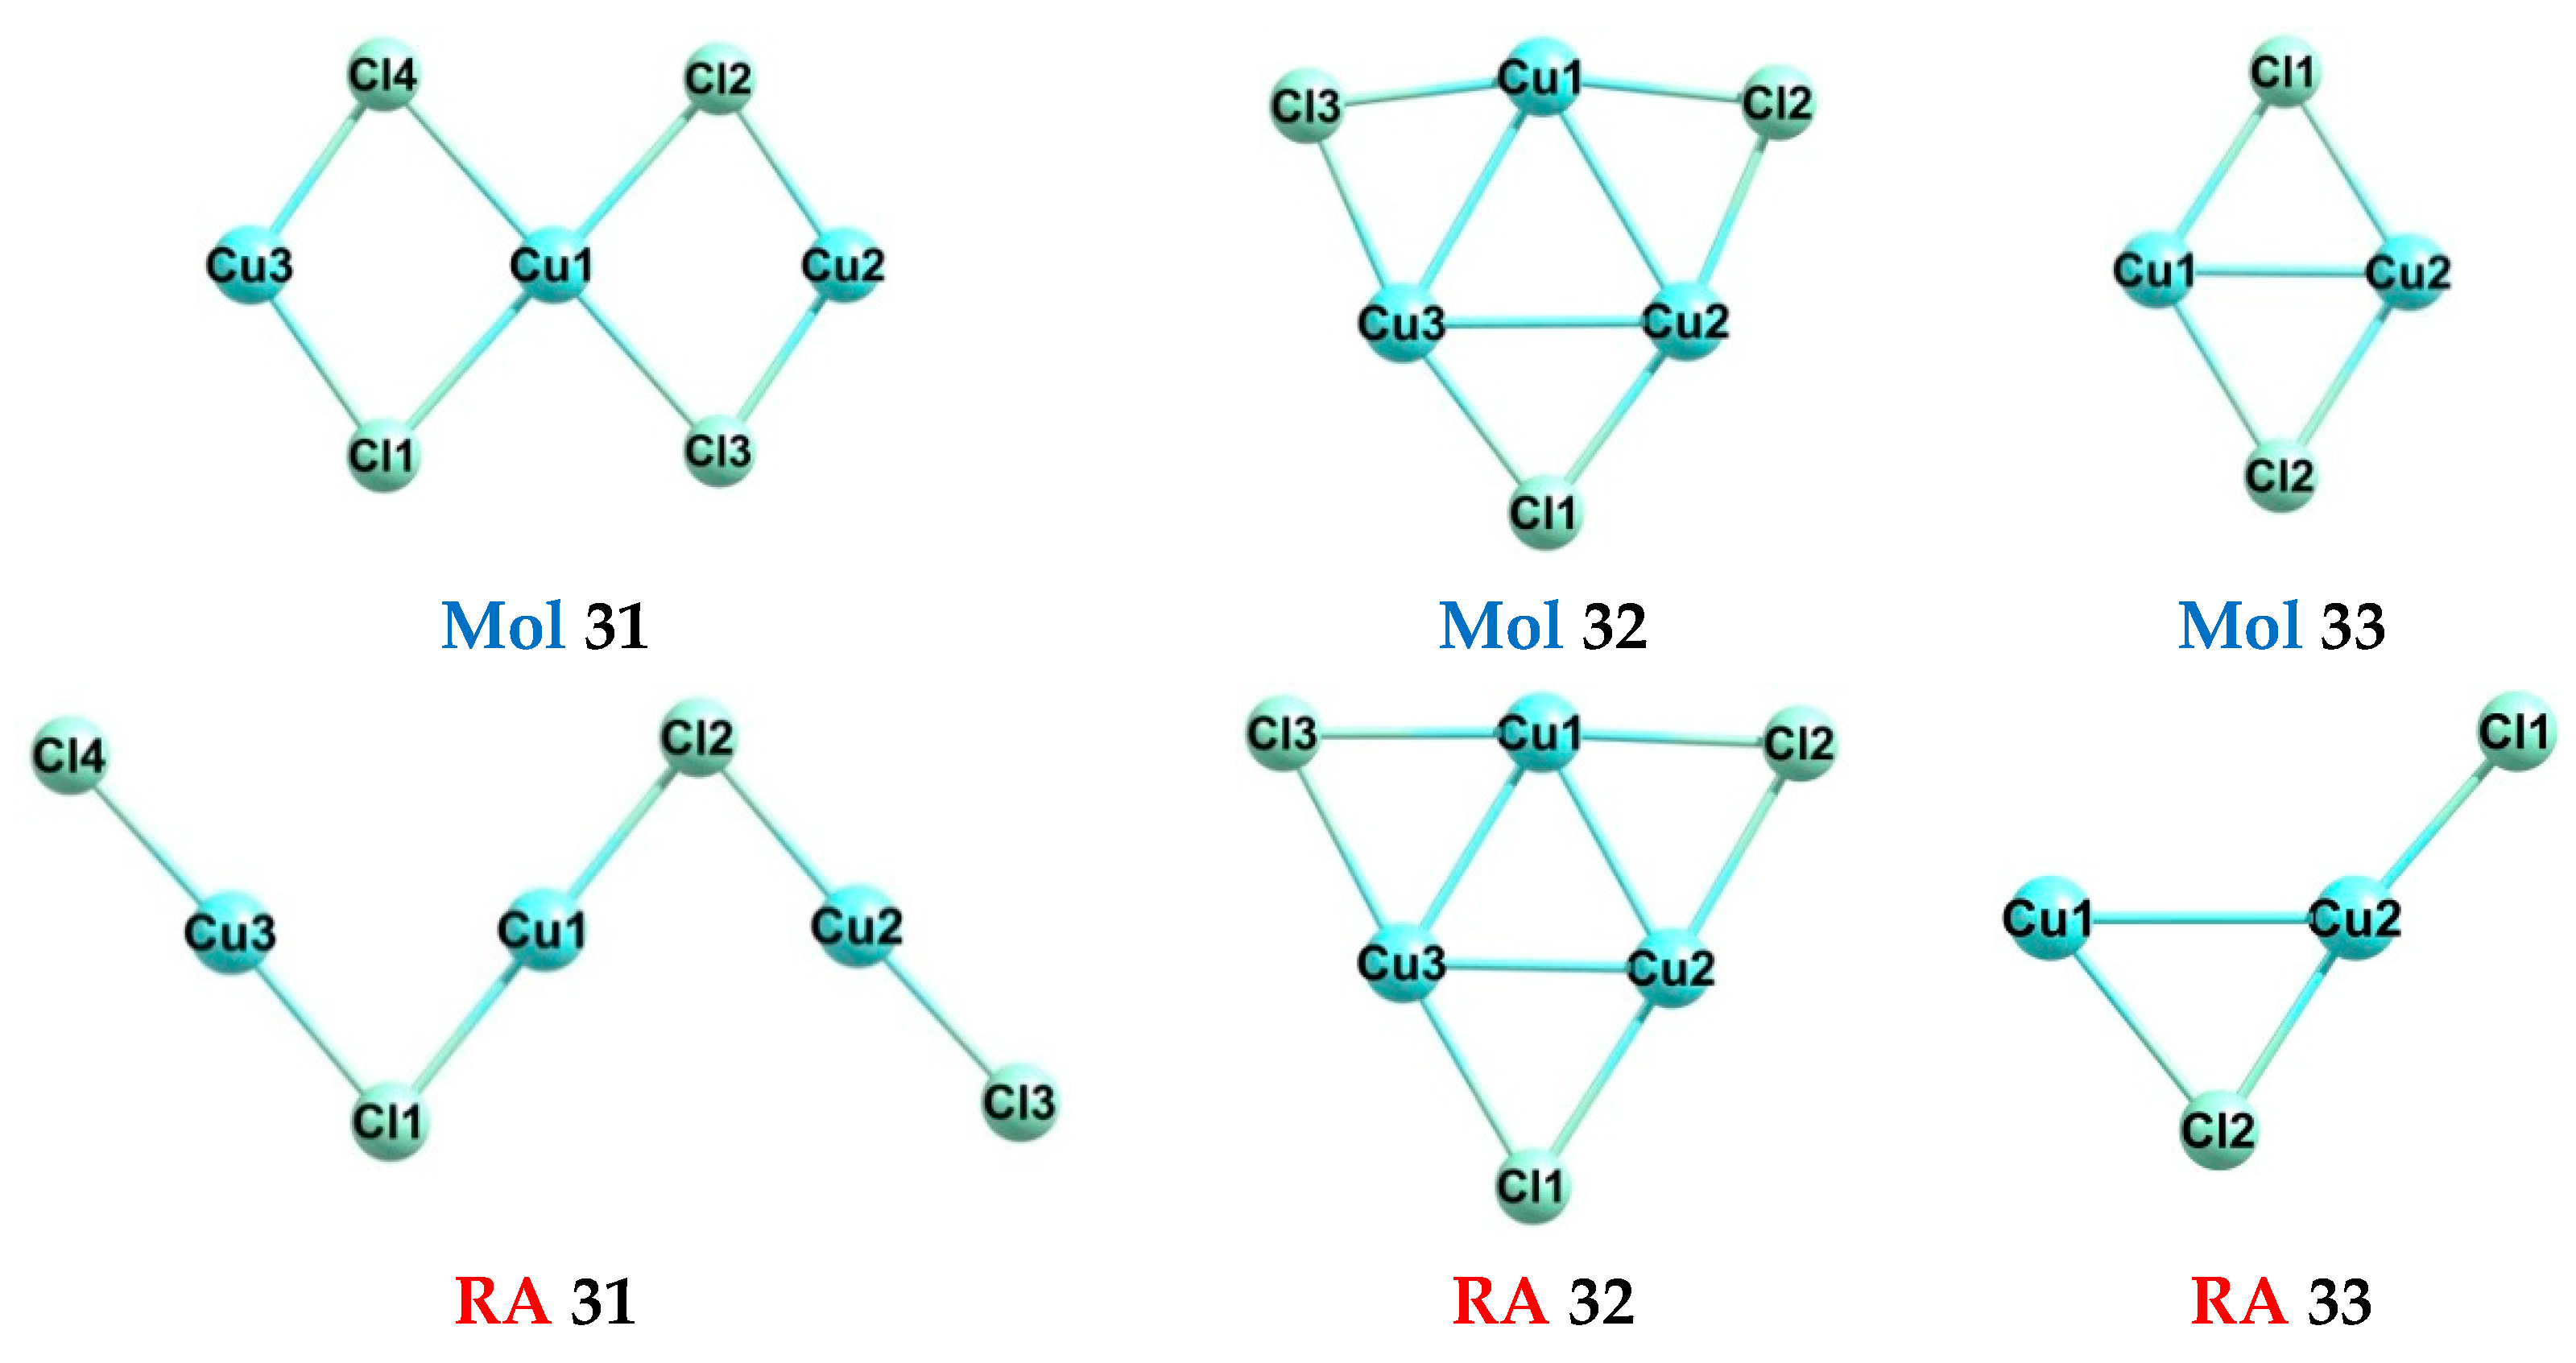
| Formula | No. | Exp. | DFT | A·DFT+B | E(Mol) | E(RA) |
|---|---|---|---|---|---|---|
| Cu3Cl4 | 31 | - | 5.01 | 5.32 | −6761.320975170130 | −6761.504989147751 |
| Cu3Cl3 | 32 | - | 0.24 | 0.78 | −6301.307588396459 | −6301.316250677407 |
| Cu2Cl2 | 33 | - | 1.37 | 1.86 | −4200.819250735715 | −4200.869614232684 |
Disclaimer/Publisher’s Note: The statements, opinions and data contained in all publications are solely those of the individual author(s) and contributor(s) and not of MDPI and/or the editor(s). MDPI and/or the editor(s) disclaim responsibility for any injury to people or property resulting from any ideas, methods, instructions or products referred to in the content. |
© 2023 by the authors. Licensee MDPI, Basel, Switzerland. This article is an open access article distributed under the terms and conditions of the Creative Commons Attribution (CC BY) license (https://creativecommons.org/licenses/by/4.0/).
Share and Cite
Shchapin, I.Y.; Nekhaev, A.I. The Boundary between Two Modes of Gas Evolution: Oscillatory (H2 and O2) and Conventional Redox (O2 Only), in the Hydrocarbon/H2O2/Cu(II)/CH3CN System. Hydrogen 2023, 4, 74-102. https://doi.org/10.3390/hydrogen4010006
Shchapin IY, Nekhaev AI. The Boundary between Two Modes of Gas Evolution: Oscillatory (H2 and O2) and Conventional Redox (O2 Only), in the Hydrocarbon/H2O2/Cu(II)/CH3CN System. Hydrogen. 2023; 4(1):74-102. https://doi.org/10.3390/hydrogen4010006
Chicago/Turabian StyleShchapin, Igor Yu., and Andrey I. Nekhaev. 2023. "The Boundary between Two Modes of Gas Evolution: Oscillatory (H2 and O2) and Conventional Redox (O2 Only), in the Hydrocarbon/H2O2/Cu(II)/CH3CN System" Hydrogen 4, no. 1: 74-102. https://doi.org/10.3390/hydrogen4010006