
Reduction of High-Temperature Damage on Paeonia ostii through Intercropping with Carya illinoinensis
1
College of Horticulture and Landscape Architecture, Yangzhou University, Yangzhou 225009, China
2
Joint International Research Laboratory of Agriculture and Agri-Product Safety, The Ministry of Education of China, Institutes of Agricultural Science and Technology Development, Yangzhou University, Yangzhou 225009, China
*
Author to whom correspondence should be addressed.
Horticulturae 2022, 8(12), 1201; https://doi.org/10.3390/horticulturae8121201
Submission received: 24 October 2022
/
Revised: 6 December 2022
/
Accepted: 12 December 2022
/
Published: 15 December 2022
(This article belongs to the Section Biotic and Abiotic Stress)
Abstract
:Paeonia ostii is an emerging woody oil crop, but the high temperature in summer is extremely unfavorable for its growth and development. Understory intercropping cultivation would provide shaded environments which could effectively reduce the ambient temperature. In order to explore whether understory intercropping cultivation would reduce the effects of high-temperature stress on P. ostii, the changes of leaf physiological indicators and leaf microstructures of sole-cropping and intercropping P. ostii were investigated. P. ostii that intercropping cultivated under Illinois pecans (Carya illinoinensis (Wangenh.) K. Koch) with 4 m × 4 m and 4 m × 8 m rowing spaces were used as samples in this study. The results showed that with continuous high temperature, the high-temperature damage index of P. ostii kept increasing, whereas the leaf relative water content continued to decline. Compared to sole-cropping, the high-temperature damage index, relative electrical conductivity, proline content, antioxidant enzymes superoxide dismutase (SOD), and ascorbate peroxidase (APX) activities of intercropping P. ostii under C. illinoinensis were significantly decreased, whereas the leaf relative water content was higher. Moreover, compared to sole-cropping, intercropping P. ostii under C. illinoinensis increased SPAD and chlorophyll contents, made mesophyll cell ultrastructures more intact, and made the chloroplasts rounder and more filled with starch granules and lipid globules, leading to enhanced photosynthesis (Pn) and transpiration rates (Tr). Notably, the reduction of high-temperature damage on intercropping P. ostii under C. illinoinensis with 4 m × 4 m rowing spaces was more significant than that under C. illinoinensis with 4 m × 8 m rowing spaces. This research provides some reference values for efficient plantation of P. ostii in the middle and lower reaches of the Yangtze River in China.
1. Introduction
Understory cultivation refers to adopting the principles of ecological economics and considering the growing habits of plants so as to design an efficient spatial hierarchy. It is a planting method where low crops and trees are reasonably placed according to a certain row spacing in the same land unit [1]. In recent decades, China has vigorously promoted the development of the understory cultivation because it not only brings about ecological benefits that would be in line with China’s current promotion of the sustainable development concept, but also increases the income level of forest farmers. In foreign countries, understory cultivation has been proved to fully take advantage of resources like light, water, and fertilizer to form a field microclimate, improving the ecological environment by optimizing land use [2], improving soil structure [3], and increasing organic matter contents [4], microbial activity [5], carbon sequestration [6], and effectively improving the economic benefits of agricultural development [6].
With the intensification effects of the global greenhouse, the damage of high-temperature stress to plants has attracted more attention. The damage of high-temperature stress to plant growth and development is mainly reflected in morphological anatomy, physiology, and biochemistry [7]. High-temperature stress can significantly reduce the photosynthetic efficiency of plants, leading to damage to or even the disintegration of chloroplasts, which affects the synthesis of photosynthetic pigments such as chlorophyll a (Chl a), chlorophyll b (Chl b), and carotenoids, thereby reducing photosynthetic characteristics. In addition, high-temperature stress would break the balance of free radicals in plants, resulting in the increasing of reactive oxygen species (ROS) and proline. At the same time, the protective enzyme system in plants would activate the protective mechanism to protect cells from injury or reduce injury [8,9,10]. The understory cultivation system would provide a shaded environment for the understory plants when the light was intercepted by the tree canopy [11,12]. This shaded environment, combined with the local microclimate of understory cultivation and complementary resource allocation, could effectively reduce the ambient temperature and the surface temperature of plant leaves, which is a promising practice to reduce excessive heat during the day. For example, Zaro et al. [13] concluded that the agroforestry system of coffee (Coffea arabica Linn.) and rubber trees (Hevea brasiliensis Müell. Arg.) contributed to C. arabica crop adaptations to a future warmer environment as the systems attenuate mean temperatures by 1~2 °C to maintain suitable production conditions. Wang et al. [14] established a jujube (Zizyphus jujuba Mill.)-cotton (Gossypium hirsutum Linn.) intercropping agroforestry system in the south and north of the Xinjiang Uygur autonomous region, and the research demonstrated that compared with corresponding sole-cropping G. hirsutum, the photosynthetically active radiation of intercropping was 12.75~13.04% lower; moreover, intercropping changed the daily dynamics of air temperature, especially at high-temperatures, under which the decrease range was significant by 6.49~13.57% compared with sole-cropping.
Oil tree peony is an emerging woody oil crop, and the main varieties that approved for commercial production are Paeonia rockii and Paeonia ostii. P. ostii belongs to the Jiangnan variety ecotype group of tree peony, and prefers cool and moderately shaded environments in summer [15]. Most of the middle and lower reaches of the Yangtze River in China have a humid subtropical climate, with high temperature and humidity conditions in summer. Due to the influence of global warming, the temperature in this area is rising in the summer. These conditions are extremely unfavorable for the growth and development of P. ostii. Therefore, how to reduce the damage of high-temperature stress in summer to P. ostii has become an urgent problem to be solved. Currently, most research efforts concerning intercropping P. ostii were mainly devoted to its effects on photosynthesis, growth, yield, and seed oil quality [16,17]; however, whether there are reduction of high-temperature damage on intercropping P. ostii has rarely been reported. In order to investigate the reduction of high-temperature damage on intercropping P. ostii, the physiological indicators and microstructures of leaves in sole-cropping P. ostii and intercropping P. ostii under illinois pecans (Carya illinoinensis (Wangenh.) K. Koch) were explored in this study. This would provide some reference values for efficient plantation of P. ostii in the middle and lower reaches of the Yangtze River in China.
2. Materials and Methods
2.1. Materials
This study was conducted in Jiangsu Sci-tech Garden of Chinese Medicine (32°22′ N, 119°58′ E) in June and July 2021. The row spacing of P. ostii is 0.6 m × 0.6 m regardless of sole-cropping or intercropping. The row spacing of C. illinoinensis is 4 m × 8 m and 4 m × 4 m, respectively. From 10 June to 25 July, high-temperature damage index, SPAD values, and photosynthetic characteristics were measured every 15 days between 8:30 to 10:30. After each measurement, leaves were randomly collected as samples, immediately put into an ice box and sent to the laboratory. Among the leaves for study, a few were fixed with 2.5% glutaraldehyde for scanning electron microscope (SEM) and transmission electron microscope (TEM) observations, and the rest were for the analysis of physiological indicators including ROS accumulation, leaf relative water content, relative electrical conductivity, proline content, antioxidant enzyme activities, and photosynthetic pigments.
2.2. High-Temperature Damage Index
The standard of high-temperature damage grade was based on herbaceous peony (Paeonia lactiflora Pall.) [18] and takes the damage of P. ostii branches and leaves under high-temperature stress in summer into the consideration. The high-temperature damage level is classified into 5 levels, and the specific standards are as follows: Grade 0, all branches have no symptoms of high-temperature damage; Grade 1, there are withered spots on less than 1/4 of the leaves on a single branch; Grade 2, 1/4~1/2 leaves on a single branch have scorched edges; Grade 3, 1/2~3/4 of the leaves on a single branch are scorched or perforated; Grade 4, more than 3/4 of the leaves on a single branch are scorched; Grade 5, all the leaves of the plant are either withered or dead. The high-temperature damage index is calculated by the formula:
High-temperature damage index = Σ(number of graded plant × grade)/(highest
grade × total number of plant).
grade × total number of plant).
2.3. High-Temperature Damage Index
Leaf relative water content was determined by oven-drying method. First, fresh leaves were weighed on an analytical balance (BSA224S, Sartorius Company, Gottingen, Germany), the results of which were denoted as the fresh weight (FW). Then, the leaves were placed in an oven (9423A, Jinghong Laboratory Instrument Co., Ltd., Shanghai, China) at 105 °C for 5 min followed by 65 °C until a constant weight was reached. Finally, the leaves were weighed, which was recorded as dry weight (DW). The leaf relative water content (%) was then calculated by the formula:
Relative water content (%) = (FW − DW)/FW × 100.
2.4. ROS Accumulation Level Measurement
The accumulation of hydrogen peroxide (H2O2) was observed by diaminoaniline (DAB) staining [19]. A 0.1 mg/mL pH 5.0 DAB staining solution was prepared with 50 mM Tris-acetate buffer. Fresh leaves were immersed in the dye solution in the dark for 24 h. Then, the leaves were put into the 95% alcohol in a boiling water bath for 15 min, after which the leaves were removed for imaging.
The accumulation of superoxide radicals (O2·−) was observed by a reagent kit (HL70050, Shanghai Haling Biotechnology Co., Ltd., Shanghai, China). First, fresh leaves were cut quickly with a double-sided blade, avoiding the main veins, after which the samples were cleaned with distilled water on a slide. Then, 10 μL of dihydroethidium (DHE) fluorescence dye was added. The samples were subsequently incubated at 37 °C in the dark for 20 min. Finally, a fluorescence microscope (Axio Imager D2, ZEISS, Oberkochen, Germany) was used to observe and image the samples.
2.5. Relative Electrical Conductivity Measurement
Relative electrical conductivity was determined according to the methods reported by Xu et al. [20]. Fresh leaves were cleaned with deionized water and then a hole puncher with a diameter of 1 cm was used to punch holes in the leaves to obtain small leaf discs. The discs (0.1 g) were weighed and placed into a syringe containing deionized water. After vacuuming, the sample was transferred to a glass tube filled with 20 mL of deionized water and made to sit for 4 h. The initial solution conductivity (C1) and deionized water conductivity (C0) were measured with a conductivity meter (DDS-307, Shanghai Lei Magnetic Instrument Co., Ltd., Shanghai, China). Subsequently, the glass tube was heated in a boiling water bath for 30 min, cooled to room temperature, and the conductivity (C2) was measured. Relative electrical conductivity is calculated according to the following formula:
Relative electrical conductivity (%) = (C1 − C0)/(C2 − C0) × 100.
2.6. Proline Content Measurement
The proline content was determined by spectrophotometry with reference to the instructions of the Proline Dehydrogenase (ProDH) Measurement Kit (ProDH-2-Y, Suzhou Keming Biotechnology Co., Ltd., Suzhou, China). The extraction solution and Reagents 1~4 were provided by the kit, and the specific steps were as follows: (1) Weighed 0.1 g (W) of fresh leaves and added liquid nitrogen to grind into powder, added 1 mL of extracting solution, homogenized, and then placed it in a 95 °C water bath for shaking extraction. Took out after 10 min, centrifuged 10,000× g at 25 °C for 10 min, and took the supernatant for testing. (2) Took 0.5 mL of sample into a centrifuge tube, added 0.5 mL of Reagent 1 and Reagent 2, respectively, and continued to water bath for 30 min. (3) After cooling, added 1 mL of Reagent 3 and shook for 30 s to transfer the pigment to Reagent 3. Drew 1 mL of the upper layer solution into the cuvette and measured the absorbance value A at a wavelength of 520 nm. (4) The proline content was calculated as follows:
Proline content (μg/g FW) = 19.2 × (A + 0.0021)/W.
2.7. Antioxidant Enzyme Activities Measurement
The activities of superoxide dismutase (SOD), peroxidase (POD), catalase (CAT), and ascorbate peroxidase (APX) were determined by spectrophotometry according to the instructions of the corresponding kits including SOD Measurement Kit, POD Measurement Kit, CAT Measurement Kit, and APX Measurement Kit (SOD-2-Y, POD-2-Y, CAT-2-Y, APX-2-W; Suzhou Keming Biotechnology Co., Ltd., Suzhou, China), respectively. Specific steps are as follows.
2.7.1. SOD Activity
The extraction solution and Reagents 1~4 were provided by the kit, and the specific steps were as follows: (1) Weighed 0.1 g (W) fresh leaves and added liquid nitrogen to grind into powder, added 1 mL of extraction solution, homogenized in an ice bath, centrifuged at 8000× g at 4 °C for 10 min, and took the supernatant. (2) Diluted Reagent 2 twice and dissolved Reagent 4 in 5 mL of distilled water first, followed by diluting it four times for further use. (3) Placed Reagents 1, 3, and 4 in a 25 °C water bath for 5 min. (4) Added 240 μL of Reagent 1, 6 μL of Reagent 2, 90 μL of sample, 180 μL of Reagent 3, and 510 μL of Reagent 4 in turn to the centrifuge tube. Added 90 μL of distilled water to the control tube instead of the sample and mixed it thoroughly. After standing still at room temperature for 30 min, the absorbance A at 560 nm was measured. (5) SOD activity was calculated as follows:
Inhibition percentage (%) = (A control tube − A assay tube)/A control tube × 100;
SOD activity (U/g FW) = 11.4 × inhibition percentage/(1 − inhibition percentage)/W.
2.7.2. POD Activity
The extraction solution and Reagents 1~3 were provided by the kit, and the specific steps were as follows: (1) Weighed 0.1 g (W) fresh leaves and added liquid nitrogen to grind into powder, added 1 mL of extraction solution, homogenized in an ice bath, centrifuged at 8000× g at 4 °C for 10 min, and took the supernatant. (2) Before measurement, mixed Reagent 1, 2, and 3 at a ratio of 2.6 (mL): 1.5 (μL): 1 (μL) and placed them in a 25 °C water bath for 10 min. (3) Added 50 μL of the sample and 950 μL of the above mixture to the cuvette, respectively, mixed well, measured the absorbance values A1 and A2 at 470 nm for 1 min and 2 min, respectively, and calculated ΔA = A2 − A1. (4) POD activity was calculated as follows:
POD activity (U/g FW) = 2000 × ΔA/W.
2.7.3. CAT Activity
The extraction solution and working solution were provided by the kit, and the specific steps were as follows: (1) Weighed 0.1 g (W) fresh leaves and added liquid nitrogen to grind into powder, added 1 mL of extraction solution, homogenized in an ice bath, centrifuged at 8000× g at 4 °C for 10 min, and took the supernatant. (2) Put the working solution in a 25 °C water bath for 10 min. (3) Added 35 μL of sample and 1 mL of preheated working solution to the cuvette, mixed well, measured the absorbance values A1 and A2 at 240 nm at the beginning and after 1 min, respectively, and calculated ΔA = A1 − A2. (4) CAT activity was calculated as follows:
CAT activity (nmol/min/g FW) = 678 × ΔA/W.
2.7.4. APX Activity
The Reagents 1~3 were provided by the kit, and the specific steps were as follows: (1) Weighed 0.1 g (W) of fresh leaves and added liquid nitrogen to grind into powder, added 1 mL of Reagent 1, homogenized in an ice bath, centrifuged at 13,000× g at 4 °C for 20 min, and took the supernatant. (2) Placed Reagent 1 in a 25 °C water bath for 30 min. (3) Added 100 μL of supernatant, 700 μL of preheated Reagent 1, 100 μL of Reagent 2 and 100 μL of Reagent 3 in sequence to the cuvette, mixed well, measured the absorbance values A1 and A2 at 290 nm for 10 s and 130 s, respectively, and calculated ΔA = A1 − A2; (4) APX activity was calculated as follows:
APX activity (nmol/min/g FW) = 1786 × ΔA/W.
2.8. SPAD Values and Photosynthetic Pigment Measurement
Leaves of the third node of P. ostii from top to bottom were selected avoiding the main leaf veins, a portable chlorophyll meter (Minolta SPAD-502, Koinca Minolia sensing, Tokyo, Japan) was used to measure the SPAD value. Each treatment should measure SPAD value of 3~6 pieces of leaves each time, and be repeated three times.
The determination of photosynthetic pigment content was conducted according to the method reported by Lichtenthaler [21]. Weighed 0.2 g of fresh leaves into a mortar, added 12 mL of 95% ethanol, fully ground it until the tissue turned white, and let it stay still for 3–5 min. Filtered it through qualitative filter paper into a 25 mL brown volumetric flask, rinsed the filter paper and residue several times with ethanol, poured the rinse solution into the volumetric flask, and shook up with constant volume ethanol. The absorbance values of the extract at the wavelength of 665 nm, 649 nm, and 470 nm were measured, respectively. The concentrations of Chl a, Chl b, and the carotenoids (mg/L) and content of pigment in the leaves were calculated as follows:
Chl a Content (Ca) = 13.95 × A665 − 6.88 × A649;
Chl b Content (Cb) = 24.96 × A649 − 7.32 × A665;
Carotenoid Content = (1000 × A470 − 2.05 × Ca − 114.8 × Cb)/245;
Pigment content (mg/g) = pigment concentration (mg/L) × extract volume (mL)/FW.
2.9. Photosynthetic Characteristics Measurement
Photosynthetic characteristics were determined by a portable infra-red gas analyzer (LI-6400, Li-Cor, Lincoln, NE, USA). The measurements were performed between 8:30 to 10:30 am local time. The standard leaf chamber was set to be 2 cm × 3 cm and photosynthetic photon flux density (PPFD) was 1000 µmol·m−2·s−1. The net photosynthetic rate (Pn), stomatal conductance (Gs), intercellular CO2 concentration (Ci), and transpiration rate (Tr) were recorded separately.
2.10. Observation of Anatomy
2.10.1. SEM Observation
Fresh leaves were cut into 3 mm × 3 mm pieces with a blade avoiding the veins and placed in 2.5% glutaraldehyde solution for more than 2 h. Before observation, the samples were washed three times with 0.1 mol/L phosphate buffered saline (PBS) buffer for 15 min each time, followed by 30%, 50%, 70%, 80%, 90%, 95%, 100%, and 100% (with sodium sulfate anhydrous) gradient alcohol dehydration, 15 min each time. After drying (CPD-300, Leica, Weztlar, Germany) and gold spraying (SCD 500, Leica, Weztlar, Germany), the lower epidermis of the leaves was observed and photographed by SEM (Gemini 300, Carl Zeiss, Oberkochen, Germany).
2.10.2. TEM Observation
Fresh leaves were cut into 1 mm × 1 mm pieces with a blade avoiding the veins and placed in 2.5% glutaraldehyde solution for more than 2 h. Before observation, the samples were washed three times with 0.1 mol/L PBS buffer for 15 min each time. The samples were then fixed with 1% osmic acid for 4 h, and then washed with 0.1 mol/L PBS buffer three times for 15 min each time, followed by 30%, 50%, 70%, 80%, 90%, 95%, and 100% gradient alcohol dehydration, 15 min each time. The samples were transferred to 100% acetone for 15 min, and then treated with acetone containing anhydrous sodium sulfate for 15 min. The samples were embedded in resin and sliced into around 70 nm pieces using an ultramicrotome (EM UC6, Leica, Weztlar, Germany). Mesophyll cells and chloroplasts were observed by TEM (Tecnai 12, Philips, Amsterdam, The Netherlands) after double staining with uranyl acetate and lead citrate.
2.11. Statistical Analysis
All data are expressed as mean ± standard deviation (SD) and the data were analyzed for normal distribution and homogeneity of variance. If data were not normally distributed and the variances were heteroscedastic, the Kruskal–Wallis non-parametric test was used. One-way analysis of variance was selected (p < 0.05) for comparing the leaf relative water content, relative electrical conductivity, proline content, antioxidant enzyme activities, photosynthetic pigments, SPAD values, and photosynthetic characteristics to test the effects of high-temperature stress among the sole-cropping P. ostii and intercropping P. ostii under C. illinoinensis with row spacing of 4 m × 8 m and 4 m × 4 m. Duncan’s multiple range test was used for multiple comparisons among treatments (* p < 0.05, ** p < 0.01). The SAS/STAT statistical analysis software package (version 6.12, SAS Institute, Cary, NC, USA) was used during data processing and graphs were plotted with SigmaPlot 14.0 software.
3. Results
3.1. Effects of Understory Cultivation on High-Temperature Damage Index and Leaf Relative Water Content of P. ostii
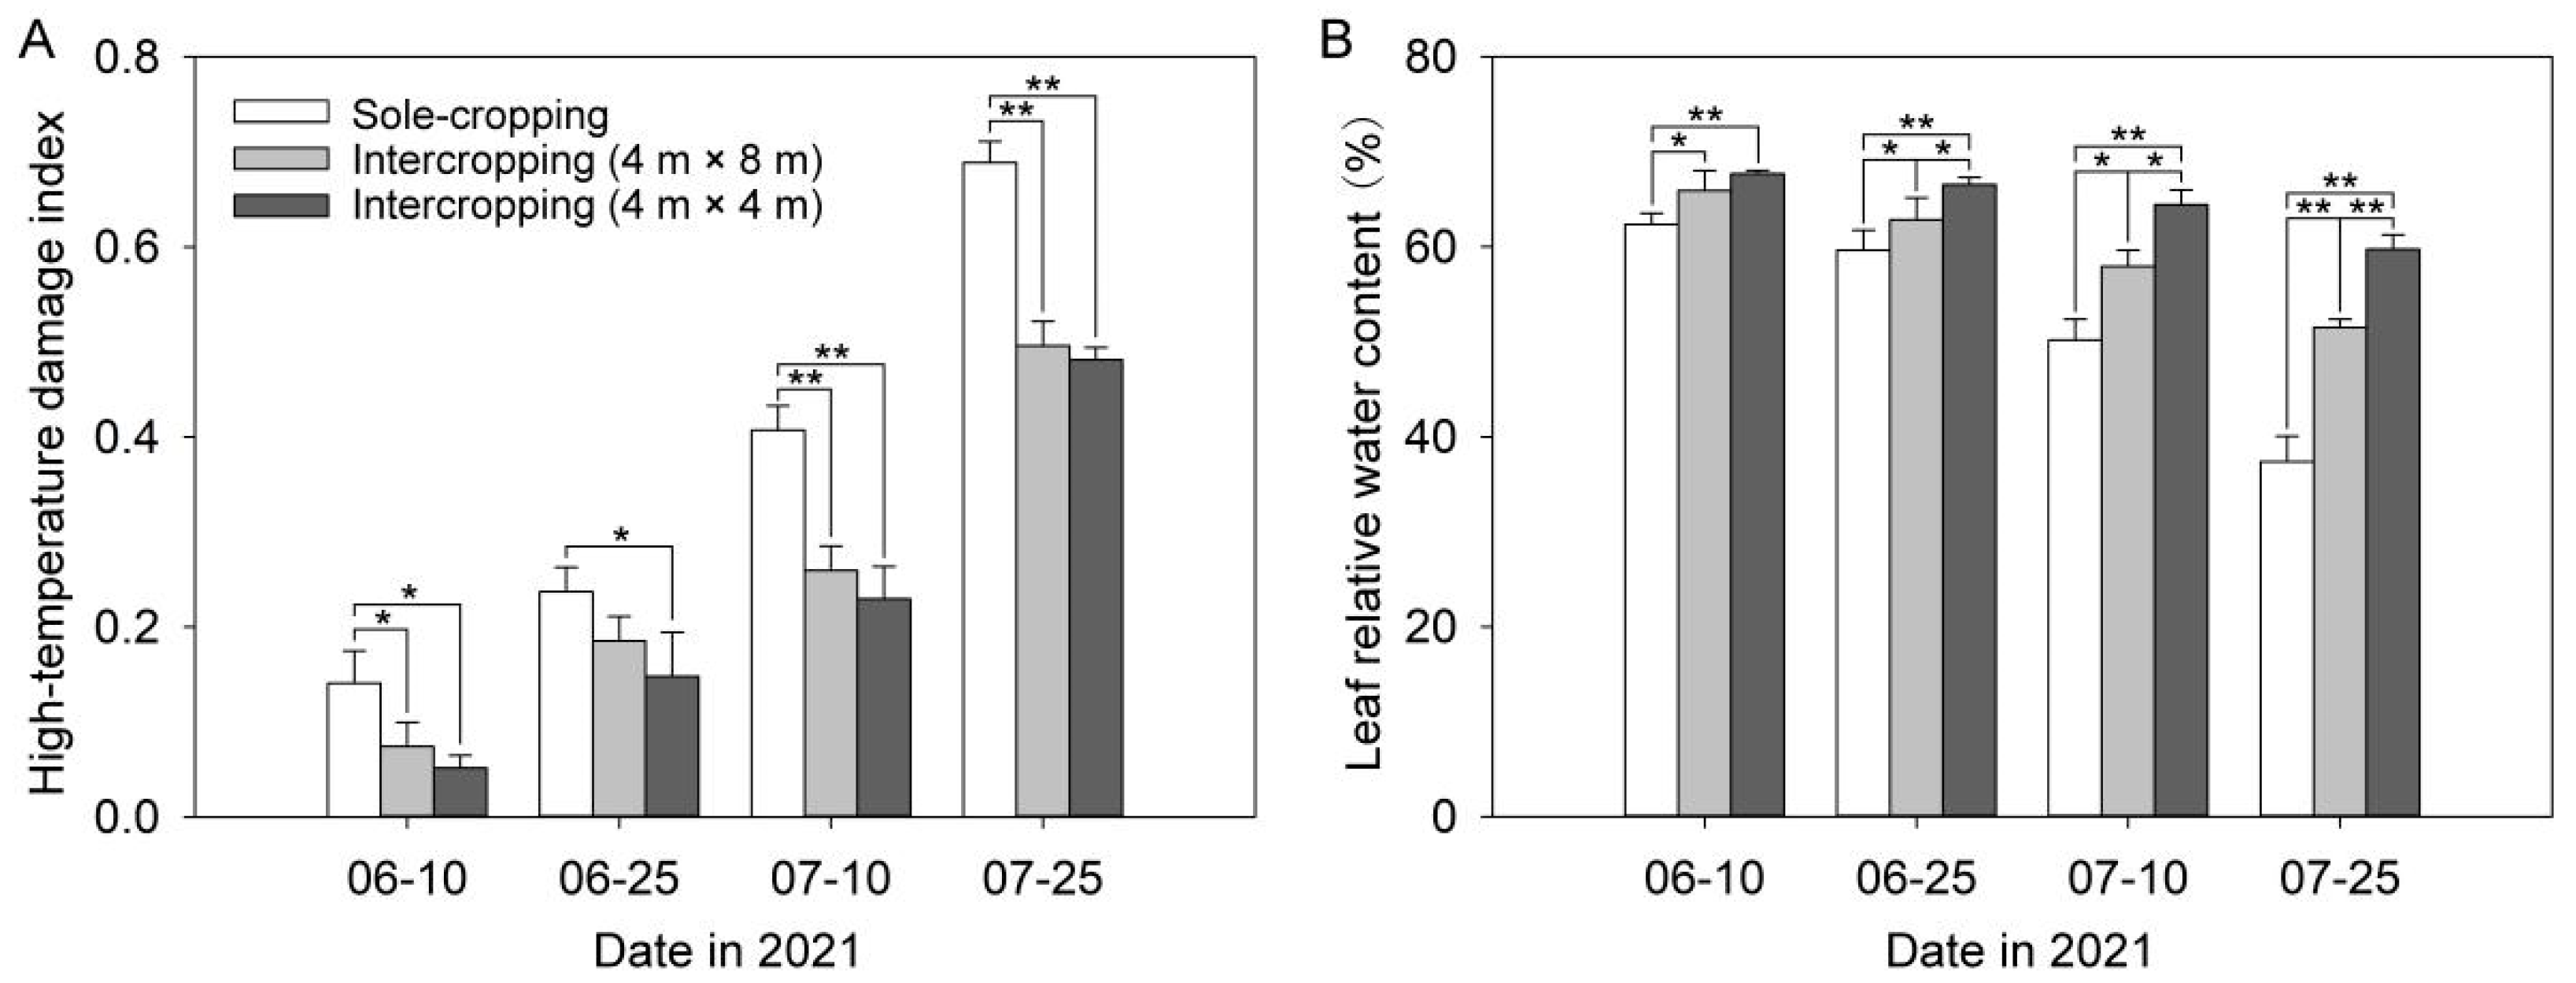
With the continuation of high temperature, the high-temperature damage index of P. ostii kept growing, whereas the leaf relative water content continued to decline (Figure 1). The high-temperature damage index of the sole-cropping P. ostii was dramatically higher than that of the intercropping P. ostii in each period, while the relative water content of the sole-cropping P. ostii was the opposite. The high-temperature damage index of intercropping P. ostii under C. illinoinensis with row spacing of 4 m × 8 m was always higher than that under C. illinoinensis with row spacing of 4 m × 4 m. However, the trend of relative water content was still the opposite. The high-temperature damage index of the sole-cropping P. ostii and intercropping P. ostii under C. illinoinensis with row spacing of 4 m × 8 m and 4 m × 4 m all reached the highest value on 25 July, which were 0.69, 0.50, and 0.48, respectively. Compared with the sole-cropping P. ostii, the relative water content of leaves in the intercropping P. ostii under C. illinoinensis with row spacing of 4 m × 8 m and 4 m × 4 m increased by 37.77% and 59.72%, respectively.
3.2. Effects of Understory Cultivation on the ROS Accumulation Level of P. ostii
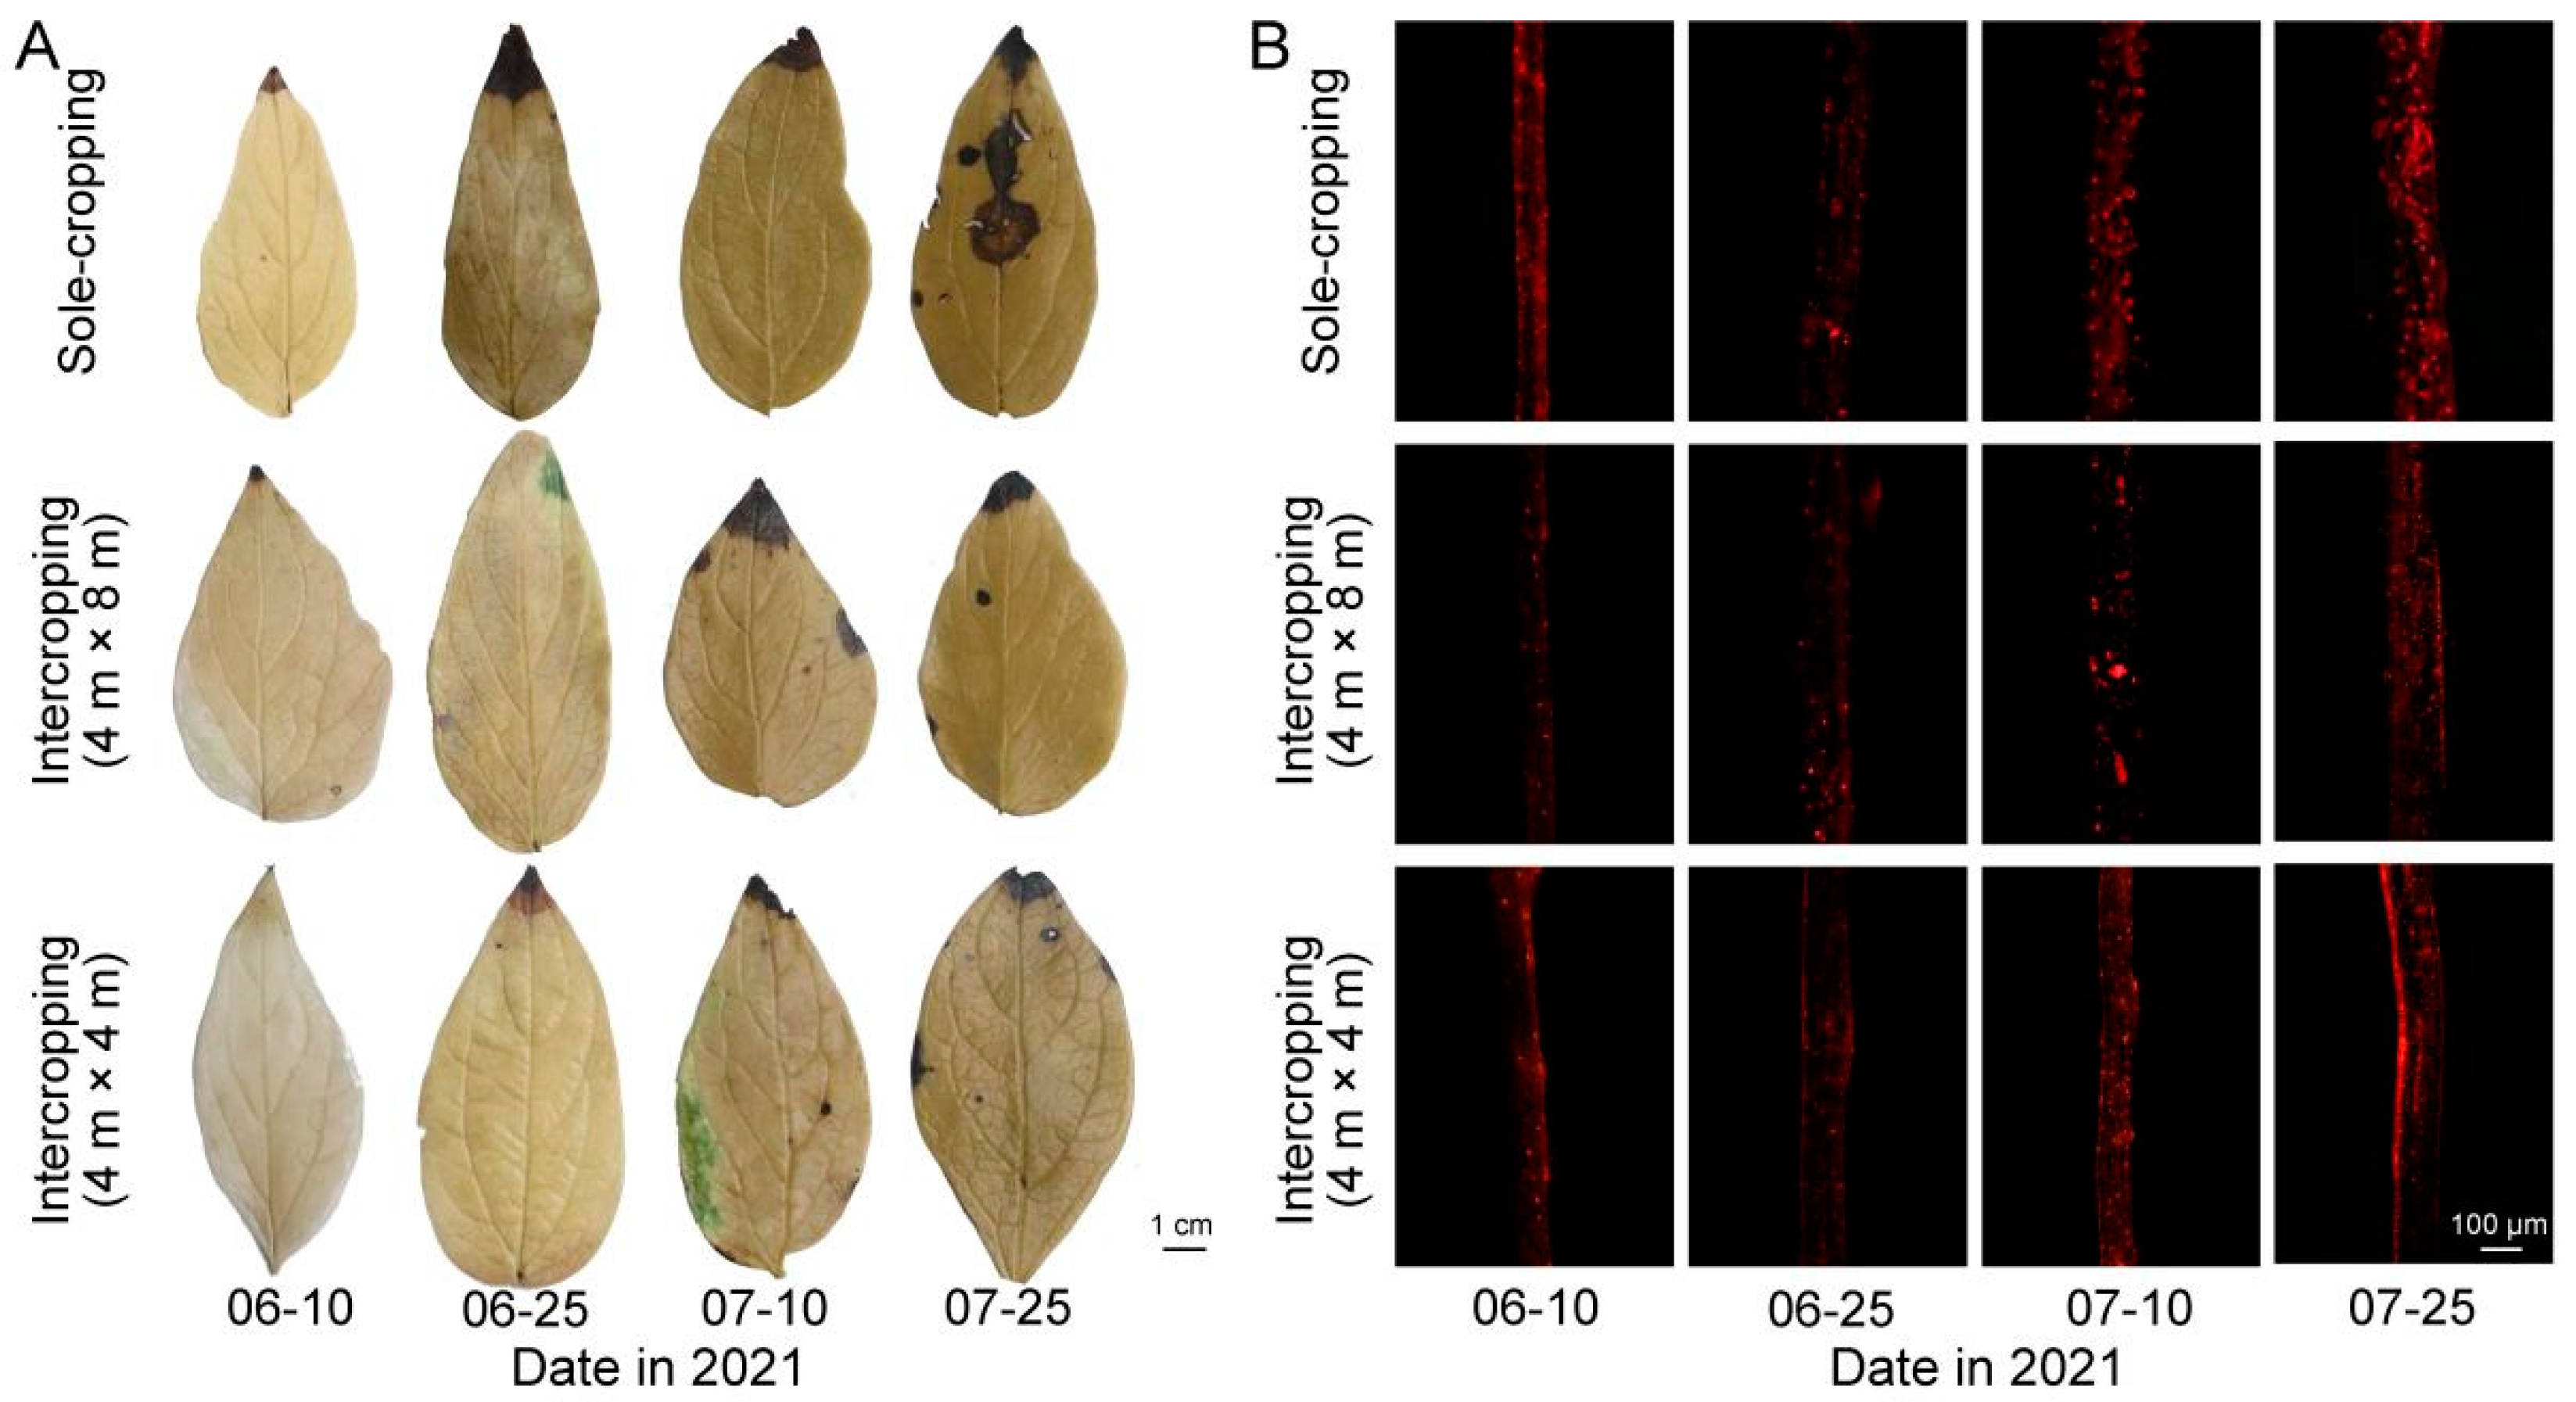
The high temperature in summer resulted in the accumulation of a large amount of ROS in both the sole-cropping and intercropping P. ostii. From Figure 2A, with the continuation of high-temperature, the color of the leaves continued to deepen after DAB staining. On 25 July, after DAB staining, the color of leaves in sole-cropping P. ostii was brown, while that in intercropping P. ostii was relatively lighter, especially that in intercropping P. ostii under C. illinoinensis with row spacing of 4 m × 8 m, indicating that understory cultivation reduced H2O2 accumulation of P. ostii. O2·− accumulation also showed the same tendency. Compared with the sole-cropping P. ostii, the fluorescence signal intensity of leaves in intercropping P. ostii was significantly weaker, especially that under C. illinoinensis with row spacing of 4 m × 8 m, indicating that understory cultivation reduced the O2·− accumulation of P. ostii (Figure 2B).
3.3. Effects of Understory Cultivation on Relative Electrical Conductivity and Proline Content of P. ostii
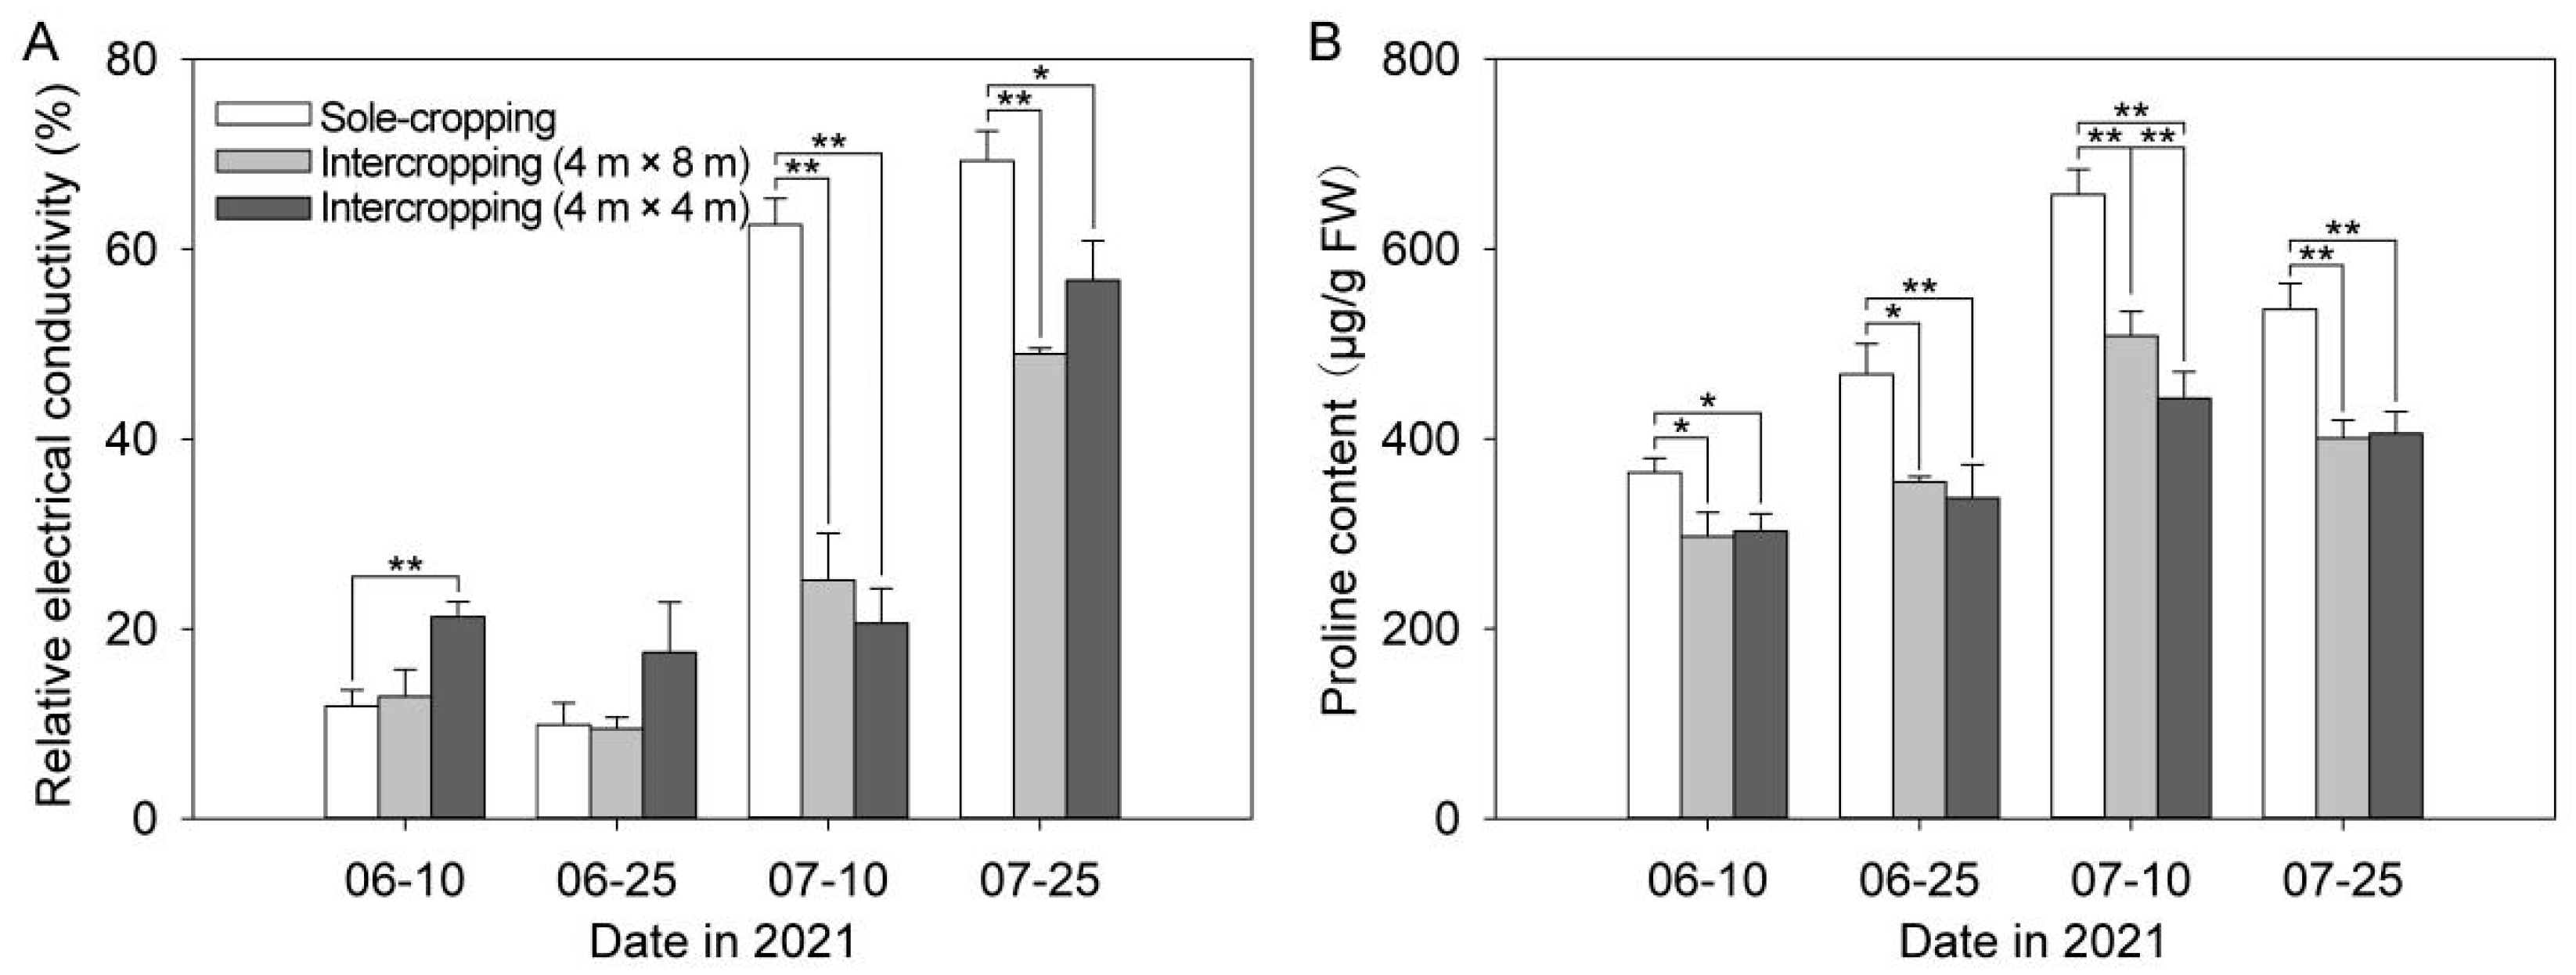
As can be seen from Figure 3A, relative electrical conductivity of P. ostii showed an overall upward trend with the continuation of high-temperature time. After 10 July, relative electrical conductivity of the sole-cropping P. ostii was significantly higher than that of intercropping P. ostii. On 25 July, compared with the sole-cropping P. ostii, the relative electrical conductivity of intercropping P. ostii under C. illinoinensis with row spacing of 4 m × 8 m and 4 m × 4 m decreased by 29.35% and 18.17%, respectively.
From Figure 3B, it can be seen that the proline content of sole-cropping P. ostii increased at first and then decreased with the continuation of high-temperature time, reaching the maximum value on 10 July. At this time, the proline content of the sole-cropping P. ostii was respectively 1.29 times and 1.49 times that of intercropping P. ostii under C. illinoinensis with row spacing of 4 m× 8 m and 4 m × 4 m, respectively.
3.4. Effects of Understory Cultivation on Antioxidant Enzyme of P. ostii
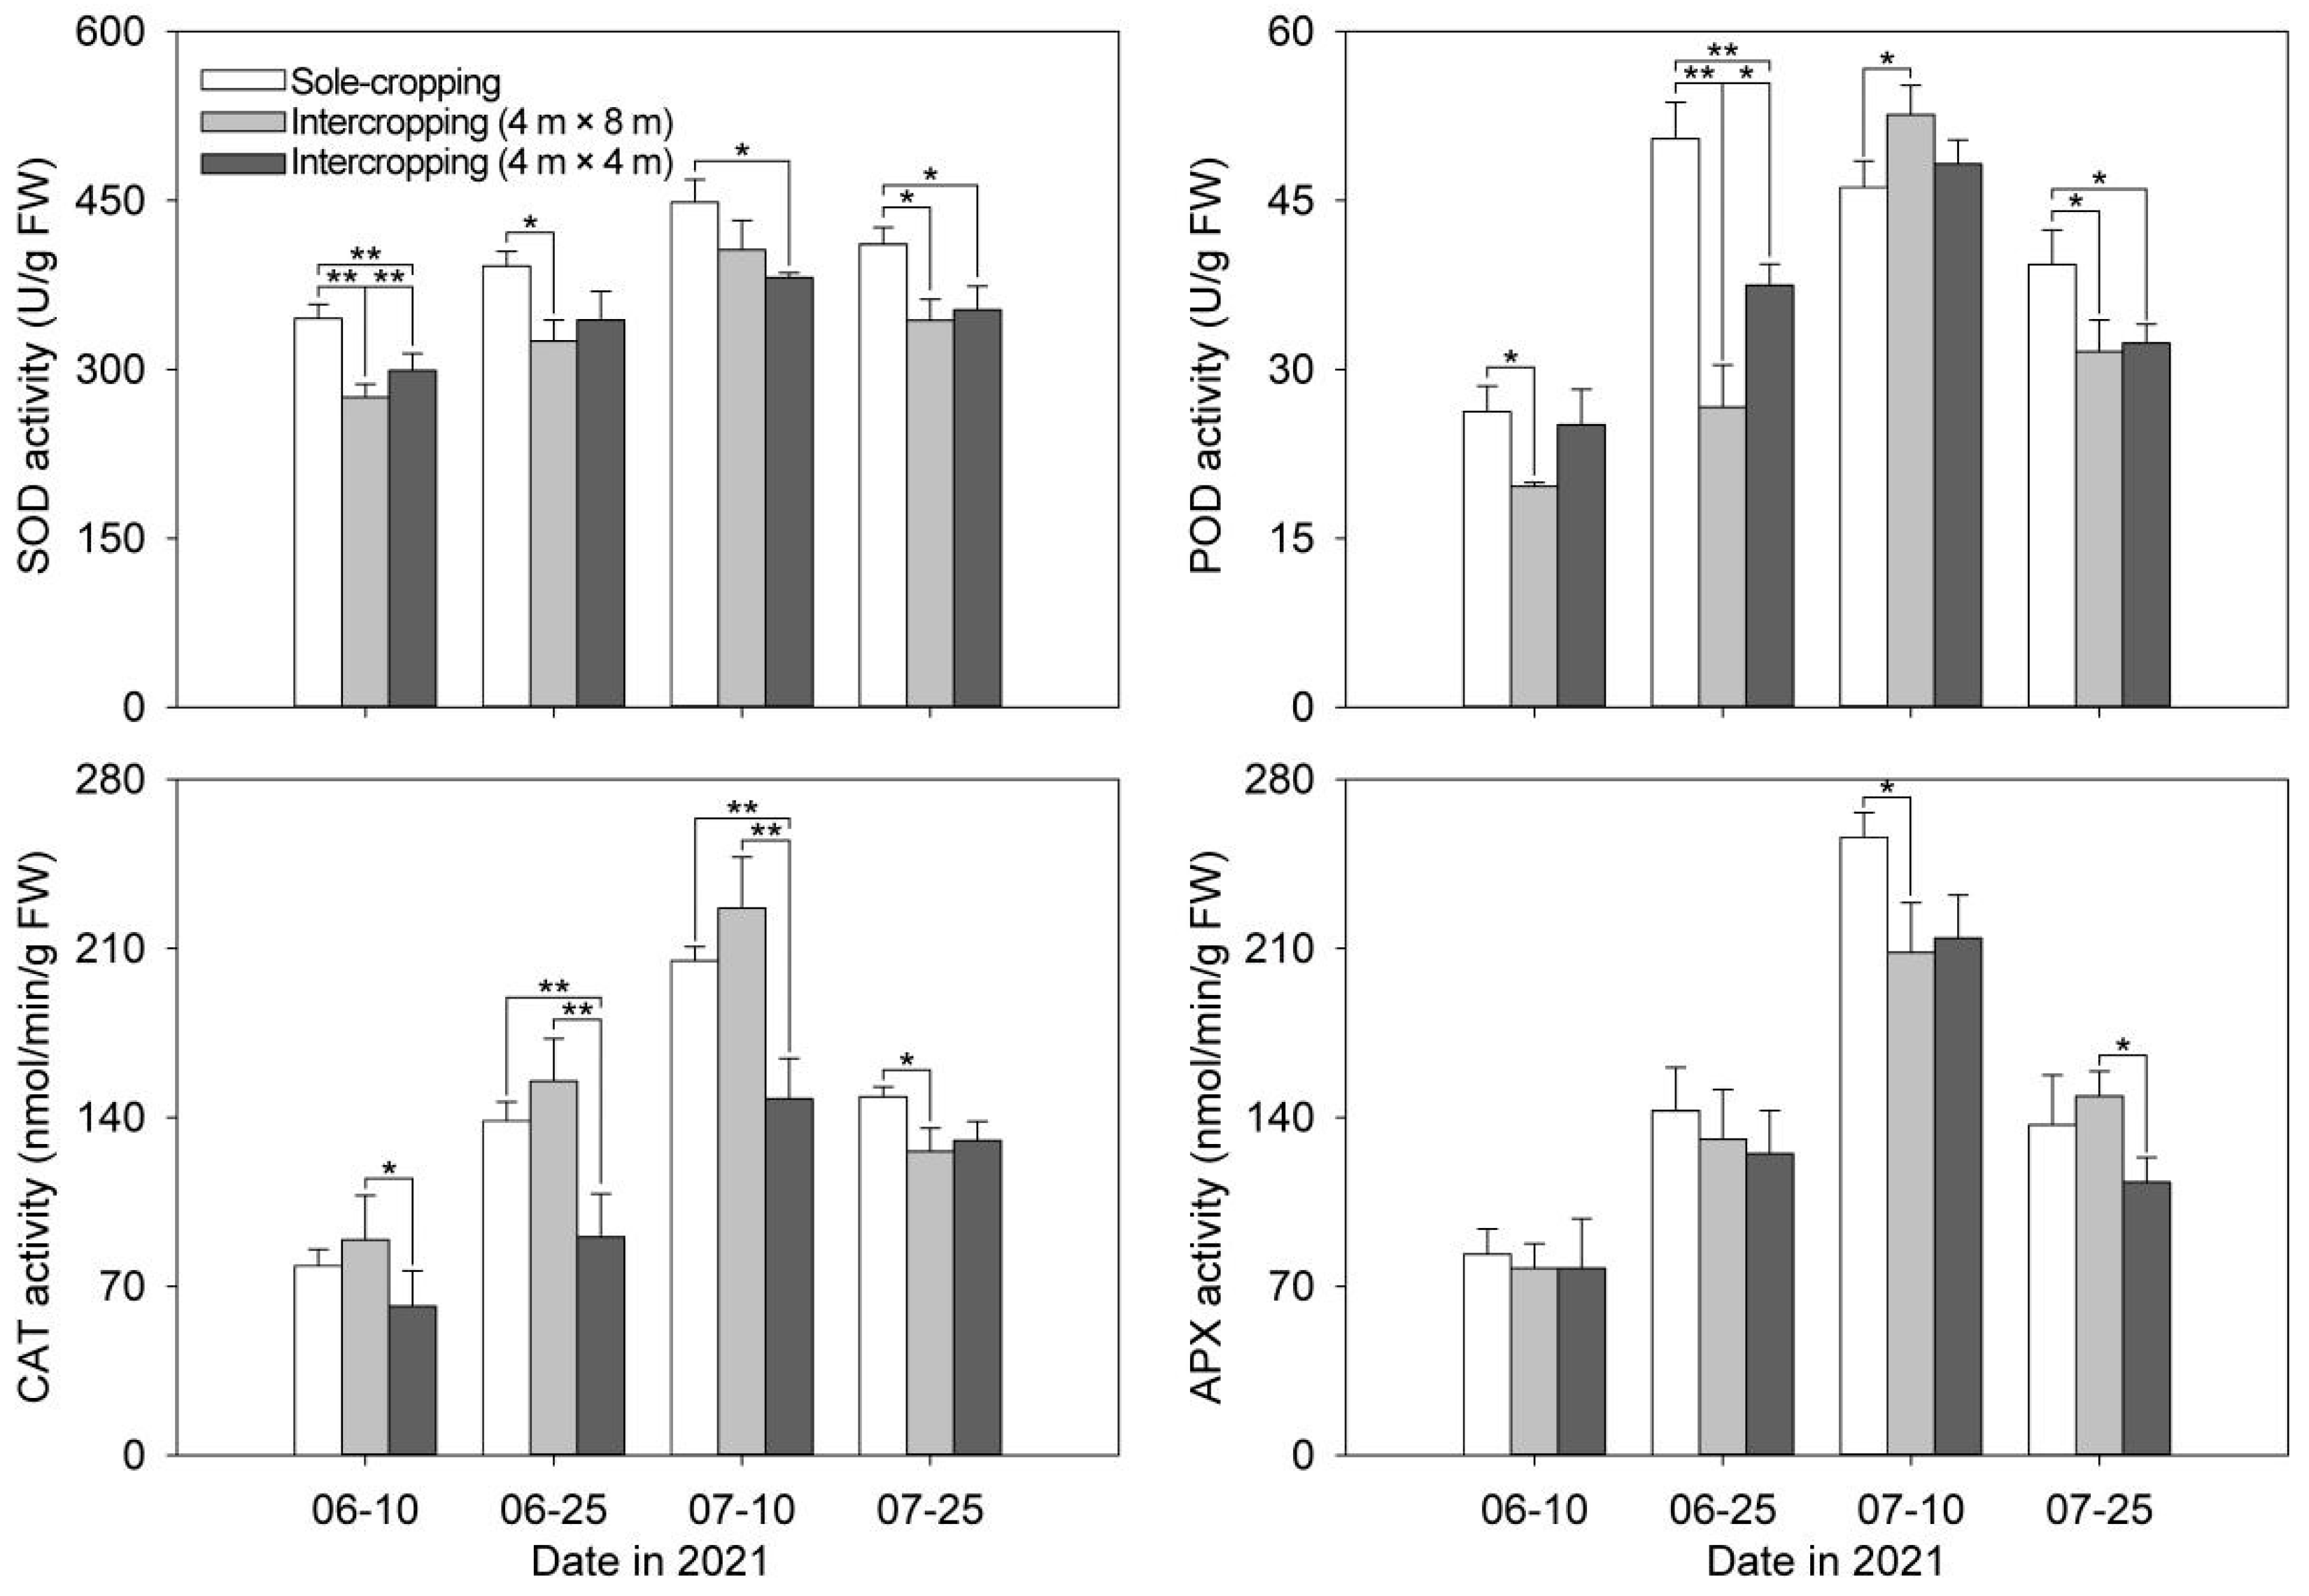
The changing trends of the four antioxidant enzymes activities of the sole-cropping and intercropping P. ostii showed a “single peak” type, and most of them reached the maximum value on 10 July (Figure 4). The SOD activity of the intercropping P. ostii was always significantly lower than that of the sole-cropping P. ostii. The SOD activity of the intercropping P. ostii under C. illinoinensis with row spacing of 4 m × 4 m was lower than that with row spacing of 4 m × 8 m on 10 July. In other times, it showed the opposite trend. On 10 June, 25 June and 25 July, the POD activity of the sole-cropping P. ostii was higher than that of the intercropping P. ostii. On 10 July, intercropping P. ostii under C. illinoinensis with the row spacing of 4 m × 8 m had the highest POD activity while the sole-cropping P. ostii had the lowest. Before 10 July, the CAT activity of the intercropping P. ostii under C. illinoinensis with row spacing of 4 m × 8 m was the highest, followed by the sole-cropping P. ostii. There was no obvious difference in APX activity between the sole-cropping and intercropping P. ostii in the early stage. On 10 July, the APX activity of the sole-cropping P. ostii was significantly higher than that of the intercropping P. ostii; however, on 25 July, the activity of APX was the highest in intercropping P. ostii under C. illinoinensis with row spacing of 4 m × 8 m, and the lowest in that with row spacing of 4 m × 4 m.
3.5. Effects of Understory Cultivation on Photosynthetic Pigments of P. ostii
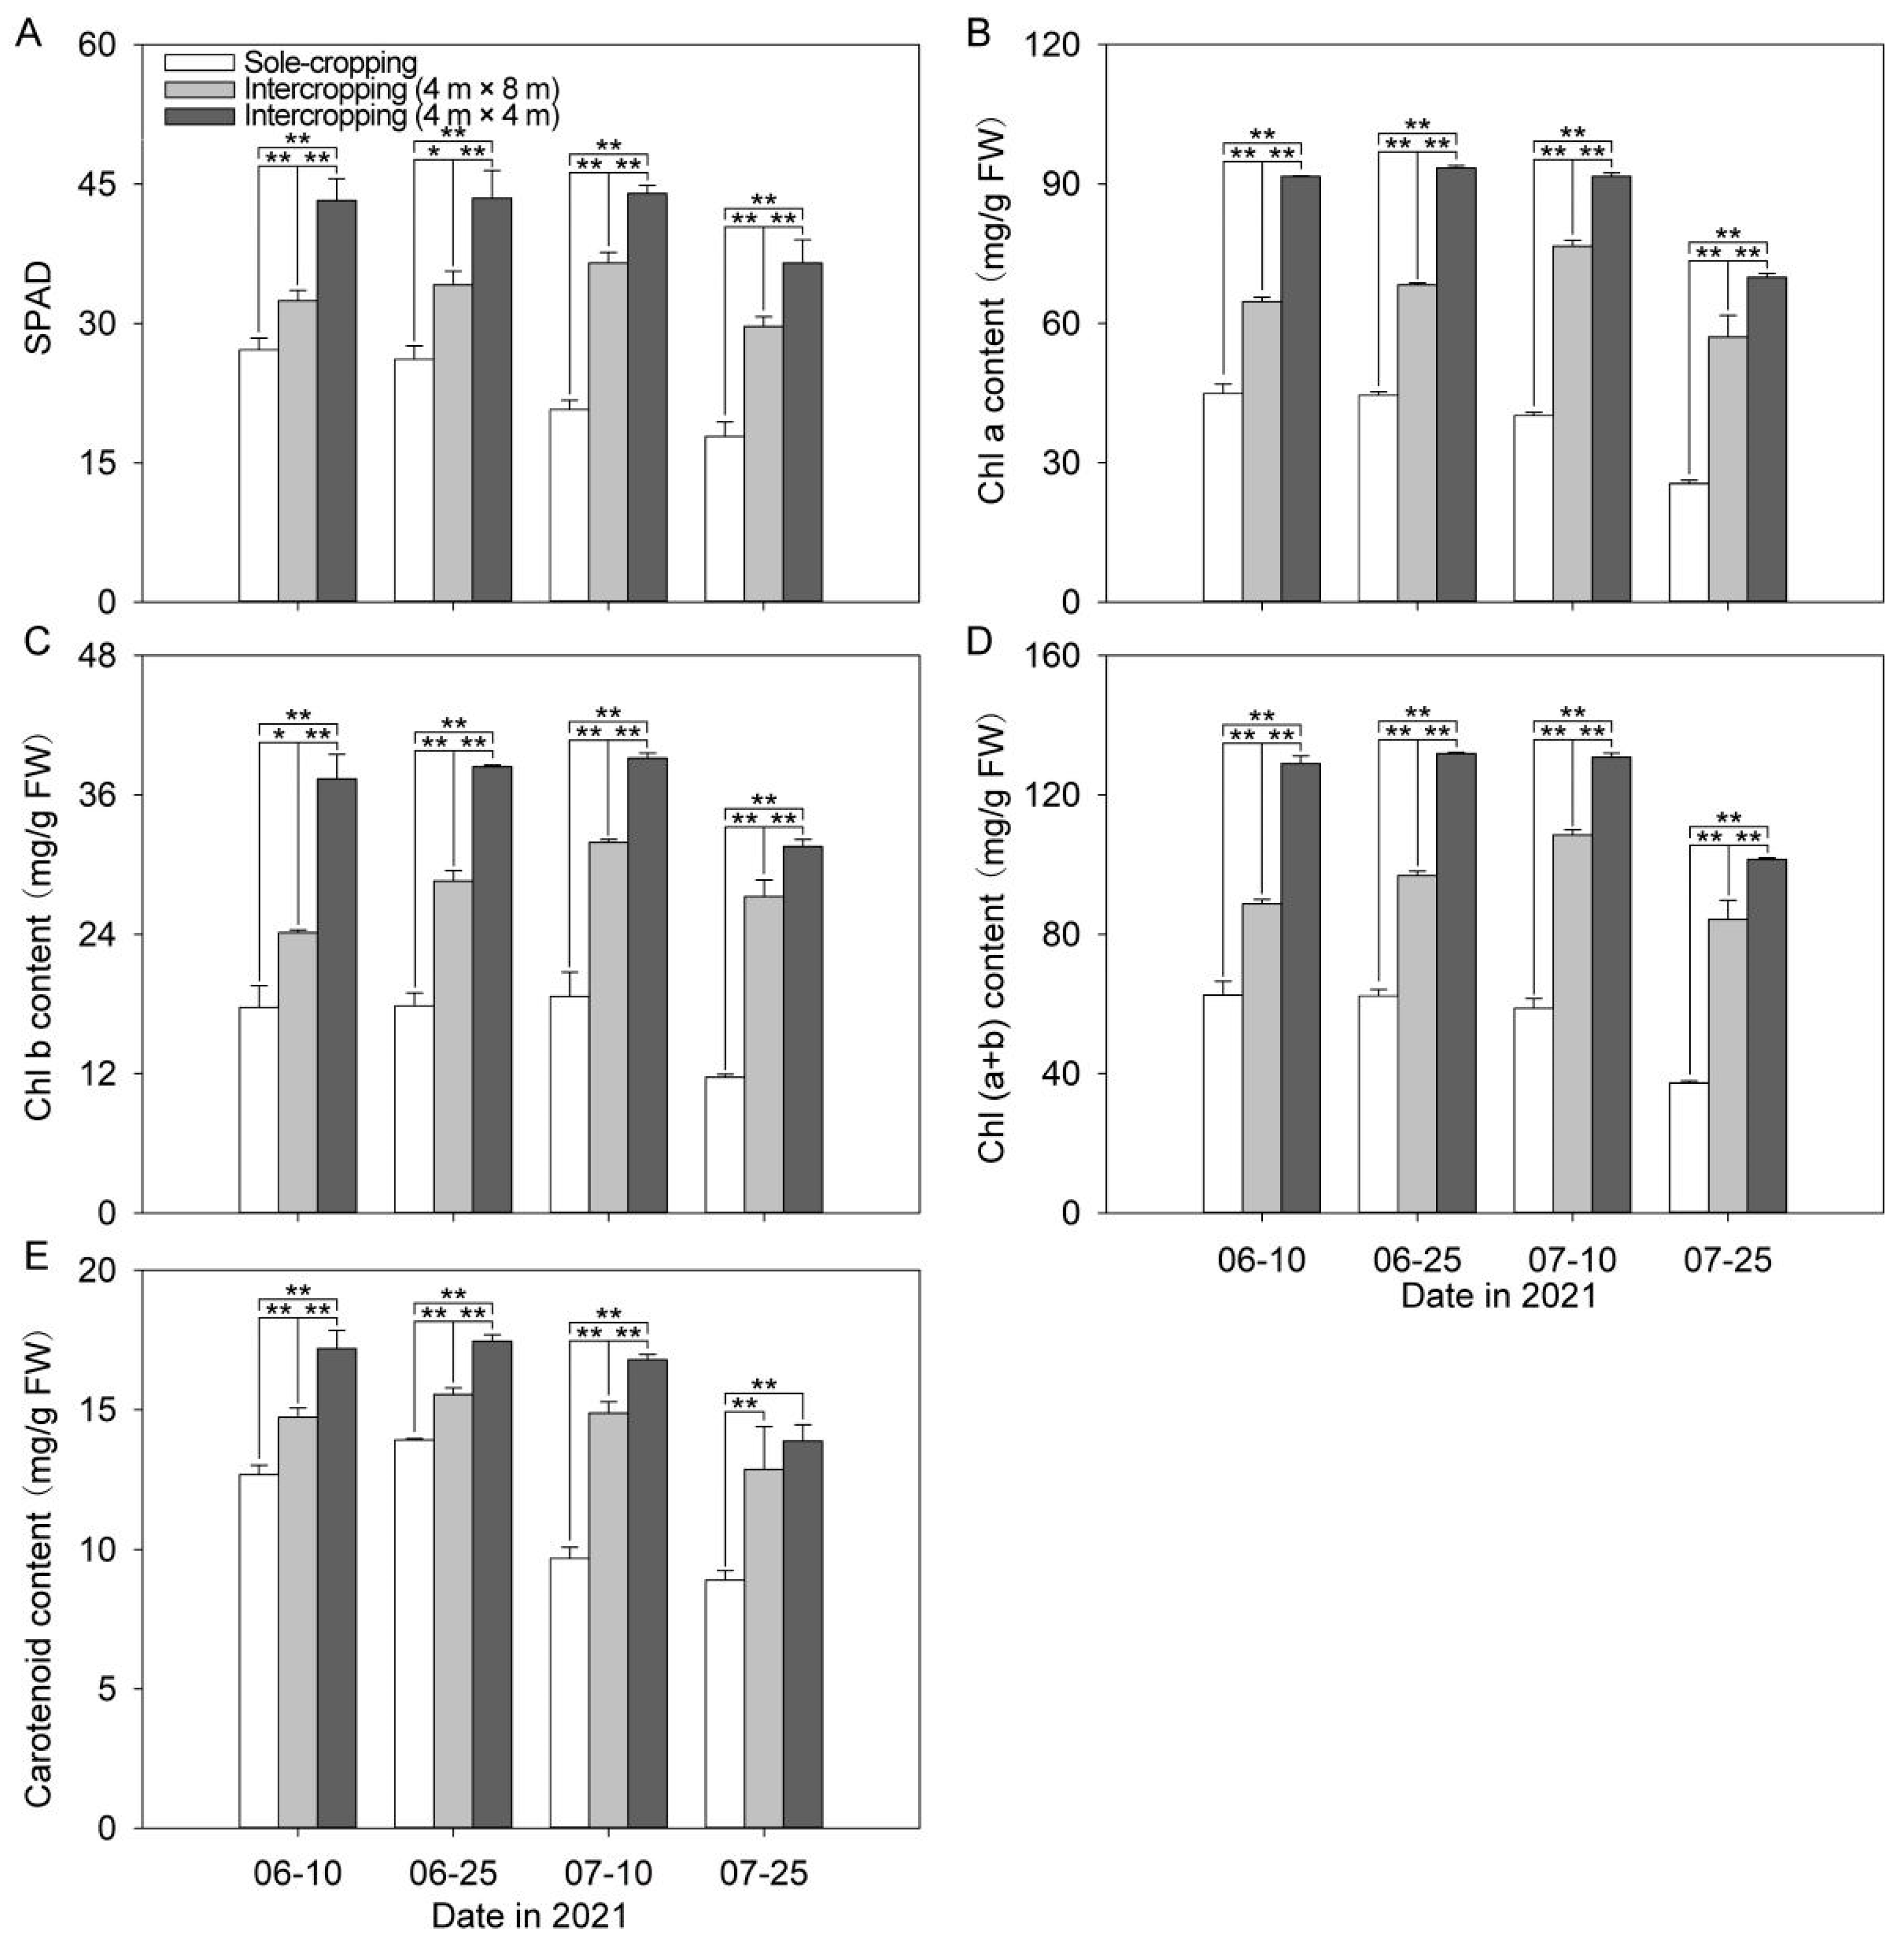
It can be seen from Figure 5 that the SPAD value of intercropping P. ostii gradually increased with the continuous high-temperature stress, reached the maximum value on 10 July, and then began to decline. Meanwhile, the SPAD value of the sole-cropping P. ostii was in a downward trend, and was clearly lower than that of the intercropping P. ostii in each period. The most obvious gap happened on 10 July, on which day the SPAD values of the sole-cropping P. ostii were 56.71% and 47.05% of that of the intercropping P. ostii under C. illinoinensis with row spacing of 4 m × 8 m and 4 m × 4 m, respectively. Correspondingly, the content of Chl (a+b) in intercropping P. ostii showed a rise trend at first and then decreased, and the sole-cropping P. ostii was still in a downward trend. On 25 July, the Chl (a + b) content of the intercropping P. ostii under C. illinoinensis with row spacing of 4 m × 4 m was the highest, which was 2.72 times higher than that of the sole-cropping P. ostii. As to the Chl a and Chl b, it was 2.74 times and 2.70 times higher than that of the sole-cropping P. ostii, respectively. The carotenoid content of the sole-cropping and intercropping P. ostii increased at first and then decreased, reaching the maximum value on 25 June, and the carotenoid content of the sole-cropping P. ostii was obviously lower than that of the intercropping P. ostii in each period.
3.6. Effects of Understory Cultivation on Photosynthetic Characteristics of P. ostii
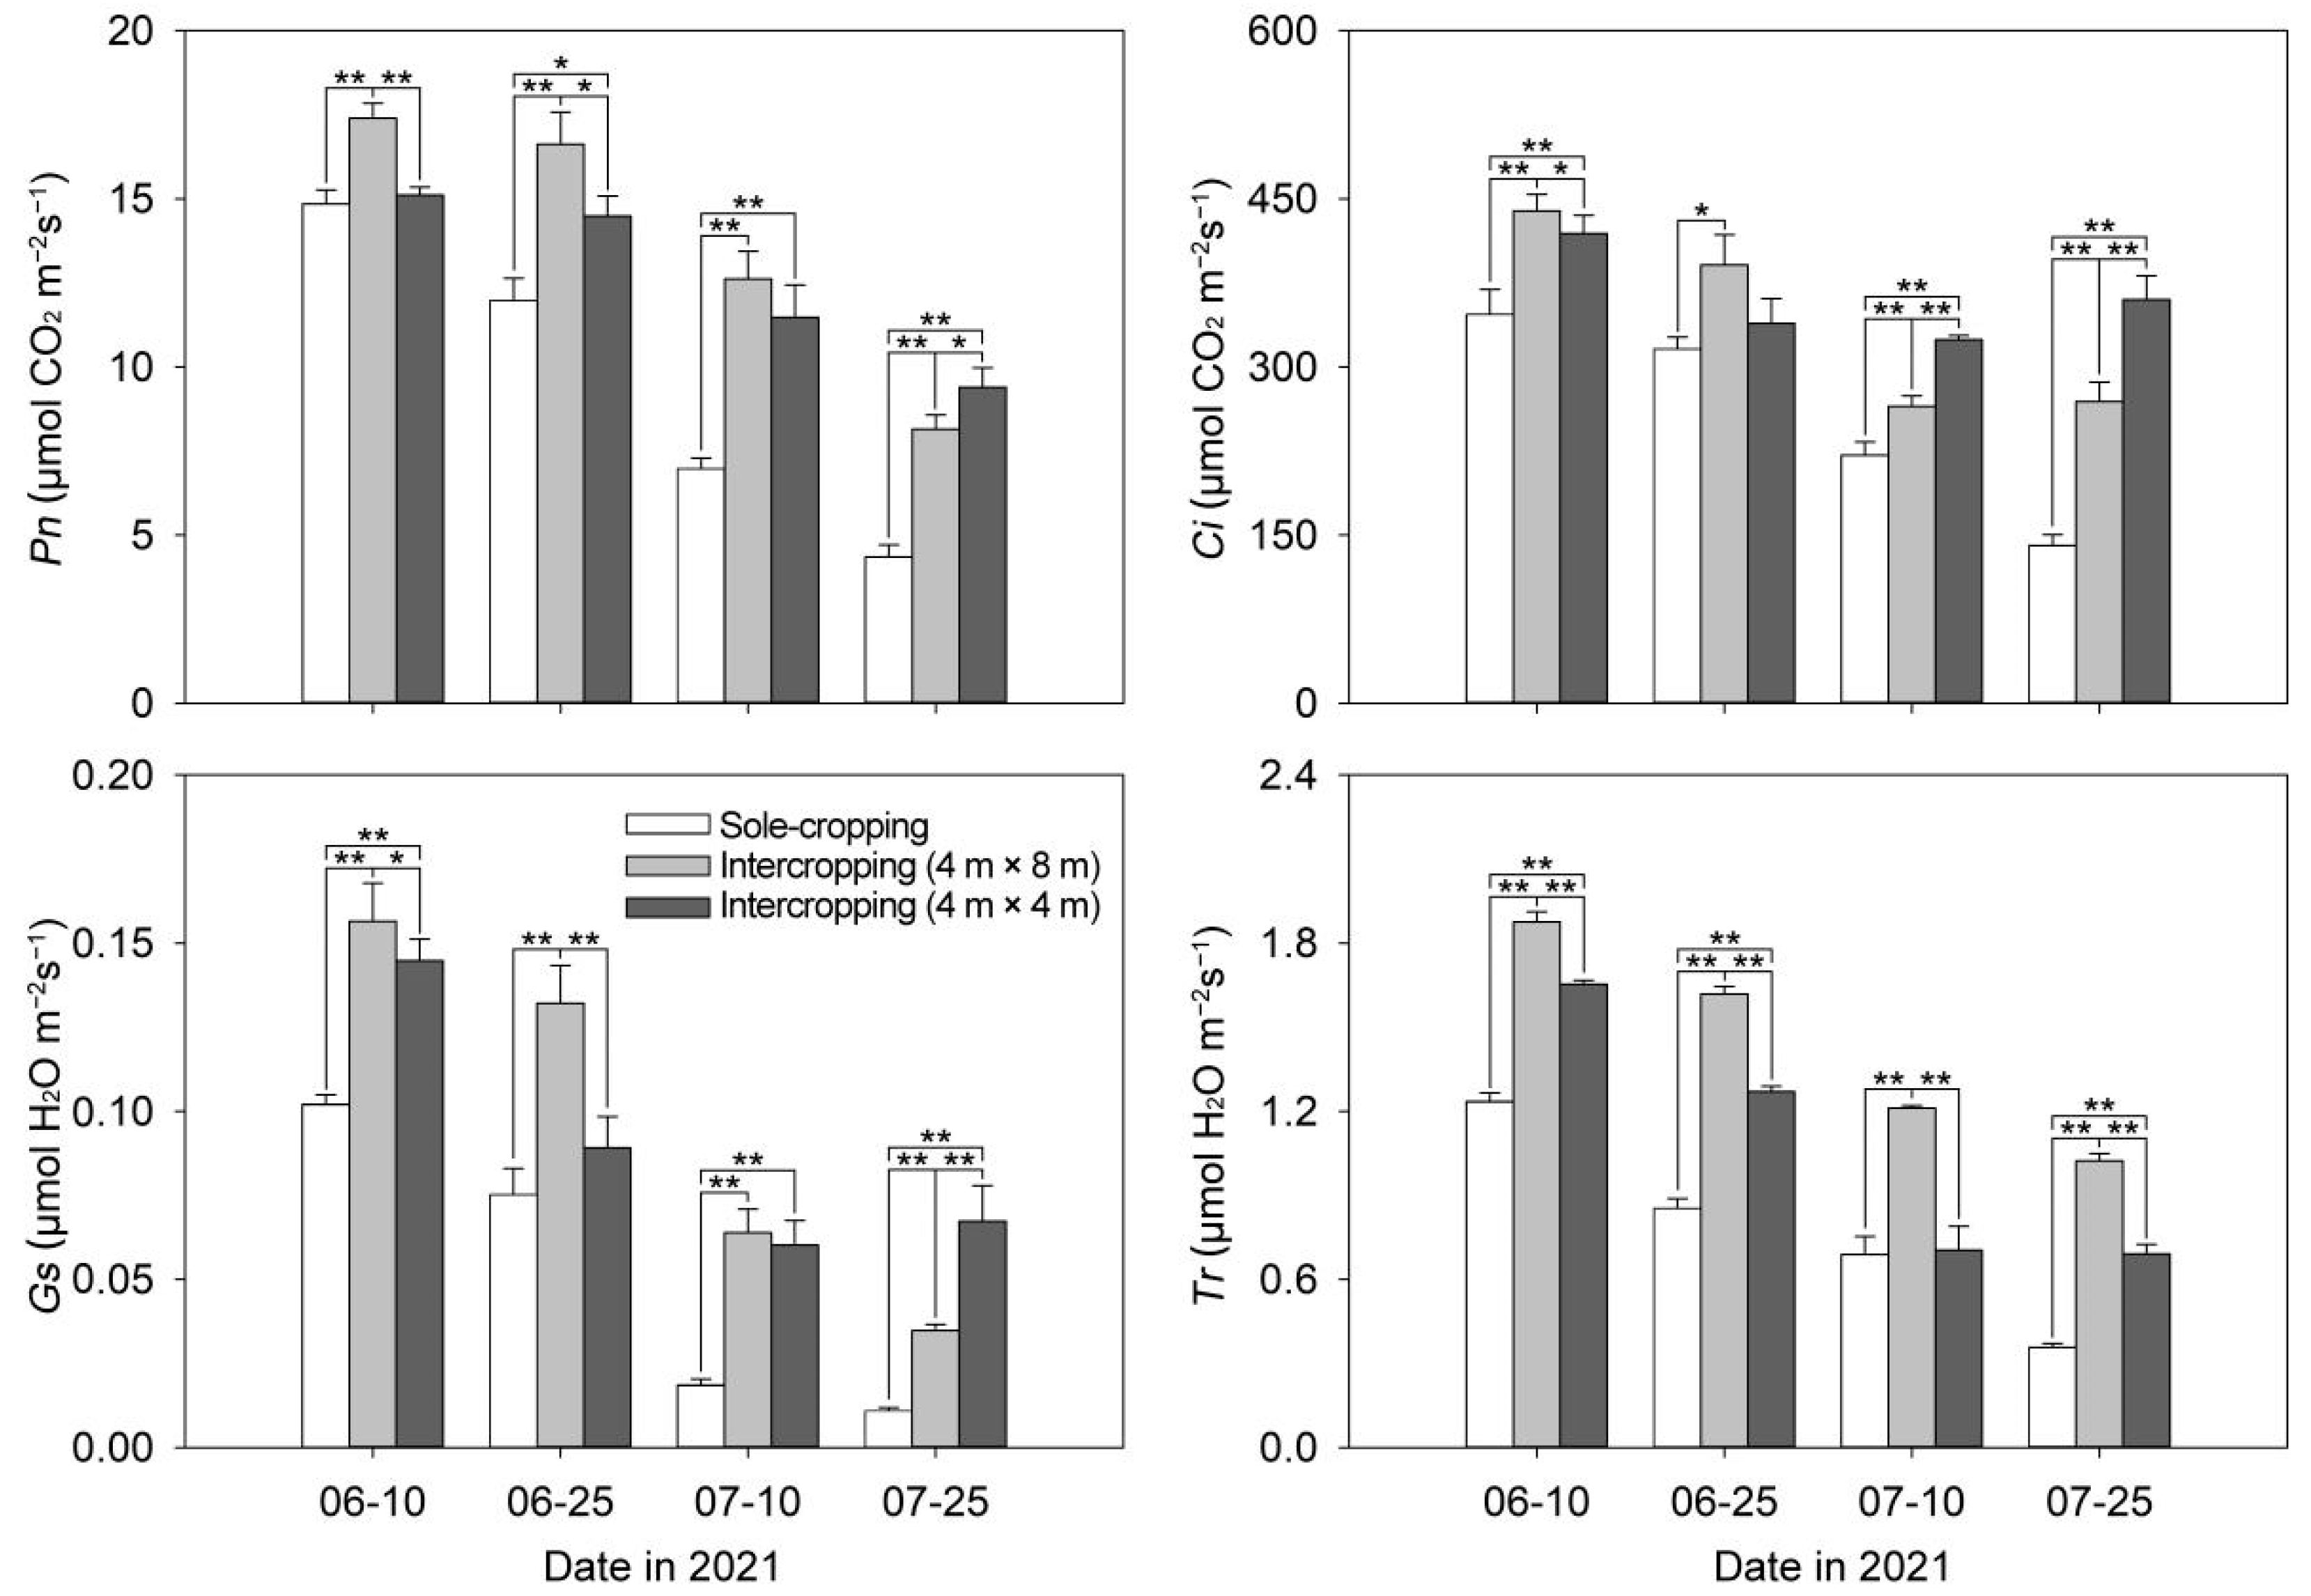
With the continuation of high-temperature stress time, the photosynthetic parameter values of sole-cropping and intercropping P. ostii showed a downward trend in general. Moreover, it was distinctly higher in the intercropping P. ostii than that in the sole-cropping P. ostii in each period (Figure 6). On 25 July, Pn, Ci, Gs, and Tr of the intercropping P. ostii under C. illinoinensis with row spacing of 4 m × 8 m were 1.87 times, 1.91 times, 3.22 times, and 2.86 times higher than those of the sole-cropping P. ostii. The Pn, Ci, Gs, and Tr of P. ostii of the intercropping P. ostii under C. illinoinensis with row spacing of 4 m × 4 m were 2.16 times, 2.56 times, 6.25 times, and 1.94 times higher than those of the sole-cropping P. ostii, respectively.
3.7. Effects of Understory Cultivation on the Anatomical Structures of P. ostii
First, SEM was used to observe the structure of the lower epidermis of the leaves of the sole-cropping and intercropping P. ostii on 25 July. The surface leaves of the sole-cropping P. ostii had the largest degree of shrinkage and the folds were obvious. Most of the stomata were closed, with only a few slightly open. In contrast, the cuticle of the leaves of the intercropping P. ostii was corrugated and the stomata were almost all open (Figure 7A–F).
Subsequently, TEM was used to observe the mesophyll cells of the leaves of the sole-cropping and intercropping P. ostii on 25 July. The chloroplasts of the sole-cropping P. ostii and the intercropping P. ostii under C. illinoinensis with row spacing of 4 m × 8 m began to swell, and a large number of starch granules and lipid globules were filled in the cells. It was especially true in the sole-cropping P. ostii. almost no intact chloroplasts were observed. The stress was the lightest for the intercropping P. ostii under C. illinoinensis with row spacing of 4 m × 4 m, but the chloroplasts were gradually moved away from the cell membrane, and there was also a disintegrating tendency (Figure 7G–L).
4. Discussion
The forestry compound management system organically combines the forestry production in the region, enhances the soil fertility, improves the land utilization rate, and enables the continuous and effective operation of the land production and management [1,2,3,4,5,6]. The upper layer of C. illinoinensis community structure is properly shaded. Under the stress of high temperature in summer, the microclimate environment for the growth of P. ostii can be improved by reducing temperature, thus providing better conditions for the growth and development of P. ostii. The high-temperature damage index can quantify the degree of damage to the plant. In recent years, it has been widely selected as a reference index for the evaluation of high-temperature stress tolerance [22,23]. In this study, high temperature significantly increased the high-temperature damage index of P. ostii. However, understory cultivation effectively caused a reduction of the effect. The measurement of the relative water content of the P. ostii leaves revealed that intercropping under C. illinoinensis of appropriate row spacing would increase the water content of P. ostii leaves. This proved that understory cultivation can effectively relieve the symptoms of high-temperature damage in summer and maintain sufficient water for life activities. With the continuation of high-temperature stress, relative electrical conductivity showed a trend of decreasing at first and later increasing, reaching the minimum value on 25 June. In the first two periods, the relative electrical conductivity of the intercropping P. ostii under C. illinoinensis with row spacing of 4 m × 4 m was the highest, higher than that of the sole-cropping P. ostii; whereas, in the two later periods, the relative electrical conductivity of the sole-cropping P. ostii was significantly higher than that of the intercropping P. ostii. It is speculated that this may be caused by the reduction of light in the intercropping P. ostii under C. illinoinensis with row spacing of 4 m × 4 m in the early stage while the temperature continued to rise in the later stage; the sole-cropping P. ostii was exposed in the sunshine directly. The plasma membrane of P. ostii became damaged, inducing P. ostii into a stress state. This was consistent with the research results of Guo et al. [24] on bi-color wood tomato. The continuation of high-temperature stress also caused the proline content to decrease at first and then increase, and the proline content of the sole-cropping P. ostii was significantly higher than that of the intercropping P. ostii in each period, indicating that understory cultivation can reduce the stress damage of P. ostii.
SOD, POD, CAT, and APX in plants are important components of the antioxidant enzyme protection system. When plants are subjected to high-temperature stress, they can cooperate with each other to maintain the balance of ROS metabolism [25]. Changes of antioxidative enzyme activity and level of membrane lipid peroxidation of sole-cropping and the intercropping P. ostii were basically the same. From 10 June to 25 June, the activities of antioxidant enzymes in the leaves were enhanced, and the accumulation of ROS remained at a low level at this time, indicating that understory cultivation could reduce the accumulation of ROS and protect the P. ostii from high-temperature damage. Since July, with the arrival of the height of summer, P. ostii has been under increasing stress of high temperature. Although the activities of SOD, POD, CAT, and APX increased during this period, the produced ROS in the leaf could not be cleared in time. In addition, the POD activity of the sole-cropping P. ostii decreased, which led to the more accumulation of ROS in the leaves on 10 July than that of the intercropping P. ostii. With the continuous senescence of leaves and the reverse inhibition of protective enzyme activities, activities of the four protective enzymes in P. ostii leaves in the later period (10 July to 25 July) decreased dramatically, which further resulted in the accumulation of ROS and exceeded the threshold value of plant damage endurance. Gao et al. [26] also received similar results in the research of different artificial shade levels on Medicago.
The levels of SPAD value and photosynthetic pigment content in leaves reflect not only the photosynthetic capacity, but also the adaptation to the environment [27]. There are many kinds of photosynthetic pigments, among which Chl a, Chl b, and carotenoids are the main pigments for photosynthesis, and their contents directly affect the photosynthetic performance of plants. For example, most Chl a molecules and all Chl b molecules have the capacity of collecting and transmitting light energy, and a few Chl a molecules can also convert light energy into electrical energy under special circumstances. The chlorophyll content of alfalfa (Medicago sativa L. cv. Zhongmu 1) increased with the decrease of light intensity [28]. With decreasing light intensity, the specific leaf area and chlorophyll contents of Heptacodium miconioides, a well-accepted ornamental plant, increased [29]. In this study, the trend of SPAD value was in accordance with Chl content, in which the sole-cropping P. ostii showed a downward trend, and the intercropping P. ostii showed a trend of rising at first and falling later, reaching the maximum value on 10 July. The intercropping P. ostii can increase the Chl content of leaves. It reached the highest in the intercropping P. ostii under C. illinoinensis with row spacing of 4 m × 4 m. This was due to the fact that Chl in plant leaves was in a dynamic change of continuous synthesis and decomposition. The equilibrium concentration was low against strong light, and relatively higher against weak light [30]. From June to July, C. illinoinensis grew vigorously, enjoying planting density with row spacing of 4 m × 4 m, and the shading effect was desirable, which made it possible for P. ostii to accumulate more Chl for growth. With the continuous high-temperature and the senescence of P. ostii leaves, Chl content declined in the later period. The changes in carotenoid content in P. ostii also showed a “single peak” trend, reaching the highest value on 25 June. High temperature and strong light in summer led to sunburn in plant leaves, increased the risk of leaf disease, and inhibited carbon assimilation in plant photosynthesis [31]. Under high-temperature stress, the light transmittance of about 50% could significantly increase the Pn of oak trees and promote the growth of seedlings [32], which was consistent with the results of this study. The photosynthetic efficiency of P. ostii decreased with the increase of temperature; however Pn, Ci, Gs, and Tr of undergrowth cultivated P. ostii were all higher than those of the sole-cropping P. ostii. In the intercropping P. ostii, the Pn of P. ostii under C. illinoinensis with row spacing of 4 m × 8 m was significantly higher than that of 4 m × 4 m in the middle and early stages, but the result turned out to be the opposite in the later period. This may be partly because in the later period with continuous high temperature, the shading advantage under C. illinoinensis with row spacing of 4 m × 4 m began to stand out. In this area, with the lower temperature and higher humidity, the stomata and the chloroplast structure of leaves in the intercropping P. ostii were more complete, and the number of lipid globules in the cells was significantly fewer than those in the sole-cropping P. ostii, which was consistent with other findings in P. ostii [33].
5. Conclusions
In conclusion, this research studied the changes of stress-related physiological indicators and leaf micro-structures of sole-cropping and intercropping P. ostii to explore the reduction effects of understory cultivation on the high-temperature stress of P. ostii. The continuously high temperature had a serious impact on sole-cropping P. ostii, including the continuous increase of high-temperature damage index, ROS accumulation, and relative conductivity, along with the continuous decrease of relative water content, photosynthetic pigment, and photosynthetic capacity. Compared to the sole-cropping P. ostii, the damage of high-temperature stress was reduced in the intercropping P. ostii by reducing the high-temperature damage index, ROS accumulation, antioxidant enzymes activity, and relative conductivity, increasing the relative water content, photosynthetic pigment, photosynthetic capacity, and maintaining the integrity of chloroplasts to a certain extent. Notably, the reduction of high-temperature damage on intercropping P. ostii under C. illinoinensis with row spacing of 4 m × 4 m was stronger than that with row spacing of 4 m × 8 m. These findings provide some reference values for efficient plantation of P. ostii in the middle and lower reaches of the Yangtze River in China.
Author Contributions
Conceptualization, D.Z. and Y.W.; methodology, X.W.; validation, X.W. and Y.T.; resources, D.Z. and Y.W.; data curation, X.W. and Y.T.; writing—original draft preparation, Y.T., X.W. and Y.W.; writing—review and editing, Y.T.; supervision, D.Z.; funding acquisition, D.Z. and Y.W. All authors have read and agreed to the published version of the manuscript.
Funding
This work was supported by the Forestry Science, Technology Innovation and Promotion Project of Jiangsu Province (LYKJ[2021]28) (to D.Z.), the National Natural Science Funds (32102411) (to Y.W.), the Natural Science Foundation of Jiangsu Province of China (BK20200924) (to Y.W.) and the Project funded by China Postdoctoral Science Foundation (2022M722698) (to Y.W.).
Conflicts of Interest
The authors declare no conflict of interest.
References
- Rizvi, S.J.H.; Tahir, M.; Rizvi, V.; Kohli, R.K.; Ansari, A. Allelopathic interactions in agroforestry systems. Crit. Rev. Plant Sci. 1999, 18, 773–796. [Google Scholar] [CrossRef]
- Gosling, E.; Reith, E.; Knoke, T.; Paul, C. A goal programming approach to evaluate agroforestry systems in Eastern Panama. J. Environ. Manag. 2020, 261, 110248. [Google Scholar] [CrossRef]
- Saputra, D.D.; Sari, R.R.; Hairiah, K.; Roshetko, J.M.; Suprayogo, D.; van Noordwijk, M. Can cocoa agroforestry restore degraded soil structure following conversion from forest to agricultural use? Agroforest. Syst. 2020, 94, 2261–2276. [Google Scholar] [CrossRef]
- Fernandez, M.; Alaejos, J.; Andivia, E.; Madejon, P.; Diaz, M.J.; Tapias, R. Short rotation coppice of leguminous tree Leucaena spp. improves soil fertility while producing high biomass yields in Mediterranean environment. Ind. Crop. Prod. 2020, 157, 112911. [Google Scholar] [CrossRef]
- Beule, L.; Lehtsaar, E.; Corre, M.D.; Schmidt, M.; Veldkamp, E.; Karlovsky, P. Poplar rows in temperate agroforestry croplands promote bacteria, fungi, and denitrification genes in soils. Front. Microbiol. 2020, 10, 3108. [Google Scholar] [CrossRef] [Green Version]
- Kumar, A.; Singh, V.; Shabnam, S.; Oraon, P.R. Carbon emission, sequestration, credit and economics of wheat under poplar based agroforestry system. Carbon Manag. 2020, 11, 673–679. [Google Scholar] [CrossRef]
- Wahid, A.; Gelani, S.; Ashraf, M.; Foolad, M.R. Heat tolerance in plants: An overview. Environ. Exp. Bot. 2007, 61, 199–223. [Google Scholar] [CrossRef]
- Szymańska, R.; Ślesak, I.; Orzechowska, A.; Kruk, J. Physiological and biochemical responses to high light and temperature stress in plants. Environ. Exp. Bot. 2017, 139, 165–177. [Google Scholar] [CrossRef]
- Wang, K.X.; Shen, Y.X.; Wang, H.; He, S.L.; Jin, W.S.; Shang, W.Q.; Wang, Z.; Shi, L.L. Effects of exogenous salicylic acid (SA), 6-benzylaminopurine (6-BA), or abscisic acid (ABA) on the physiology of Rosa hybrida ‘Carolla’ under high-temperature stress. Horticulturae 2022, 8, 851. [Google Scholar] [CrossRef]
- Cheng, Z.Y.; Luan, Y.T.; Meng, J.S.; Sun, J.; Tao, J.; Zhao, D.Q. WRKY transcription factor response to high-temperature stress. Plants 2021, 10, 2211. [Google Scholar] [CrossRef]
- Sgarbossa, J.; Elli, E.F.; Schwerz, F.; Nardini, C.; Knapp, F.M.; Schmidt, D.; Lucio, A.D.; Caron, B.O. Bean-soybean succession under full sun and in agroforestry systems: Impacts on radiation use efficiency, growth and yield. J. Agron. Crop Sci. 2020, 207, 362–377. [Google Scholar] [CrossRef]
- Caron, B.O.; Schmidt, D.; Manfron, P.A.; Behling, A.; Eloy, E.; Busanello, C. Efficiency of the use of solar radiation for plants ilex paraguariensis A. St. Hil. cultivated under shadow and full sun. Cienc. Florest. 2014, 24, 257–265. [Google Scholar] [CrossRef] [Green Version]
- Zaro, G.C.; Caramori, P.H.; Wrege, M.S.; Caldana, N.F.D.; das Virgens, J.S.; Morais, H.; Yada, G.M.; Caramori, D.C. Coffee crops adaptation to climate change in agroforestry systems with rubber trees in southern Brazil. Sci. Agric. 2023, 80, e20210142. [Google Scholar] [CrossRef]
- Wang, X.Y.; Shen, L.; Liu, T.T.; Wei, W.W.; Zhang, S.; Li, L.H.; Zhang, W. Microclimate, yield, and income of a jujube-cotton agroforestry system in Xinjiang, China. Ind. Crop. Prod. 2022, 182, 114941. [Google Scholar] [CrossRef]
- Xie, F.D.; Shen, X.Q.; Yu, D.H. Oil Peony Safe and Efficient Production Technology; China Agricultural Publishing House: Beijing, China, 2017. (In Chinese) [Google Scholar]
- Zhang, T.; Zhang, Z.; Qiao, Q.; Liu, W.; Hou, X.G. Effect of Cultivation Methods on Seed Yield Traits, Oil Yield, and Fatty Acid Compositions of Cultivated Paeonia ostii. Hortscience 2022, 56, 1505. [Google Scholar] [CrossRef]
- Yang, Y.Z.; Zhang, Z.H.; Wang, G.X.; Yang, Y.Y.; Guo, H. Photosynthesis, growth, and yield of Paeonia ostii in tree-based agroforestry systems. Photosynthetica 2020, 58, 29–36. [Google Scholar] [CrossRef] [Green Version]
- Han, C.X. Preliminary research on physiological mechanism of thermostability in herbaceous peony. Master’s Dissertation, Yangzhou University, Yangzhou, China, 2013. (In Chinese). [Google Scholar]
- Zhao, D.Q.; Luan, Y.T.; Shi, W.B.; Zhang, X.Y.; Meng, J.S.; Jun, T. A Paeonia ostii caffeoyl-CoA O-methyltransferase confers drought stress tolerance by promoting lignin synthesis and ROS scavenging. Plant Sci. 2021, 303, 110765. [Google Scholar] [CrossRef]
- Xu, J.Q.; Jin, J.J.; Zhao, H.; Li, K.L. Drought stress tolerance analysis of Populus ussuriensis clones with different ploidies. J. For. Res. 2019, 30, 1267–1275. [Google Scholar] [CrossRef]
- Lichtenthaler, H.K. Chlorophylls and carotenoids: Pigments of photosynthetic biomembranes. Methods Enzymol. 1987, 148, 350–382. [Google Scholar]
- Ling, R.; Dai, Z.W.; Dai, X.Y.; Wu, C.M.; Zhai, J.W.; Zheng, Z.X.; Wu, S.S. Evaluation of Heat Tolerance and Screening the Index for the As-sessment of Heat Tolerance in Cultivars of Hydrangea. Chin. J. Trop. Crops 2021, 42, 2209–2218. (In Chinese) [Google Scholar] [CrossRef]
- Zhang, J.P.; Li, D.Q.; Nie, J.J.; Xia, Y.P. Physiological and Biochemical Responses to the High Temperature Stress and Heat Resistance Evaluation of Paeonia lactiflora Pall. Cultivars. J. Nucl. Agric. Sci. 2016, 30, 1848–1856. (In Chinese) [Google Scholar] [CrossRef]
- Guo, P.X.; Yin, T.; Su, C.Q.; Kang, Y.C.; Wang, L.H. Effects of shade on the physiological characteristics of Solanum wrightii seedlings. J. For. Environ. 2020, 40, 76–82. (In Chinese) [Google Scholar] [CrossRef]
- Zhang, T.T.; Tang, Y.H.; Luan, Y.T.; Cheng, Z.Y.; Wang, X.X.; Tao, J.; Zhao, D.Q. Herbaceous peony AP2/ERF transcription factor binds the promoter of the tryptophan decarboxylase gene to enhance high-temperature stress tolerance. Plant Cell Environ. 2022, 45, 2729–2743. [Google Scholar] [CrossRef]
- Gao, Y.; Zhang, Y.X.; Yu, J.L.; Liu, L.; Wang, Y.W.; Zhang, J.X.; Chen, M.H.; Jonathan, M.; Yan, X.B.; Min, X.Y.; et al. Evaluation of shade tolerance of one annual and five perennial Medicago species under different artificial shade levels. N. Z. J. Crop Horti. 2022. [CrossRef]
- Kitao, M.; Utsugi, H.; Kuramoto, S.; Tabuchi, R.; Fujimoto, K.; Lihpai, S. Light-dependent photosynthetic characteristics indicated by chlorophyll fluorescence in five mangrove species native to Pohnpei Island, Micronesia. Physiol. Plant. 2010, 117, 376–382. [Google Scholar] [CrossRef]
- Tang, W.; Guo, H.P.; Baskin, C.C.; Xiong, W.D.; Yang, C.; Li, Z.Y.; Song, H.; Wang, T.R.; Yin, J.N.; Wu, X.L.; et al. Effect of Light Intensity on Morphology, Photosynthesis and Carbon Metabolism of Alfalfa (Medicago sativa) Seedlings. Plants 2022, 11, 1688. [Google Scholar] [CrossRef]
- Zhang, Y.F.; Chen, C.; Jin, Z.X.; Yang, Z.N.; Li, Y.L. Leaf anatomy, photosynthesis, and chloroplast ultrastructure of Heptacodium miconioides seedlings reveal adaptation to light environment. Environ. Exp. Bot. 2022, 195, 104780. [Google Scholar] [CrossRef]
- Bell, G.E.; Danneberger, T.K.; McMahon, M.J. Spectral irradiance available for turf grass growth in sun and shade. Crop Sci. 2000, 40, 189–195. [Google Scholar] [CrossRef]
- Costa, J.M.; Grant, O.M.; Chaves, M.M. Thermography to explore plant-environment interactions. J. Exp. Bot. 2013, 64, 3937–3949. [Google Scholar] [CrossRef] [Green Version]
- Dong, X.J.; Hang, L.B.; Liv, Y.Z.; Sun, H.N.; Liang, Z.H. Effects of shade treatment on photosynthetic physiology of four species of oak seedlings under high temperature stress. J. Jiangsu For. Sci. Technol. 2019, 46, 8–13. (In Chinese) [Google Scholar] [CrossRef]
- Zhao, D.Q.; Han, C.X.; Zhou, C.H.; Tao, J. Shade ameliorates high temperature-induced inhibition of growth in herbaceous peony (Paeonia lactiflora). Int. J. Agric. Biol. 2015, 17, 911–919. [Google Scholar] [CrossRef]
Figure 1.
Effects of understory cultivation on high-temperature damage index and leaf relative water content of P. ostii: (A) high-temperature damage index; (B) leaf relative water content. Values represent mean ± SDs, and * or ** indicate significantly lower or higher among the sole-cropping P. ostii and intercropping P. ostii under C. illinoinensis with row spacing of 4 m × 8 m and of 4 m × 4 m according to Duncan’s multiple range test (* p < 0.05, ** p < 0.01).

Figure 2.
Effects of understory cultivation on the ROS accumulation level of P. ostii: (A) the accumulation level of H2O2; (B) the accumulation level of O2·−.
Figure 2.
Effects of understory cultivation on the ROS accumulation level of P. ostii: (A) the accumulation level of H2O2; (B) the accumulation level of O2·−.

Figure 3.
Effects of understory cultivation on relative electrical conductivity and proline content of P. ostii: (A) relative electrical conductivity; (B) proline content. Values represent mean ± SDs, and * or ** indicate significantly lower or higher among the sole-cropping P. ostii and intercropping P. ostii under C. illinoinensis with row spacing of 4 m × 8 m and of 4 m × 4 m according to Duncan’s multiple range test (* p < 0.05, ** p < 0.01).

Figure 4.
Effects of understory cultivation on antioxidant enzyme activities of P. ostii. Values represent mean ± SDs, and * or ** indicate significantly lower or higher among the sole-cropping P. ostii and intercropping P. ostii under C. illinoinensis with row spacing of 4 m × 8 m and of 4 m × 4 m according to Duncan’s multiple range test (* p < 0.05, ** p < 0.01).

Figure 5.
Effects of understory cultivation on photosynthetic pigments of P. ostii: (A) SPAD values; (B) Chl a content; (C) Chl b content; (D) Chl (a + b) content; (E) carotenoid content. Values represent mean ± SDs, and * or ** indicate significantly lower or higher among the sole-cropping P. ostii and intercropping P. ostii under C. illinoinensis with row spacing of 4 m × 8 m and of 4 m × 4 m according to Duncan’s multiple range test (* p < 0.05, ** p < 0.01).

Figure 6.
Effects of understory cultivation on photosynthetic characteristics of P. ostii. Values represent mean ± SDs, and * or ** indicate significantly lower or higher among the sole-cropping P. ostii and intercropping P. ostii under C. illinoinensis with row spacing of 4 m × 8 m and of 4 m × 4 m according to Duncan’s multiple range test (* p < 0.05, ** p < 0.01).

Figure 7.
Effects of understory cultivation on the anatomical structures of P. ostii: (A–F) SEM image of the leaf lower epidermis and its stomata; (G–L) TEM image of mesophyll cells and its chloroplasts. (A,B,G,H) sole-cropping P. ostii; (C,D,I,J) intercropping P. ostii under C. illinoinensis with row spacing of 4 m × 8 m; (E,F,K,L) intercropping P. ostii under C. illinoinensis with row spacing of 4 m × 4 m. Sg, starch granule; P, plastid pellet; CH, chloroplasts.

Publisher’s Note: MDPI stays neutral with regard to jurisdictional claims in published maps and institutional affiliations. |
© 2022 by the authors. Licensee MDPI, Basel, Switzerland. This article is an open access article distributed under the terms and conditions of the Creative Commons Attribution (CC BY) license (https://creativecommons.org/licenses/by/4.0/).
Share and Cite
MDPI and ACS Style
Tang, Y.; Wang, X.; Wu, Y.; Zhao, D. Reduction of High-Temperature Damage on Paeonia ostii through Intercropping with Carya illinoinensis. Horticulturae 2022, 8, 1201. https://doi.org/10.3390/horticulturae8121201
AMA Style
Tang Y, Wang X, Wu Y, Zhao D. Reduction of High-Temperature Damage on Paeonia ostii through Intercropping with Carya illinoinensis. Horticulturae. 2022; 8(12):1201. https://doi.org/10.3390/horticulturae8121201
Chicago/Turabian StyleTang, Yuhan, Xiaoxiao Wang, Yanqing Wu, and Daqiu Zhao. 2022. "Reduction of High-Temperature Damage on Paeonia ostii through Intercropping with Carya illinoinensis" Horticulturae 8, no. 12: 1201. https://doi.org/10.3390/horticulturae8121201
Note that from the first issue of 2016, this journal uses article numbers instead of page numbers. See further details here.