Article

Shortening the Vegetative Growth Stage of Phalaenopsis Queen Beer ‘Mantefon’ by Controlling Light with Calcium Ammonium Nitrate Levels under Enriched CO2

Department of Horticulture, Biotechnology and Landscape Architecture, Seoul Women’s University, Seoul 01797, Korea
*
Author to whom correspondence should be addressed.
Current address: Research Institute of Climate Change and Agriculture, National Institute of Horticultural and Herbal Science, Rural Development Administration, Jeju 63240, Korea.
Horticulturae 2022, 8(2), 157; https://doi.org/10.3390/horticulturae8020157
Submission received: 10 December 2021 / Revised: 9 February 2022 / Accepted: 9 February 2022 / Published: 11 February 2022
(This article belongs to the Special Issue Advances in Ornamental Plant Cultivation and Physiology)

Abstract

:
The vegetative growth, photosynthetic, and stomatal characteristics were investigated in Phalaenopsis Queen Beer ‘Mantefon’ to determine light’s influence with calcium ammonium nitrate (CAN) levels under 800 μmol·mol−1 CO2. Two lights (150 ± 20 and 300 ± 20 μmol·m−2·s−1) and CAN levels were employed for 40 weeks: calcium, ammonium, and nitrate levels by 0.90, 0.55, and 2.97 mmol·L−1 (CAN1), 8.63, 1.11, and 6.05 mmol·L−1 (CAN2), 12.80, 1.72, and 9.13 mmol·L−1 (CAN3), and 18.80, 2.27, and 12.20 mmol·L−1 (CAN4), respectively. The number of leaves increased in the plants grown at 300 ± 20 μmol·m−2·s−1 with CAN1 compared to control. Plants grown at 300 ± 20 μmol·m−2·s−1 with CAN4 had the lowest number of leaves among all plants. The time to the mature leaf span decreased in the plants grown at 300 ± 20 μmol·m−2·s−1 with CAN1. The net CO2 uptake was higher in the plants grown at 300 ± 20 μmol·m−2·s−1 than those grown at 150 ± 20 μmol·m−2·s−1 with CAN1–3 conditions. The water-use efficiency is higher in the plants grown with CAN1 than those with CAN2–4 at 300 ± 20 μmol·m−2·s−1. The maximum stomatal aperture was the largest in the plants grown at 300 ± 20 μmol·m−2·s−1 with CAN1–2 among all plants. Consequently, light levels of 300 ± 20 μmol·m−2·s−1 in Phalaenopsis Queen Beer ‘Mantefon’ must be accompanied by nutrient CAN1 to improve photosynthesis and stomatal activity and promote leaf growth under 800 μmol·mol−1 CO2 conditions.

1. Introduction

Phalaenopsis is a genus of epiphytic orchids found mainly in tropical Asia [1,2]. Phalaenopsis Queen Beer ‘Mantefon’ is an essential plant in Asia, especially China, Japan, and Korea, due to its intense red color flower petals and many small flowers in one flower spike. Many Phalaenopsis species exhibit an obligate CAM pattern characterized by day/night fluctuations of photosynthetic characteristics [3] and nocturnal CO2 absorption [2].
The vegetative growth stage, during which a plant is insensitive to conditions that promote floral initiation [4], varies among different plant species. For Kalanchoe spp., the period of the vegetative growth stage is 44–55 days [5], whereas the average length of the vegetative growth stage in Cymbidium orchid is between 2 and 3 years [6]. Suppose a plant is prematurely exposed to reproductive growth conditions before the end of the vegetative growth stage. In that case, the plant may not support quality flowers and thereby decrease the uniformity of flowering [7]. Vigorous vegetative growth of five leaves and 25 cm leaf span is desirable to induce flowering in Phalaenopsis [8]. Meeting the minimum leaf formation is important before floral initiation for plant quality [9].
Elevated heating and cooling often generate a large amount of surplus CO2. The surplus CO2 can be used in ornamental greenhouse production by high efficient distributed power generation system [10]. Surplus CO2 enhanced photosynthetic carbon assimilation, growth, and flowering of Phalenopsis Queen Beer ‘Mantefon’ in a commercial greenhouse [11]. The number of leaves, leaf length, and leaf width displayed more significant increases when Phalaenopsis ‘Fuller’s Pink Swallow’ plants were grown under 1600 and 2400 μmol·mol−1 CO2 than under 400 μmol·mol−1 CO2 [12]. Net CO2 assimilation rate increased in Phalaenopsis Queen Beer ‘Mantefon’ grown under 800 and 1600 μmol·mol−1 CO2 compared to those grown under 400 μmol·mol−1 CO2 [13]. Since Phalaenopsis is an ornamental CAM plant, photosynthesis requires 800–1000 μmol·mol−1 CO2 to reach normal saturation [13,14]. Commercial production of Phalaenopsis cultivated at 800 μmol·mol−1 CO2 in a greenhouse, resulting in a significant increase in plant growth and yield of good quality flowers.
The photosynthesis of Phalaenopsis saturates at a light level of 130–180 μmol·m−2·s−1 [15,16]. Photoinhibition occurs when plants are exposed to a light level higher than 200 μmol·m−2·s−1 than those to a light level below 125 μmol·m−2·s−1 in Phalaenopsis amabilis (L.) Blume [17] at an ambient CO2 concentration. Naing et al. (2016) [18] suggested the leaf growth rate increased in the plants grown with combined CO2 enrichment, 1000 μmol·mol−1 and light level, 250 μmol·m−2·s−1. Similarly, the combined effect improved seedling growth and yield of chrysanthemum [19]. Cho et al. (2019) [20] observed more floral buds and flowers in Phalaenopsis Queen Beer ‘Mantefon’ when plants were grown under a light level of 260 ± 40 μmol·m−2·s−1 and 800 μmol·mol−1 CO2 than when they were grown under 400 μmol·mol−1 CO2.
Phalaenopsis Tam Butterfly plants fertigated with nitrogen (N) concentration of 200 mg·L−1 had a wider leaf spread, produced more and larger leaves, and had greater total leaf areas than those with N of 100 mg·L−1 [21]. Increasing the N concentration from 50 to 200 mg·L−1 promoted leaf production in white-flowered Phalaenopsis hybrid [P. amabilis (L.) Blume × P. Mount Kaala ‘Elegance’] [22]. Plant photosynthetic responses under enriched CO2 conditions require additional nutrients, including N, phosphorus, and potassium [23,24,25]. Higher production due to CO2 enrichment increases the nutrient consumption of plants and therefore lowers the salinity level in nutrient solution [26]. Calcium ammonium nitrate (CAN) is a granulated nitrogenous inorganic fertilizer that supplies 25–28% with the lowest carbon footprint of any fertilizer product [27]. Exogenous calcium (Ca) treatment can increase a plant’s tolerance to adverse environments by regulating N metabolism [28]. Limiting nutrients such as Ca deficiency could reduce shoot dry mass and cause abortion of the apical meristem in Eustoma cultivars [29]. However, the loss of photosynthetic capacity in Phalaenopsis ‘Ney Shan Gu Niang’ grown at enriched CO2 could be improved by adding N to the nutrient supply in proportion to the relative growth rate of the plant [30,31].
We examined the effects of the combination of light and CAN levels on the vegetative growth under 800 μmol·mol−1 CO2 on the leaf growth, photosynthesis, and chlorophyll a fluorescence and stomatal characteristics of Phalaenopsis Queen Beer ‘Mantefon’. This study may provide information for using surplus CO2 in floriculture crop production.

2. Materials and Methods

2.1. Plant Materials and Growth Conditions

Phalaenopsis Queen Beer ‘Mantefon’ plants were purchased from Orchid Nursery in Paju, Korea (latitude 37° N, longitude 126° E) and transplanted into 10 cm pots (0.5 L container) after 36 weeks of growth. The pots contained 100% Chilean dried Sphagnum moss (Lonquen, Ltd., Puerto Montt, Chile). Mean temperature, relative humidity, and solar light levels were 29 ± 2 °C, 70 ± 10%, and 250 μmol·m−2·s−1, respectively. The plants had a mean of 3.6 leaves and a leaf span of 18.3 cm (longest opposing leaf to a horizontal position).
Purchased plants were moved to the growth chambers (HB-303DHC, Hanbaek Scientific Co., Ltd., Suwon, Korea) of Seoul Women’s University (Seoul, Korea) on 18 March 2017, acclimated for two weeks before the treatments. Mean day/night temperatures, relative humidity, and daylength were 29/25 °C, 70% at constant, and 12 h (06:00–18:00 HR), respectively.
Atmospheric CO2 concentrations of the growth chambers were maintained at an ambient concentration (approximately 400 μmol·mol−1 CO2) from 06:00 to 00:00 HR. The CO2 concentration was enriched during 00:00–06:00 HR, the last 6 h of the dark period. The 800 μmol·mol−1 CO2 was supplied with pure CO2 from compressed gas cylinders (Bottle CO2 ≥ 99.9%) (Seoul Specialty Gases Co., Ltd., Seoul, Korea) with 50 mL·min−1 flow, controlled with an infrared gas analyzer (KCD-HP, Korea Digital, Seoul, Korea) and monitored with a CO2 analyzer (AM-21A, WISE Sensing Inc., Yongin, Korea). The experiment was conducted from 1 April 2017 to 17 January 2018 (40 weeks).

2.2. The Combination of Light and Calcium Ammonium Nitrogen Levels

The two-factor design was conducted to determine the effects of the pairwise combinations between light and calcium ammonium nitrogen (CAN) with 22 replicates at each treatment. Eight treatments were configured with the two levels of lights, 150 ± 20 and 300 ± 20 μmol·m−2·s1, and the four levels of CAN (Table 1) as follows: 150 ± 20 μmol·m−2·s−1 with CAN1 (Control), 150 ± 20 μmol·m−2·s−1 with CAN2, 150 ± 20 μmol·m−2·s−1 with CAN3, 150 ± 20 μmol·m−2·s−1 with CAN4, 300 ± 20 μmol·m−2·s−1 with CAN1, 300 ± 20 μmol·m−2·s−1 with CAN2, 300 ± 20 μmol·m−2·s−1 with CAN3, and 300 ± 20 μmol·m−2·s−1 with CAN4.
The light source was three−wave cool white fluorescent lamps (Triband phosphor fluorescent lamps, Dulux L 36 W, Osram Korea Co., Ansan, Korea) and metal halide lamp (MH; GEO−MH 100W−L/P, Geo Lighting, Anseong, Korea), and the photosynthetic photon flux (PPF) was measured using a quantum light meter (3415FSE, Spectrum Technologies Inc., Aurora, IL, USA).
The four CAN levels were adjusted using 0N–52P–35K (Krista MKP, Yara, Oslo, Norway), 12N–61P–0K (Krista MAP, Yara), 11N–0P–0K (Krista MAG, Yara), and 14N–0P–46K (Krista K, Yara). Calcium (Ca), ammonium (NH4), and nitrate (NO3) were 0.90, 0.55, and 2.97 mmol·L−1 (CAN1); 8.63, 1.11, and 6.05 mmol·L−1 (CAN2); 12.80, 1.72, and 9.13 mmol·L−1 (CAN3); and 18.80, 2.27, and 12.20 mmol·L−1 (CAN4), respectively (Table 1). The levels of total N, electrical conductivity (EC), and pH of each CAN level were also described in Table 1. The EC and pH were measured with a portable EC/pH/TDS meter (HI9811-5, Hanna Instruments, Woonsocket, RI, USA). Each plant was fertigated with 150 mL of nutrient solution weekly during the experimental period.

2.3. Measurements of Leaf Growth

The number of leaves, time to the fifth leaf emergence, and time to the mature leaf span were measured weekly for each plant. The number of leaves with lengths of ≥0.5 cm was measured for each plant every four weeks for 40 weeks. The time to the fifth leaf emergence from the start of the treatments, along with the leaf number above 5, was measured. The time to the mature leaf span was when the leaf span reached 25 cm. The leaf growth was measured with 13 replicated plants per treatment.

2.4. Measurements of Gas Exchange and Chlorophyll a Fluorescence

Gas exchanges were measured on the uppermost fully opened mature leaf at 20 weeks after treatments (WAT) using a portable photosynthesis system (Li-6400XT, Li-Cor Inc., Lincoln, NE, USA) equipped with an infrared gas analyzer. The leaf temperature was kept at 29 and 25 °C during the day and night, respectively. Relative humidity in the leaf chamber ranged from 55% to 70%. The CO2 concentration inside the leaf chamber was maintained at 800 μmol·mol1 CO2, which equals the level in the growth chamber. The net CO2 uptake, water-use efficiency (WUE), stomatal conductance (gs), and transpiration rate (tr) were measured during 00:00–03:00 HR. The instantaneous WUE was calculated as WUE = net CO2 uptake/tr [32]. Gas exchanges were measured with three replicated plants per treatment.
Pulse-amplitude modulated (PAM) fluorometry has become a powerful tool in the study of plant photosynthesis and is increasingly being used for ecological monitoring in situ [22,33,34]. Chlorophyll a fluorescence was simultaneously measured on the same leaves used to measure gas exchanges using chlorophyll a fluorometer (JUNIOR PAM, Walz, Effeltrich, Germany) at 20 WAT. The maximum photochemical efficiency (Fv/Fm), representing the energy capture efficiency by open photosystem II (PSII), was estimated after 15 min dark adaptation. The actual quantum yield of PSII (ΦPSII), described as the fraction of absorbed light utilized through photochemistry, and non-photochemical quenching (NPQ) were measured after 15 min light adaptation at an actinic PPF of 275 μmol·m−2·s−1. Chlorophyll a fluorescence was measured at the middle of the day during 11:00–13:00 HR, considering that ΦPSII of Phalaenopsis increased from the sunrise and declined at the end of a day at 12 h photoperiod in a greenhouse [35]. Chlorophyll a fluorescence was measured with three replicated plants per treatment.

2.5. Stomatal Aperture Width, Length, Maximum Stomatal Aperture, and Stomatal Index Measurements

Nail varnish (Shine topcoat, Missha, Korea) was applied to abaxial surfaces of fully expanded leaves, and nail varnish peels were taken from leaves. Cell counts were taken from the broadest area of one leaf, each from at least three replicated plants per treatment. The stomatal aperture width, length, and maximum stomatal apertures were determined by light microscopy (Nikon-YS100, Nikon Co., Tokyo, Japan), using a fitted camera (Smart-adapter, AT microscope, Gyeonggi-do, Korea), and measured using ImageJ software v. 1.8.0.
The maximum stomatal aperture (amax) was estimated from
a m a x =   π × W a × L a   4
where Wa is the stomatal aperture width and La is the stomatal aperture length.
The stomatal index (SI) was estimated from
S I % =   S   S + E × 100
where S is the number of stomata and E is the number of epidermal cells.

2.6. Statistical Analysis

Statistical analyses were performed using the SAS system for version 9.4 (SAS Inst., Inc., Cary, NC, USA). Duncan’s multiple range test assessed differences among the treatments at p ≤ 0.05. The graph module analysis was made by SigmaPlot program version 10.0 (Systat Software Inc., San Jose, CA, USA).

3. Results

3.1. Leaf Growth Characteristics

The number of leaves on the plants grown at 300 ± 20 μmol·m−2·s−1 conditions was higher than that of 150 ± 20 μmol·m−2·s−1 at 12–20 WAT, regardless of CAN levels (Figure 1a). The number of leaves was significantly greater in the plants grown at 300 ± 20 μmol·m−2·s−1 with CAN1 than those grown under control conditions at 24–32 WAT. At 36–40 WAT, the number of leaves was the highest on the plants grown at 300 ± 20 μmol·m−2·s−1 condition with CAN1 than those grown with CAN2–4 conditions. However, the plants grown at 300 ± 20 μmol·m−2·s−1 with CAN4 exhibited the lowest leaves appearing at 36–40 WAT.
The plants grown at 300 ± 20 μmol·m−2·s−1 emerged the fifth leaf within 12 WAT regardless of CAN levels, whereas none of the plants appeared the fifth leaf at 150 ± 20 μmol·m−2·s−1 conditions within 12 WAT (Figure 1b). The time to the mature leaf span was 20.0, 21.2, 16.0, 20.3, and 21.3 WAT, respectively, in the plants grown under control, at 150 ± 20 μmol·m−2·s−1 with CAN2, and at 300 ± 20 μmol·m−2·s−1 with CAN1–3 conditions (Figure 1c). None of the plants had a mature leaf span when they grew at 150 ± 20 μmol·m−2·s−1 with CAN3–4 and 300 ± 20 μmol·m−2·s−1 with CAN4 during the experiment (40 weeks) (Figure 1c).

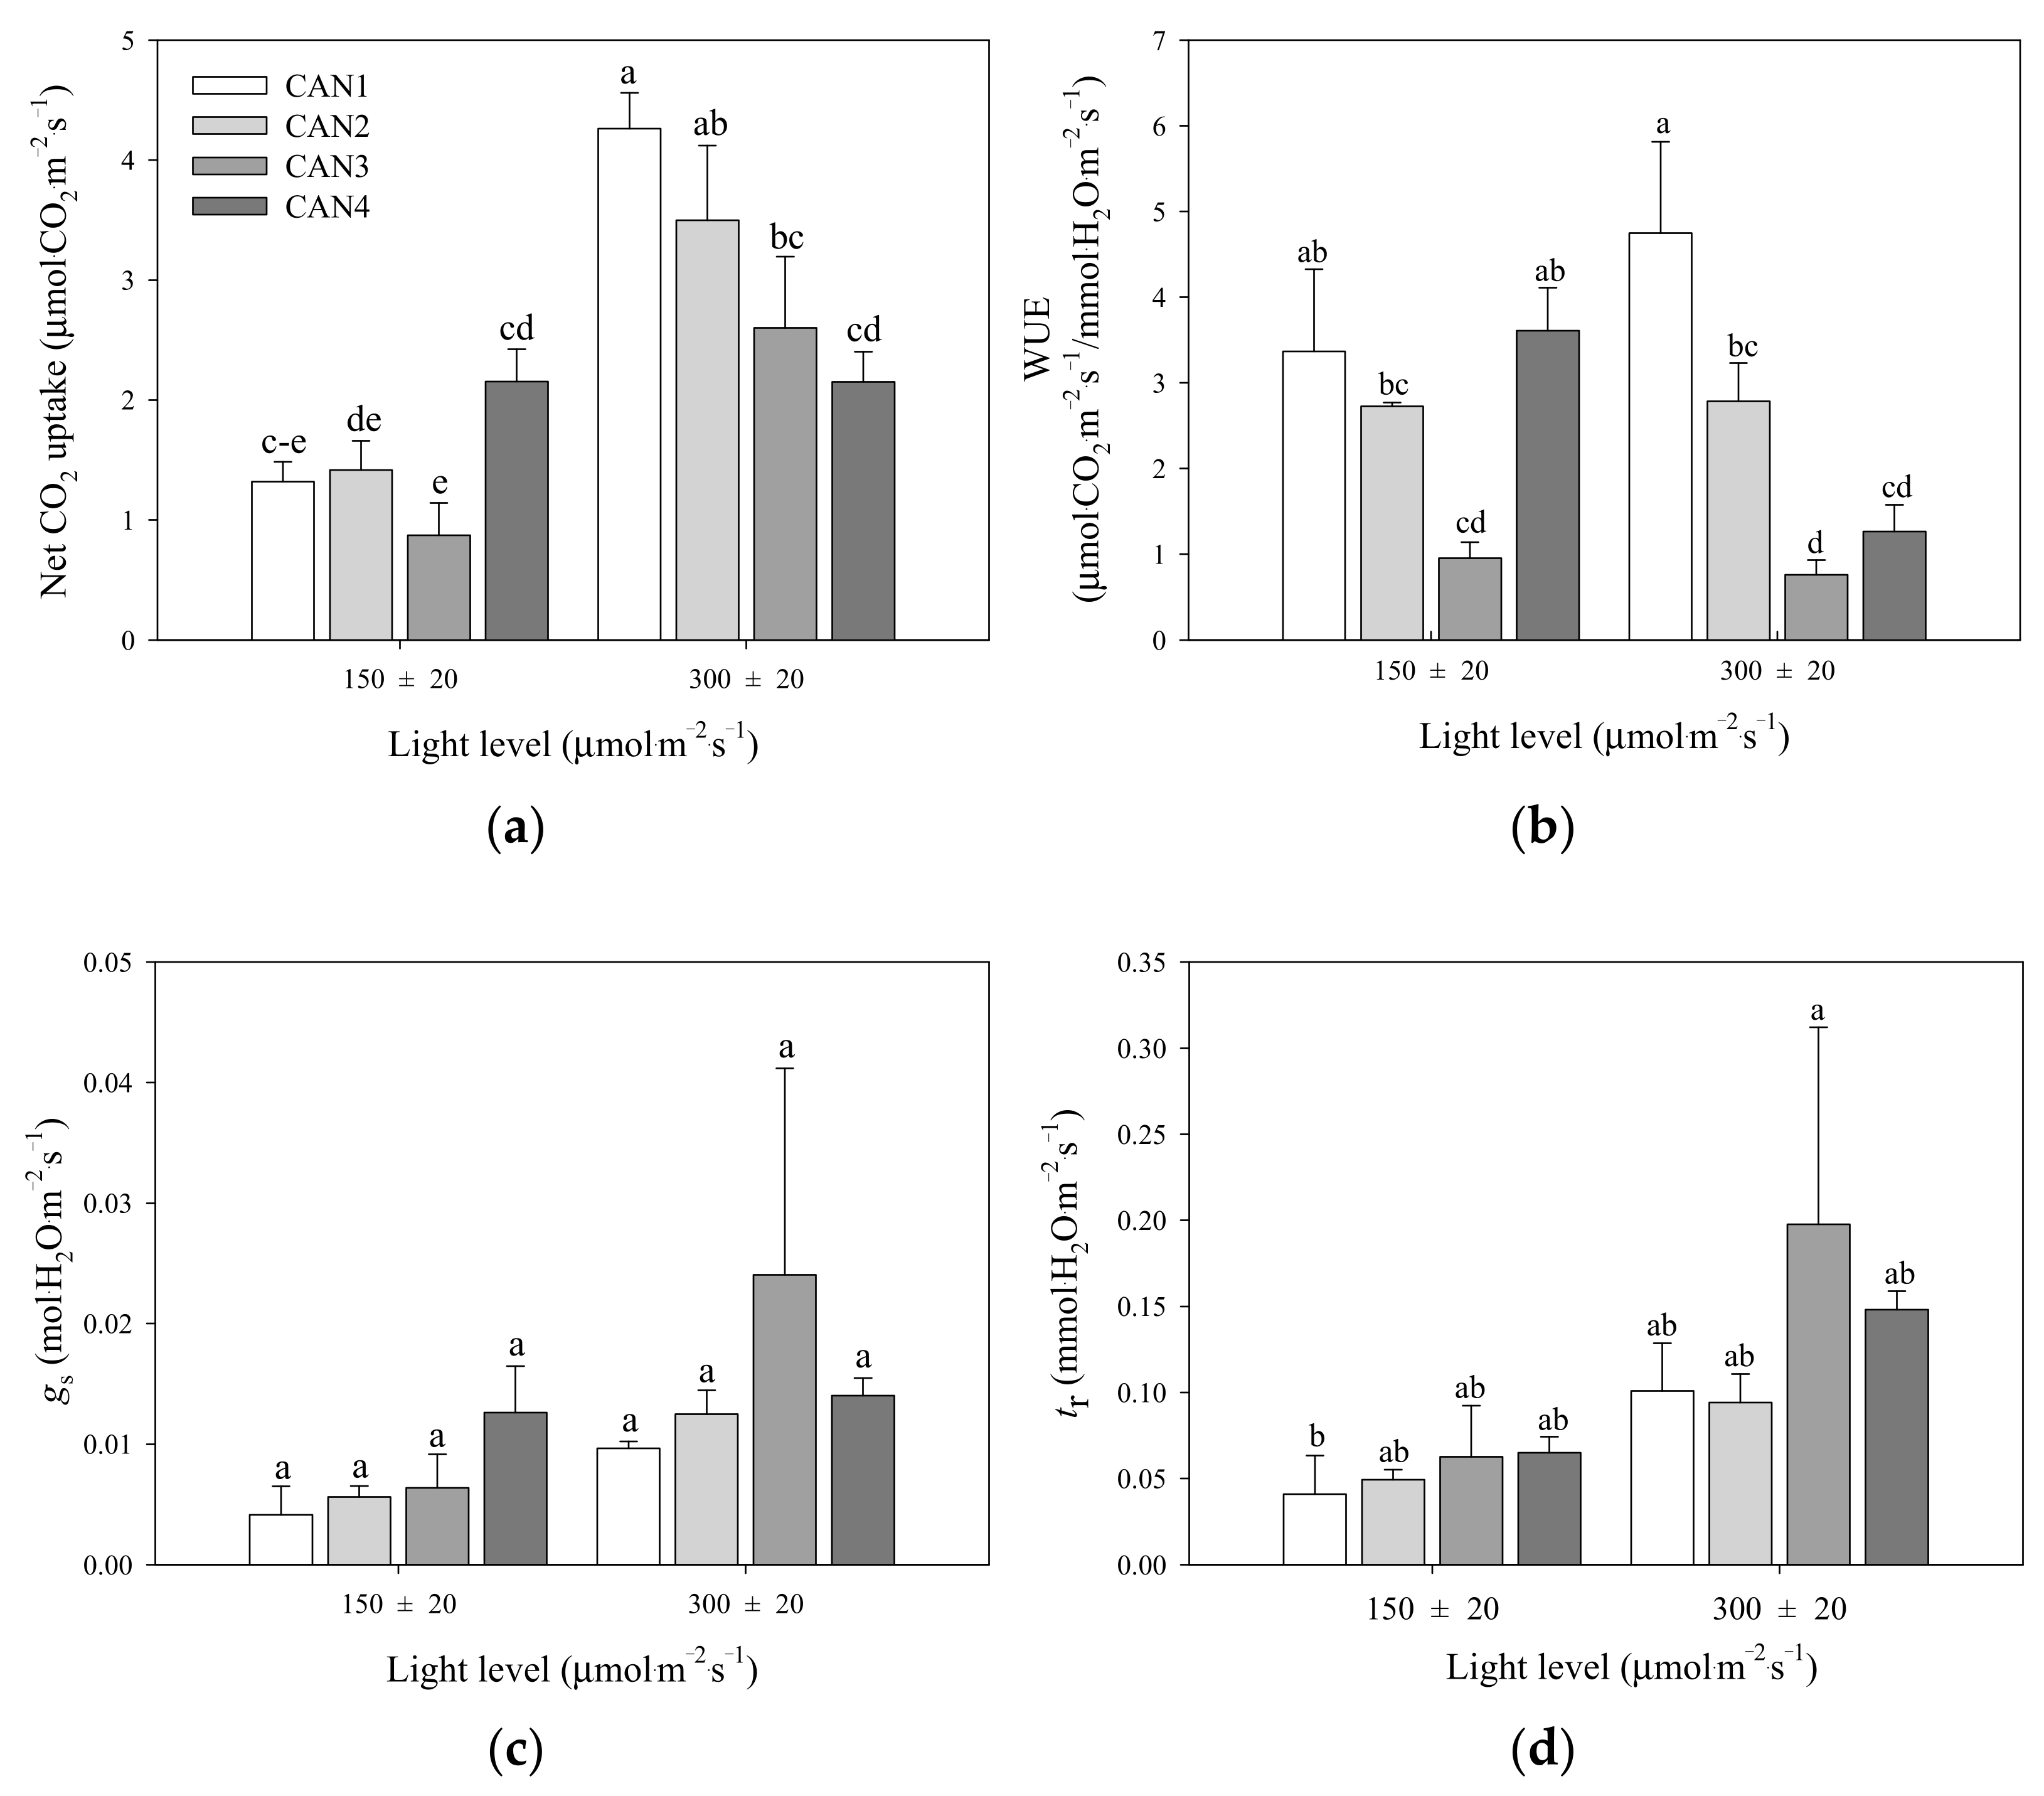
3.2. Photosynthetic Characteristics

The net CO2 uptake was significantly greater in the plants grown at 300 ± 20 μmol·m−2·s−1 with CAN1–3 conditions than those grown at 150 ± 20 μmol·m−2·s−1 with CAN1–3 (Figure 2a). Maximum net CO2 uptake, 4.3 μmol·CO2·m−2·s−1, showed in the plants grown at 300 ± 20 μmol·m−2·s−1 with CAN1 condition. The net CO2 uptake was higher in the plants grown at 300 ± 20 μmol·m−2·s−1 with CAN1–2 than those grown under control conditions. The decrease of WUE at 300 ± 20 μmol·m−2·s−1 with CAN1–3 conditions was more apparent in the plants than in the plants grown at 150 ± 20 μmol·m−2·s−1 with CAN1–3 conditions (Figure 2b). The changes of gs and tr did not completely conform to the net CO2 uptake (Figure 2a,c,d).

3.3. Chlorophyll a Fluorescence

The ratios Fv/Fm of dark-adapted samples determine the maximal quantum efficiency of PSII. The values detected on the adaxial surface all appeared to be ranged from 0.617–0.715 (Table 2), suggesting that all PSII functioned not normally, respective of the light condition of growth. The plants grown at 300 ± 20 μmol·m−2·s−1 with CAN4 condition had the lowest Fv/Fm. The ΦPSΙΙ represents a measure of the fraction of absorbed light utilized through photochemistry. The ΦPSΙΙ was greater in the plants grown at 150 ± 20 μmol·m−2·s−1 than those with 300 ± 20 μmol·m−2·s−1 treatments, regardless of CAN levels (Table 2). The NPQ is related to the energy dissipation of the excess radiation to heat in the antenna of PSII in the light-adapted state. There were no significant differences in the NPQ among the treatments (Table 2).

3.4. Stomatal Aperture Width, Length, Maximum Stomatal Aperture, and Stomatal Index

The stomatal aperture width and length were promoted in the plants grown at 300 ± 20 μmol·m−2·s−1 with CAN1–2 conditions (Table 3). This significant promotion of average stomatal aperture width and length might maximize the stomatal aperture (Table 3). There were no significant differences in the stomatal index depending upon light levels. The stomatal index decreased in the plants grown at 150 ± 20 μmol·m−2·s−1 with CAN2 and those at 300 ± 20 μmol·m−2·s−1 with CAN3–4 compared to those under control (Table 3).

4. Discussion

Sexual reproduction is delayed until plants reach leaf numbers and sizes (leaf span) sufficient to maintain the energetic demands of flowering. Increasing light level with night interruption increased the number of leaves, leaf length, decreased time to flowering, and improved final plant quality in Cymbidium ‘Red Fire’ and ‘Yokihi’ [6]. Compared to plants in the control group, those grown at 300 ± 20 μmol·m−2·s−1 conditions had more significant numbers of leaves at 24–32 WAT, along with decreased time to the fifth leaf emergence and mature leaf span during the vegetative growth stage (Figure 1). Oh et al. (2008) [36] reported that the sufficient plant growth of 8 leaves and 28 flower numbers in Cyclamen could be achieved by increasing the net CO2 uptake with a light level of 200 μmol·m−2·s−1. Leaf span is increased when either cell expansion or cell division is enhanced [37]. Increased cell division appears to be supported by increased translocate of assimilates and carbohydrate availability in shoot apical meristems [38]. This experiment shows that for Phalaenopsis, increasing light level with CAN1 can be considered a method to promote growth rate than the control plants. This may be because Phalaenopsis Queen Beer ‘Mantefon’ grown at 300 ± 20 μmol·m−2·s−1 with CAN1 fixes more large amounts of carbon in photosynthesis than other levels. The net CO2 uptake in the plants grown at 300 ± 20 μmol·m−2·s−1 with CAN1–3 was 2.5 to 5.5 times greater than those grown at 150 ± 20 μmol·m−2·s−1 under enriched CO2 conditions (Figure 2a).
Monitoring photochemical efficiency of PSII is considered the most sensitive part of the photosynthetic pathway to plant stress [39]. Pulse-amplitude modulated fluorescence measurements have been used to identify changes in the physiological status of plants in response to changing environments before morphological changes are evident [33]. In non-stressed plants, the Fv/Fm is about 0.77–0.81 for most plant species [40]. When plants are exposed to stressful conditions, the values of the Fv/Fm drop significantly [41]. Decrease of the Fv/Fm and ΦPSΙΙ has indicated either down-regulation or recovery of PSII and photoinhibition [32], which adjustments in photochemical capacity can cause the thermal dissipation capacity or both. Decrease in the Fv/Fm due to diurnal photo-inhibition may improve more rapidly in many environments as light levels and CO2 concentration, and nitrogen [42]. Plants are adapted to environments by allocating excessive energy and increasing energy dissipation through the NPQ, which may serve as a photo-protection response [43]. This might be related to the fact that our study site 300 ± 20 μmol·m−2·s−1 with CAN4 level exceeded the tolerance threshold levels (Table 2), resulting in a decrease in the photochemical efficiency of Phalaenopsis Queen Beer ‘Mantefon’ under 800 μmol·mol−1 CO2.
In commercial production, the ability to schedule potted Phalaenopsis to flower during periods of high energy cost is desirable because it allows precise ornamental plants’ scheduling and improves production efficiency. CO2 enrichment allows Phalaenopsis to continue to initiate leaf. Enriched CO2 of 800–1600 μmol·mol−1 promoted the leaf growth and net CO2 uptake in many Phalaenopsis, including ‘Fuller’s Pink Swallow’ [12], ‘Ney Shan Gu Niang’ [30], and Queen Beer ‘Mantefon’ [13,14]. According to Lin and Tsu (2004) [17], the threshold light level for photosynthesis and starch accumulation in Phalaenopsis amabilis (L.) Blume was < 200 μmol·m−2·s−1. Only the plants were flowered when they were grown at 260 ± 40 μmol·m−2·s−1 compared to that grown at 90 ± 10 μmol·m−2·s−1 under CO2 of 800 μmol·mol−1 conditions in Phalaenopsis Queen Beer ‘Mantefon’ [20]. In the present study, leaf emergence is fastened in the plants grown at 300 ± 20 μmol·m−2·s−1 along with 800 μmol·mol−1 CO2 compared to that grown at 150 ± 20 μmol·m−2·s−1, regardless of CAN level (Figure 1b). Shortening the fifth leaf emergence can be promoted flowering [8].
Stomatal morphogenesis and behavior are controlled by genetic and environmental factors such as light [44,45] and CO2 enrichment [46]. The status of stomata governs the overall net CO2 uptake and WUE from plants [45]. The fine regulation of opening and closure of stomata in response to light and nutrients is crucial to ornamental crop production. The increase of stomatal aperture length and width and maximum stomatal aperture indicated a rise in overall stomatal pore area through the regulations of membrane transport of guard cells [45]. The stomatal index represents the ratio of the number of stomata to the number of stomata and epidermal cells per unit leaf area, serving as a sensitive parameter detecting stomatal frequency changes [47]. Increasing light levels from 90 to 250 μmol·m−2·s−1 increased tobacco leaf stomatal aperture length and stomatal index. An increase in the stomatal aperture with increasing light level from 10% sunlight to full sunlight has also been previously noted in two Eucalyptus globulus ssp. [48]. The larger stomata in 200 μmol·m−2·s−1 provide higher CO2 intake and enhanced leaf cooling through transpiration water loss [49]. The plants have adapted to certain light levels by maintaining low or high stomatal index [45]. Here, Phalaenopsis Queen Beer ‘Mantefon’ stomata showed an increased response to the light level of 300 ± 20 μmol·m−2·s−1 with CAN1–2 by significantly increasing the stomatal aperture width and length (Table 3). Those findings indicated that the stomatal aperture might be a critical determinant for photosynthesis and Phalaenopsis Queen Beer ‘Mantefon’ leaf growth.
The enriched CO2 increased plant growth only when there was high nutrient availability [23,24]. Adding Ca fertilizer can promote plant growth and significantly increase plant yield in tomatoes [50] and cucumber and melon [51]. This may be connected with the findings that Ca promotes N’s absorption by plants, increases NO3 enzyme activity in the leaf, and enhances plant photosynthetic capacity [50,52]. But 15N tracer of N results confirmed that rising of Ca levels forms antagonistic effects under high levels, affecting N absorption, distribution, or utilization in plants, and finally influencing the plant growth of apples [52]. Ca and N added into irrigation water can significantly improve the plant growth, fruit yield, and membrane permeability affected by high salinity and can also correct both Ca and N deficiencies in tomato and pepper fruit [53]. However, the lowest 15N absorption was observed in Ca–free treatment, and the highest uptake was under 6 mmol·L−1 Ca supply [52]. In the present study, the WUE of the plants grown at 300 ± 20 μmol·m−2·s−1 with CAN1 condition was approximately 41–73% greater than those grown with CAN2–4 conditions at the same light level (Figure 2b). Water use decreased when saline water was used [53]. Sonneveld and Voogt (1999) [51] have reported that the WUE in tomatoes was reduced with high NaCl. A moderate Ca fertilizer supply of CAN1 consisting of 0.90 mmol·L−1 is crucial to ensure better growth and improve N absorption in the plants.

5. Conclusions

Plants grown at 300 ± 20 μmol·m−2·s−1 with CAN1 should have vigorous vegetative growth that will rapidly attain the minimum leaf size required for flowering and have leaves greater in number than those grown under control conditions and all the plants grown with CAN2–4. In this study, 300 ± 20 μmol·m−2·s−1 with CAN1 condition increased Phalaenopsis net CO2 uptake and maximum stomatal aperture. This data suggest that crop time can be decreased when the light level of 300 ± 20 μmol·m−2·s−1 with CAN1 consisting of 0.90 mmol·L−1 Ca, 0.55 mmol·L−1 NH4, and 2.97 mmol·L−1 NO3 for Phalaenopsis cultivation than the control conditions. Consequently, light levels of 300 ± 20 μmol·m−2·s−1 in Phalaenopsis Queen Beer ‘Mantefon’ must be accompanied by nutrient CAN1 to improve the photosynthesis and stomatal activity and promote the leaf growth under 800 μmol·mol−1 CO2 condition.

Author Contributions

Conceptualization, A.R.C. and Y.J.K.; methodology, A.R.C., S.W.C. and Y.J.K.; validation, A.R.C., S.W.C. and Y.J.K.; formal analysis, A.R.C. and S.W.C.; investigation, A.R.C.; writing—original draft preparation, A.R.C., S.W.C. and Y.J.K.; writing—review and editing, S.W.C. and Y.J.K.; visualization, A.R.C. and Y.J.K.; supervision, Y.J.K.; project administration, Y.J.K.; funding acquisition, Y.J.K. All authors have read and agreed to the published version of the manuscript.

Funding

This research was funded by the National Research Foundation of Korea, grant number “NRF-2018R1A2B6007834” and Seoul Women’s University “2021–0104”.

Institutional Review Board Statement

Not applicable.

Informed Consent Statement

Not applicable.

Conflicts of Interest

The authors declare no conflict of interest.

References

  1. Tsai, C.C. Molecular Phylogeny and Biogeography of Phalaenopsis Species; World Scientific: Singapore, 2011; pp. 1–24. [Google Scholar]
  2. Guo, W.J.; Lin, Y.Z.; Lee, N. Photosynthetic light requirements and effects of low irradiance and daylength on Phalaenopsis amabilis. J. Am. Soc. Hortic. Sci. 2012, 137, 465–472. [Google Scholar] [CrossRef] [Green Version]
  3. Liu, Y.C.; Liu, C.H.; Lin, Y.C.; Lu, C.H.; Chen, W.H.; Wang, H.L. Effect of low irradiance on the photosynthetic performance and spiking of Phalaenopsis. Photosynthetica 2016, 54, 259–266. [Google Scholar] [CrossRef] [Green Version]
  4. Bernier, G.; Kinet, J.M.; Sachs, R.M. Control by Nutrition and Water Stress; CRC Press: Boca Raton, FL, USA, 1981; pp. 13–20. [Google Scholar]
  5. Huang, C.H.; Chu, C.Y. The flower development and photoperiodism of native Kalanchoe spp. in Taiwan. Sci. Hortic. 2012, 146, 59–64. [Google Scholar] [CrossRef]
  6. Kim, Y.J.; Lee, H.J.; Kim, K.S. Night interruption promotes vegetative growth and flowering of Cymbidium. Sci. Hortic. 2011, 130, 887–893. [Google Scholar] [CrossRef]
  7. Cameron, A.; Yuan, M.; Heins, R.; Carlson, W. Juvenility: Your perennial crop’s age affects flowering. GrowerTalks 1996, 60, 30–32. [Google Scholar]
  8. Blanchard, M.; Lopez, R.; Runkle, E.; Wang, Y.T.; Lopez, R. Growing the best Phalaenopsis. Orchids 2007, 4, 266–271. [Google Scholar]
  9. Purvis, O.N. An analysis of the influence of temperature during germination on the subsequent development of certain winter cereals and its relation to the effect of length of day. Ann. Bot. 1934, 48, 919–955. [Google Scholar] [CrossRef]
  10. Lee, S.M.; Lee, Y.D.; Kim, S.Y.; Kim, C.U.; Park, K.S. Study on GHP-based integrated energy generation system for horticulture. Korean Soc. Agric. Mach. 2015, 20, 393–394. [Google Scholar]
  11. Cho, A.R.; Choi, S.H.; Kim, Y.J. Flowering and photosynthetic responses of Phalaenopsis under elevated CO2 and nutrient supply. Hortic. Sci. Technol. 2020, 38, 595–607. [Google Scholar]
  12. Kim, H.J.; Cho, A.R.; Park, K.S.; Kim, Y.J. Effect of CO2 enrichment on growth and flowering of Phalaenopsis. Hortic. J. 2017, 86, 389–394. [Google Scholar]
  13. Yun, D.L.; Kim, H.J.; Kim, Y.J. CO2 enrichment increased leaf initiation and photosynthesis in Doritaenopsis Queen Beer ‘Mantefon’ orchids. Hortic. Environ. Biotechnol. 2018, 59, 159–165. [Google Scholar] [CrossRef]
  14. Song, S.J.; Yun, D.L.; Cho, A.R.; Kim, Y.J. Photosynthetic and growth response of Phalaenopsis Queen Beer ‘Mantefon’ to variable CO2 concentrations at different vegetative growth stages. Flower Res. J. 2019, 27, 9–16. [Google Scholar] [CrossRef]
  15. Ota, K.; Morioka, K.; Yamamoto, Y. Effects of leaf age, inflorescence, temperature, light intensity and moisture conditions on CAM photosynthesis in Phalaenopsis. J. Jpn. Soc. Hortic. Sci. 1991, 60, 125–132. [Google Scholar] [CrossRef] [Green Version]
  16. Lootens, P.; Heursel, J. Irradiance, temperature, and carbon dioxide enrichment affect photosynthesis in Phalaenopsis hybrids. HortScience 1998, 33, 1183–1185. [Google Scholar] [CrossRef] [Green Version]
  17. Lin, M.J.; Hsu, B.D. Photosynthetic plasticity of Phalaenopsis in response to different light environments. J. Plant Physiol. 2004, 161, 1259–1268. [Google Scholar] [CrossRef] [PubMed]
  18. Naing, A.H.; Jeon, S.M.; Park, J.S.; Kim, C.K. Combined effects of supplementary light and CO2 on rose growth and the production of good quality cut flowers. Can. J. Plant Sci. 2016, 96, 503–510. [Google Scholar] [CrossRef] [Green Version]
  19. Mortensen, L.M.; Moe, R. Growth responses of some greenhouse plants to environment. V. Effect of CO2, O2 and light on net photosynthetic rate in Chrysanthemum morifolium Ramat. Sci. Hortic. 1983, 19, 133–140. [Google Scholar] [CrossRef]
  20. Cho, A.R.; Song, S.J.; Chung, S.W.; Kim, Y.J. CO2 enrichment with higher light level improves flowering quality of Phalaenopsis Queen Beer ‘Mantefon’. Sci. Hortic. 2019, 247, 356–361. [Google Scholar] [CrossRef]
  21. Wang, Y.T. Effects of six fertilizers on vegetative growth and flowering of Phalaenopsis orchids. Sci. Hortic. 1996, 65, 191–197. [Google Scholar] [CrossRef]
  22. Wang, Y.T.; Gregg, L.L. Medium and fertilizer affect the performance of Phalaenopsis orchids during two flowering cycles. HortScience 1994, 29, 269–271. [Google Scholar] [CrossRef]
  23. Prior, S.A.; Runion, G.B.; Mitchell, R.J.; Rogers, H.H.; Amthor, J.S. Effects of atmospheric CO2 on longleaf pine: Pproductivity and allocation as influenced by nitrogen and water. Tree Physiol. 1997, 17, 397–405. [Google Scholar] [CrossRef] [PubMed] [Green Version]
  24. Reddy, K.R.; Zhao, D. Interactive effects of elevated CO2 and potassium deficiency on photosynthesis, growth, and biomass partitioning of cotton. Field Crops Res. 2005, 94, 201–213. [Google Scholar] [CrossRef]
  25. Seneweera, S.P.; Conroy, J.P. Growth, grain yield and quality of rice (Oryza sativa L.) in response to elevated CO2 and phosphorus nutrition. Soil Sci. Plant Nutr. 1997, 43, 1131–1136. [Google Scholar] [CrossRef]
  26. Sánchez-Guerrero, M.C.; Lorenzo, P.; Medrano, E.; Baille, A.; Castilla, N. Effects of EC-based irrigation scheduling and CO2 enrichment on water use efficiency of a greenhouse cucumber crop. Agric. Water Manag. 2009, 96, 429–436. [Google Scholar] [CrossRef]
  27. Thyssenkrupp. 2019. Available online: https://insights.thyssenkrupp-industrial-solutions.com/story/ammonium-nitrate-fertilizer-and-why-it-is-the-preferred-choice-of-european-farmers/ (accessed on 9 December 2021).
  28. Gao, H.; Jia, Y.; Guo, S.; Lv, G.; Wang, T.; Juan, L. Exogenous calcium affects nitrogen metabolism in root-zone hypoxia-stressed muskmelon roots and enhances short-term hypoxia tolerance. J. Plant Physiol. 2011, 168, 1217–1225. [Google Scholar] [CrossRef]
  29. Chen, C.T.; Lee, C.L.; Yeh, D.M. Effects of nitrogen, phosphorus, potassium, calcium, or magnesium deficiency on growth and photosynthesis of Eustoma. HortScience 2018, 53, 795–798. [Google Scholar] [CrossRef]
  30. Xu, S.; Yuan, X.; Zhang, Y.; Ye, Q. Effect of elevated CO2 combined with two nitrogen levels on photosynthesis, growth and leaf structure in cam orchid Phalaenopsis sp. Int. J. Agric. Biol. 2019, 22, 882–890. [Google Scholar]
  31. Farage, P.K.; McKee, I.F.; Long, S.P. Does a low nitrogen supply necessarily lead to acclimation of photosynthesis to elevated CO2? Plant Physiol. 1998, 118, 573–580. [Google Scholar] [CrossRef] [Green Version]
  32. Xu, S.; Zhu, X.; Li, C.; Ye, Q. Effects of CO2 enrichment on photosynthesis and growth in Gerbera jamesonii. Sci. Hortic. 2014, 177, 77–84. [Google Scholar] [CrossRef]
  33. Zha, T.S.; Wu, Y.J.; Jia, X.; Zhang, M.Y.; Bai, Y.J.; Liu, P.; Ma, J.Y.; Bourque, C.P.-A.; Peltola, H. Diurnal response of effective quantum yield of PSII photochemistry to irradiance as an indicator of photosynthetic acclimation to stressed environments revealed in a xerophytic species. Ecol. Indic. 2017, 74, 191–197. [Google Scholar] [CrossRef]
  34. Wang, Y.T.; Chang, Y.C.A. Effects of nitrogen and the various forms of nitrogen on Phalaenopsis orchid-A review. HortTechnology 2017, 27, 144–149. [Google Scholar] [CrossRef] [Green Version]
  35. Pollet, B.; Steppe, K.; Van Labeke, M.-C.; Lemeur, R. Diurnal cycle of chlorophyll fluorescence in Phalaenopsis. Photosynthetica 2009, 47, 309–312. [Google Scholar] [CrossRef]
  36. Oh, W.; Rhie, Y.H.; Park, J.H.; Runkle, E.S.; Kim, K.S. Flowering of cyclamen is accelerated by an increase in temperature, photoperiod, and daily light integral. J. Hortic. Sci. Biotechnol. 2008, 83, 559–562. [Google Scholar] [CrossRef]
  37. Pritchard, S.G.; Rogers, H.H.; Prior, S.A.; Peterson, C.M. Elevated CO2 and plant structure: a review. Glob. Chang. Biol. 1999, 5, 807–837. [Google Scholar] [CrossRef] [Green Version]
  38. Kinsman, E.A.; Lewis, C.; Davies, M.S.; Young, J.E.; Francis, D.; Vilhar, B.; Ougham, H.J. Elevated CO2 stimulates cells to divide in grass meristems: A differential effect in two natural populations of Dactylis glomerata. Plant Cell Environ. 1997, 20, 1309–1316. [Google Scholar] [CrossRef]
  39. Becker, D.W.; Bain, G.; Norman, J.; Moholt-Siebert, M. Two Sites of Heat-Induced Damage to Photosystem II; Springer: Berlin/Heidelberg, Germany, 1990; pp. 3499–3502. [Google Scholar]
  40. Björkman, O.; Demmig, B. Photon yield of O2 evolution and chlorophyll fluorescence characteristics at 77 K among vascular plants of diverse origins. Planta 1987, 170, 489–504. [Google Scholar] [CrossRef]
  41. Krause, G.H.; Winter, K. Photoinhibition of photosynthesis in plants growing in natural tropical forest gaps. A chlorophyll fluorescence study. Bot. Acta 1996, 109, 456–462. [Google Scholar]
  42. Ač, A.; Malenovský, Z.; Olejníčková, J.; Gallé, A.; Rascher, U.; Mohammed, G. Meta-analysis assessing potential of steady-state chlorophyll fluorescence for remote sensing detection of plant water, temperature and nitrogen stress. Remote Sens. Environ. 2015, 168, 420–436. [Google Scholar] [CrossRef] [Green Version]
  43. Wu, Y.J.; Zha, T.S.; Jia, X.; Qin, S.G.; Li, Y.; Wang, B. Temporal variation and controlling factors of photochemical efficiency and non-photochemical quenching in Artemisia ordosica. Chin. J. Ecol. 2015, 34, 319–325. [Google Scholar]
  44. Lake, J.A.; Quick, W.; Beerling, D.J.; Woodward, F.I. Signals from mature to new leaves. Nature 2001, 411, 154. [Google Scholar] [CrossRef]
  45. O’Carrigan, A.; Hinde, E.; Lu, N.; Xu, X.-Q.; Duan, H.; Huang, G.; Mak, M.; Bellotti, B.; Chen, Z.H. Effects of light irradiance on stomatal regulation and growth of tomato. Environ. Exp. Bot. 2014, 98, 65–73. [Google Scholar] [CrossRef]
  46. Uprety, D.C.; Dwivedi, N.; Jain, V.; Mohan, R. Effect of elevated carbon dioxide concentration on the stomatal parameters of rice cultivars. Photosynthetica 2002, 40, 315–319. [Google Scholar] [CrossRef]
  47. Dilcher, D.L.; Kuerschner, W.M.; Visscher, H.; Wagner, F. Fossil leaves as biosensors of eocene paleoatmospheric CO2. Environ. Geosci. 1999, 6, 151–152. [Google Scholar] [CrossRef]
  48. James, S.A.; Bell, D.T. Influence of light availability on leaf structure and growth of two Eucalyptus globulus ssp globulus provenances. Tree Physiol. 2000, 20, 1007–1018. [Google Scholar] [CrossRef]
  49. Fanourakis, D.; Hyldgaard, B.; Giday, H.; Aulik, I.; Bouranis, D.; Körner, O.; Ottosen, C. Stomatal anatomy and closing ability is affected by supplementary light intensity in rose (Rosa hybrida L.). Hortic. Sci. 2019, 46, 81–89. [Google Scholar] [CrossRef] [Green Version]
  50. Saure, M.C. Why calcium deficiency is not the cause of blossom-end rot in tomato and pepper fruit–a reappraisal. Sci. Hortic. 2014, 174, 151–154. [Google Scholar] [CrossRef]
  51. Sonneveld, C.; De Kreij, C. Response of cucumber (Cucumis sativus L.) to an unequal distribution of salts in the root environment. Plant Soil 1999, 209, 47–56. [Google Scholar] [CrossRef]
  52. Xing, Y.; Zhu, Z.L.; Wang, F.; Zhang, X.; Li, B.Y.; Liu, Z.X.; Wu, X.X.; Ge, S.F.; Jiang, Y.M. Role of calcium as a possible regulator of growth and nitrate nitrogen metabolism in apple dwarf rootstock seedlings. Sci. Hortic. 2021, 276, 109740. [Google Scholar] [CrossRef]
  53. Kaya, C.; Higgs, D.; Kirnak, H.; Tas, I. Ameliorative effect of calcium nitrate on cucumber and melon plants drip irrigated with saline water. J. Plant Nutr. 2003, 26, 1665–1681. [Google Scholar] [CrossRef]
Figure 1. The number (No.) of leaves (a), time to the fifth leaf emergence (b), and time to the mature leaf span (c) in Phalaenopsis Queen Beer ‘Mantefon’ grown under two light levels of 150 ± 20 and 300 ± 20 μmol∙m−2∙s−1 with four calcium ammonium nitrate (CAN) level under 800 μmol∙mol1 CO2. The elements concentrations of calcium, ammonium, and nitrate were 0.90, 0.55, and 2.97 mmol·L−1 (CAN1); 8.63, 1.11, and 6.05 mmol·L−1 (CAN2); 12.80, 1.72, and 9.13 mmol·L−1 (CAN3); and 18.80, 2.27, and 12.20 mmol·L−1 (CAN4), respectively. The time to the mature leaf span is based on a 25 cm leaf span emergence time from any leaf initiation. Vertical bars are standard errors of the means (n = 13), and values followed by different letters are significantly different according to Duncan’s multiple range test at p ≤ 0.05.
Horticulturae 08 00157 g001
Figure 2. The net CO2 uptake (a), water-use efficiency (WUE) (b), stomatal conductance (gs) (c), and transpiration rate (tr) (d) in Phalaenopsis Queen Beer ‘Mantefon’ grown under two light levels of 150 ± 20 and 300 ± 20 μmol∙m−2∙s−1 with four calcium ammonium nitrate (CAN) levels under 800 μmol∙mol1 CO2. The elements concentrations of calcium, ammonium, and nitrate were 0.90, 0.55, and 2.97 mmol·L−1 (CAN1); 8.63, 1.11, and 6.05 mmol·L−1 (CAN2); 12.80, 1.72, and 9.13 mmol·L−1 (CAN3); and 18.80, 2.27, and 12.20 mmol·L−1 (CAN4), respectively. Measurements were taken at 20 weeks after treatment. Vertical bars are standard errors of the means (n = 3), and values followed by different letters are significantly different according to Duncan’s multiple range test at p ≤ 0.05.
Horticulturae 08 00157 g002
Table 1. The total nitrogen (N) concentration, the elements concentrations of calcium (Ca), ammonium (NH4), nitrate (NO3), phosphate (P), potassium (K), and sulfur (S), electrical conductivity (EC), and pH as CAN levels.
LevelTotal N
(mg·L−1)
Elements (mmol·L−1)EC
(dS·m−1)
pH
CaNH4NO3PKS
CAN12000.900.552.972.744.370.811.6 ± 0.15.9
CAN24008.631.116.052.744.370.812.1 ± 0.16.0
CAN360012.801.729.132.744.370.813.0 ± 0.16.1
CAN480018.802.2712.202.744.370.814.9 ± 0.16.1
Table 2. Chlorophyll a fluorescence parameters of the maximal quantum efficiency (Fv/Fm), actual quantum yield of photosystem II (ΦPSΙΙ), and non-photochemical quenching (NPQ) of chlorophyll a fluorescence in Phalaenopsis Queen Beer ‘Mantefon’ grown under two light levels of 150 ± 20 and 300 ± 20 μmol∙m−2∙s−1 with four calcium ammonium nitrate (CAN) levels under 800 μmol∙mol1 CO2. The elements concentrations of calcium, ammonium, and nitrate were 0.90, 0.55, and 2.97 mmol·L−1 (CAN1); 8.63, 1.11, and 6.05 mmol·L−1 (CAN2); 12.80, 1.72, and 9.13 mmol·L−1 (CAN3); and 18.80, 2.27, and 12.20 mmol·L−1 (CAN4), respectively.
Light Levels
(μmol·m−2·s1)
CAN LevelsFv/FmΦPSΙΙNPQ
150 ± 20CAN10.709 ± 0.011 ab z0.299 ± 0.009 ab1.101 ± 0.084 a
CAN20.715 ± 0.001 a0.330 ± 0.025 a0.896 ± 0.189 a
CAN30.697 ± 0.019 ab0.256 ± 0.016 bc1.010 ± 0.051 a
CAN40.688 ± 0.053 ab0.251 ± 0.026 bc0.862 ± 0.089 a
300 ± 20CAN10.647 ± 0.015 ab0.211 ± 0.018 cd0.835 ± 0.139 a
CAN20.673 ± 0.034 ab0.230 ± 0.017 cd0.890 ± 0.147 a
CAN30.671 ± 0.021 ab0.233 ± 0.022 cd1.081 ± 0.032 a
CAN40.617 ± 0.030 b0.183 ± 0.024 d0.839 ± 0.274 a
Significance y
Light**ns
CANnsnsns
Light × CANnsnsns
z Average values in a column with a different letter are significantly different according to Duncan’s multiple range test at p ≤ 0.05 (n = 3). y, * denotes significance at p ≤ 0.05; ns denotes not significant (Duncan’s multiple range test).
Table 3. The stomatal aperture width, length, maximum stomatal aperture, and stomatal index in Phalaenopsis Queen Beer ‘Mantefon’ grown under two light levels of 150 ± 20 and 300 ± 20 μmol∙m−2∙s−1 with four calcium ammonium nitrate (CAN) levels under 800 μmol∙mol1 CO2. The elements concentrations of calcium, ammonium, and nitrate were 0.90, 0.55, and 2.97 mmol·L−1 (CAN1); 8.63, 1.11, and 6.05 mmol·L−1 (CAN2); 12.80, 1.72, and 9.13 mmol·L−1 (CAN3); and 18.80, 2.27, and 12.20 mmol·L−1 (CAN4), respectively.
Light Levels
(μmol·m−2·s−1)
CAN
Levels
Stomatal
Aperture Width
(μm)
Stomatal
Aperture Length
(μm)
Maximum
Stomatal Aperture
(μm2)
Stomatal
Index
(%)
150 ± 20CAN13.0 ± 0.4 b z12.6 ± 0.6 bc27 ± 5 b6.23 ± 0.15 a
CAN23.3 ± 0.3 b12.9 ± 0.4 bc29 ± 3 b5.07 ± 0.22 c
CAN32.7 ± 0.4 bc14.1 ± 0.3 ab28 ± 3 b5.93 ± 0.28 ab
CAN41.9 ± 0.1 c13.6 ± 0.2 bc20 ± 1 b5.91 ± 0.10 ab
300 ± 20CAN15.7 ± 0.3 a13.8 ± 0.5 ab58 ± 5 a6.18 ± 0.26 a
CAN26.1 ± 0.5 a15.1 ± 0.5 a70 ± 10 a5.25 ± 0.09 bc
CAN33.0 ± 0.1 b11.0 ± 0.8 d23 ± 3 b4.03 ± 0.55 d
CAN43.1 ± 0.5 b12.1 ± 0.5 cd26 ± 5 b6.08 ± 0.16 ab
Significance y
Light***ns****
CAN**********
Light × CAN**********
z Average values in a column with a different letter are significantly different according to Duncan’s multiple range test at p ≤ 0.05 (n = 3). y, *, **, and *** denote significance at p ≤ 0.05, p ≤ 0.01, and p ≤ 0.001; ns denotes not significant (Duncan’s multiple range test).
Publisher’s Note: MDPI stays neutral with regard to jurisdictional claims in published maps and institutional affiliations.

