Article

Regionalization of Maize Responses to Climate Change Scenarios, N Use Efficiency and Adaptation Strategies

by
Frank Eulenstein
1,2,*,
Marcos Alberto Lana
1,
Sandro Luis Schlindwein
3,
Askhad Khasrethovich Sheudzhen
2,
Marion Tauscke
1,
Axel Behrendt
1,
Edgardo Guevara
4 and
Santiago Meira
4
1
Leibniz-Centre for Agricultuiral Landscape Research (ZALF) Müncheberg, Eberswalder Straße 84, Müncheber 15374, Germany
2
Department Agro-Chemistry, Kuban State Agrarian University, Krasnodar 350044, Russian
3
Departamento de Engenharia Rural, Universidade Federal de Santa Catarina, Florianópolis 88034-000, Brazil
4
Department of Crop Production INTA—Instituto Nacional de Tecnologia Agropecuaria, Pergamino 2700, Argentina
*
Author to whom correspondence should be addressed.
Horticulturae 2017, 3(1), 9; https://doi.org/10.3390/horticulturae3010009
Submission received: 2 December 2015 / Revised: 26 January 2016 / Accepted: 10 March 2016 / Published: 30 December 2016
(This article belongs to the Special Issue Quality Management of Organic Horticultural Produce)

Abstract

:
As with any other crop, maize yield is a response to environmental factors such as soil, weather, and management. In a context of climate change, understanding responses is crucial to determine mitigation and adaptation strategies. Crop models are an effective tool to address this. The objective was to present a procedure to assess the impacts of climate scenarios on maize N use efficiency and yield, with the effect of cultivar (n = 2) and planting date (n = 5) as adaptation strategies. The study region was Santa Catarina, Brazil, where maize is cultivated on more than 800,000 ha (average yield: 4.63 t·ha−1). Surveying and mapping of crop land was done using satellite data, allowing the coupling of weather and 253 complete soil profiles in single polygons (n = 4135). A Decision Support System for Agrotechnology Transfer (DSSAT) crop model was calibrated and validated using field data (2004–2010 observations). Weather scenarios generated by Regional Climatic Models (RCMs) were selected according their capability of reproducing observed weather. Simulations for the 2012–2040 period (437 ppm CO2) showed that without adaptation strategies maize production could be reduced by 12.5%. By only using the best cultivar for each polygon (combination of soil + weather), the total production was increased by 6%; when using both adaptation strategies—cultivar and best planting date—the total production was increase by 15%. The modelling process indicated that the N use efficiency increment ranged from 1%–3% (mostly due to CO2 increment, but also due to intrinsic soil properties and leaching occurrence). This analysis showed that N use efficiency rises in high CO2 scenarios, so that crop cultivar and planting date are effective tools to mitigate deleterious effects of climate change, supporting energy crops in the study region.

1. Introduction

Understanding climate change and impacts on crops is critical to determining anthropogenic responses of mitigation and adaptation. While the soil resource is relatively constant over time, the weather is subject to remarkable variability, making it the most challenging and unpredictable aspect of agriculture [1]. Despite all efforts mobilized to identify the directions of climate change, the high level of uncertainty entrenched in climate scenarios is still a challenge for accurate future predictions. On the other hand, the comprehension on how crops respond to environmental factors and management variables relies in mathematical models that could explain with accuracy key physiological and phenological processes.

2. Experimental Section

Crop Models for Impact Assessment

As crop science represents an integration of the disciplines of biology, physics and chemistry, plant and crop simulation models are mathematical representations of this system [2]. Lobell and Burke [3] stated that process-based models are typically developed and tested using experimental trials, and thus offer the distinct advantage of leveraging knowledge from decades of research in crop physiology and reproduction, agronomy, and soil science, among other disciplines. In order to correctly simulate physiological and phenological processes, these models require the input of specific data of soil, weather, and crop or cultivar, as well as management practices such as planting date, plant population and fertilization. The models need to be calibrated to local conditions in order to achieve high levels of accuracy. Simulations are usually run for a single or few sites, and input from farmers and technicians during the decision making process are important. Nevertheless, the scaling up of model outcomes can bring a more complete picture, allowing a better understanding of regional impacts. Examples of regional applications are food security early warning systems and market decisions [4]. If site-specific estimates are averaged to obtain regional mean yields, the procedure is likely to introduce aggregation errors that depend on the degree of non-linearity of the crop model functions, as well as the heterogeneity of sites in the region. Furthermore, in climate change studies, the selection of individual sites that are representative of present-day conditions may be inappropriate if the projected future climate is likely to shift the suitability of a crop into new regions [5].

3. Methodology

The study region was the state of Santa Catarina, located in Southern Brazil. The state covers an area of 95,703 km2, with a population estimated at 6.2 million inhabitants [6]. Agricultural production plays an important role in the state, contributing more than 7% of the GDP [7]. The state has a structured agro-industrial complex, where the main part is coarse grains produced for animal feed. In the case of maize, 100% of the local production is directed to local agro-industry demand.
In order to assess the actual land use of Santa Catarina, data from different sources was merged within a single GIS data base. Further environmental information like bodies of water, islands, wetlands, and urban regions were obtained from 1:50,000 and 1:100,000 scale digital maps [8]. In addition, maps of vegetation and categories of land use (like crop land, pastures, crop land + pasture, etc.) were obtained from Environment [9] in a 1:250,000 scale, and a soil map (1:250,000 scale) was also obtained [10].

3.1. Impact Assessment

The Decision Support System for Agrotechnology Transfer—DSSAT v. 4.5 contains the CERES—Maize model [11] and was used to determine best planting dates, fertilization strategies, and N use efficiency, and to examine potential effects of climate change on agriculture. In the embedded model, the development and growth of the crop was simulated on a daily basis from planting until physiological maturity. In order to ensure a correct simulation of the model, field experiments were set up in different locations to obtain genetic coefficients required for each maize cultivar, as proposed by He et al. [12], as well as to proceed with model validation. Four varieties of maize were tested: three open pollinated varieties (MPA01, Ivanir and Fortuna, respectively) and one commercial hybrid (AS 1548). The trials were conducted according to the recommendations of Soler et al. [13], and validation was done using observed data from different field experiments containing all required data needed for model validation [14]. A specific fertilization scheme was use for each soil (to attend the crop N requirements), ranging from 50 kg/N/ha to 120 kg/N/ha. The two best calibrated cultivars were chosen to perform further assessments.

3.2. Weather Scenarios

Regional Climatic Models (RCMs) were provided by CLARIS-LPB Project Data Archive Center and were restructured to match the model input criteria using Weatherman Software version 4.5.0.0 [15]. In order to define which RCM was to be used in the simulation, a comparison was done between yields simulated using RCMs as well as yields simulated using observed weather. The formulated hypothesis stated that the best RCM—or ensemble of RCMs—would be the one providing the best fit of yields generated using RCMs and observations. Yield for different planting dates (01/08 until 01/12), every 15 days) was then simulated using observed weather (1982–2012, 30 cropping seasons) from selected weather stations (those with more than 30 years of observations).

3.3. Regionalization

Results were organized and plotted on GIS maps only on areas identified for agricultural land use. Yield change in the scenarios was calculated based on recorded yields from the last 30 years. Nitrogen use efficiency was calculated according to the recommendations of Eulenstein et al. [16] using simulations with past weather as a base line, followed by comparisons with efficiency obtained using climate scenarios.

4. Results and Discussion

The main findings from the results were the following:
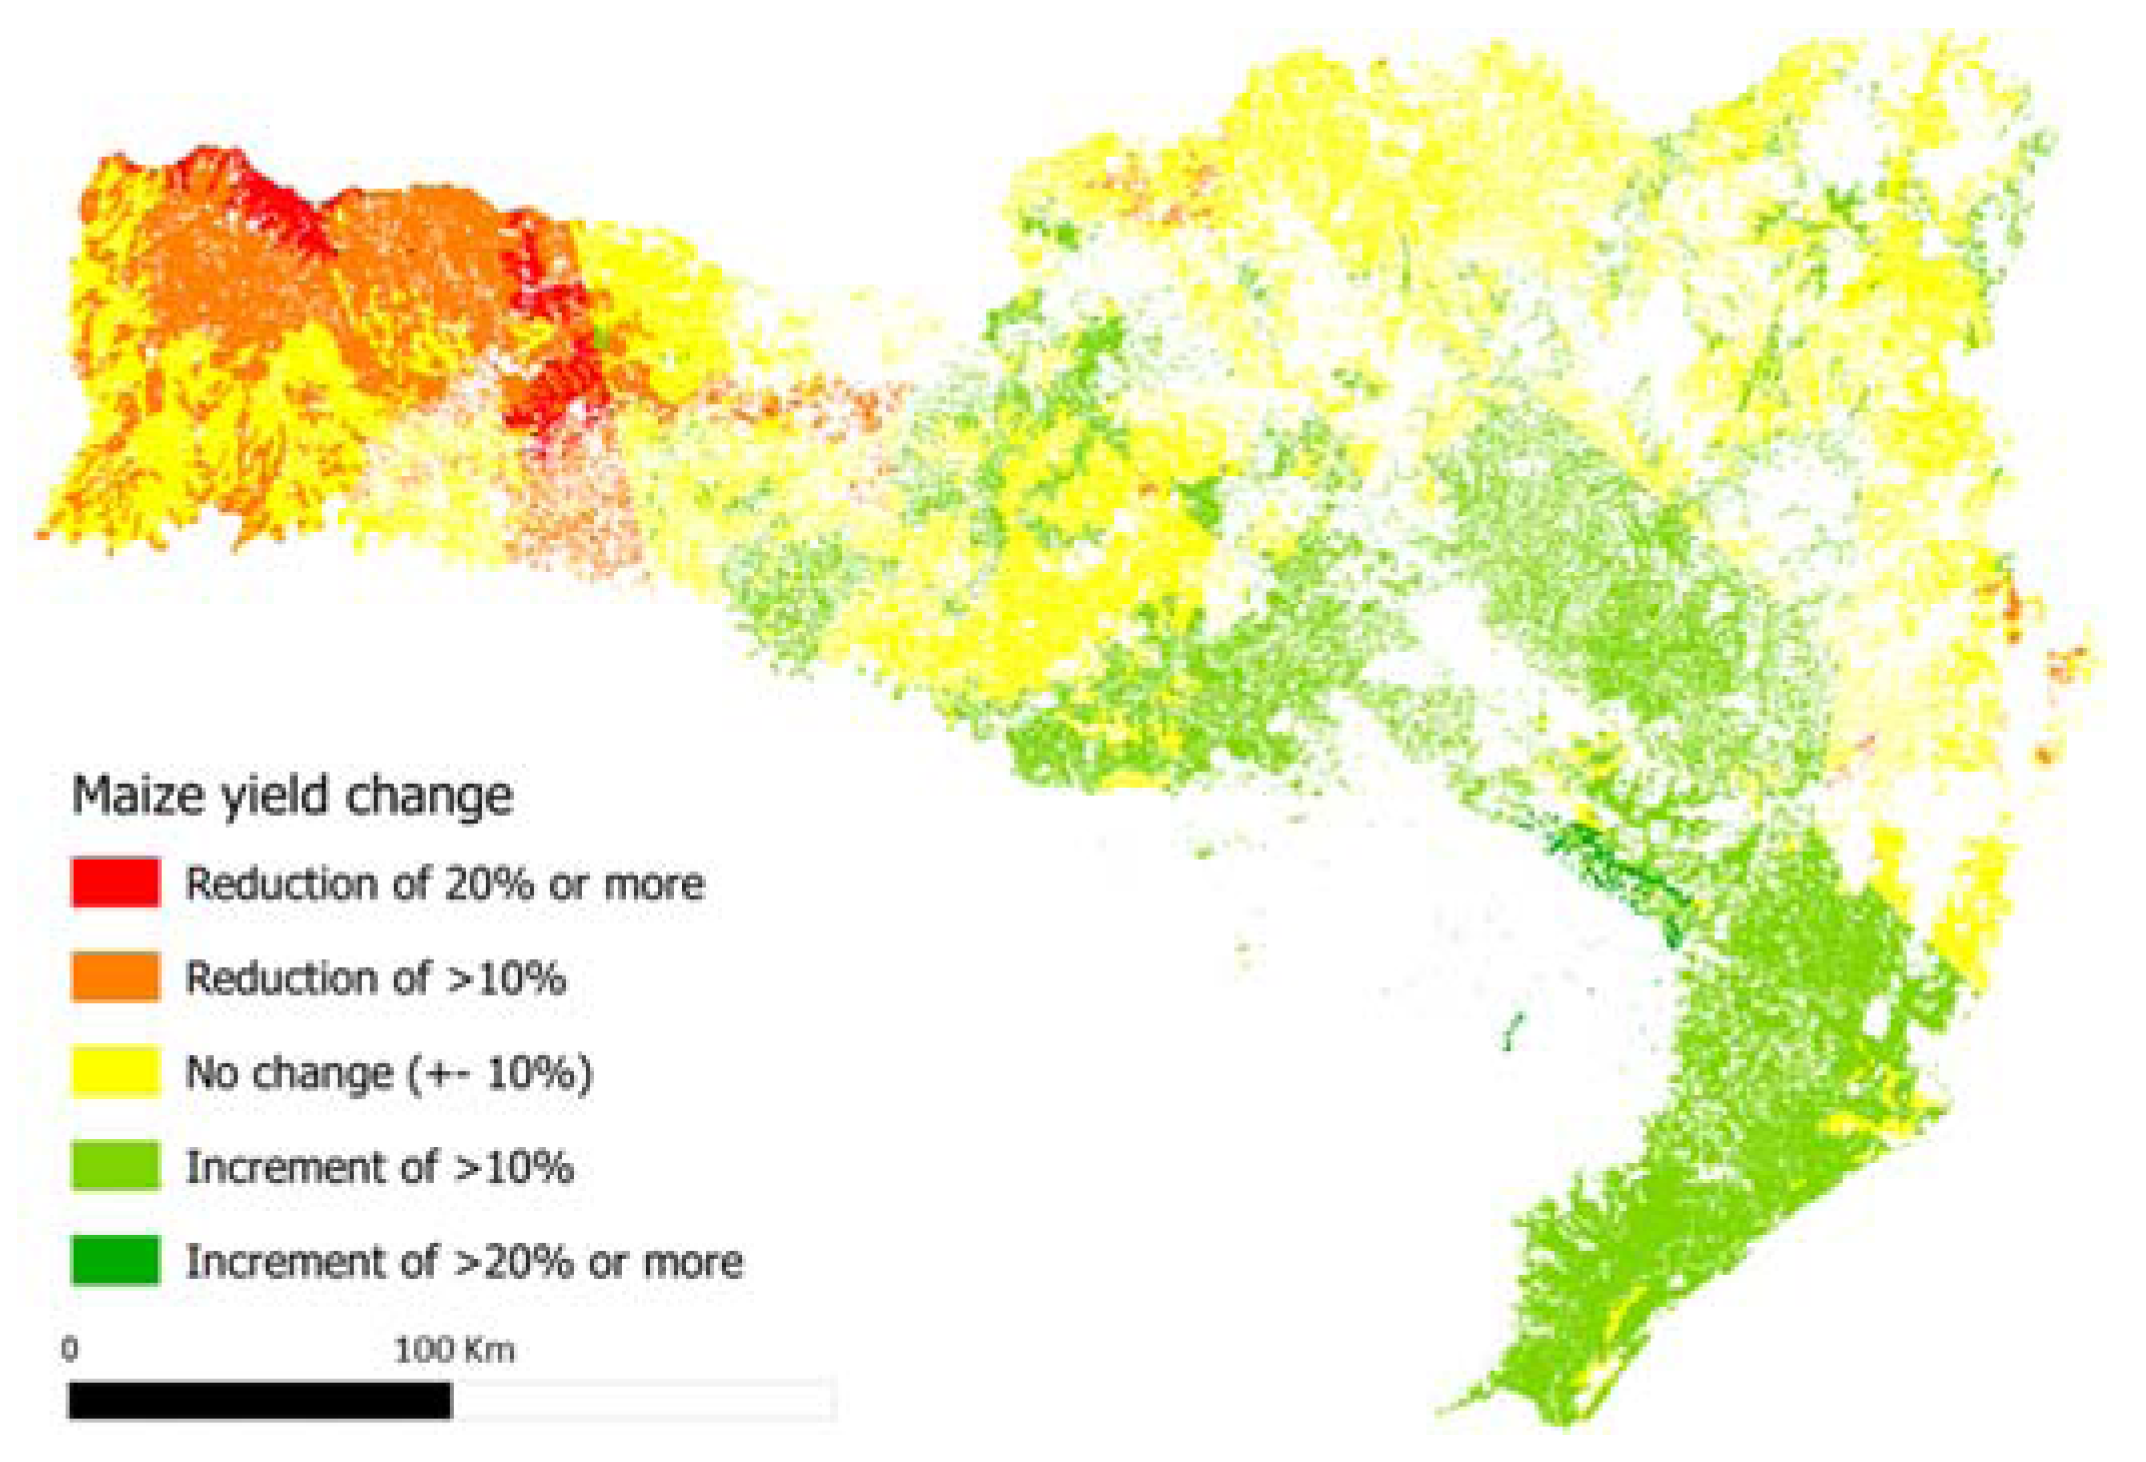
  • Simulations run for the 2012–2040 period (437 ppm of CO2) without adaptation strategies showed reductions of 12.5% in maize total production (Figure 1);
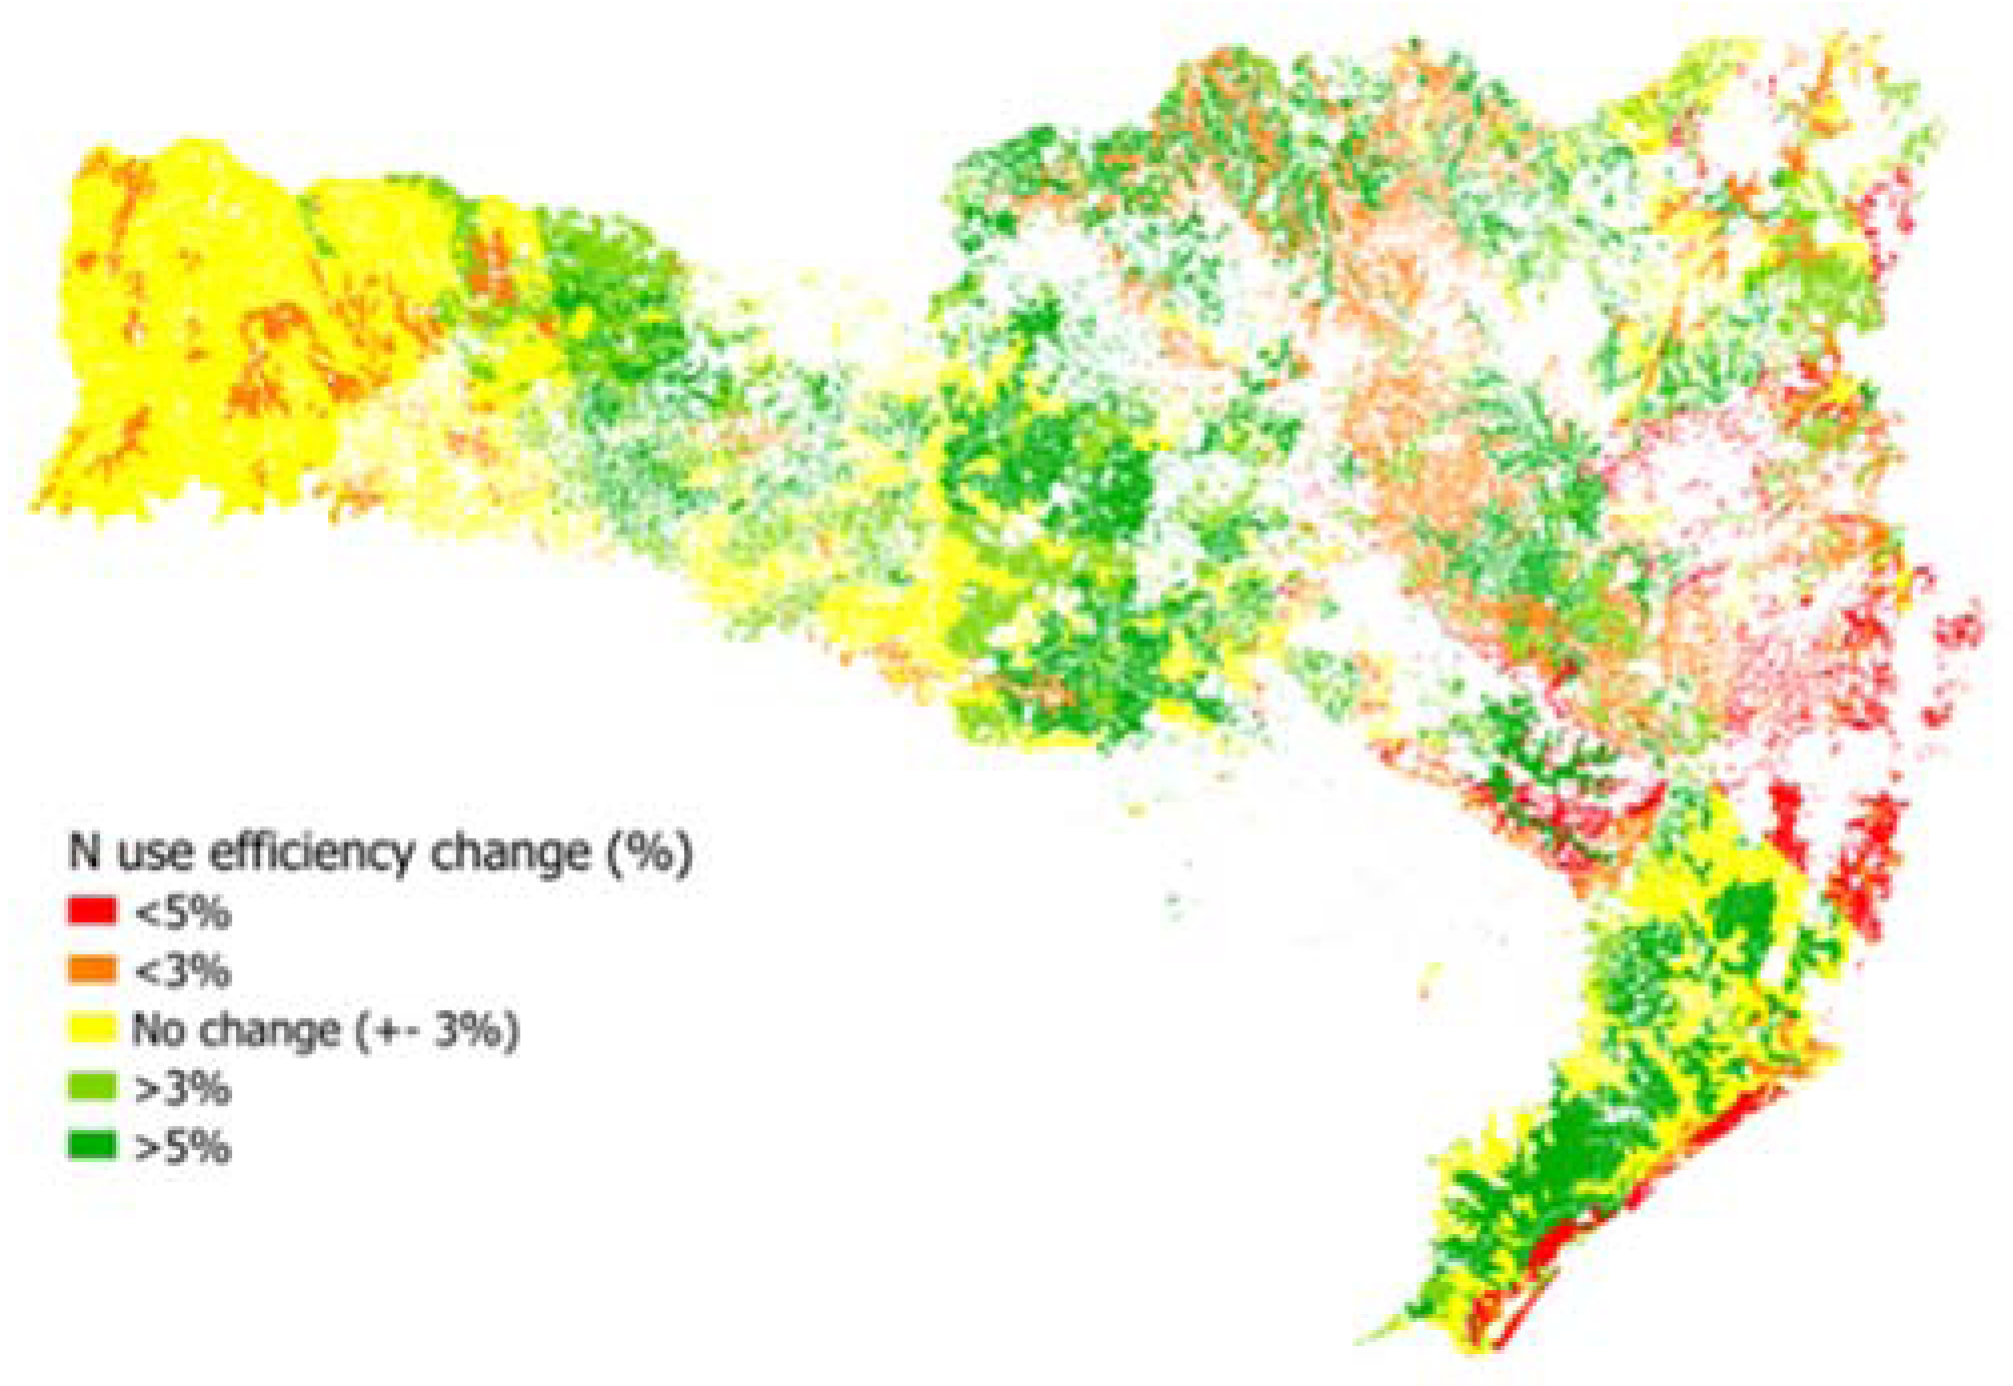
  • The modelling process indicated that the N use efficiency increment ranged from −20% to +12% (according to the model, mostly due to CO2 increment, but also due to soil properties and leaching) (Figure 2);
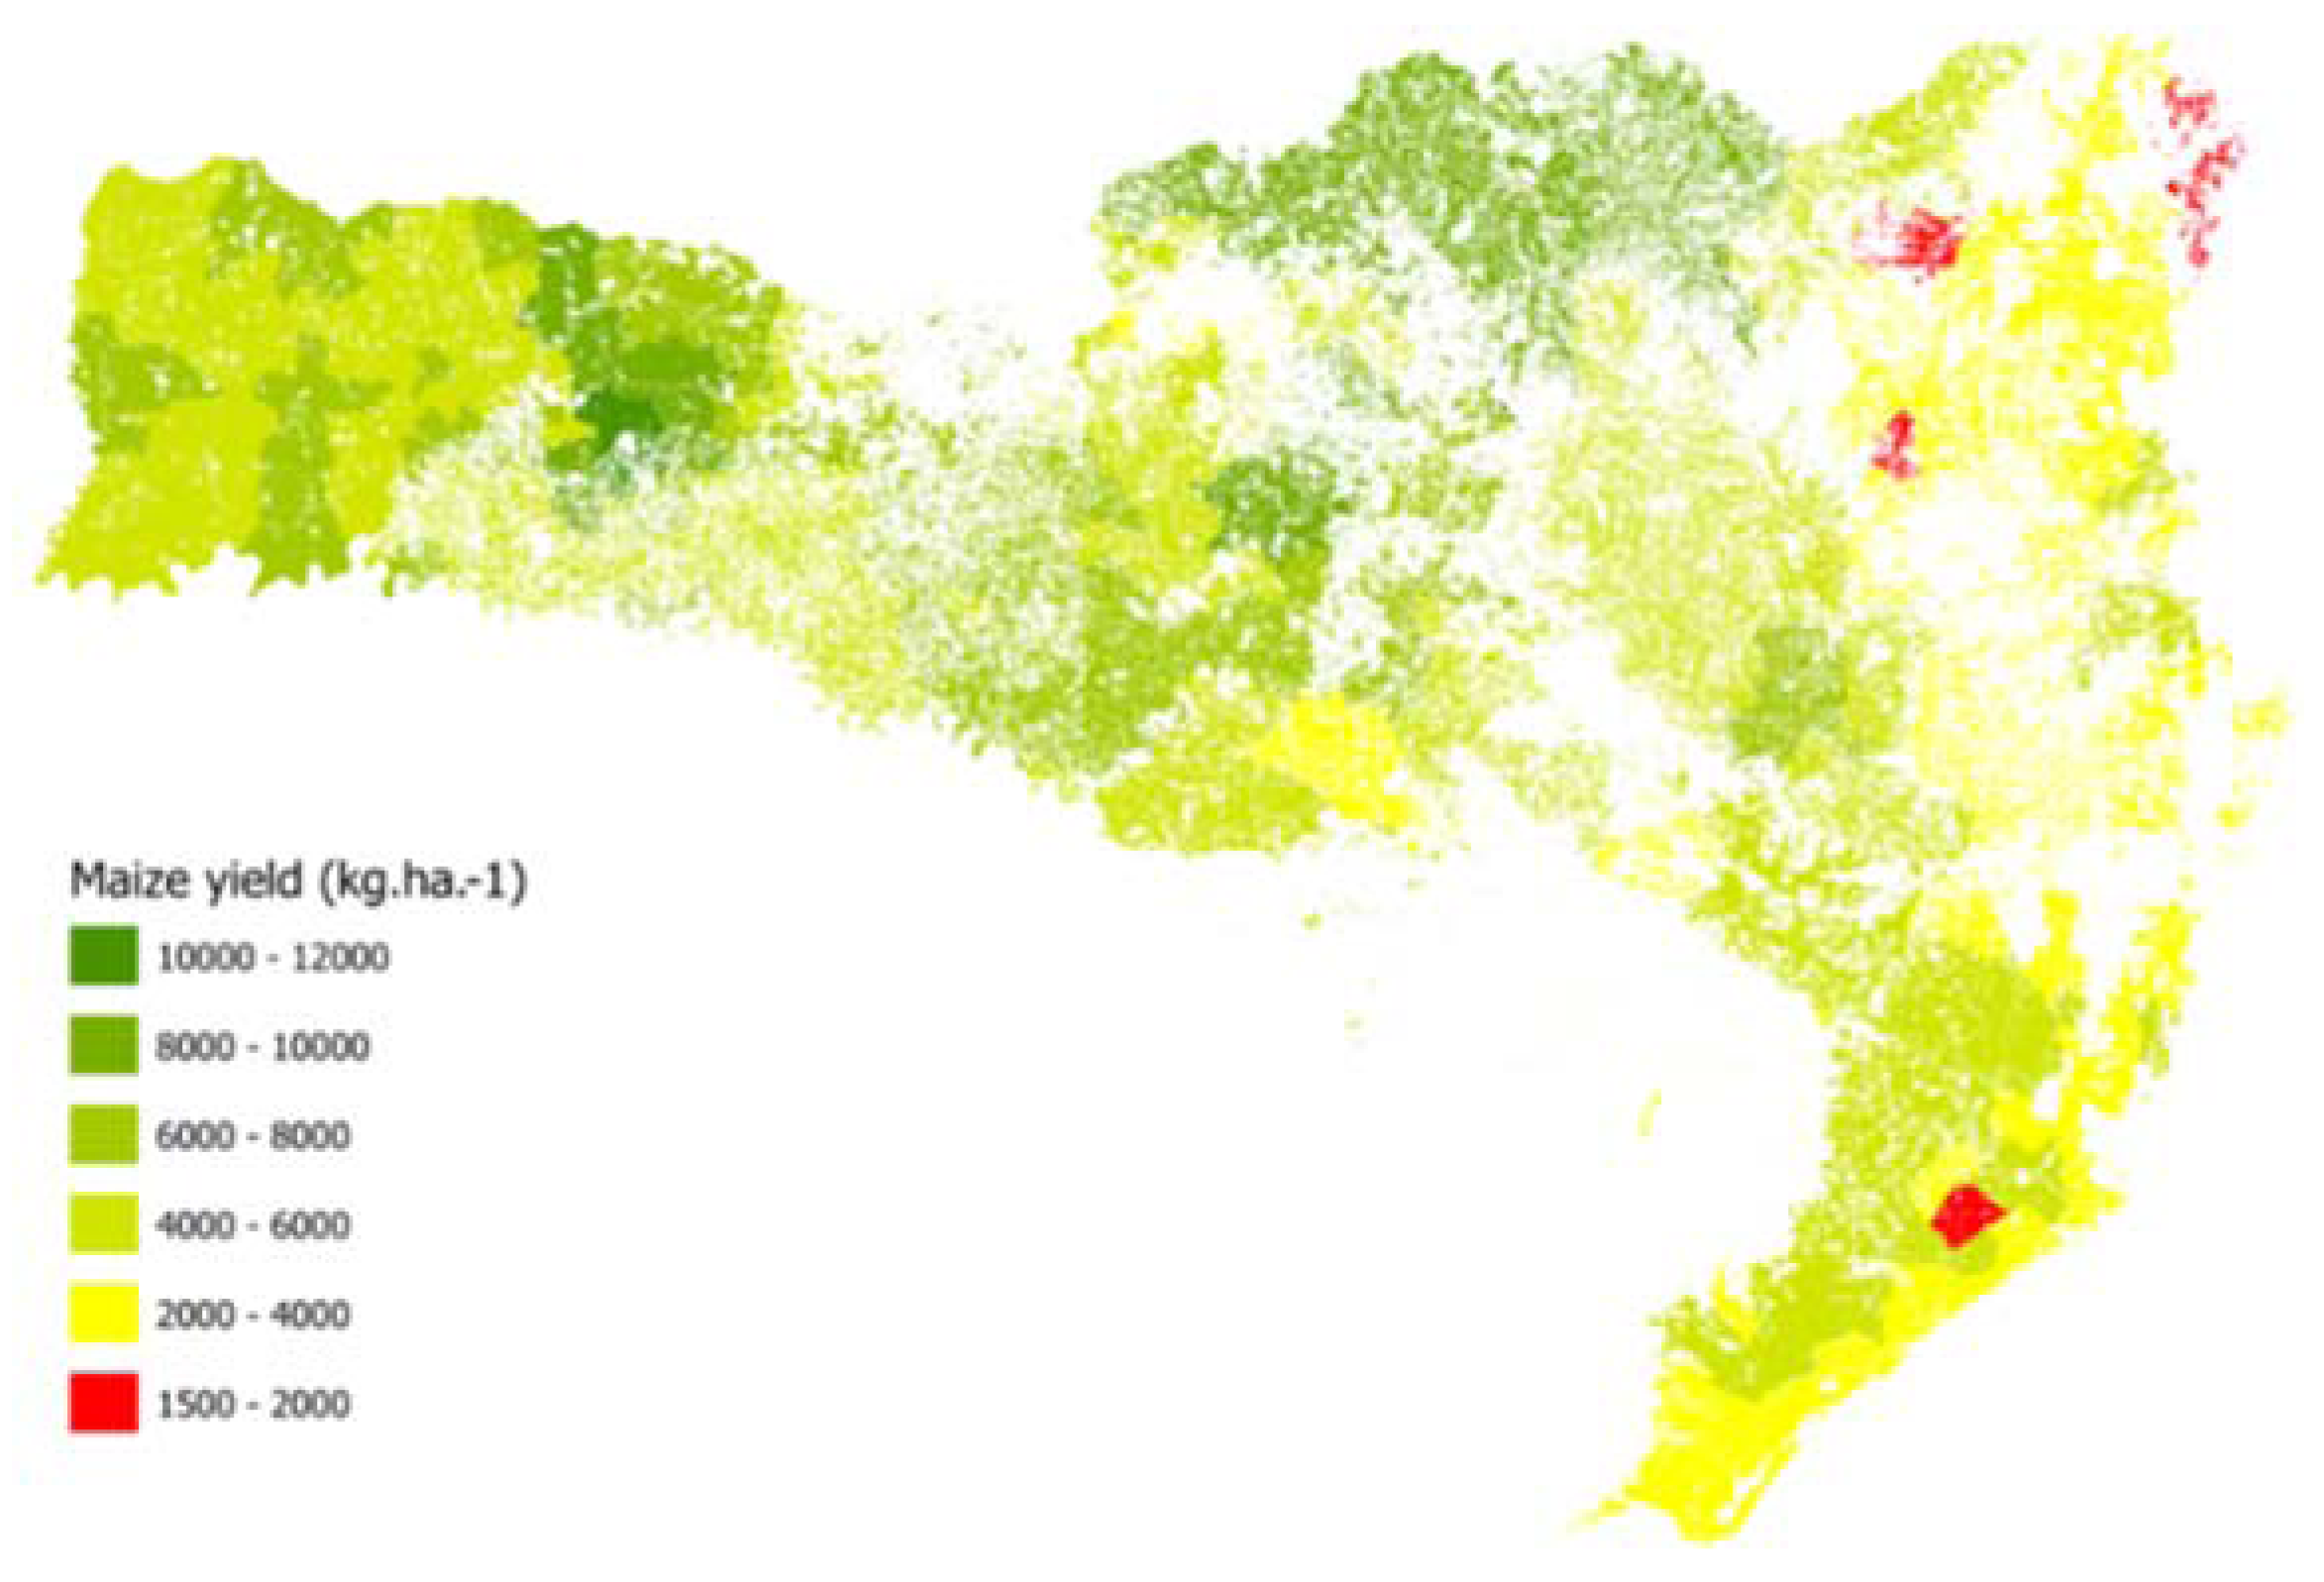
  • By only using the best maize cultivar for each polygon (soil + weather), total production increased by 6%; when using both adaptation strategies—cultivar and best planting date—total production increased by 15% (Figure 3);
  • N use efficiency rose in high CO2 scenarios, but was also influenced by soil and weather in nonlinear relationships;
  • Crop cultivar and planting date were effective tools for mitigating deleterious effects of climate change, supporting energy crops in the study region;
  • The potential for maize production—and therefore ethanol—will be increased in the South-eastern region, while the Western region will suffer strong reductions in its production potential.

5. Conclusions

The effect of the weather scenarios on maize yield and N use efficiency is dependent on local conditions, being influenced mainly by soil parameters. The selected weather scenarios indicate that climate change, despite the increment of CO2 concentration and increase in the N use efficiency, will have deleterious effects on maize production if no adaptation strategy is employed. Different planting dates and adapted cultivars are an effective tool to overcome this reduction. Overall, despite localized changes, the study region will still present a good potential for maize production.

Acknowledgments

The research leading to these results has received funding from the European Community’s Seventh Framework Programme (FP7/2007–2013) under Grant Agreement No. 212492: CLARIS LPB. A Europe-South America Network for Climate Change Assessment and Impact Studies in La Plata Basin.

Author Contributions

Marcos Alberto Lana, Edgardo Guevara and Santiago Meira organized the data, run the calibration and generated the results. Frank Eulenstein, Sandro Luis Schlindwein, Askhad Khasrethovich Sheudzhen, Marion Tauschke and Axel Behrendt interpreted the results and wrote this text. All authors contributed equally to this paper.

Conflicts of Interest

The authors declare no conflict of interest.

References

  1. Nadler, A.; Bullock, P. Long-term changes in heat and moisture related to corn production on the Canadian Prairies. Clim. Chang. 2010, 104, 339–352. [Google Scholar] [CrossRef]
  2. Hoogenboom, G. Contribution of agrometeorology to the simulation of crop production and its applications. Agric. For. Meteorol. 2000, 103, 137–157. [Google Scholar] [CrossRef]
  3. Lobell, D.B.; Burke, M.B. On the use of statistical models to predict crop yield responses to climate change. Agric. For. Meteorol. 2010, 150, 1443–1452. [Google Scholar] [CrossRef]
  4. Parry, M.L.; Canziani, O.F.; Palutikof, J.P.; Van der Linden, P.J.; Hanson, C.E. Climate Change: Impacts, Adaptation and Vulnerability. Contribution of Working Group II to the Fourth Assessment Report of the Intergovernmental Panel on Climate Change; Cambridge University Press: Cambridge, UK, 2007. [Google Scholar]
  5. Saarikko, R.A. Applying a site based crop model to estimate regional yields under current and changed climates. Ecol. Model. 2000, 131, 191–206. [Google Scholar] [CrossRef]
  6. Brazilian Institute of Geography and Statistics (IBGE). SIDRA-IBGE: Aggregated Database; IBGE: Brasília, Brazil, 2012.
  7. Epagri/Cepa. Síntese Anual da Agricultura de Santa Catarina; Epagri/Cepa: Florianópolis, Brazil, 2011. (In Portuguese)
  8. Epagri/IBGE. Mapoteca Topográfica Digital de Santa Catarina; Epagri/IBGE: Florianópolis, Brazil, 2012. (In Portuguese)
  9. Brazilian Ministry of Environment. Mapa de Cobertura Vegetal; Brasil: Brasília, Brazil, 2012. (In Spanish) [Google Scholar]
  10. Embrapa Solos. Sistema Brasileiro de Classificação de Solos; Embrapa Solos: Rio de Janeiro, Brazil, 1999. (In Portuguese) [Google Scholar]
  11. Jones, C. CERES-Maize: A Stimulation Model of Maize Growth and Development; Texas A&M University Press: College Station, TX, USA, 1986. [Google Scholar]
  12. He, J.; Dukes, M.D.; Jones, J.W.; Graham, W.D.; Judge, J. Applying glue for estimating Ceres-maize genetic and soil parameters for sweet corn production. Trans. ASABE 2009, 52, 1907–1921. [Google Scholar] [CrossRef]
  13. Soler, C.M.T.; Sentelhas, P.C.; Hoogenboom, G. Application of the CSM-CERES-maize model for planting date evaluation and yield forecasting for maize grown off-season in a subtropical environment. Eur. J. Agron. 2007, 27, 165–177. [Google Scholar] [CrossRef]
  14. Hunt, L.A.; Boote, K.J. Data for model operation, calibration, and evaluation. In Understanding Options for Agricultural Production; Tsuji, G.Y., Hoogenboom, G., Thornton, P.K., Eds.; Kluwer Academic Publishers: Dordrecht, The Netherlands, 1998; pp. 9–40. [Google Scholar]
  15. Wilkens, P.W. DSSAT v4 Weather Data Editing Program (Weatherman). Data Management and Analysis Tools—Decision Support System for Agrotechnology Transfer Version 4.0: DSSAT v4: Data Management and Analysis Tools; University of Hawaii: Honolulu, HI, USA, 2004; pp. 92–151. [Google Scholar]
  16. Eulenstein, F.; Tauschke, M.; Lana, M.; Sheudshen, A.; Dannowski, R.; Schindler, R.; Drechsler, H. Nutrient balances in agriculture: A basis for the efficiency survey of agricultural groundwater conservation measures. In Novel Measurement and Assessment Tools for Monitoring and Management of Land and Water Resources in Agricultural Landscapes of Central Asia; Mueller, L., Saparov, A., Lischeid, G., Eds.; Springer: Cham, Switzerland, 2014; pp. 263–273. [Google Scholar]
Figure 1. Change in maize yield (%) in the state of Santa Catarina, Brazil, for the 2012–2040 period. The impact was calculated using climate scenarios and without any kind of adaptation strategy (planting date or cultivar).
Horticulturae 03 00009 g001
Figure 2. Nitrogen use efficiency change under impact of climatic scenarios for the state of Santa Catarina, Brazil. Changes are relative to the actual values (baseline calculated with climatic data from the last 30 years).
Horticulturae 03 00009 g002
Figure 3. Expected maize yields under climatic scenarios for the 2012–2040 period. When adaptation strategies are employed, yields can potentially raise in many regions, increasing the production up to 15% from actual levels.
Horticulturae 03 00009 g003

