1. Introduction
Paleo-earthquake magnitudes are usually estimated from the lengths of mapped primary surface ruptures and the single-event offsets of geomorphological markers. Empirical relationships between magnitude, primary surface rupture length, and average/maximum offset then allow calculating magnitudes (e.g., References [
1,
2]). Those relationships are derived from recent surface-rupturing earthquakes with well-constrained magnitudes. Using this approach in paleoseismological studies comes with several limitations: (i) It can only be applied to earthquakes with primary surface ruptures. Large events without significant surface offset like the 2015 Gorkha M
W7.8 Earthquake [
3] will go unnoticed in the paleoseismological record; (ii) if earthquake recurrence intervals on a fault are long, erosion or sedimentation may have intensely altered the primary surface ruptures or even completely eradicated them (e.g., Reference [
4]); and (iii) complex primary surface ruptures on several faults may not be interpreted as a single earthquake. For example, the 2016 Kaikoura Earthquake in New Zealand with a magnitude of M
W7.8 ruptured at least twelve major crustal faults and produced highly variable primary surface ruptures [
5]. It is unlikely that such complexity can be understood with paleoseismological methods, and the magnitude of the paleo-earthquake will probably be under-estimated. (iv) Incoherent and anomalous primary surface ruptures can not only be hard to detect, but may also cause problems when it comes to applying the empirical relationships. For example, the 1992 M
S7.3 Suusamyr Earthquake, Kyrgyzstan, broke the surface in two short sets of primary ruptures with a 25 km gap in between [
6,
7].
One approach to overcome the problem of estimating paleo-earthquake magnitudes based solely on primary surface ruptures is the application of the Environmental Seismic Intensity Scale, ESI2007 [
8,
9,
10]. In contrast to classical intensity scales, such as MSK (Medvedev-Sponheuer-Karnik) or MM (Modified Mercalli), the ESI2007 only uses effects on the environment to assign earthquake intensities. It, therefore, avoids the influence of building styles and the problem of saturation at high intensities, and allows applying the scale to paleo-earthquakes. The conversion of ESI2007 intensities to magnitudes, however, can only be based on a large set of modern case studies, which are currently being collected in the Earthquake Environmental Effects (EEE) catalogue hosted by ISPRA [
11]. Preferably, this set of case studies should include earthquakes with different mechanisms, magnitudes, depths, tectonic and geological settings, distributed all across the globe. A glance at the events included in the catalogue so far makes clear that this is not yet the case.
In this paper, we apply the ESI2007 scale to the 1992 Suusamyr Earthquake. There are several reasons for doing this: (i) The majority of entries in the EEE catalogue are currently from Europe and NW South America. Only a few Central Asian earthquakes are included. Thus, this study contributes to extending the entries for central Asia and compressional tectonic settings; (ii) the Suusamyr Earthquake was special in its primary surface rupture pattern, and the exercise of applying the ESI2007 scale to it thereby points out a general problem; (iii) the earthquake occurred in a sparsely populated area, which hampers the application of traditional intensity scales that mainly focus on damage to human-made infrastructure; and (iv) we document secondary cracks of the Suusamyr Earthquake with a high-resolution digital elevation model (DEM) computed from drone aerial imagery and the Structure-from-Motion (SfM) technique [
7,
12,
13].
Here, we first provide an overview of the 1992 Suusamyr Earthquake and review the existing intensity assessments. Then we evaluate the published EEEs from the literature, we include our field observations, and we present an ESI2007 intensity map. Finally, we discuss ESI2007 intensities vs. MM and MSK intensities and the implications of our study for the application of the ESI2007 scale on paleo-earthquake in general.
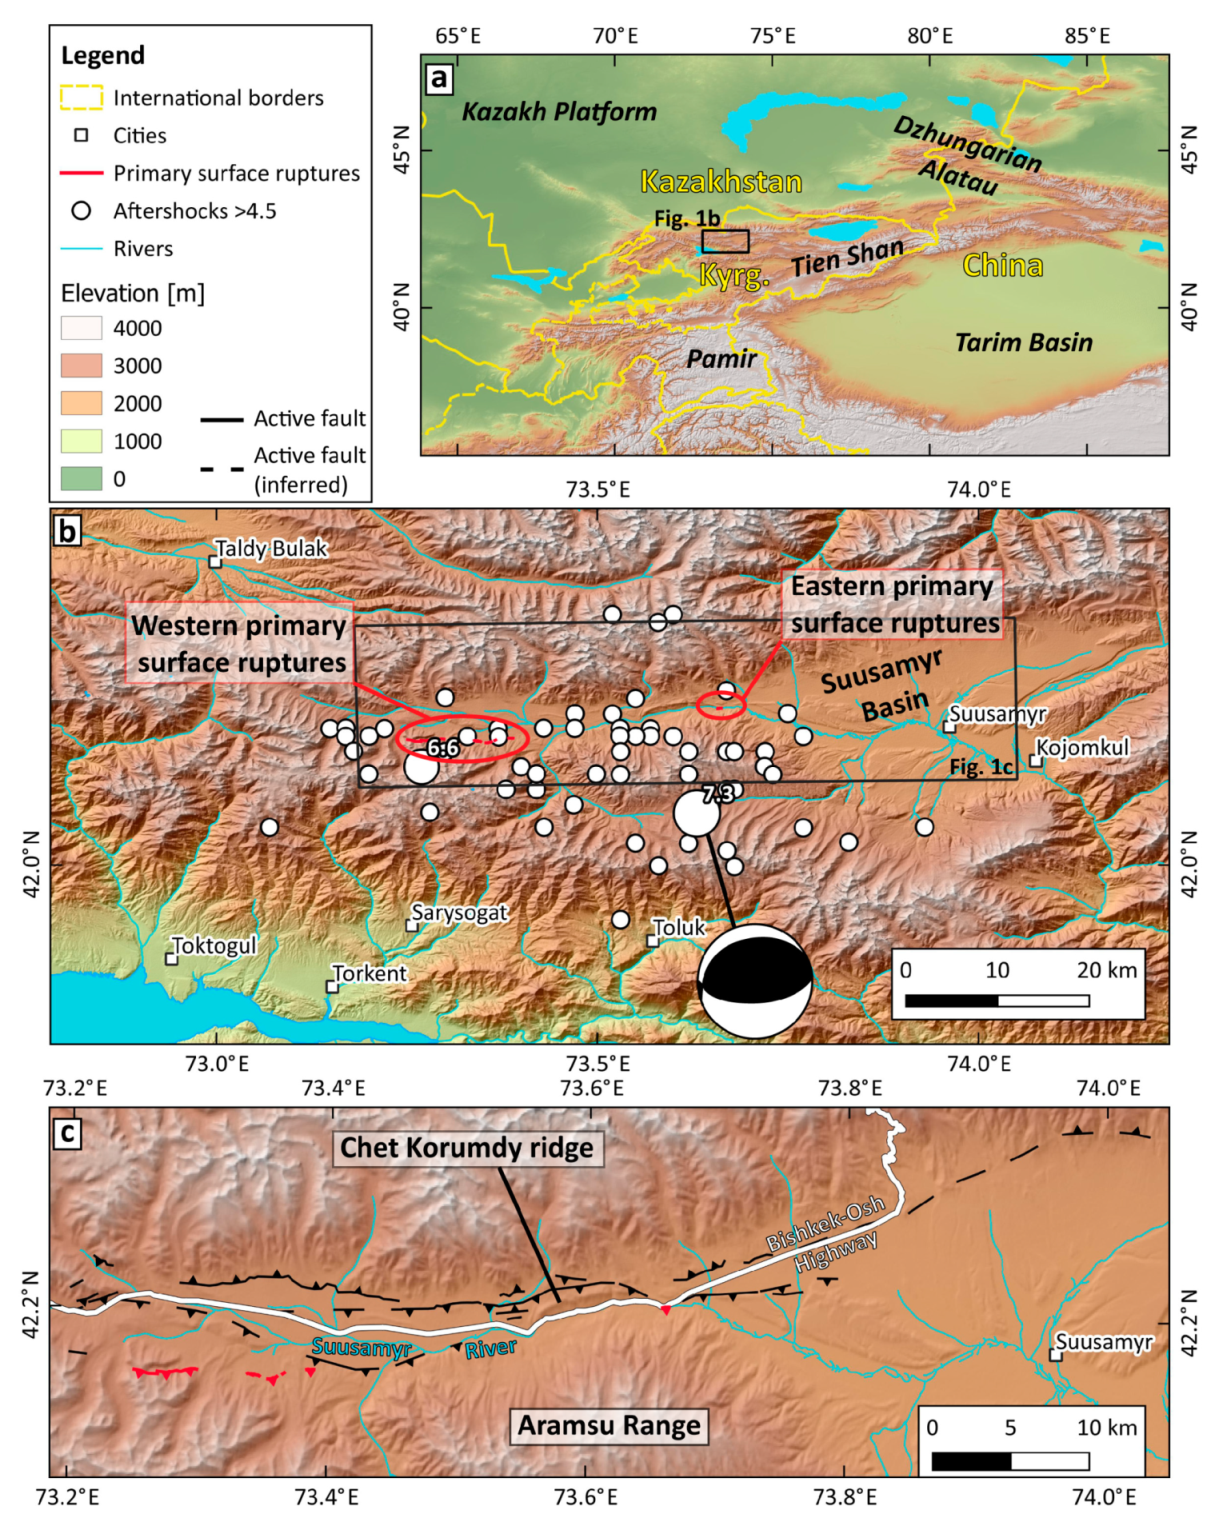
2. The 1992 Suusamyr Earthquake
An earthquake with a magnitude of M
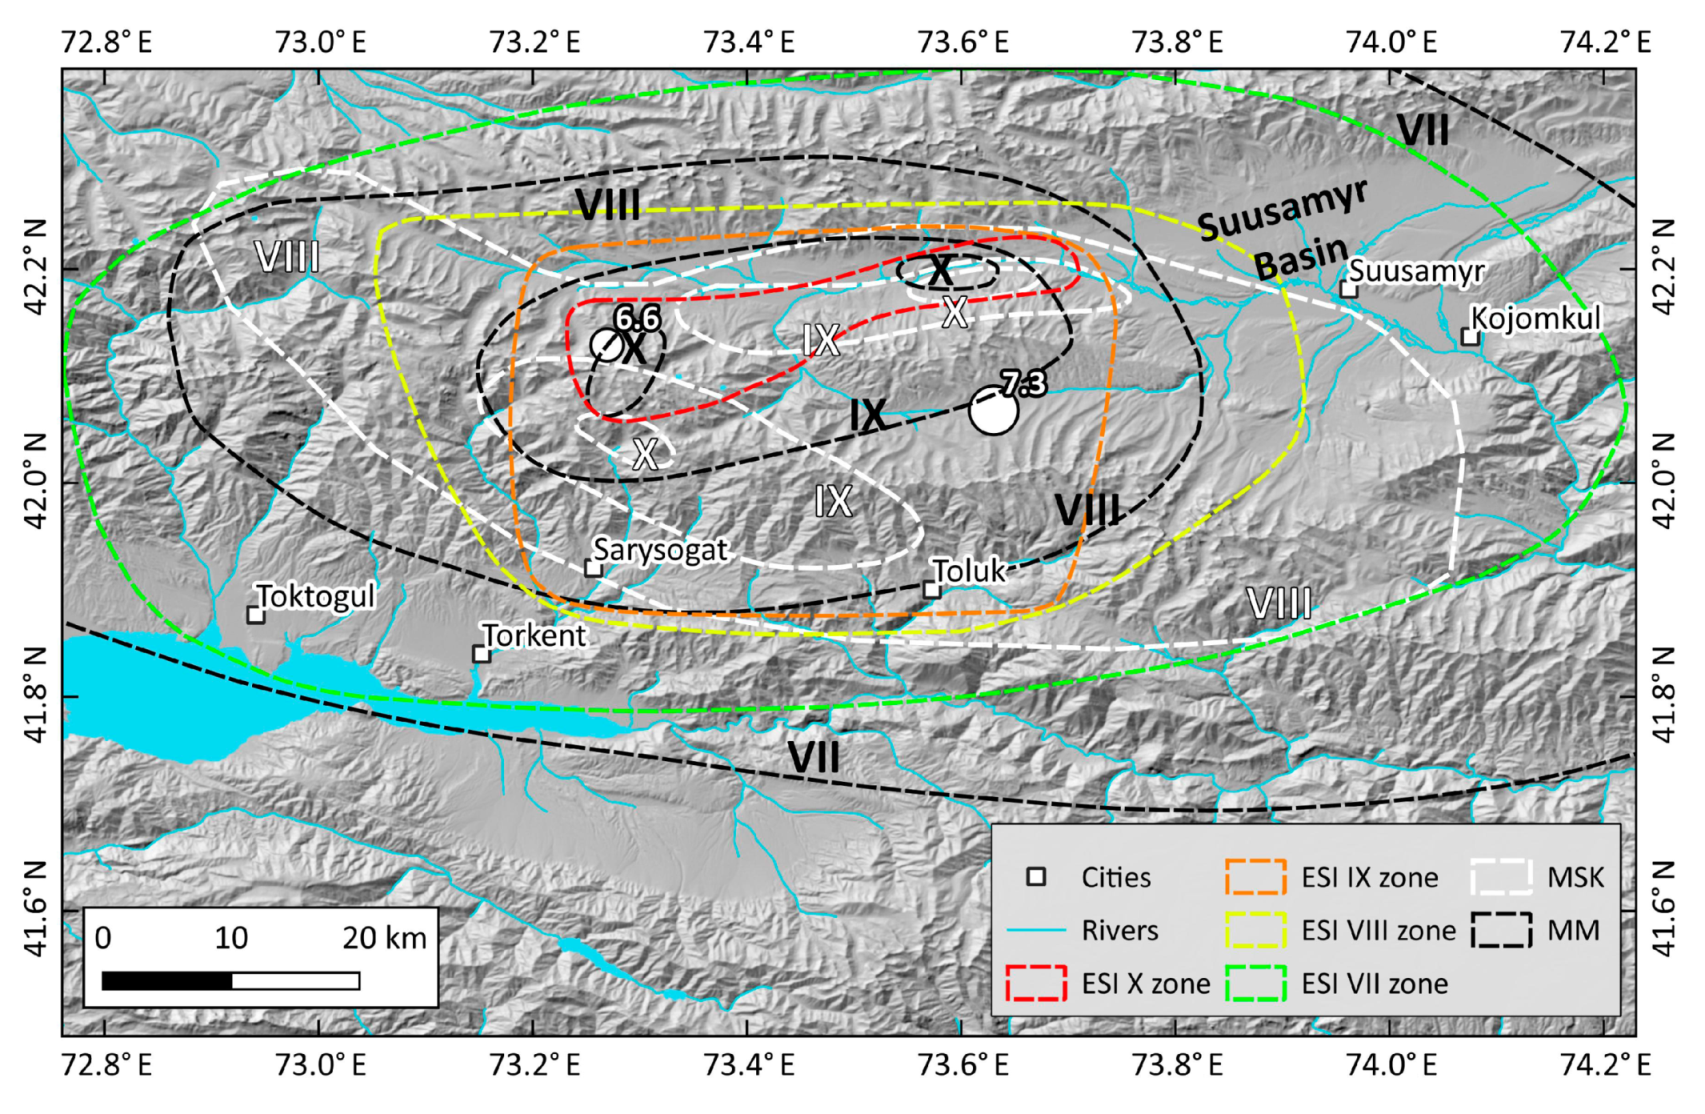
S7.3 hit the Suusamyr Basin in Kyrgyzstan on 19 August 1992, 02:04 GMT (
Figure 1). The Suusamyr Basin is an east-west elongated intramontane basin in the Kyrgyz Tien Shan, surrounded by Paleozoic bedrock. The thickness of the Cenozoic basin fill reaches several hundreds of meters in its widest part near the town of Suusamyr ([
14,
15] and references therein). A thick Quaternary cover blankets most of the Neogene rocks in the basin center. The basin is bound by E-W striking thrust faults to the north and the south (
Figure 1c). North−South shortening is accommodated by the oppositely-vergent thrust. Reference [
7] showed that several surface-rupturing earthquakes occurred in the Late Quaternary on these faults, testifying to the tectonic activity of the area. Several ~E-W trending anticlinal ridges in the basin also record ongoing shortening. The Chet Korumdy ridge, which will be discussed in this paper, is a 250 m high, 7 km long ridge paralleling the Suusamyr River (
Figure 1). It is made up of steeply north-dipping sediments of Pliocene-Quaternary age [
6]. At its western tip, prominent wind gaps record Late Quaternary uplift [
7,
15,
16].
The Suusamyr Earthquake ruptured an east-west-trending, south-dipping thrust fault in the Suusamyr Basin with the epicenter beneath the Aramsu Range. Reference [
18] reports a centroid depth between 5–21 km and a fault dip of 50° ± 13° based on the teleseismic body-wave inversion of the main shock and an aftershock study using broadband stations and temporal and regional networks. Reference [
20] analyzed body waves and surface waves, and reported a hypocenter at a depth of 14 ± 2 km, a fault dip of 49° ± 6° to the south, and a rake of 105° ± 3°. Within two hours of the main shock, three large aftershocks with magnitudes of M
S6.6, M
S6.6, and mb6.0 occurred west of the Aramsu Range, but their mechanisms and depths are unknown [
18]. The more than 900 aftershocks that were registered in the months after the Suusamyr Earthquake occurred at depths shallower than 15 km. They occurred within a rather narrow, south-dipping zone at depths between 5 and 15 km and showed a more diffuse pattern near the surface [
18].
The most surprising effect of the earthquake was its primary surface rupture pattern. Two sets of relatively short primary ruptures were identified. At the eastern tip of Chet Korumdy ridge, a short primary rupture occurred in the Suusamyr River bed [
6]. This site is referred to as the ‘eastern primary surface ruptures’. The second set of primary surface ruptures formed more than 20 km further west (the ‘western primary surface ruptures’), with no hints for surface breaks in between these two (
Figure 1). This peculiarity and its implications for ESI2007 intensity assignment will be discussed later in this paper. Apart from these primary surface ruptures, the Suusamyr Earthquake also caused secondary cracks, often referred to as secondary ruptures in the literature. Here we will use the term secondary ruptures to summarize all types of cracks and ruptures that cannot be attributed to primary faulting. The 1992 Suusamyr Earthquake also caused widespread mass movements, mud eruptions, and jumping stones.
3. Macroseismic Effects of the Suusamyr Earthquake
The Suusamyr Earthquake resulted in more than 50 deaths, most of which were due to collapsed buildings throughout the valley and mass movements that occurred at Belaldy River [
6,
21,
22]. The epicentral area was surveyed by field crews and from a helicopter during the months following the earthquake. The results of these surveys were reported in great detail in References [
6,
21,
22,
23]. Reference [
7] revisited the Suusamyr Basin and reported additional information on the earthquake effects. In the following, we briefly report on the published intensity assessments and review the earthquake environmental effects of the Suusamyr Earthquake in light of the ESI2007 scale.
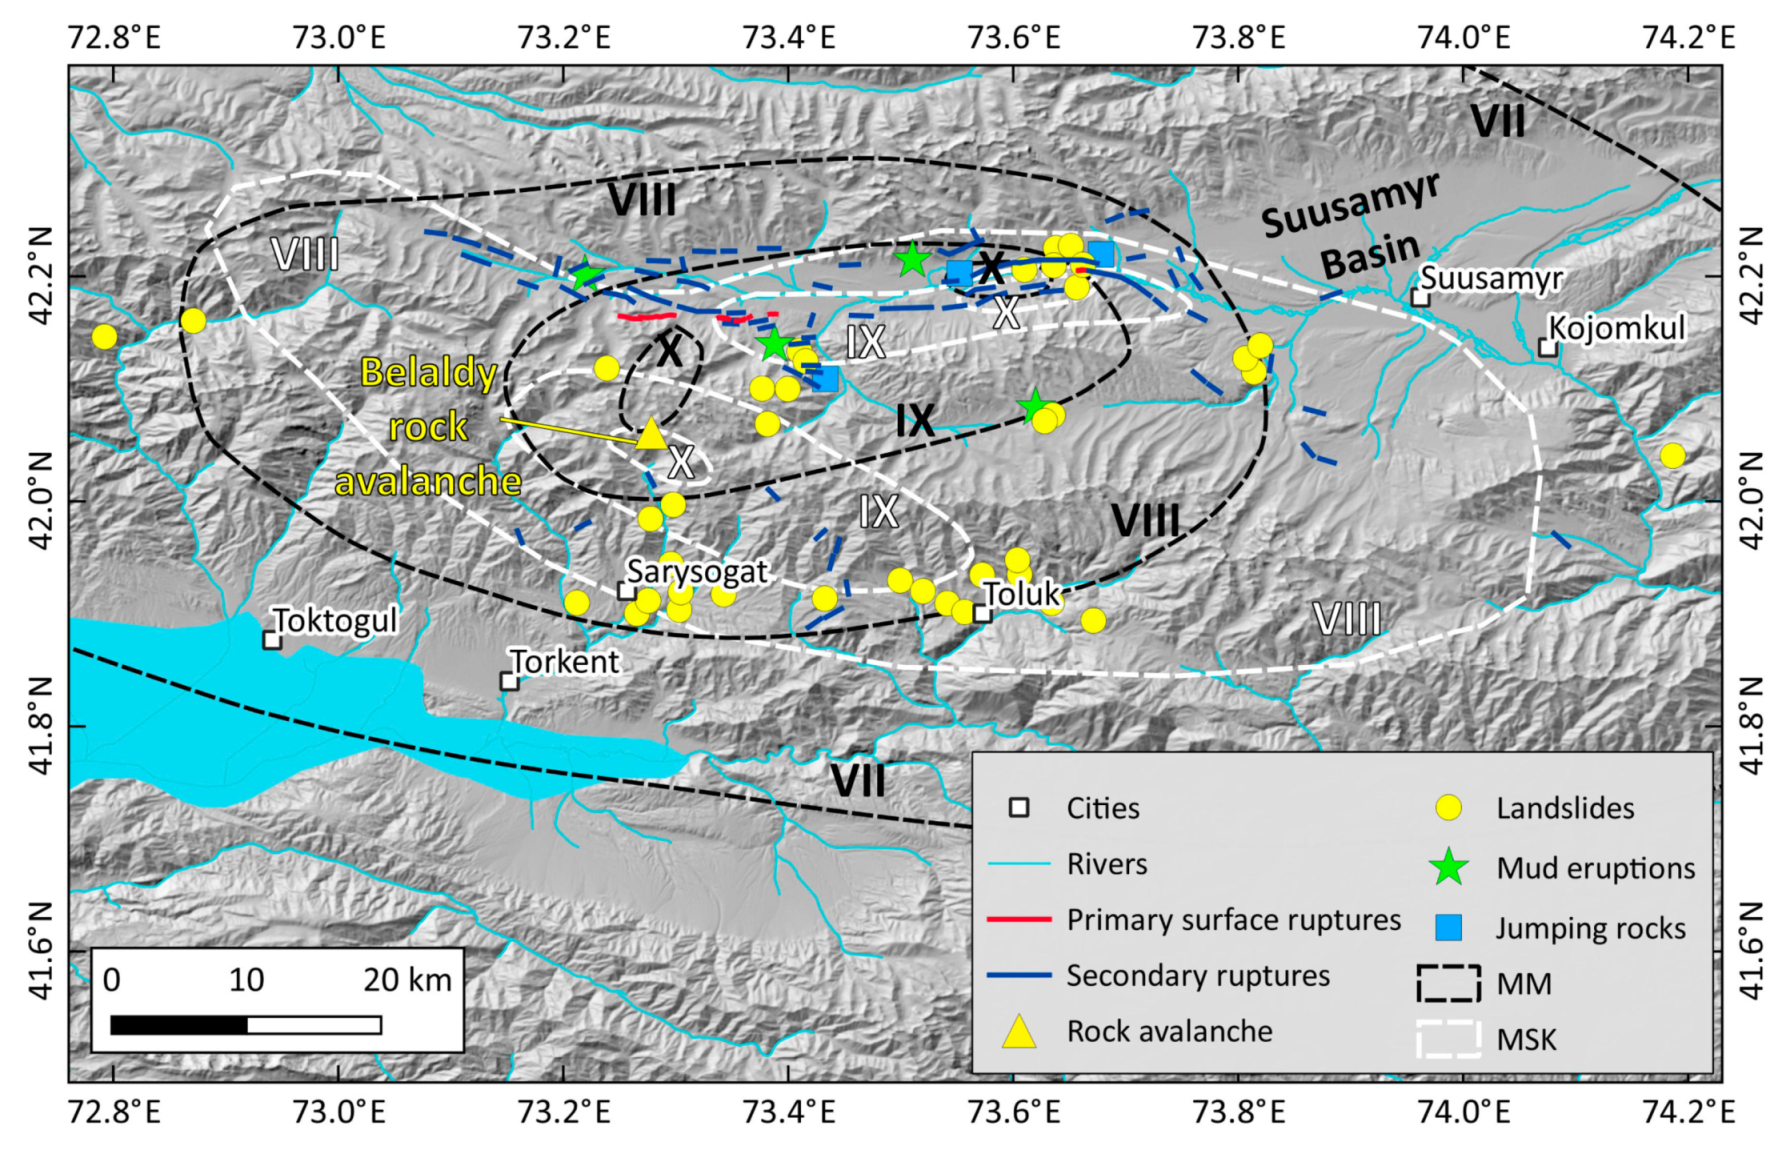
Reference [
6] published a Modified Mercalli (MM) intensity map of the earthquake (
Figure 2). They used data from 41 individual sites, assessing the damage to human-made structures and also environmental effects. They report intensities of MM ≥ X for two sites. The first one is an E-W elongated zone around the eastern primary surface ruptures and the Chet Korumdy ridge, the second one is an NNE-SSW elongated zone in the Belaldy River valley region. The first site is characterized by primary and secondary surface ruptures, large landslide volumes, and strong peak ground accelerations (PGA). The second site, however, does not encompass primary or secondary ruptures, but a very large mass movement in the Belaldy Valley. The combined area of MM ≥ X is 62 km
2. Intensities of MM = IX were assigned to an ENE-WSW elongated area of 835 km
2, surrounding the primary surface ruptures and encompassing the northern part of the area where numerous mass movements occurred. An E-W elongated area of 3000 km
2 was assigned intensity MM = VIII. This isoseismal includes nearly all mass movements. The area of intensity MM = VII is NNW-SSE elongated (roughly parallel to the orogenic trend) and encloses 13,000 km
2 (
Table 1).
Intensity data were also compiled within the framework of the SNSF Project No IB7320-110694 (
http://www.kyrgyzstan.ethz.ch) by Reference [
19], who published Medvedev-Sponheuer-Karnik (MSK) intensities (
Figure 2). The shape of the isoseismals differs from the MM intensities reported by Reference [
6], but the affected locations and extent are similar. Highest intensities of MSK = X were also assigned to two separate locations, covering 51 km
2. The one near the eastern primary surface ruptures is located south of the Suusamyr River and has a shape similar to the MM ≥ X intensities, although shifted to the south by ~1 km. The other one near the Belaldy River valley is elongated in NW-SE direction and also located further south compared to MM ≥ X. Intensities of MSK = IX were assigned to two individual patches with a total of 600 km
2. The first one runs parallel to the Suusamyr River and is stretched in E-W direction, the second one is elongated NW-SE (parallel to the orogenic trend), covering the high mountains that border the Suusamyr Valley to the southwest. The zone of intensity MSK = VIII overlaps with the MM = VIII intensities, but is more E-W elongated and also followed the orogenic trend. The total area of MSK = VIII is 3200 km
2. No MSK = VII intensities were reported by Reference [
19] (
Table 1).
In the following, we discuss all earthquake environmental effects described in the literature and present new data from our fieldwork. We assign ESI2007 intensities for all EEEs, which are the basis for our intensity map.
3.1. Primary Surface Ruptures
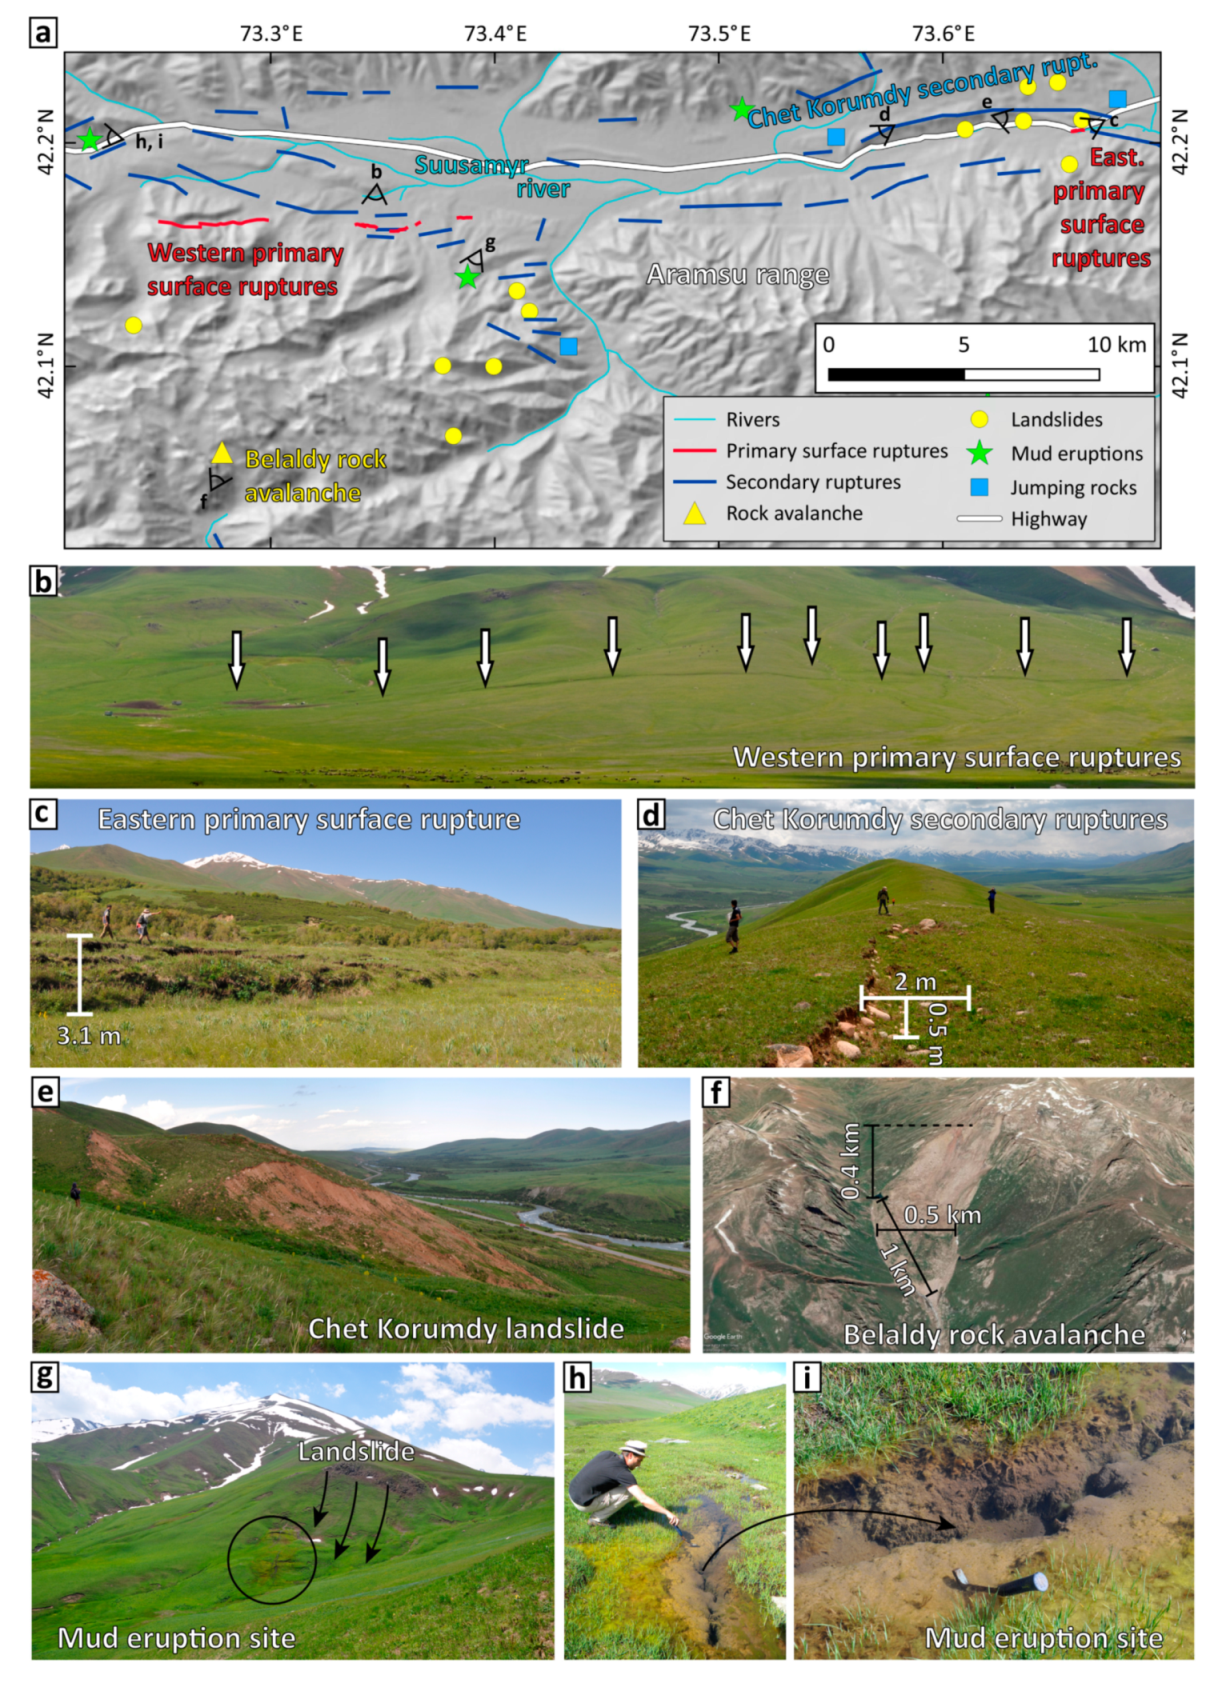
The eastern primary surface ruptures occurred at the eastern tip of Chet Korumdy ridge next to the Bishkek-Osh highway (162 km marker;
Figure 1,
Figure 2 and
Figure 3). As a result of the main primary surface rupture, the Suusamyr River temporarily changed its course. The ruptures were trenched by Reference [
24] who confirmed that the fault reached the surface and that the surface deformation is due to thrust motion on an S-dipping fault plane. Reference [
21] report a 400 m long, N-facing scarp of up to 2.7 m height and up to 0.3 m of lateral slip. Here, Reference [
6] report a fold-scarp geometry and 500 m of primary ruptures with a height of 2.7 m. They estimate a total slip of 4.2 m assuming no horizontal component of motion. Both authors mention numerous rupture segments that also affected the nearby highway, but state that the scarp in the river bed is by far the dominating feature. Furthermore, the authors state that the other segments are likely secondary ruptures. Reference [
7] surveyed the eastern primary surface ruptures again in 2015/16 with a drone and produced a high-resolution DEM with the SfM technique. They document a 600 m-long primary surface rupture with up to 3.1 m vertical displacement and a total slip of ~3.6 m that occurred in the Suusamyr River bed. No evidence for the other, smaller scarps on the highway was preserved in 2015/16, due to road repairs, but small secondary scarps were still visible south of the road. Reference [
21] reported additional ~4 km of N-facing scarps on the hills further to the east, which could be a continuation of the large main scarp in the river valley. A 300 m wide deformation zone encompasses numerous fault strands with vertical offsets of 0.1–1.05 m height. These scarps face north and are at least in one location formed by a steeply S-dipping fault. References [
6,
23] do not mention these additional ruptures.
The western primary surface ruptures occurred on six segments with a total length of 7 km, spanning a 12 km long rupture zone [
6,
7,
21] (
Figure 2 and
Figure 3). N-facing scarps are typically 0.7–1.2 m high, but locally reach up to 2 m. Reference [
7] also report that some scarps show up on pre-1992 satellite imagery, but their pre-1992 height in unknown. This is why the total vertical offset measured from high-resolution DEMs of marker surfaces has to be taken as a maximum value. However, References [
6,
21] report 0.9–1.8 m high fresh ruptures scarps that formed in 1992, and we take this information as the best available data on their height.
The two sets of primary surface ruptures with their >20 km separation and the unusual scarp length-to-height ratio of the eastern primary surface ruptures can be treated in three different ways in an ESI2007 intensity assignment [
8,
9]. (i) If we consider the ruptures separately, the western primary surface ruptures correspond to intensity ESI = IX because of their length of 7 km. Using the 12 km long rupture zone reported by Reference [
7] would correspond to ESI = X. The surface displacement also results in ESI = X. The eastern primary surface ruptures are classified as ESI = VIII if we use the length of the main scarp only (600 m). The additional ~4 km of scarps reported by Reference [
21] would lead to ESI = IX. The maximum surface displacement of 3.6–4.2 m results in ESI = XI, since 3 m offset is recommended as the threshold between ESI = X and ESI = XI. (ii) The second option is to add up the primary surface rupture lengths of the western and the eastern sites and to ignore the spatial separation. Using the 7 km primary rupture length in the west and the 600 m length in the east gives ESI = IX. Using the 12 km long primary rupture zone in the west leads to ESI = X, regardless whether the additional 4 km in Reference [
21] from the east are taken into account or not. Similarly, using the additional 4 km from Reference [
21] leads to ESI = X, using either the 7 km primary rupture length or the 12 km primary rupture zone in the west. (iii) The third option is to measure a total primary rupture zone length from the western tip of the western primary surface ruptures to the eastern tip of the eastern primary surface ruptures. This leads to a length of 35 km without and 40 km with the additional 4 km of primary surface ruptures reported by Reference [
21], corresponding to ESI = X.
3.2. Secondary Ruptures
Extensive ground cracks were caused by the Suusamyr Earthquake throughout the Suusamyr Basin and along with the surrounding mountain ranges (
Figure 2 and
Figure 3). These effects were mapped in detail after the earthquake and published in References [
6,
21,
22]. Reference [
21] report that secondary ruptures covered an area of more than 4000 km
2. Reference [
6], however, estimates that the total area affected by secondary earthquake effects (including secondary ruptures, mass movements, and mud eruptions) is only ~2500 km
2, based on the report in Reference [
25]. We used the map from Reference [
22] and calculated a total secondary rupture length of 114 km, covering an area of 2520 km
2.
Most secondary cracks occurred in the E-W running Suusamyr River valley between the western and the eastern primary ruptures, but secondary cracks were also reported from SE of the Aramsu Range and the area between Toluk, Sarysogat, and the Belaldy rock avalanche [
21,
22] (
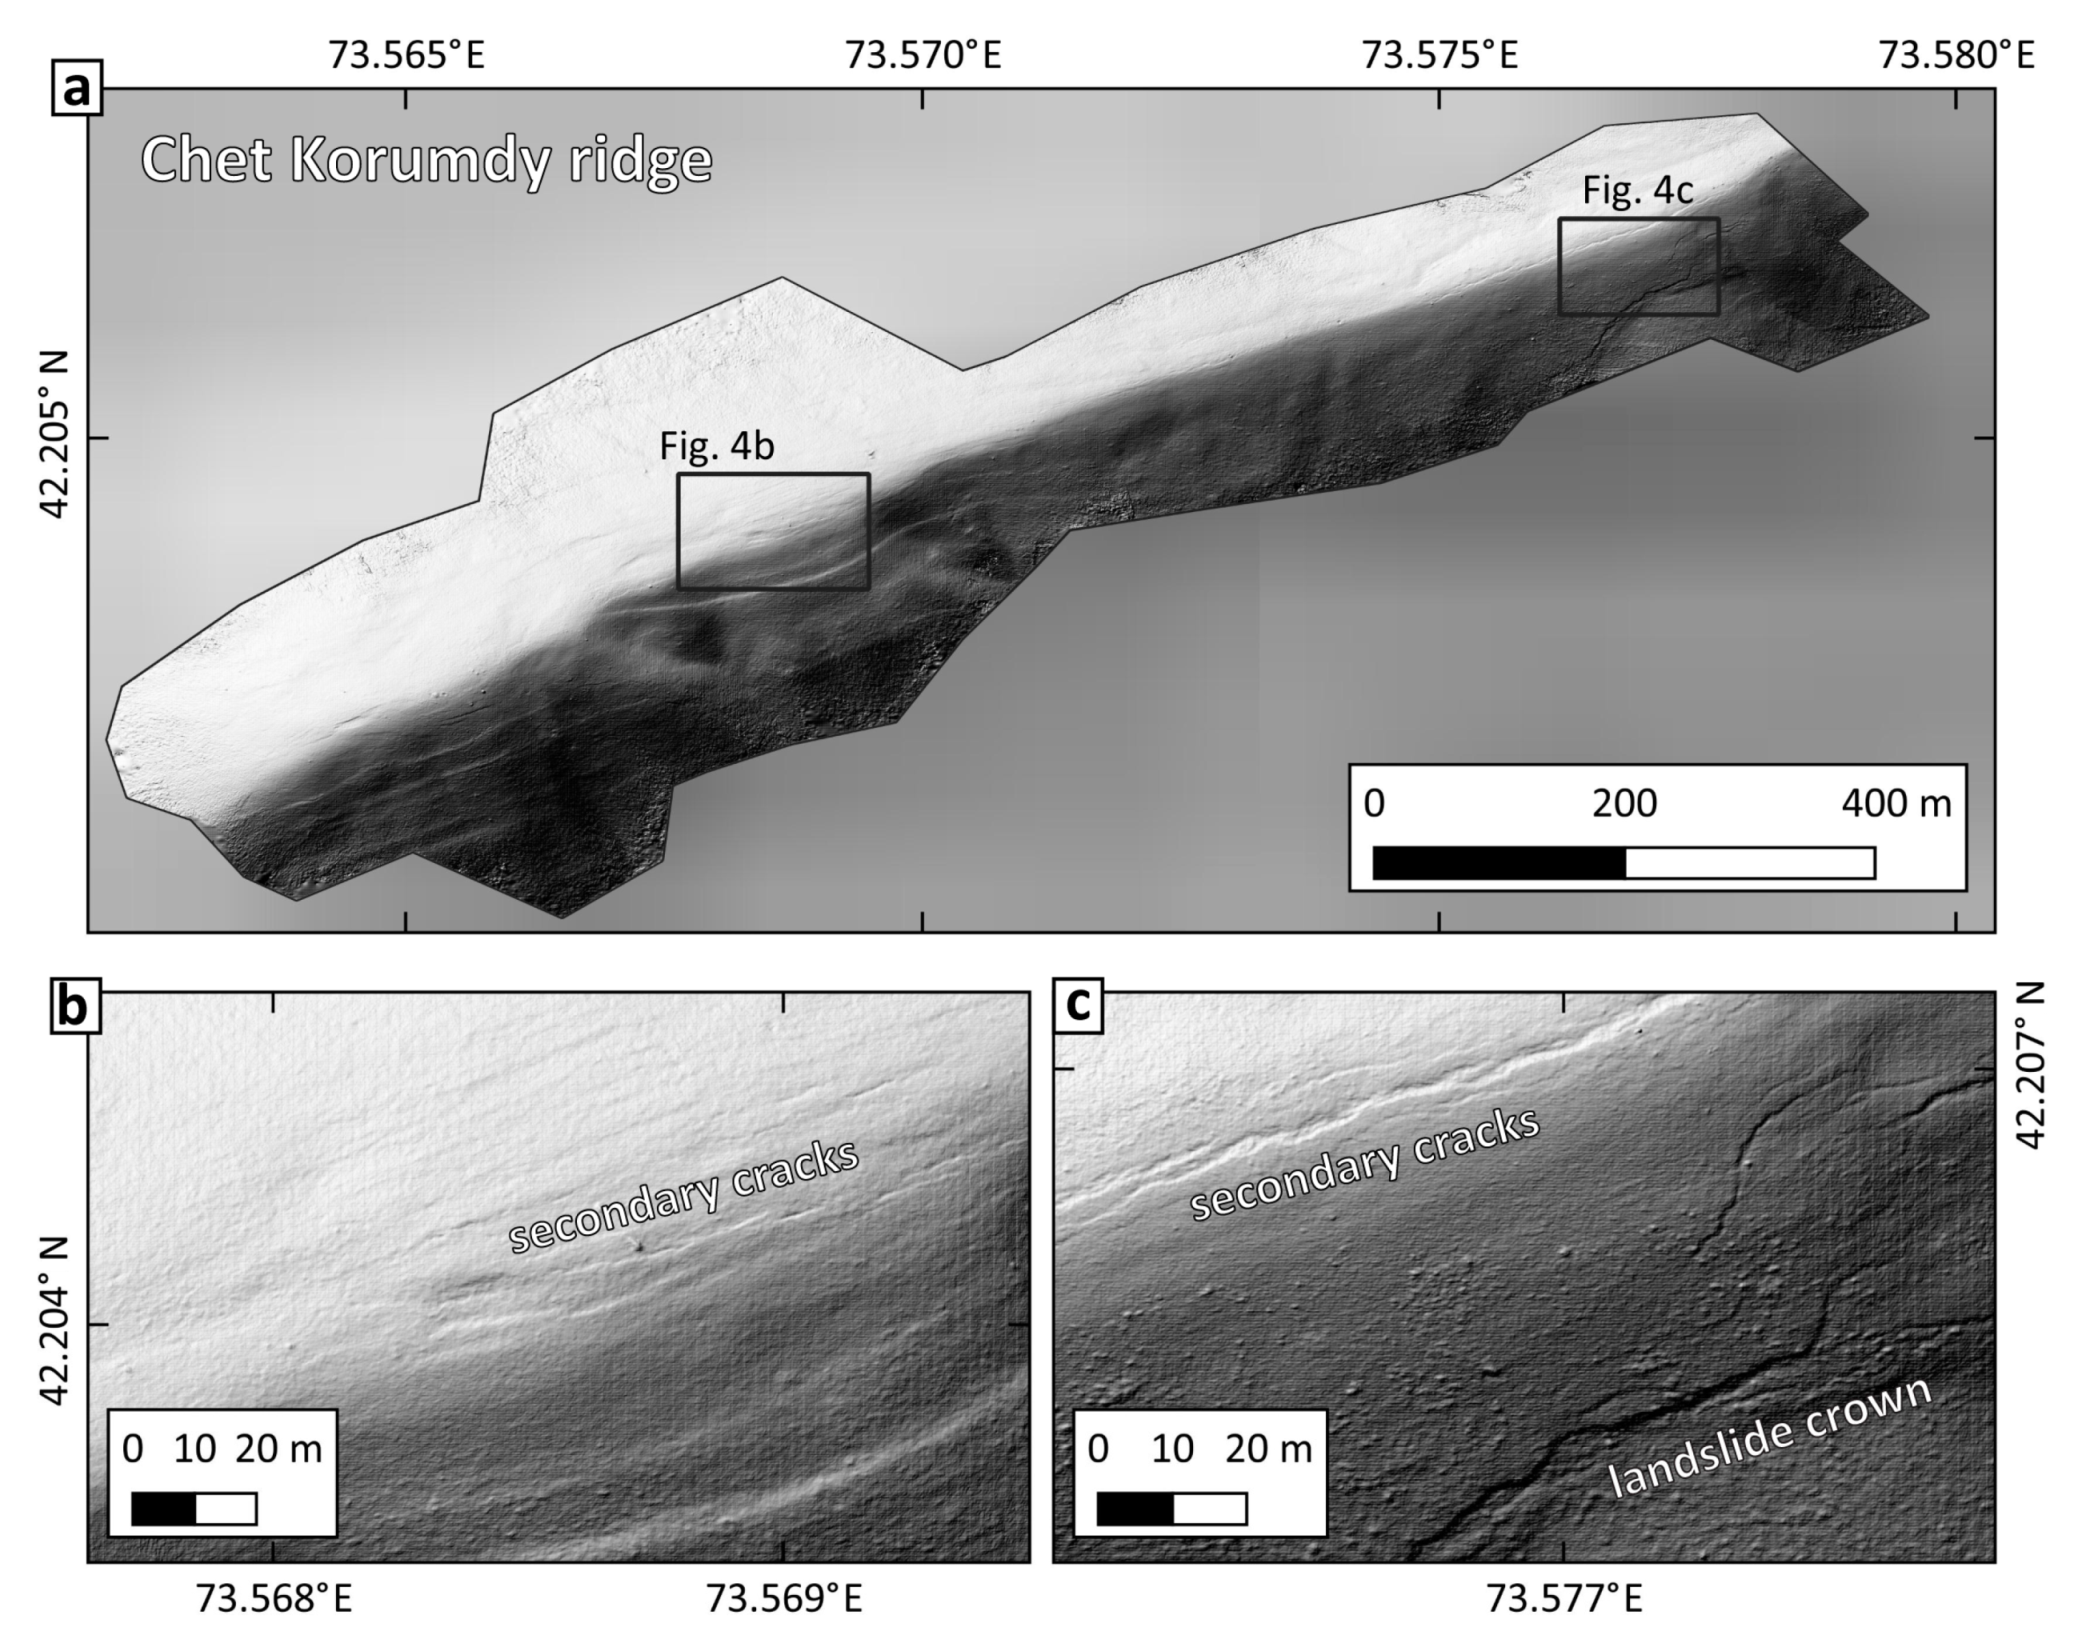
Figure 2). Along the flanks of the mountain ranges, seismic shaking led to gravitational cracks that mostly paralleled the valley. These reached individual lengths of several tens of meters, spanning fissure zones of several kilometers length. The Chet Korumdy ridge was particularly affected by secondary cracks, which mainly formed as E-W elongated grabens on top of the ridge as a result of extension (
Figure 3 and
Figure 4) and S-facing scarps on its southern side. We surveyed parts of the secondary ruptures on the Chet Korumdy ridge with a drone and created a high-resolution DEM, shown in
Figure 4.
Secondary ruptures were—to a lower extent—also reported from some flat areas in the Suusamyr basin and west of Chet Korumdy ridge. Most of them occurred close to rivers and are likely related to the presence of unconsolidated, saturated sediments subject to lateral spread.
We assign intensities of ESI = X to the Chet Korumdy area and the eastern primary surface ruptures, based on the clustering and the dimensions of the secondary ruptures. Near the western primary surface ruptures, we assign ESI = IX also because of the number, the size, and the extent of the phenomena. Intensities of ESI = VIII were assigned to the remaining, more isolated occurrences of secondary cracks.
3.3. Mass Movements
The 1992 Suusamyr Earthquake caused widespread mass movements, including landslides, rock falls, and rock avalanches. These mass movements have been intensively studied after the earthquake [
6,
19,
21,
22,
26,
27,
28,
29,
30,
31], and we compiled the intensity assignment from these studies.
The largest mass movement was the Belaldy rock avalanche (
Figure 2 and
Figure 3) with an estimated volume of 10
7–10
8 m
3 [
6,
22,
30]. Additional large landslides were reported from the downstream section of the Belaldy river, with volumes of a few thousand to a few tens of thousand cubic kilometers [
21]. Those deposits were re-activated in the year after the earthquake and caused a catastrophic mud flow that affected several villages [
22]. At the southern flank of Chet Korumdy ridge, landslides with up to 0.5–1 × 10
6 m
3 volume were mobilized and damaged the Bishkek-Osh highway [
26]. A large cluster of mass movements occurred in the Toluk-Sarysogat area, where also intense secondary ruptures were observed (
Figure 2). Based on the maps in References [
6,
19,
21,
22], we compute a total affected area of 2336 km
2.
The volume of the largest mass movement corresponds to intensities of ESI = X-IX, smaller slides are associated with ESI = VIII-IX. Little information is available on the volume of individual mass movements apart from the examples discussed above. For ESI2007 intensity assessments, the total affected area is also an input parameter. The southern cluster of landslides in the Toluk-Sarysogat area covers ~500 km2, which is much higher than the threshold of ~100 km2 recommended for ESI = VIII zoning. We, therefore, assigned intensities of ESI = IX to areas where mass movements cluster and intensities of ESI = VIII to more isolated mass movements. The isolated mass movements in the far west and the far east of the study area were assigned intensity ESI = VII. Using the total affected area (2636 km3) as an input value leads to a maximum intensity of ESI = X.
3.4. Mud Eruptions
No liquefaction was reported from the Suusamyr Earthquake, bud mud eruptions in the days following the earthquake were described from four locations [
19,
21]. Reference [
21] report that the explosive ejections occurred at ‘boggy sites on young active faults’ and that they were even accompanied by gas combustion. Reference [
6] cites eye witnesses who heard ‘loud noise’ and saw ‘smoke that bore a pungent aroma’. They also report radially scattered rocks and mention the connection underlying active faults. Reference [
21] mention that one of the eruptions resulted in a 400 m long and 100 m wide mud flow. We visited two of the sites in 2015 (
Figure 3) and found muddy bogs related to landslides. At the central site near the western primary surface ruptures a muddy layer was found at a landslide toe (
Figure 3g). We excavated a 25 cm deep pit into the deposits and found them to be dark, uniform, saturated soils without any hints of burned layers. We did not find any radially scattered rocks or similar signs of an explosive event. Instead, the site appeared like an over-pressured landslide mass from which water was seeping. At the westernmost site near the highway (
Figure 3h,i), we encountered swampy areas on top of a landslide deposit. Puddles of several meters length contained fissures with seeping water (
Figure 3i). No hints for explosive eruptions could be identified in 2015/16. If those mud eruptions happened as reported by the eyewitnesses, their traces were entirely gone 23 years after the earthquake and the sites looked like ordinary, yet very wet landslides.
These effects are hard to evaluate with the ESI2007 scale, since they are rather unusual. We decided to assign them intensity ESI = IX to account for the fact that they are unusual phenomena related to the seismic shaking, and that they had a considerable impact on the natural environment. However, the observation that they occurred after the earthquake and not co-seismically complicates the assessment. With the ESI = IX assignment, they fall well within the range of values of the neighboring EEEs.
3.5. Jumping Rocks
At several sites, jumping rocks were found during the post-earthquake surveys [
21]. These are boulders of considerable size sitting on flat or nearly flat surfaces that were displaced as a result of the strong ground motion, not to be confused with rock falls or other types of gravitational effects. These effects require >1 g peak ground acceleration. Reference [
21] describe rocks with a weight of 40–70 kg that moved 2–5 m on a flat surface west of the Aramsu range and an ~8 ton boulder that moved 30 cm uphill at the same site (
Figure 2). Near the eastern primary surface ruptures, a ~1.3 ton block reportedly moved 2 m and two boulders of ~10 tons sitting on flat ground underwent displacement of 25–30 cm and 10° rotation. In the same area, an undisclosed number of rocks were moved laterally 85 cm [
21].
We visited the Chet Korumdy ridge in 2015/16 and looked for the jumping rocks, but we failed to identify the boulders that moved in 1992. Most likely the footprints of the pre-earthquake position were already completely altered in the 23 years after the earthquake, so that there is no way to distinguish between a boulder that had moved and ones that did not jump.
The ESI2007 guidelines assign intensities of ESI = IX-XII to the phenomenon of jumping rocks, depending on their size, roundness, travel distance, and the local slope. Based on the values reported by Reference [
21], we assign ESI = X to all the sites with large jumping boulders.
3.6. Summary of the ESI2007 Assignment
ESI2007 intensity ESI = XI was assigned to two sites only: To the eastern primary surface ruptures because of the amount of offset, and to the Belaldy rock avalanche because of the large volume of this mass movement.
Intensities of ESI = X cover an area of 317 km2 and are mainly based on the evaluation of primary surface ruptures, clusters of secondary ruptures, jumping rocks, and large mass movements. This isoseismal has an E-W elongated shape paralleling the fault strike and includes the Suusamyr river valley and the slopes south of it.
ESI = IX intensities cover an area of 1735 km2 and include secondary ruptures, clusters of mass movements, and mud eruption sites. This isoseismal has an E-W elongated, rectangular shape.
Intensities of ESI = VIII were found in an E-W elongated ellipse with an area of 2700 km2. This intensity is based on rather isolated secondary ruptures and individual mass movements.
For intensity ESI = VII, only a few data points were available in the far east and the far west of the study area. These intensity values are based on four data points only, two mass movements and two secondary cracks. Thus, they come with high uncertainty, and the ESI = VII isoseismal could only be roughly estimated to cover ~6500 km2. This value is highly uncertain. In contrast, drawing a concave hull around all secondary effects combined (cracks, mud eruptions, landslides, rock falls, jumping stones) results in an area of 3254 km2 only, which is little larger than the ESI = VIII isoseismal.
4. Discussion
We combined our intensity assessment with the macroseismic effects on the environment reported by Reference [
6], who list 41 individual sites with macroseismic observations. We followed the procedures described in detail in References [
8,
9,
10].
4.1. The ESI2007 Map of the Suusamyr Earthquake and Comparison with Other Intensity Scales
The assignment of ESI2007 values for the primary surface ruptures is not straight forward as pointed out in
Section 3.1. Depending on how the spatial separation between the two sets of primary surface ruptures is treated, one option is to plot two areas with different intensities around either location (ESI = X in the west and up to ESI = XI in the east). The other option is to average the observations and to plot one or two zones with ESI = X. Taking into account the unusual scarp length-to-height ratio of the eastern primary surface ruptures, for which the underlying mechanism is not yet well understood, we decide to treat them as an exception that does not justify assigning ESI = XI. Based on the scarp length, there we assign ESI = X.
Secondary effects allow drawing a more coherent image of the intensity distribution. Although the Belaldy rock avalanche stands out, due to its huge volume that would justify intensity ESI = XI, we treat it as an isolated event that fits more into the general pattern of ESI = X mass movements in the epicentral area. In general, we found that the highest ESI intensities can be assigned, due to the size of individual effects and their spatial distribution. Intensity values of ESI = IX and ESI = VIII, on the contrary, can be distinguished based on the spatial clustering of secondary effects only. This is mainly due to the lack of detailed descriptions for each locality, such as landslide volume or length of individual secondary ruptures and cracks.
The highest ESI2007 intensity X covers an E-W elongated area that roughly includes MM = X and MSK = X intensities from previous studies (
Figure 5 and
Figure 6). In contrast to the ESI2007 intensities, MM and MSK intensities were assigned to two isolated patches surrounding the eastern and western primary surface ruptures, respectively, and to the Belaldy rock avalanche area (
Figure 6). Intensity MSK = IX was also attributed to two isolated patches by Reference [
19], whereas MM = IX was assigned to an E-W elongated patch [
6]. Our intensity assessment results in a larger patch of ESI = IX, which reaches further south than MM and MSK intensities. This is due to a large cluster of mass movements in the Sarysogat-Toluk area and probably reflects the fact that this area is sparsely populated, but sits on the hanging wall above the actual fault plane. The mud eruption sites were also assigned ESI = IX, although they occurred after the earthquake [
21]. However, they are related to the Suusamyr event. In any case, they do not have a strong influence on the overall ESI2007 map because they do fall in areas where other effects were mapped with ESI = IX, too. Further examples of similar phenomena are needed to understand these effects and their potential for ESI assignments better. Intensity ESI = VIII was found in an area smaller than that assigned MM = VIII and MSK = VIII, and the same is true for intensity ESI = VII. This can be explained by the fact that minor shaking can still cause damage to houses and infrastructure, while it is not sufficient anymore to cause significant earthquake environmental effects, such as landslides or secondary ruptures.
The observations on the ESI2007 intensity distribution and the comparison with MM and MSK intensity assessments highlight three peculiarities of the ESI2007 scale. First, it allows distinguishing high intensities in places were traditional scales saturate because of the total collapse of human-made structures that are not reinforced. Second, it allows assigning intensities in sparsely populated places, where traditional scales cannot be applied, due to the lack of observations. Third, it rather captures high intensities (>VII), which cause significant environmental effects. Thus, for modern earthquakes, it is best applied in combination with the traditional scales to get the full picture of earthquake effects. For paleo-earthquakes, however, the insensitivity of small to moderate events is useful because it makes it less likely to confuse moderate earthquakes with significant events that release a large seismic moment.
4.2. Treating Uncertainties in the Application of the ESI2007 Scale
Uncertainties in intensity assignment mainly arise from the unknown volumes of most landslides. However, the maximum ESI2007 intensity is well-constrained by the primary surface ruptures and the Belaldy rock avalanche. No mass movements of similar size have been reported, so maximum intensities are unlikely to be higher. The lowest intensities are defined by the extent of documented environmental effects, which is also well-known. Therefore, the shape of the isoseismals between maximum and minimum may somewhat vary, but the overall picture and the maximum intensity are unlikely to be affected by these uncertainties.
Another source of uncertainty is the unknown height of the pre-1992 scarps at the western primary surface ruptures that [
7] identified on satellite imagery from 1968. The post-earthquake surveys report a height of 0.9–1.8 m [
6,
21], while the survey in 2015/16 found heights of 0.7–1.2 m with some outliers reaching 2 m height [
7]. The imagery of the pre-1992 scarps does not reveal a free-face (
Figure 5 in Reference [
7]), which indicates that the height of the fresh ruptures reported by References [
6,
21] should be reliable because the height of the free-face is easy to measure. These heights would correspond to ESI = X. If the pre-1992 vertical offset was larger than 0.5–1.4 m, a lower intensity of ESI = IX would have to be assigned [
8,
10]. Given the state of preservation of the free-face in 2015/16, we consider this very unlikely (
Figure 3b, Reference [
7]). If the length of the western primary surface ruptures is taken into account, ESI2007 intensities do not change of course. Therefore, the height of the 1992 western primary surface ruptures does not have a large effect on the overall ESI2007 assignment. While the problem of pre-existing scarps is usually a source of uncertainty hard to deal with in paleoseismology studies, this effect does not pose a significant problem in the case of the 1992 Suusamyr earthquake. Extending the use of scarp-diffusion modelling to multi-event scarps [
32,
33,
34] may help to improve the interpretation of multi-event scarps.
From a paleoseismology perspective, the peculiar offset-to-length ratio of the eastern primary surface ruptures is interesting. Although the nature of the eastern primary surface ruptures of the 1992 Suusamyr Earthquake is well understood [
6,
7,
21,
23,
24,
25], such unusual primary effects are likely hard to interpret when attributed to a paleo-earthquake. One obvious interpretation of such an unusal feature would be that a longer primary scarp once existed, and that erosion has eradicated the prolongation of the scarp along strike. In that case, using the vertical offset only would result in ESI = X-XI. Using the mapped length to assign ESI2007 intensities would result in ESI = VIII only. In that case, the earthquake intensity, and thus, also the magnitude, would be dramatically underestimated.
If in case of a paleo-earthquake, the eastern and western primary ruptures would be assigned to the same event depends on the precision of the dating methods and the interpretation of the individual researcher. Reference [
7] have shown in the Suusamyr case, this may indeed be challenging. Another possibility would be that, due to the unusual offset-to-length ratio of the eastern primary surface ruptures, they are not even identified as such, but attributed to other effects, such as being a landslide toe or being a terrace riser. Paleoseismological trenching could help to solve this problem. However, in the case of false attribution, there would be no intensity ESI = XI in this area. The clustering of landslides and secondary cracks could probably be ascribed to topography and preservation effects, and the epicenter of the earthquake would be located further to the west near the western surface ruptures.
4.3. The Problem of Strong Aftershocks
A significant source of uncertainty in the ESI2007 assignment is related to the three strong aftershocks that occurred within two hours of the main event. These earthquakes had magnitudes of M
S6.6, M
S6.6, and mb6.0, and they occurred west of the Aramsu Range [
18], although their mechanism and location are not well constrained. Given their magnitudes, they may have even caused the western primary surface ruptures [
7] or at least contributed to their total lengths. The same holds true for the secondary effects. There is virtually no possibility to distinguish between the effects of the main shock and those of the three strong aftershocks. The earthquakes occurred so close in time, and in such a sparsely populated region, that there are no eyewitness accounts that could help to solve this problem. Perhaps the shape of the isoseismals with the highest intensities could support the interpretation of a combined effect of the main shock and the aftershocks, but we will most likely never know.
This problem usually arises in paleoseismology, when due to the limits of Quaternary dating methods, it is impossible to distinguish between one strong earthquake and two smaller ones, or similar combinations. However, the Suusamyr case illustrates that even for modern events this may be an issue, especially in sparsely populated regions and when significant aftershocks occur right after the main shock before any documentation of the earthquake effects has been undertaken.
4.4. Lessons for ESI2007 Assignments
The peculiar primary surface rupture pattern of the Suusamyr Earthquake poses a problem for ESI2007 assignments as discussed above. Thanks to the widespread secondary effects, we were able to produce an intensity map that relies on a large number of observations. If only information on the primary surface ruptures were available, for example from a similar paleo-earthquake, the picture would look different. This is important from a paleoseismological point of view. For many, if not most pre-historic earthquakes, only data on the primary surface ruptures are derived from field mapping and/or trenching studies. Reference [
7] have shown that this may be misleading in the Suusamyr Basin. Another example is the M
W6.6 1998 Fandoqa Earthquake that occurred on the Gowk Fault in Iran [
35]. This earthquake re-ruptured a section of the fault that had already ruptured in an M
W7.1 earthquake in 1981. Primary surface ruptures were observed in both cases, but the offsets caused by the smaller earthquake were several times larger than those of the stronger event. Reference [
35] report that the two earthquakes ruptured the fault at different depths and rightly emphasized the problem this causes for paleoseismological studies in similar settings.
Similarly, complex primary surface ruptures from paleo-earthquakes may not be entirely understood and, therefore, lead to a wrong ESI2007 assignment [
36]. Modern examples of such complex primary surface ruptures are among others the 1889 Chilik Earthquake [
37], the 1911 Chon Kemin Earthquake [
38], the 2010 El Mayor Cucapah Earthquake [
39], and the 2016 Kaikoura Earthquake [
5].
Modern earthquake ruptures can be studied extensively in the field [
40], using seismological methods, and with (space) geodesy [
41]. Their secondary effects can also be documented in great detail. Most studies of paleo-earthquakes, however, mainly focus on the primary surface ruptures, because this is often the only definitively seismogenic evidence left in the landscape. Notwithstanding, with the Suusamyr example in mind, we emphasize the importance of collecting as much information on the environmental effects of such earthquakes as possible.
Unfortunately, secondary effects may also be problematic for intensity assessment. The Belaldy rock avalanche formed a landslide lake which burst ten months after the Suusamyr Earthquake in June 1993. Triggered by snowmelt, a debris flow mainly incorporating material from the 1992 landslides reached and damaged the village of Torkent 30 km downstream [
22,
42]. Such phenomena may be easily confused with coseismic effects. In case of the Suusamyr Earthquake, the mud eruption sites that we visited a few years after the earthquake were virtually indistinguishable from ordinary landslides. Not only will they be interpreted as such in the case of a paleo-earthquake, but mud eruptions may also happen in any future landslide without a seismic trigger. From a paleoseismological perspective, temporal clustering of earthquake environmental effects can help to identify seismic events, but as can be seen from the 1998 Fandoqa Earthquake [
35] or the Central Italy earthquake series [
43], earthquakes can occur very close in time on the same fault, which is beyond the resolution limit of any Quaternary dating method (perhaps excluding varves).
5. Conclusions
We have compiled an ESI2007 intensity map of the 1992 Suusamyr Earthquake based on earthquake environmental effects only. This assignment was based on published data on primary and secondary earthquake effects, and in our field mapping. The ESI2007 intensity distribution is roughly comparable to the MM and MSK intensities reported, although we note important differences mainly in the shape of the isoseismals (
Figure 6), but also in the area they encompass (
Table 1). One major advantage of the ESI2007 scale is that it allows incorporating data from uninhabited areas, which led to a shift to the south of the overall intensity pattern.
Due to the peculiar pattern of 1992 primary surface ruptures, the assignment of ESI2007 intensities to these effects is not straight forward and allows different approaches. Depending on the input data used, the resulting ESI2007 intensities vary significantly. When combined with the secondary effects of the earthquake, however, a coherent picture emerges.
We show that this may not be the case when dealing with a paleo-earthquake of similar characteristics. The unusual offset-to-length ratio of the eastern primary surface ruptures and the gap between the western and eastern primary surface ruptures are prone to false or simplified interpretations which may hamper the correct assignment of ESI2007 intensities. This is especially important as the secondary effects, such as gravitational cracks and mass movements are likely to be short-living features that could also happen without a seismic trigger. The eastern primary surface ruptures occurred in a river bed and are also likely to be eroded within a relatively short time span. Thus, a paleo-earthquake that resembles the 1992 event will likely be described incompletely with the ESI2007 scale. This is an important lesson for the application of this scale to paleo-earthquakes in similar environments, and to events with a complex or anomalous primary surface rupture pattern.

 ,
, 


