Gibbs Free Energy of Formation for Selected Platinum Group Minerals (PGM)


Abstract
:
1. Introduction
2. Methodology

| Mineral | Literature Data | Ref. | |||||
|---|---|---|---|---|---|---|---|
| Formula | Name | ΔfG° | ΔfG° | ΔfH° | S° | Cp | |
| kJ/mol | kJ/mol | kJ/mol | J/mol·K | J/mol·K | |||
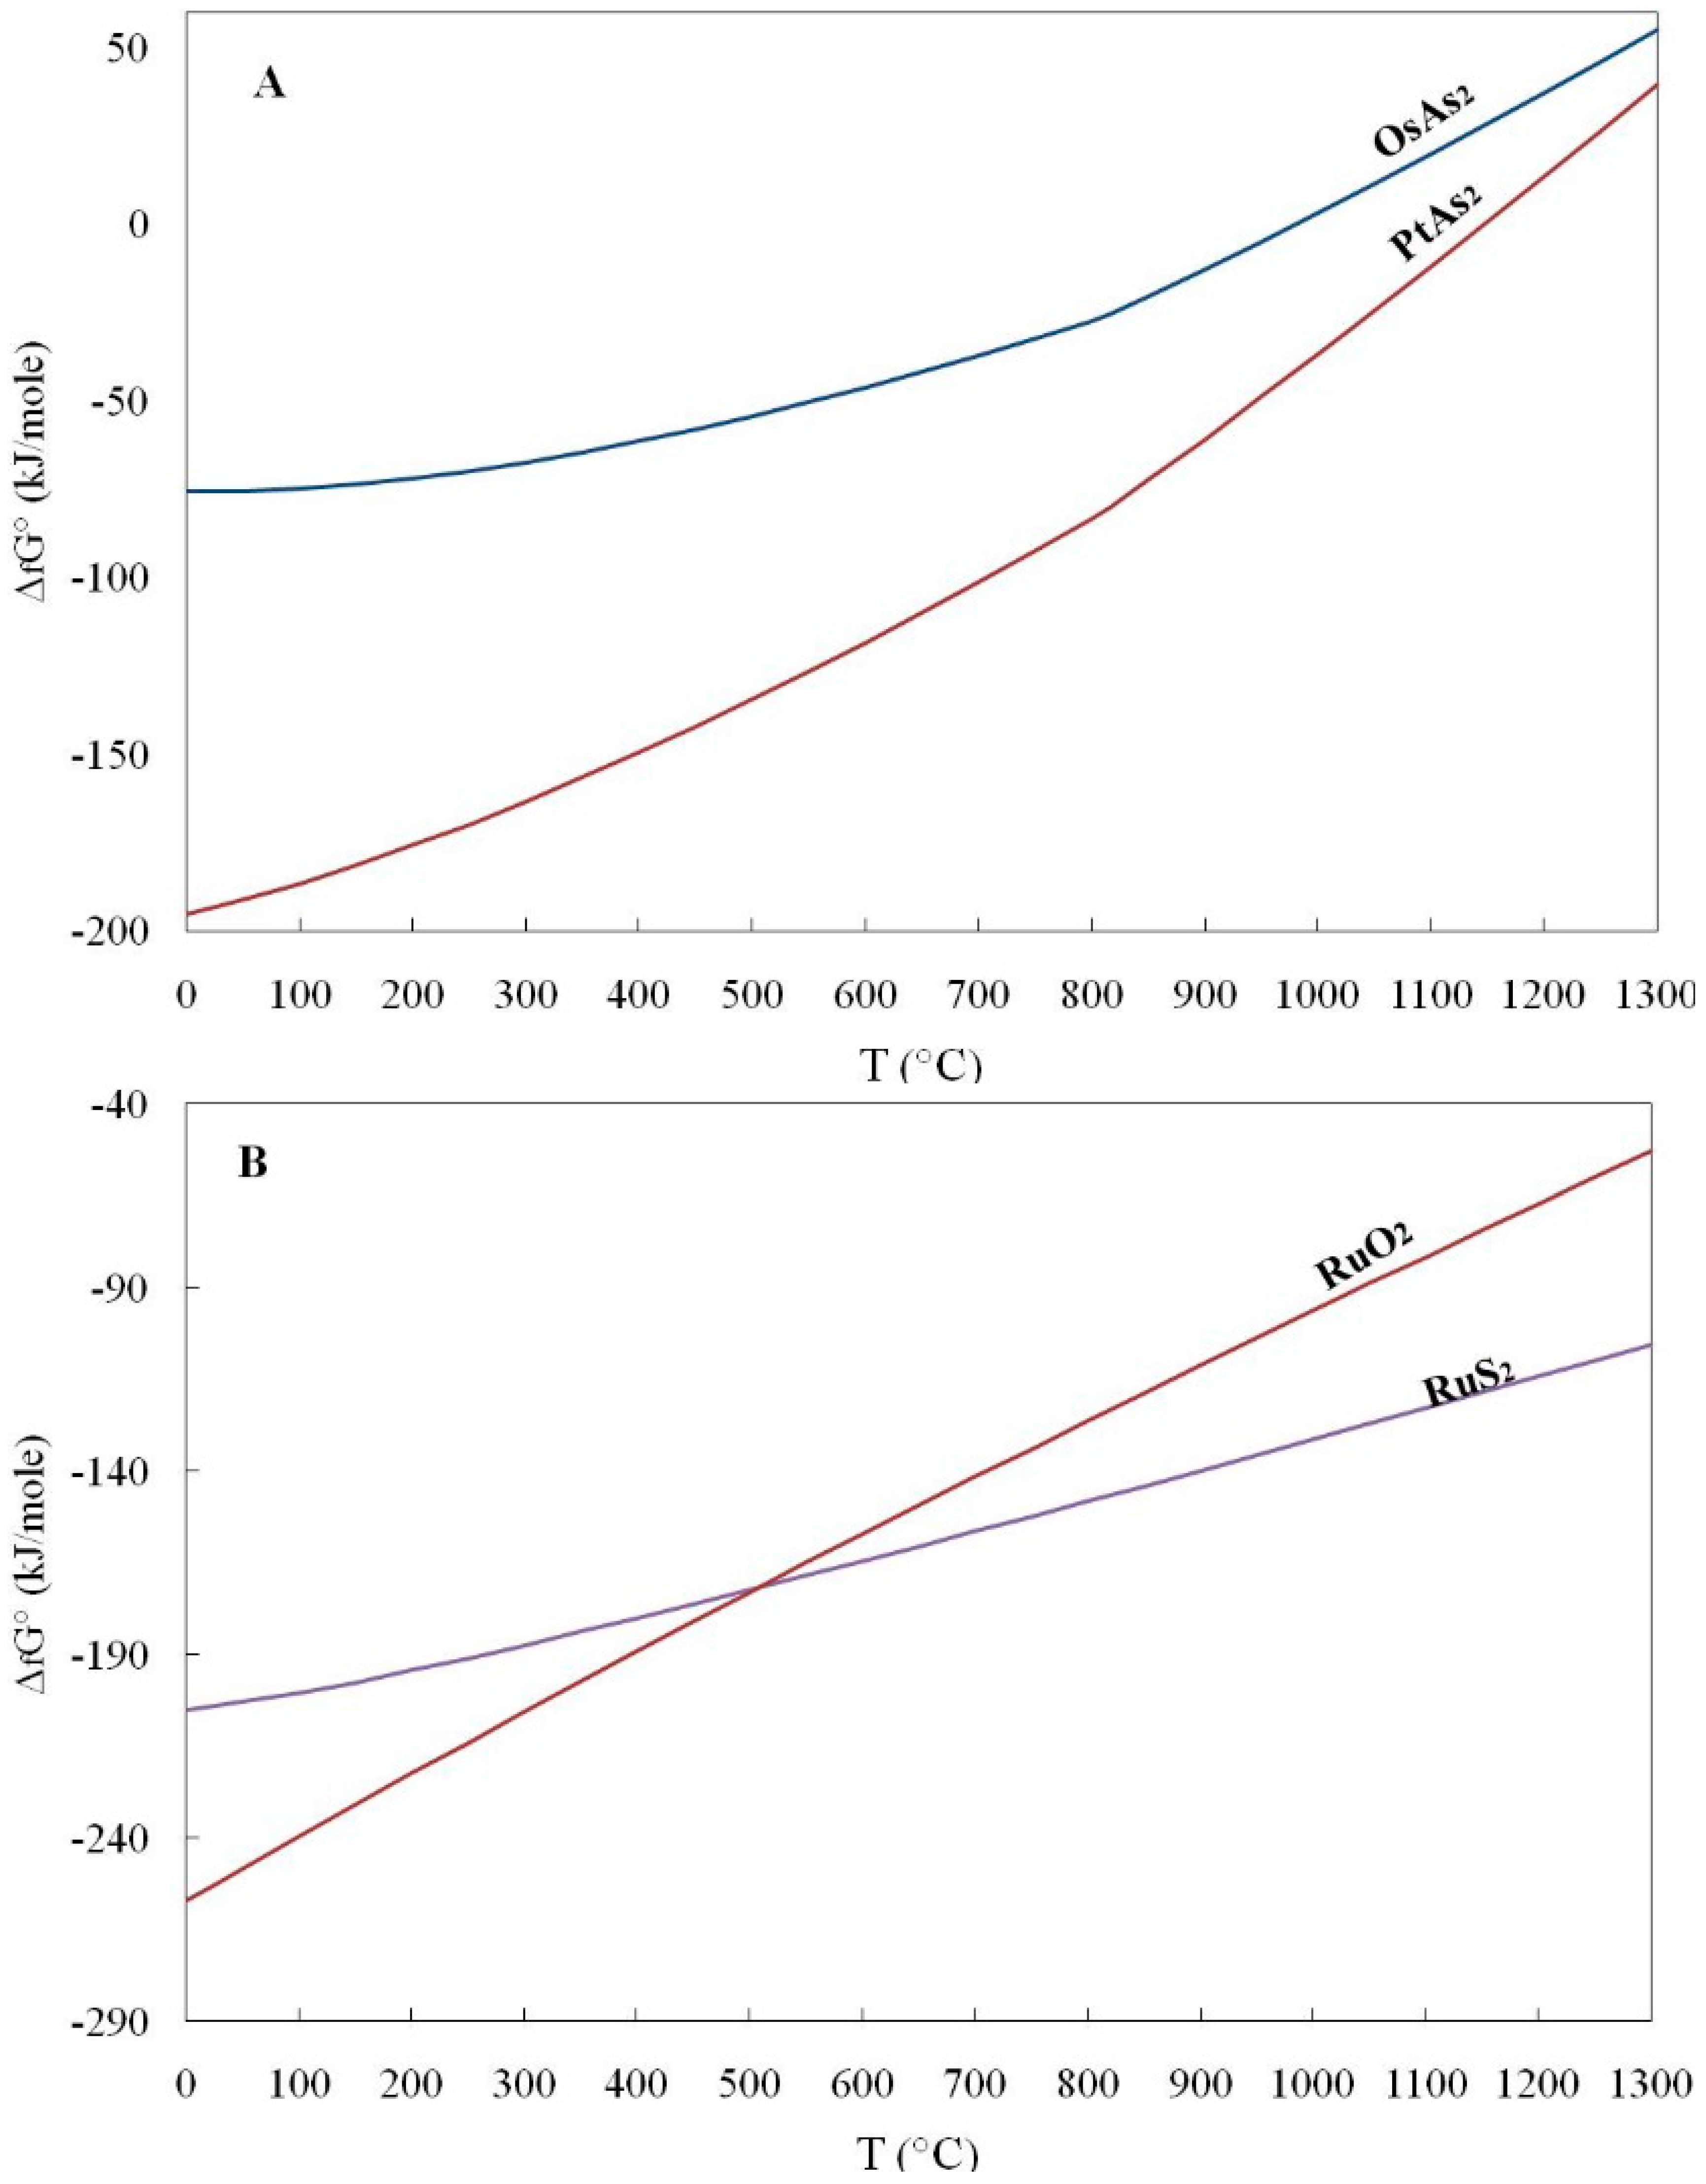
| RuS2 | Laurite | −204.1 | −188.1 | −199.2 | 55.2 | 66.46 | [22,23] |
| OsS2 | Erlichmanite | −135.1 | −134.1 | −146.9 | 54.8 | -- | [21] |
| IrS2 | Unnamed iridium disulfide | −123.9 | −131.8 | −143.1 | 72.8 | -- | [21] |
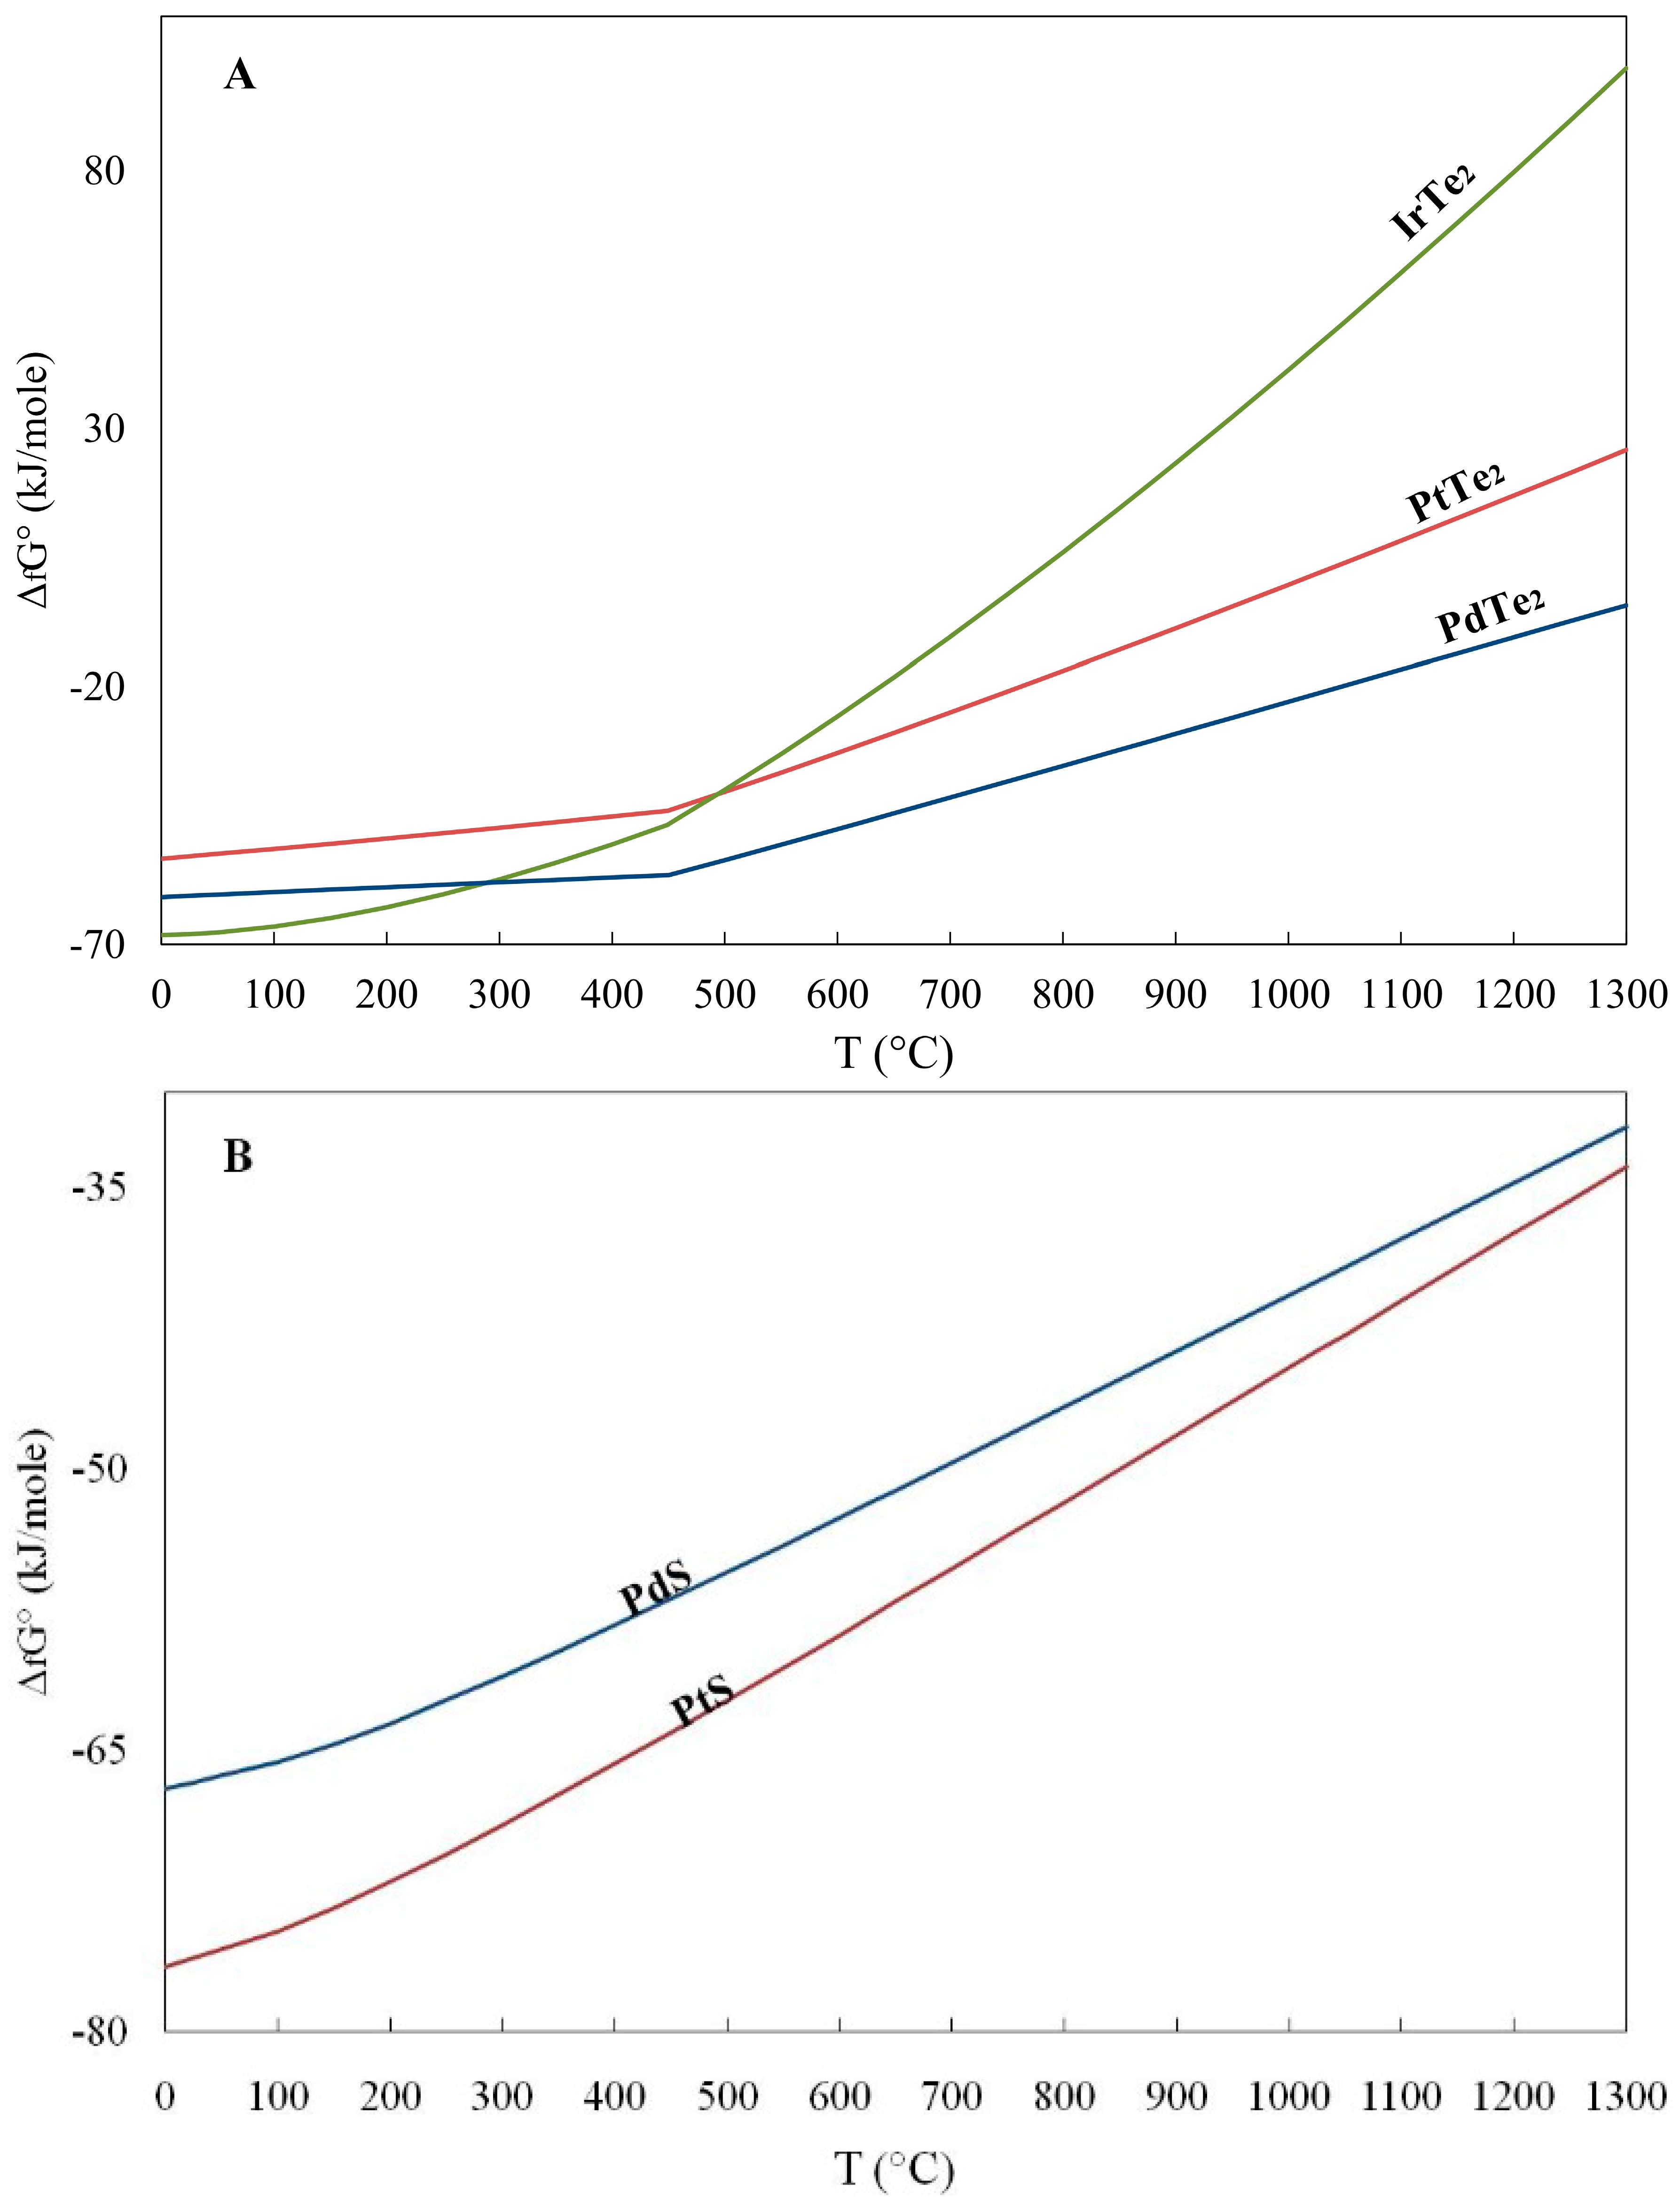
| IrTe2 | Shuangfengite | −68.0 | -- | −71.13 | 123.43 | -- | [35] |
| PtTe2 | Moncheite | −52.9 | −52.33 | −58.19 | 120.95 | 75.09 | [24,35] |
| PdTe2 | Merenskyite | −60.6 | −47.36 | −50.40 | 126.67 | 76.30 | [24,35] |
| Ir2S3 | Kashinite | −196.4 | −220.5 | −241.4 | 97.1 | -- | [21] |
| PtS | Cooperite | −76.1 | −76.22 | −81.79 | 54.87 | 48.17 | [24] |
| PdS | Vysotskite | −66.7 | −72.25 | −70.87 | 57.63 | 48.66 | [24] |
| OsAs2 | Omeiite | −75.8 | -- | −76.57 | 101.32 | -- | [35] |
| PtAs2 | Sperrylite | −193.4 | -- | −217.57 | 31.928 | -- | [35] |
| Rh2S3 | Bowieite | −252.4 | -- | −262.47 | 125.52 | -- | [35] |
| RuO2 | Ru-oxide | −252.7 | -- | −305.01 | 58.158 | -- | [35] |


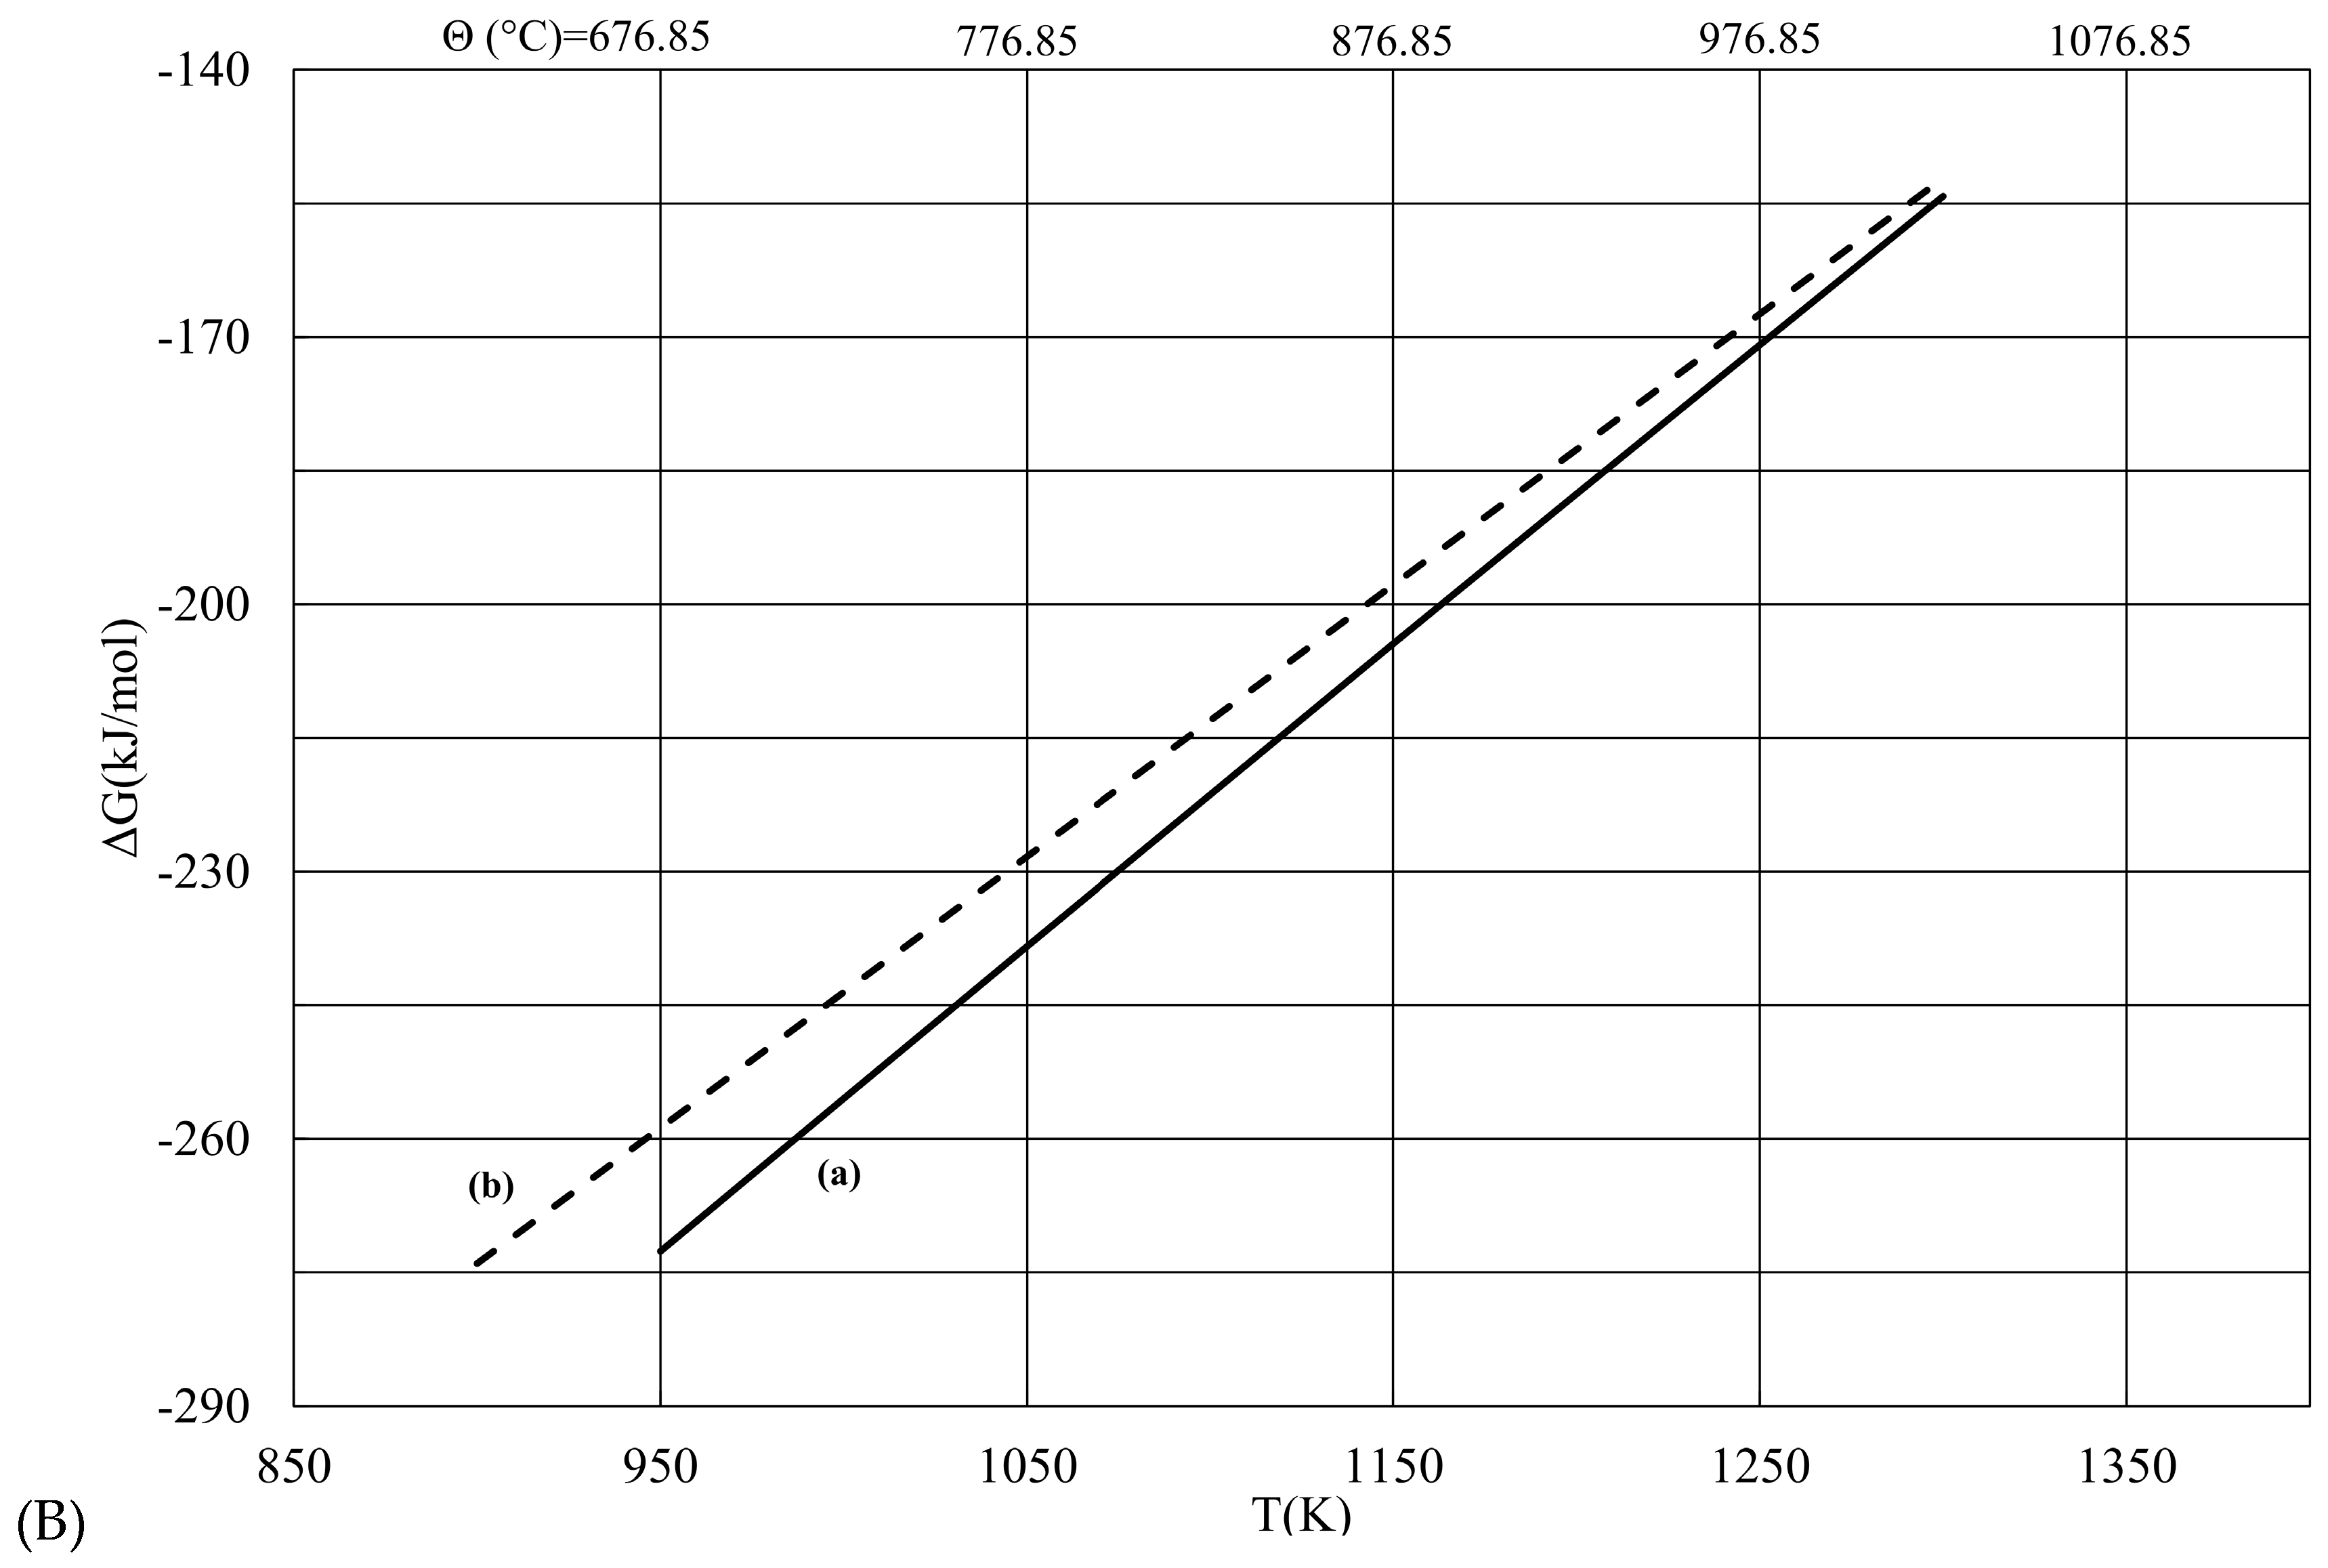
| T (K) | ΔG (a) (kJ/mol) | ΔG (b) (kJ/mol) | |ΔG (b) − ΔG (a)| |
|---|---|---|---|
| 900 | −289.89 | −273.98 | 15.92 |
| 950 | −272.63 | −258.75 | 13.88 |
| 1000 | −255.46 | −243.53 | 11.93 |
| 1050 | −238.37 | −228.3 | 10.07 |
| 1100 | −221.37 | −213.08 | 8.29 |
| 1150 | −204.46 | −197.85 | 6.60 |
| 1200 | −187.62 | −182.63 | 5.00 |
| 1250 | −170.88 | −167.4 | 3.48 |
| 1300 | −154.22 | −152.18 | 2.04 |
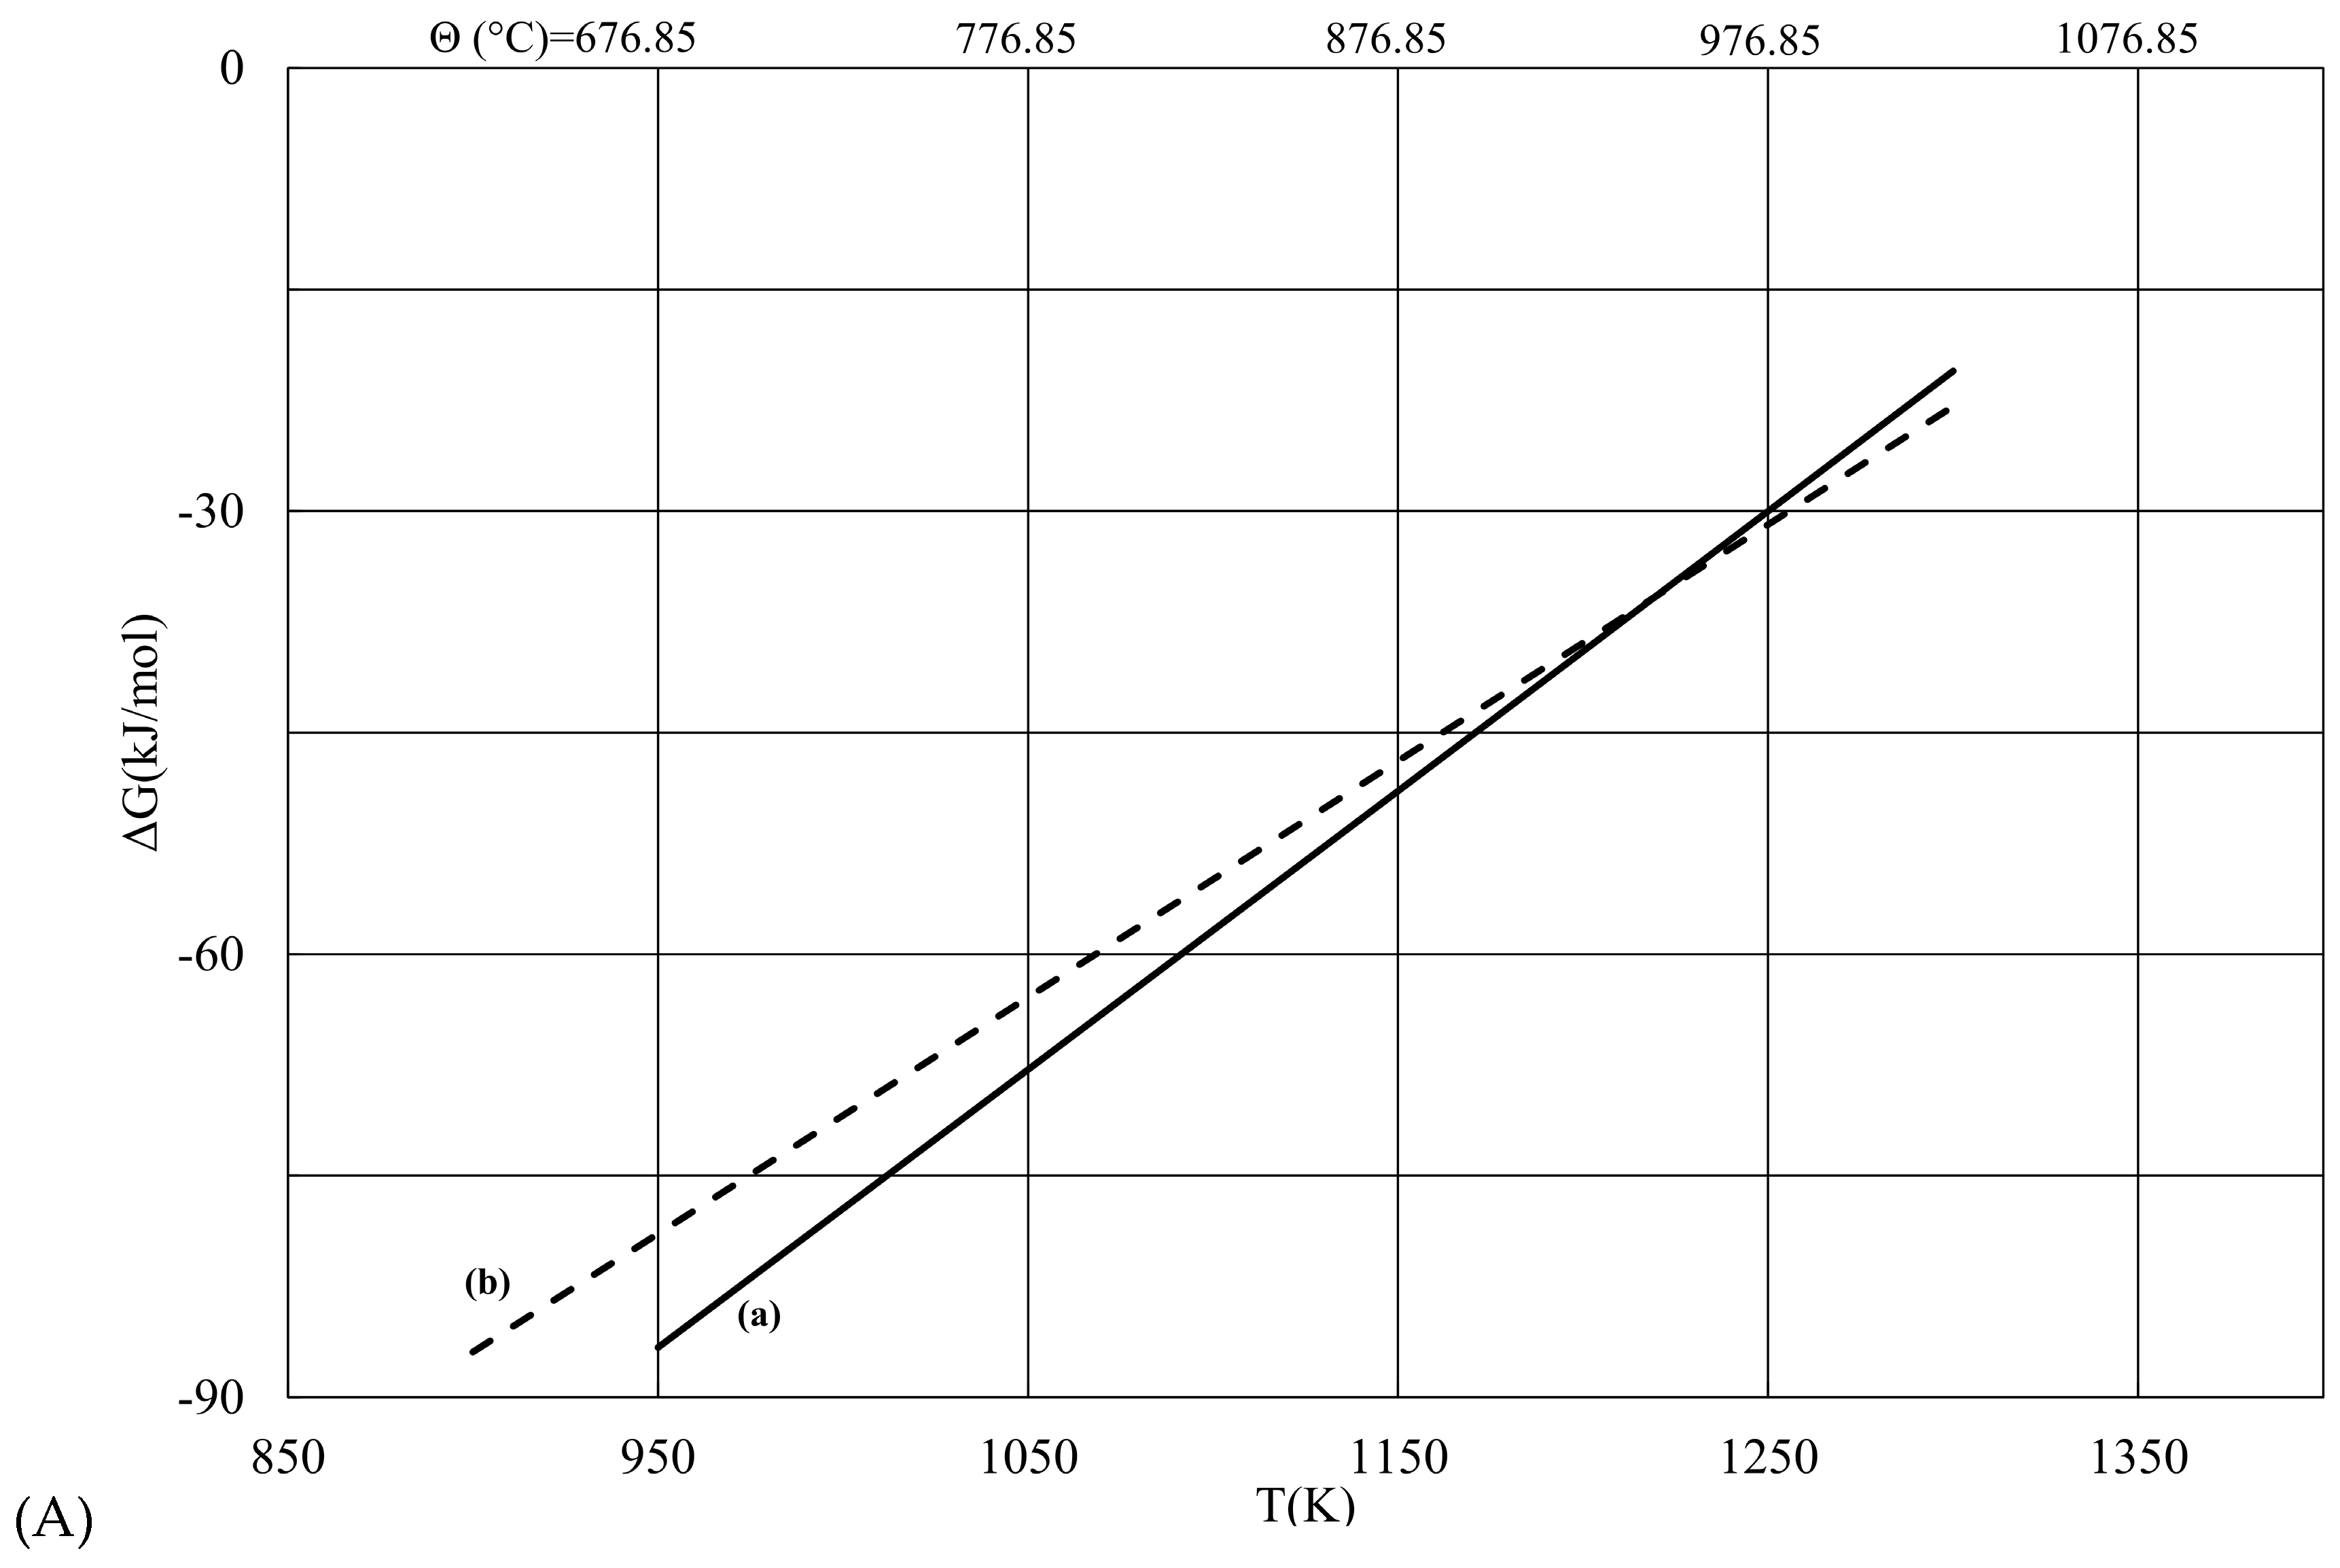
| T (K) | ΔG (a) (kJ/mol) | ΔG (b) (kJ/mol) | |ΔG (b) − ΔG (a)| |
|---|---|---|---|
| 900 | −96.016 | −86.93 | 9.086 |
| 950 | −86.619 | −78.929 | 7.691 |
| 1000 | −77.219 | −70.927 | 6.292 |
| 1050 | −67.812 | −62.926 | 4.887 |
| 1100 | −58.392 | −54.924 | 3.468 |
| 1150 | −48.956 | −46.923 | 2.034 |
| 1200 | −39.499 | −38.921 | 0.578 |
| 1250 | −30.018 | −30.920 | 0.901 |
| 1300 | −20.509 | −22.918 | 2.409 |
3. Calculated Change of the Gibbs Free Energy (ΔfG°)

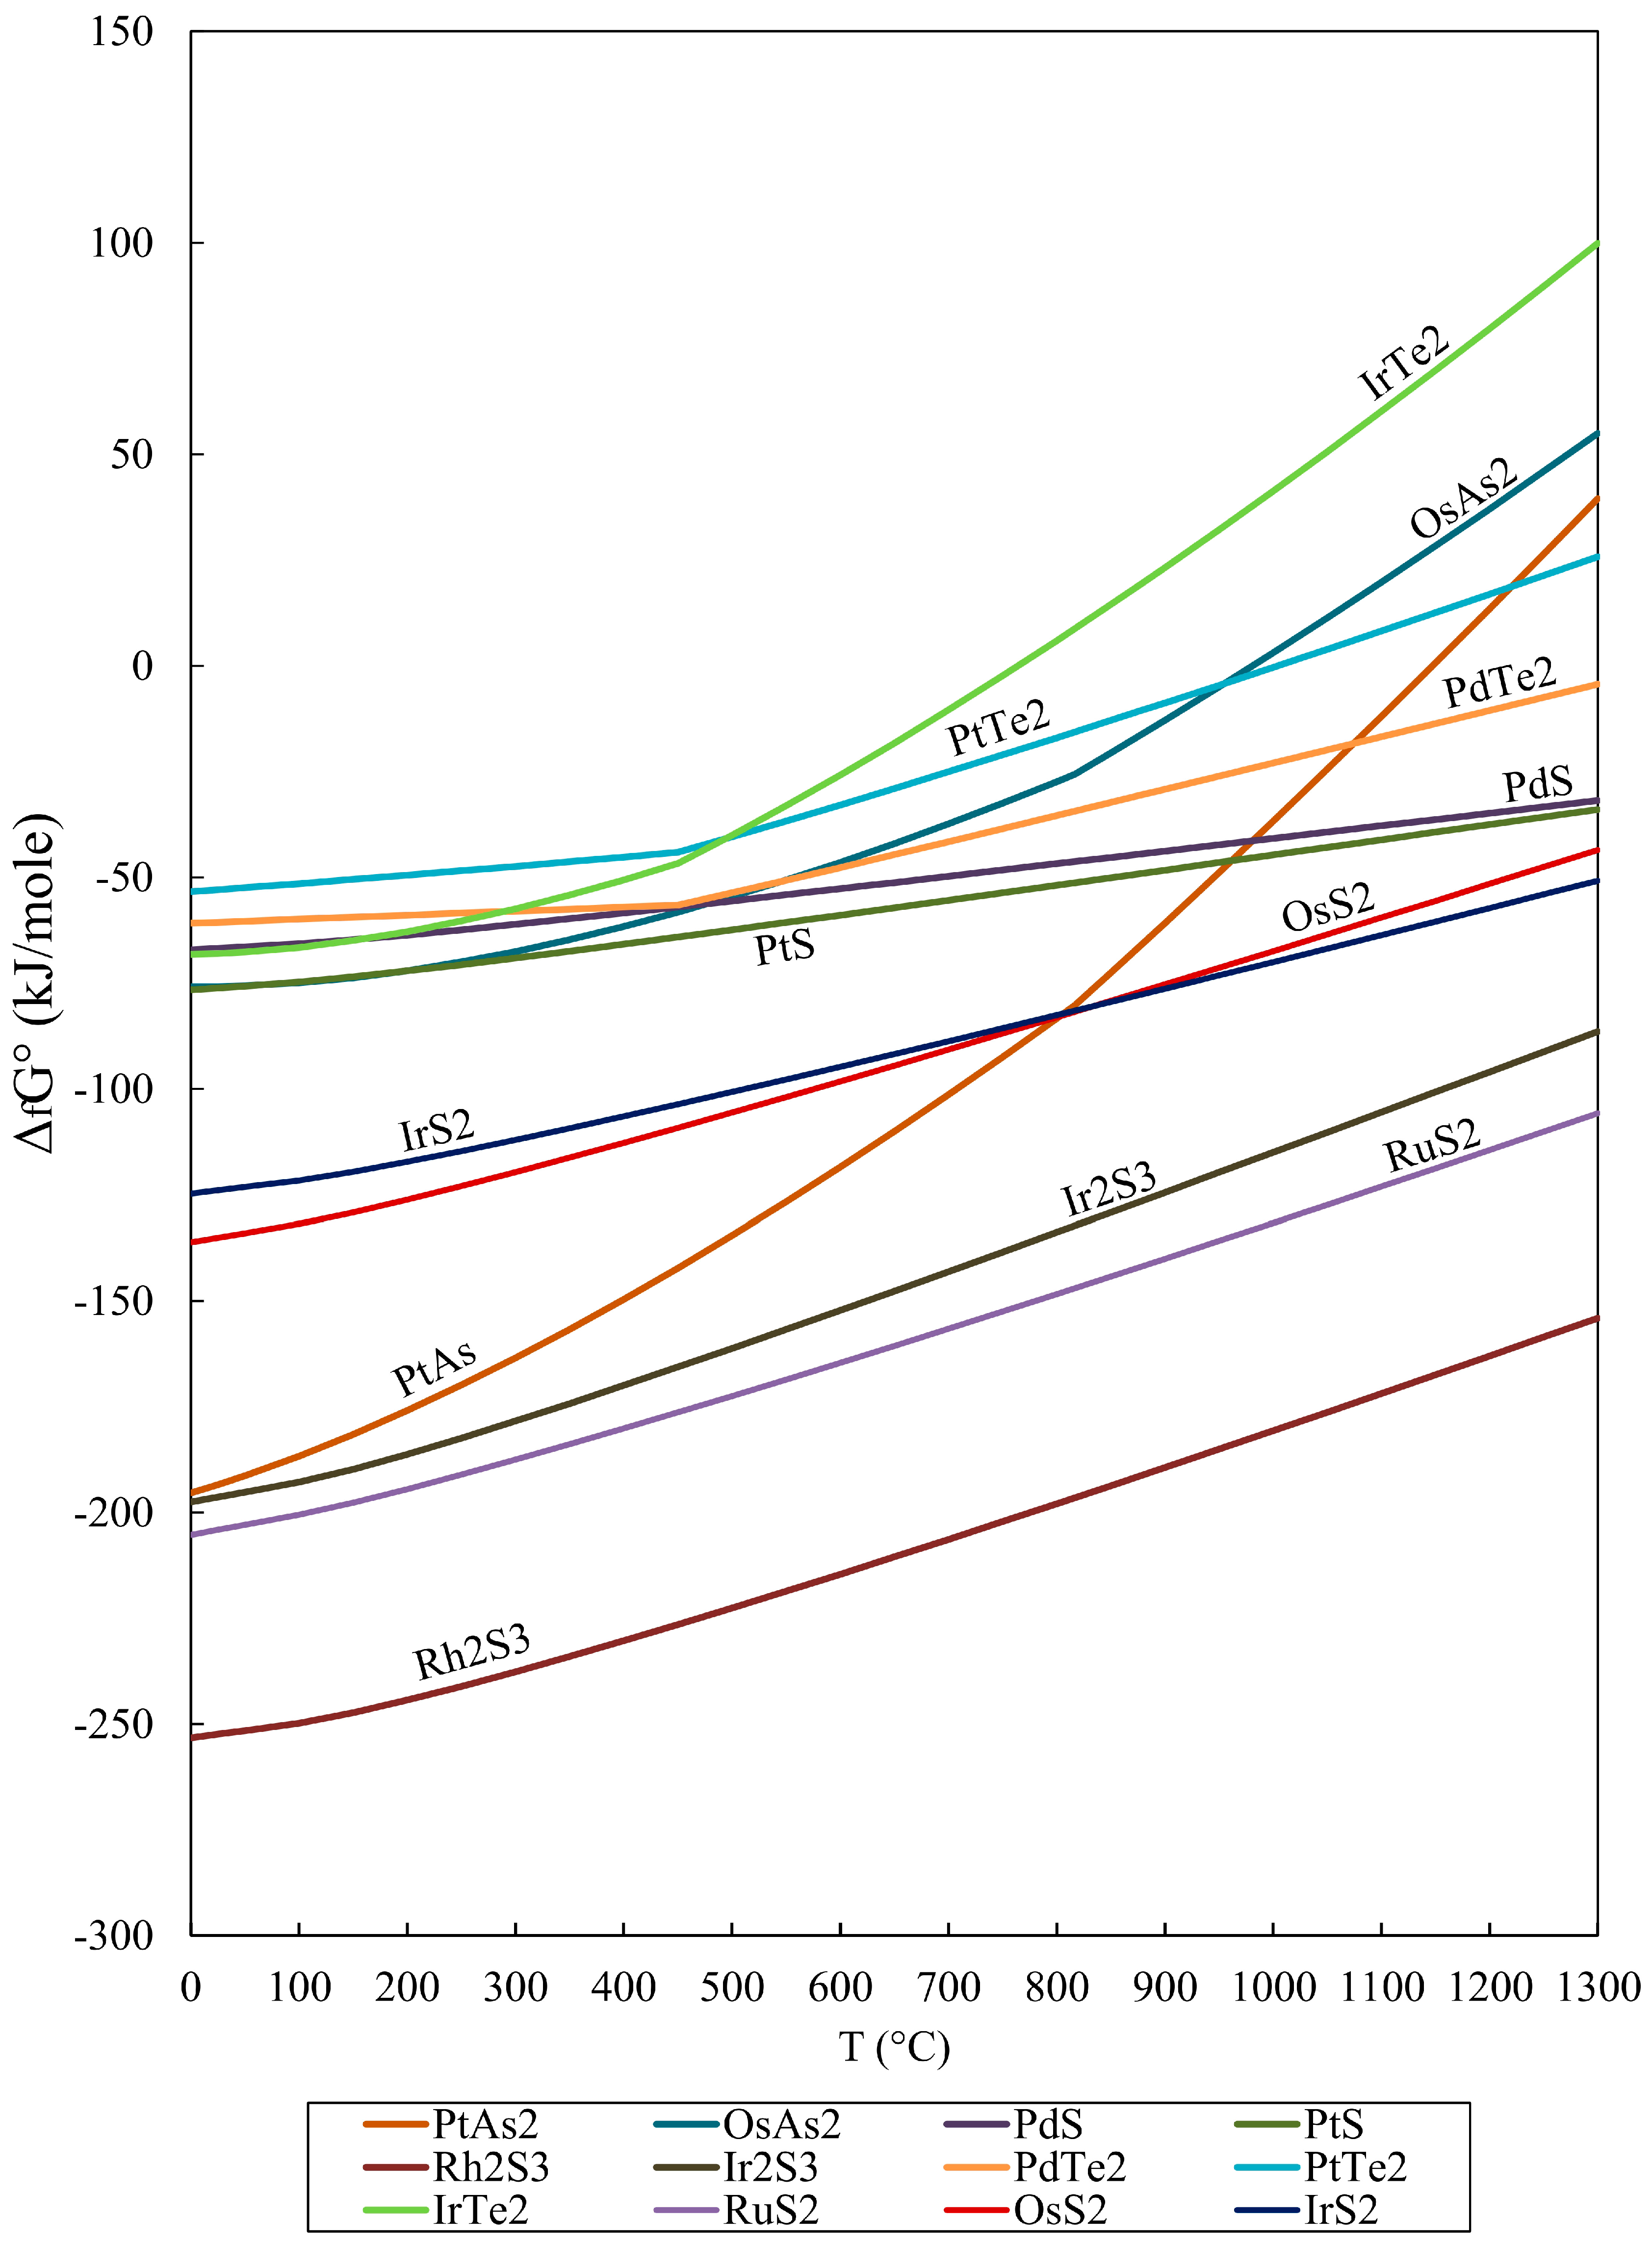
| T (°C) | RuS2 | OsS2 | IrS2 | IrTe2 | PtTe2 | PdTe2 | Ir2S3 | Rh2S3 | PtS | PdS | OsAs2 | PtAs2 | RuO2 |
|---|---|---|---|---|---|---|---|---|---|---|---|---|---|
| 25 | −204.1 | −135.1 | −123.9 | −68.0 | −52.9 | −60.6 | −196.4 | −252.4 | −76.1 | −66.7 | −75.76 | −193.4 | −252.7 |
| 50 | −202.9 | −134.0 | −123.2 | −67.7 | −52.4 | −60.3 | −195.2 | −251.5 | −75.7 | −66.4 | −75.6 | −191.3 | −248.3 |
| 100 | −200.5 | −131.8 | −121.6 | −66.5 | −51.4 | −59.9 | −192.8 | −249.8 | −74.7 | −65.6 | −74.9 | −186.7 | −239.5 |
| 150 | −197.7 | −129.1 | −119.6 | −64.9 | −50.5 | −59.4 | −189.8 | −247.3 | −73.5 | −64.7 | −73.7 | −181.5 | −230.9 |
| 200 | −194.5 | −126.2 | −117.2 | −62.8 | −49.4 | −58.9 | −186.2 | −244.3 | −72.1 | −63.6 | −72.0 | −175.9 | −222.3 |
| 250 | −191.1 | −123.0 | −114.7 | −60.3 | −48.4 | −58.4 | −182.4 | −241.1 | −70.6 | −62.4 | −70.0 | −169.9 | −213.9 |
| 300 | −187.5 | −119.7 | −112.0 | −57.4 | −47.4 | −57.9 | −178.4 | −237.6 | −69.0 | −61.1 | −67.5 | −163.5 | −205.5 |
| 350 | −183.9 | −116.2 | −109.3 | −54.2 | −46.3 | −57.5 | −174.2 | −234.0 | −67.5 | −59.8 | −64.7 | −156.7 | −197.2 |
| 400 | −180.1 | −112.7 | −106.5 | −50.6 | −45.2 | −57.0 | −170.0 | −230.3 | −65.8 | −58.4 | −61.6 | −149.6 | −189.1 |
| 449.5 | -- | -- | -- | −46.7 | −44.1 | −56.6 | -- | -- | -- | -- | -- | -- | -- |
| 450 | −176.3 | −109.2 | −103.6 | −46.7 | −44.0 | −56.5 | −165.6 | −226.5 | −64.1 | −57.0 | −58.2 | −142.2 | −180.9 |
| 500 | −172.5 | −105.6 | −100.7 | −40.0 | −40.4 | −53.6 | −161.2 | −222.6 | −62.4 | −55.5 | −54.3 | −134.6 | −172.9 |
| 550 | −168.6 | −101.9 | −97.8 | −33.1 | −36.7 | −50.7 | −156.7 | −218.6 | −60.7 | −54.1 | −50.6 | −126.7 | −165.0 |
| 600 | −164.6 | −98.2 | −94.8 | −25.8 | −32.8 | −47.6 | −152.2 | −214.6 | −59.0 | −52.7 | −46.4 | −118.4 | −157.1 |
| 626.8 | -- | -- | -- | -- | -- | −46.0 | -- | -- | -- | −51.9 | -- | -- | -- |
| 650 | −160.6 | −94.4 | −91.7 | −18.2 | −29.0 | −44.6 | −147.7 | −210.5 | −57.0 | −51.2 | −42.0 | −110.0 | −149.3 |
| 700 | −156.6 | −90.7 | −88.7 | −10.4 | −25.0 | −41.5 | −143.1 | −206.3 | −55.4 | −49.7 | −37.3 | −101.3 | −141.5 |
| 750 | −152.5 | −86.9 | −85.6 | −2.3 | −21.0 | −38.4 | −138.4 | −202.1 | −53.6 | −48.2 | −32.4 | −92.4 | −133.8 |
| 800 | −148.4 | −83.0 | −82.5 | 6.0 | −17.0 | −35.3 | −133.8 | −197.9 | −51.9 | −46.8 | −27.3 | −83.3 | −126.2 |
| 850 | −144.2 | −79.1 | −79.4 | 14.5 | −12.9 | −32.2 | −129.1 | −193.6 | −50.0 | −45.2 | −20.6 | −72.5 | −118.6 |
| 876.8 | -- | -- | -- | 19.2 | −10.7 | −30.6 | -- | -- | -- | -- | -- | -- | -- |
| 900 | −140.0 | −75.3 | −76.3 | 23.3 | −8.7 | −29.1 | −124.4 | −189.3 | −48.3 | −43.8 | −12.8 | −60.8 | −111.1 |
| 926.8 | -- | -- | −74.6 | 28.1 | -- | -- | −121.9 | −187.0 | -- | -- | -- | -- | -- |
| 950 | −135.8 | −71.3 | −73.1 | 32.2 | −4.5 | −26.0 | −119.7 | −185.0 | −46.5 | −42.3 | −4.9 | −48.8 | −103.6 |
| 1000 | −131.6 | −67.4 | −70.0 | 41.4 | −0.3 | −22.9 | −115.0 | −180.7 | −44.7 | −40.8 | −3.1 | −36.7 | −96.2 |
| 1026.8 | −129.3 | -- | -- | -- | 2.0 | -- | -- | -- | −43.7 | -- | − | −30.1 | −92.3 |
| 1050 | −127.3 | −63.5 | −66.8 | 50.7 | 3.9 | −19.8 | −110.2 | −176.3 | −42.9 | −39.3 | 11.4 | −24.4 | −88.9 |
| 1100 | −123.1 | −59.5 | −63.6 | 60.2 | 8.3 | −16.7 | −105.5 | −171.9 | −41.1 | −37.8 | 19.8 | −11.9 | −81.5 |
| 1150 | −118.8 | −55.5 | −60.4 | 69.9 | 12.6 | −13.6 | −100.7 | −167.4 | −39.3 | −36.3 | 28.4 | 0.7 | −74.3 |
| 1200 | −114.4 | −51.5 | −57.2 | 79.7 | 17.0 | −10.5 | −96.0 | −163.0 | −37.5 | −34.8 | 37.1 | 13.5 | −67.0 |
| 1250 | −110.1 | −47.5 | −54.0 | 89.8 | 21.4 | −7.4 | −91.2 | −158.5 | −35.7 | −33.3 | 46.0 | 26.5 | −59.9 |
| 1300 | −105.7 | −43.5 | −50.8 | 99.9 | 25.8 | −4.3 | −86.4 | −154.0 | −34.0 | −31.8 | 55.0 | 39.6 | −52.7 |


4. Application of (ΔfG) Values to the Origin of PGM

5. Conclusions
- The calculated free energy of formation (ΔGf) for selected PGM were negative values, indicating that these minerals are more stable than the separate elements at standard conditions (the process is spontaneous).
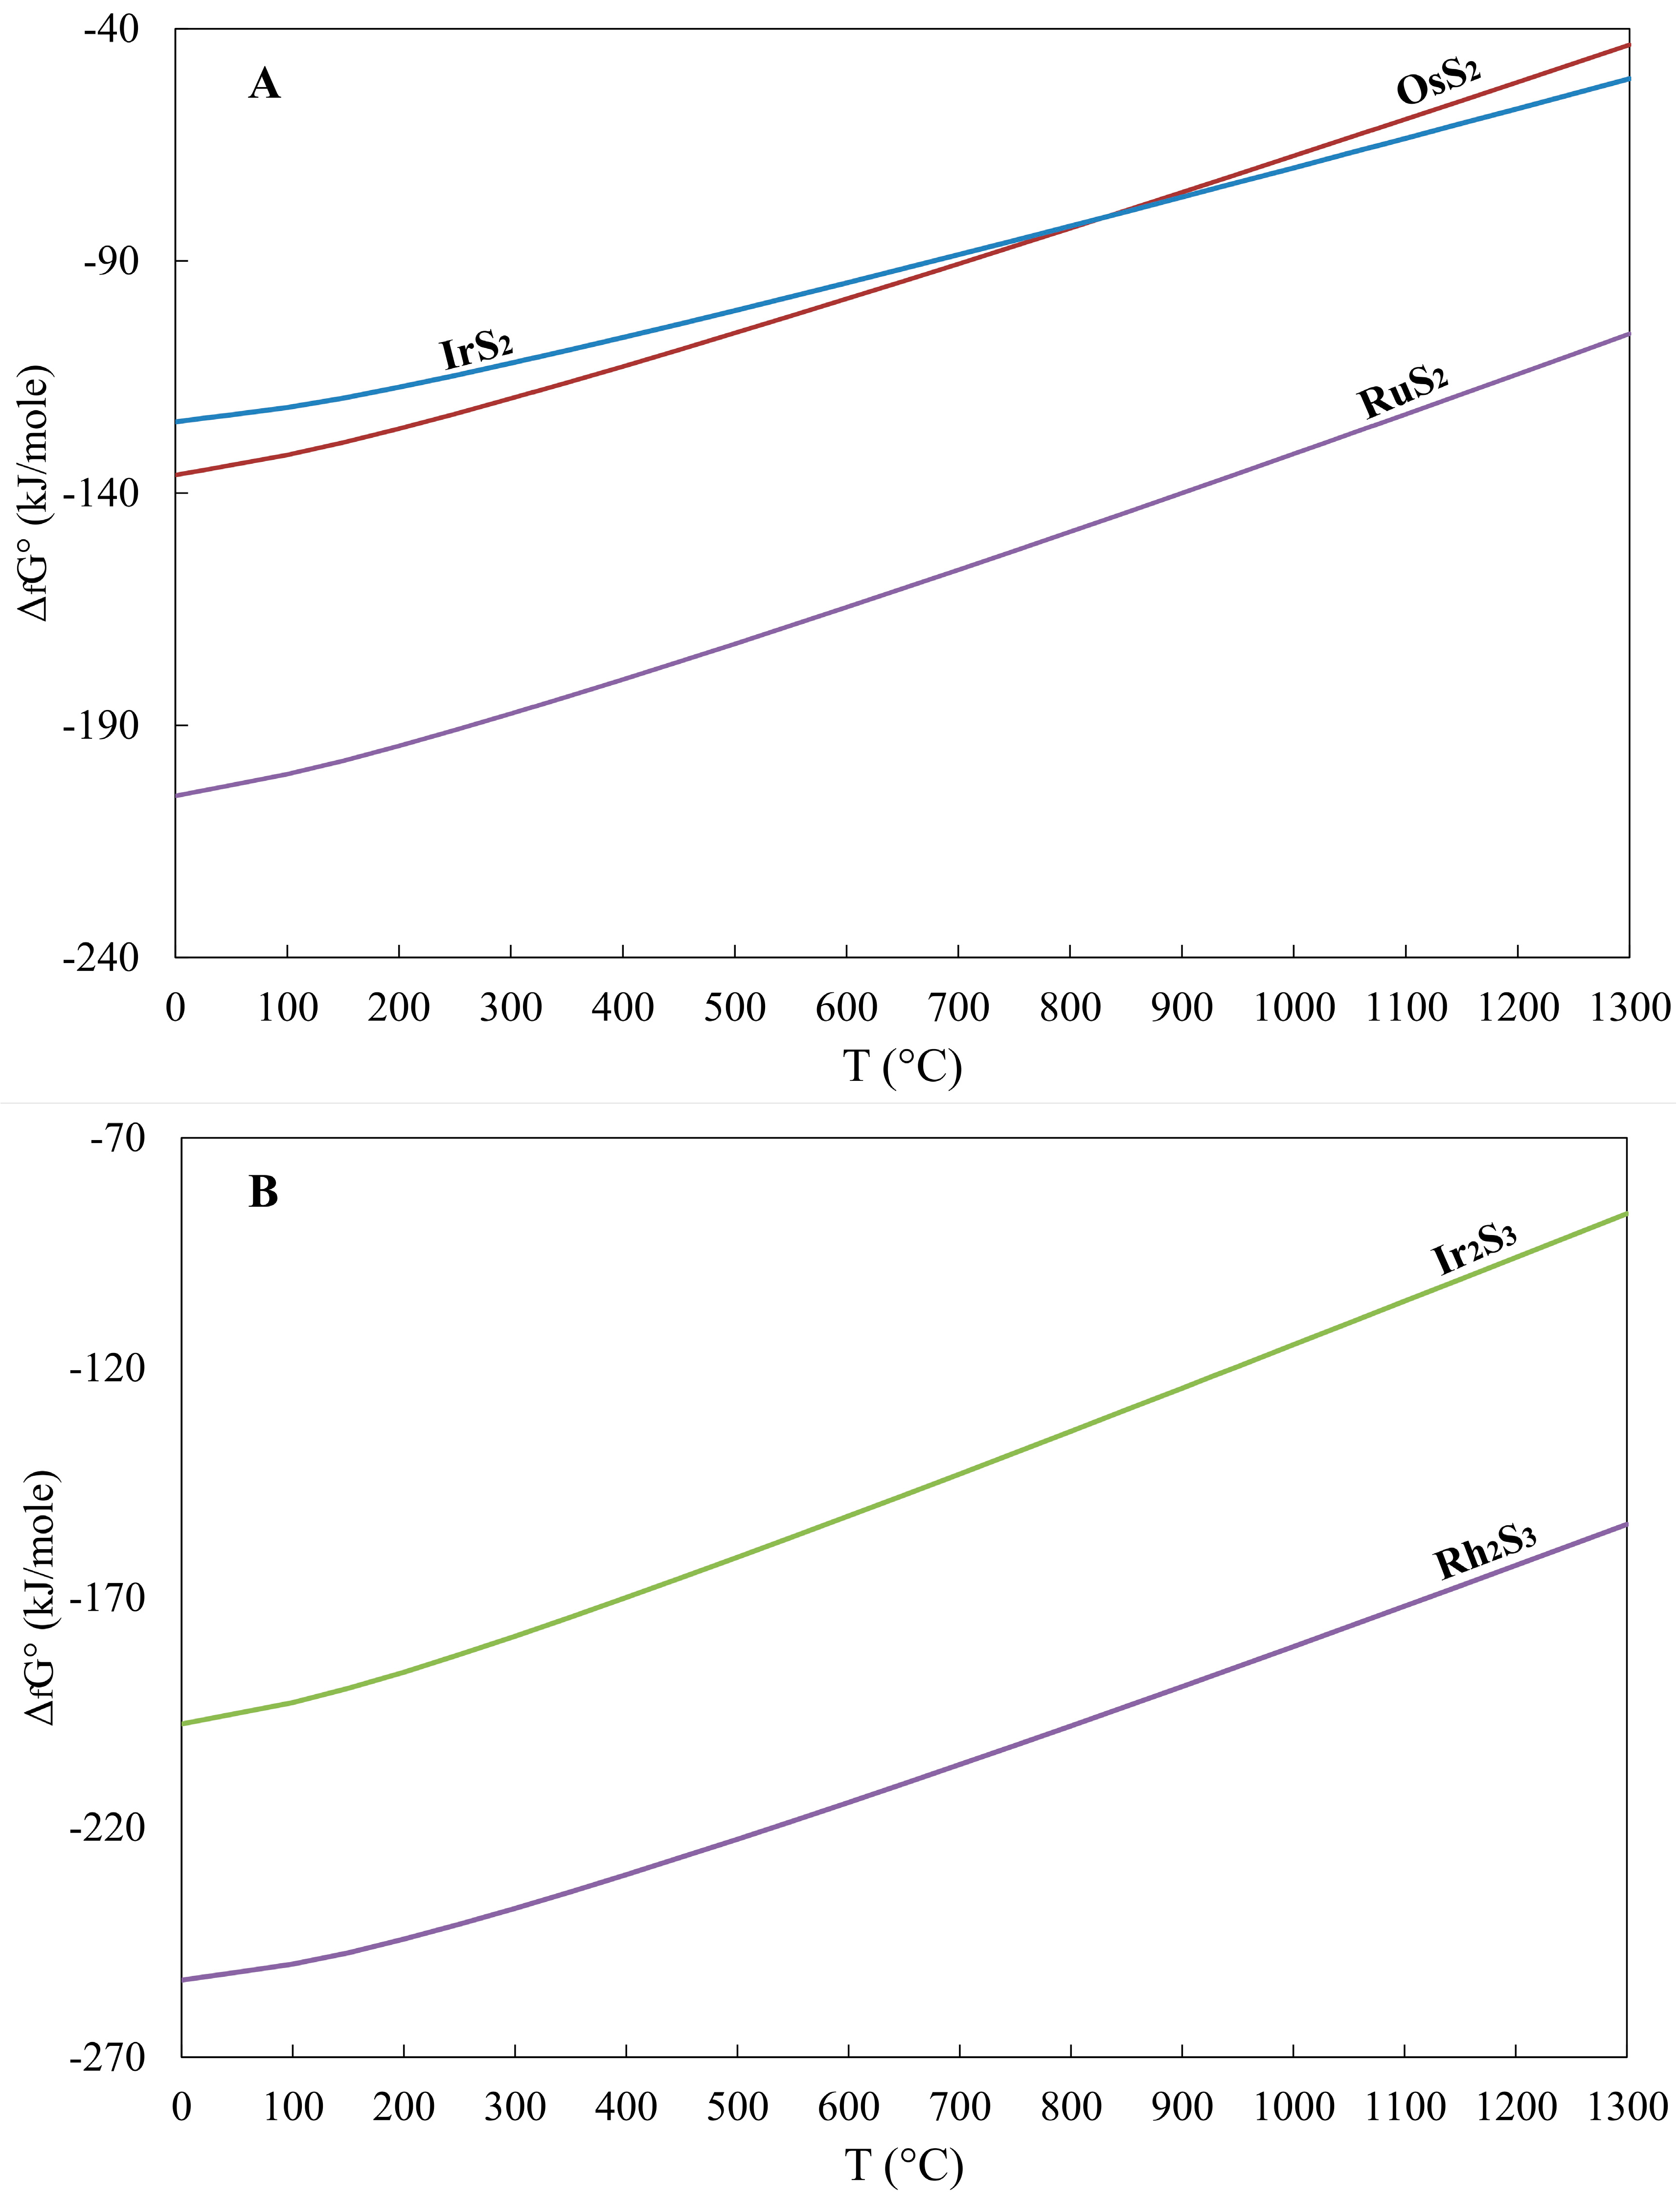
- The calculated Gibbs free energy of formation in the order RuS2 < OsS2 < (Pt, Pd)S < (Pd, Pt)Te2 is increasing from sulfides to tellurides, and they are consistent with their compatibility.
- The evaluation of the accuracy of the method of calculation of the Gibbs free energy of formation using the HSC program was made by comparison with those obtained using a solid-state electrochemical technique by previous authors and was found to be in a good agreement.
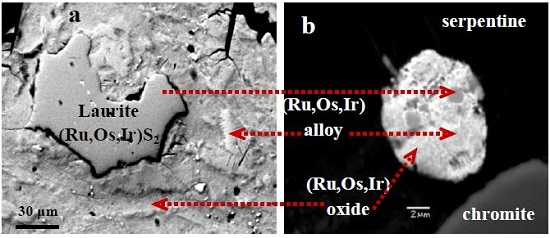
- The lower values of the calculated Gibbs free energy of formation (ΔG°f) for the oxide RuO2 compared to that for RuS2 at temperatures lower than 500 °C are consistent with the observed transformation of laurite to oxides/hydroxides at relatively low temperatures.
- Although much more experimental work is required, the compilation of preliminary Gibbs free energy values with geological, mineralogical data and phase relations in natural systems suggests that a thermodynamic approach on PGM may contribute to the better understanding of the PGM thermodynamic behavior and PGE mineralization.
Acknowledgments
Author Contributions
Conflicts of Interest
References
- Barnes, S.-J.; Picard, C.P. The behaviour of platinum-group elements during partial melting, crystal fractionation, and sulphide segregation: An example from the Cape Smith Fold Belt, northern Quebec. Geochim. Cosmochim. Acta 2013, 57, 59–87. [Google Scholar]
- Economou-Eliopoulos, M. Platinum-group element distribution in chromite ores from ophiolite complexes: Implications for their exploration. Ore Geol. Rev. 1996, 11, 363–381. [Google Scholar] [CrossRef]
- Prichard, H.; Economou-Eliopoulos, M.; Fisher, P.C. Platinum-group minerals in podiformchromitite in the Pindos ophiolite complex, Greece. Can. Mineral. 2008, 46, 329–341. [Google Scholar] [CrossRef]
- Garuti, G.; Zaccarini, F.; Economou-Eliopoulos, M. Paragenesis and composition of laurite from chromitites of Othrys(Greece): Implications for Os-Ru fractionation in ophiolitic upper mantle of the Balkan peninsula. Mineral. Depos. 1999, 34, 312–319. [Google Scholar] [CrossRef]
- Ohnenstetter, M.; Johan, Z.; Cocherie, A.; Fouillac, A.M.; Guerrot, C.; Ohnenstetter, D.; Chaussidon, M.; Rouer, O.; Makovicky, E.; Makovicky, M.; et al. New exploration methods for platinum and rhodium deposits poor in base-metal sulphides—NEXTRIM. Trans. Inst. Min. Metall. Sect. B Appl. Earth Sci. 1999, 108, B119–B150. [Google Scholar]
- Hattori, K.H.; Cabri, L.J.; Johanson, B.; Zientek, M.L. Origin of placer laurite from Borneo: Se and As contents, and S isotopic compositions. Mineral. Mag. 2004, 68, 353–368. [Google Scholar] [CrossRef]
- Augé, T.; Maurizot, P. Stratiform and alluvial platinum mineralization in the New Caledonia ophiolite complex. Can. Mineral. 1995, 33, 1023–1045. [Google Scholar]
- Brenan, J.M.; Andrews, D. High-temperature stability of laurite and Ru–Os–Ir alloy and their role in PGE fractionation in mafic magmas. Can. Mineral. 2001, 39, 341–360. [Google Scholar] [CrossRef]
- Cabri, L.J. The Geology, Geochemistry, Mineralogy and Mineral Beneficiation of Platinum-Group Elements; Canadian Institute of Mining, Metallurgy and Petroleum: Montreal, QC, Canada, 2002. [Google Scholar]
- Weiser, T.W. Platinum-Group Minerals (PGM) in placer deposits. In The Geology, Geochemistry, Mineralogy and Mineral Beneficiation of Platinum-Group Elements; Cabri, L.J., Ed.; Canadian Institute of Mining, Metallurgy and Petroleum: Montreal, QC, Canada, 2002; pp. 721–756. [Google Scholar]
- Mungall, J.E. Magmatic geochemistry of the platinum-group elements. In Exploration for Platinum-Group Element Deposits; Mineralogical Association of Canada: Quebec, QC, Canada, 2005; pp. 1–34. [Google Scholar]
- Hanley, J.J. The aqueous geochemistry of the Platinum-Group Elements (PGE) in surficial, low-T hydrothermal and high-T magmatic hydrothermal environments. In Exploration for Platinum-Group Element Deposits; Mungall, J.E., Ed.; Mineralogical Association of Canada: Quebec, QC, Canada, 2005; pp. 35–56. [Google Scholar]
- Tsoupas, G.; Economou-Eliopoulos, M. High PGE contents and extremely abundant PGE-minerals hosted in chromitites from the Veriaophiolite complex, northern Greece. Ore Geol. Rev. 2008, 33, 3–19. [Google Scholar] [CrossRef]
- Kapsiotis, A.; Grammatikopoulos, T.A.; Tsikouras, B.; Hatzipanagiotou, K.; Zaccarini, F.; Garuti, G. Chromian Spinel composition and Platinum-group element mineralogy of Chromitites from the Milia area, Pindosophiolite complex, Greece. Can. Mineral. 2009, 47, 1037–1056. [Google Scholar] [CrossRef]
- Prichard, H.M.; Tarkian, M. Platinum and palladium minerals from two PGE-rich localities in the Shetland ophiolite complex. Can. Mineral. 1988, 26, 979–990. [Google Scholar]
- Prichard, H.M.; Neary, C.R.; Fisher, P.C.; O’hara, M.J. PGE-rich Podiform Chromitites in the Al AysOphiolite Complex, Saudi Arabia: An Example of Critical Mantle Melting to Extract and Concentrate PGE. Econ. Geol. 2008, 103, 1507–1529. [Google Scholar] [CrossRef]
- Locmelis, M.; Pearson, N.J.; Barnes, S.J.; Fiorentini, M.L. Ruthenium in Komatiitic Chromite. Geochim. Cosmochim. Acta 2011, 75, 3645–3661. [Google Scholar] [CrossRef]
- Maier, W.D.; Barnes, S.J. Platinum-Group Elements in Silicate Rocks of the Lower, Critical and Main Zones at Union Section, Western Bushveld Complex. J. Petrol. 1999, 40, 1647–1671. [Google Scholar] [CrossRef]
- Melcher, F.; Grum, W.; Simon, G.; Thalhammer, T.V.; Stumpfl, E.F. Petrogenesis of the giant ophiolitic chromite deposits of Kempirsai, Kazakhstan: A study of solid and fluid inclusions in chromite. J. Petrol. 1997, 38, 1419–1458. [Google Scholar] [CrossRef]
- Helmy, H.M.; Ballhaus, C.; Berndt, J.; Bockrath, C.; Wohlgemuth-Ueberwasser, C. Formation of Pt, Pd and Ni tellurides: Experiments in sulfide-telluride systems. Contrib. Mineral. Petrol. 2007, 153, 577–591. [Google Scholar] [CrossRef]
- Westrum, E.F., Jr.; Carlson, H.G.; Gronvold, F.; Kjekshus, A. Low-Temperature Heat Capacitiesand Thermodynamic Functions of some Palladium and Platinum Group Chalcogenides. II. Dichalcogenides; PtS2, PtTe2, and PdTe2. J. Chem. Phys. 1961, 35, 1670–1676. [Google Scholar] [CrossRef]
- Svendsen, S.R. High temperature Enthalpy and Decomposition Pressures of RuS2. Acta Chem. Scand. 1979, 33, 601–607. [Google Scholar] [CrossRef]
- Ezzoula, H.; Heindi, R.; Parson, R.; Tributsch, H. Studies on the stability of RuS2 single crystals and the photo-oxidation of halides. J. Electroanal. Chem. 1984, 165, 155–166. [Google Scholar] [CrossRef]
- Karzhavin, V.K. Sulfides, Selinides and Tellurides of Planinum and Palladium: Estimation of Thermodynamic Properties. Geochem. Int. 2007, 45, 931–937. [Google Scholar] [CrossRef]
- Jacob, K.T.; Gupta, P. Gibbs free energy of formation of rhodium sulfides. J. Chem. Ther. 2014, 70, 39–45. [Google Scholar] [CrossRef]
- Gupta, C.K. Chemical Metallurgy: Principles and Practice; John Wiley and Sons: Weinheim, Germany, 2003. [Google Scholar]
- Powell, R. Equilibrium Thermodynamics in Petrology: An Introduction; Harper & Row: London, UK, 1978. [Google Scholar]
- Cemic, C.L. Thermodynamics in Mineral Sciences: An Introduction; Springer: Berlin, Germany, 2005. [Google Scholar]
- Nordstrom, D.K.; Munoz, J.L. Geochemical Thermodynamics; Blackburn Press: Caldwell, NJ, USA, 2006. [Google Scholar]
- Barin, I. Thermochemical Data of Pure Substances; VCH VerlagsGesellschaft: Weinheim, Germany, 1989. [Google Scholar]
- Barin, I. Thermochemical Data of Pure Substances; Part I and part II; VCH Verlags Gesellschaft: Weinheim, Germany, 1993. [Google Scholar]
- Barin, I.; Knacke, O. Thermochemical Properties of Inorganic Substances; Springer: Berlin, Germany, 1973. [Google Scholar]
- Knacke, O.; Kubaschewski, O.; Hesselman, K. Thermochemical Properties of Inorganic Substances, 2nd ed.; Springer: Berlin, Germany, 1991. [Google Scholar]
- Kubaschewski, O.; Slough, W. Recent Progress in Metallurgical Thermochemistry, 1st ed.; Pergamon Press: Oxford, UK, 1969. [Google Scholar]
- Barin, I.; Knacke, O.; Kubaschewski, O. Thermochemical Properties of Inorganic Substances, Supplement; Springer: Berlin, Germany, 1977. [Google Scholar]
- Dean, J.A. Lange’s Handbook of Chemistry, Thermodynamic Properties; McGraw-Hill: New York, NY, USA, 1992. [Google Scholar]
- Bailey, S.M.; Churney, K.L.; Nuttall, R.L. The NBS tables of chemical thermodynamic properties.Selected values for inorganic and C1 and C2 organic substances in SI units. J. Phys. Chem. Ref. Data 1982, 11, 1–392. [Google Scholar]
- Bockrath, C.; Ballhaus, C.; Holzheid, A. Stabilities of laurite RuS2 and monosulfide liquid solution at magmatic temperature. Chem. Geol. 2004, 208, 265–271. [Google Scholar] [CrossRef]
- Ives, D.J.G. Principles of the Extraction of Metals, Monograph 3; Royal Institute of Chemistry: London, UK, 1960. [Google Scholar]
- Wang, C.X.; Yang, G.W. Thermodynamics of metastable phase nucleation at the nanoscale. Mater. Sci. Eng. 2005, 49, 157–202. [Google Scholar] [CrossRef]
- Kim, W.S.; Chao, G.Y. Phase relations in the system Pt–Sb–Te. Can. Mineral. 1990, 28, 675–685. [Google Scholar]
- Okimoto, H. The Pd–Te System (Palladium-Tellurium). J. Phase Equilib. Diffus. 1992, 34, 72–73. [Google Scholar] [CrossRef]
- Olivotos, S. Thermodynamic Controls on the Formation and Stability of Platinum-Group Elements. Master’s Thesis, University of Athens, Athens, Greece, 31 August 2015. [Google Scholar]
- Tarkian, M.; Stribrny, B. Platinum-group elements in porphyry copper deposits: A reconnaissance study. Mineral. Petrol. 1999, 65, 161–183. [Google Scholar] [CrossRef]
- Eliopoulos, D.G.; Economou-Eliopoulos, M. Platinum-group element and gold contents in the Skouries porphyry-copper deposit, Chalkidiki Peninsula, northern Greece. Econ. Geol. 1991, 86, 740–749. [Google Scholar] [CrossRef]
- Economou-Eliopoulos, M. Platinum-Group Element Potential of Porphyry Deposits; Mineralogical Association of Canada: Quebec, QC, Canada, 2005; pp. 203–245. [Google Scholar]
- Augé, T.; Petrunov, R.; Bailly, L. On the mineralization of the PGE mineralization in the Elastite porphyry Cu-Au deposit, Bulgaria: Comparison with the Baula-Nuasahi Complex, India, and other alkaline PGE-rich porphyries. Can. Mineral. 2005, 43, 1355–1372. [Google Scholar] [CrossRef]
- Garuti, G.; Zaccarini, F. In-situ alteration of platinum-group minerals at low temperature: Evidence from serpentinized and weathered chromitites of the Vourinos complex (Greece). Can. Mineral. 1997, 35, 611–626. [Google Scholar]
- Tolstykh, N.D.; Sidorov, E.G.; Krivenko, A.P. Platinum-group element placers associated with Ural-Alaska type complexes. In Exploration for Platinum-Group Element Deposits; Mineralogical Association of Canada: Quebec, QC, Canada, 2005; pp. 113–143. [Google Scholar]
- Oberthür, T.; Melcher, F.; Buchholz, P.; Locmelis, M. The oxidized ores of the Main Sulphide Zone, Great Dyke, Zimbabwe: Turning resources into minable reserves-mineralogy is the key. J. South. Afr. Inst. Min. Metall. 2013, 113, 191–201. [Google Scholar]
- Bowles, J.F.W.; Gize, A.P.; Vaughan, D.J.; Norris, S.J. Development of platinum-group minerals in laterites-initial comparison of organic and inorganic controls. Trans. Inst. Min. Metall. 1994, 103, B53–B56. [Google Scholar]
- Bowles, J.F.W. The development of platinum-group minerals in laterites. Econ. Geol. 1984, 81, 1278–1285. [Google Scholar] [CrossRef]
- Aiglsperger, T.; Proenza, J.A.; Zaccarini, F.; Lewis, J.F.; Garuti, G.; Labrador, M.; Longo, F. Platinum Group Minerals (PGM) in the Falcondo Ni-laterite deposit, Loma Caribe peridotite (Dominican Republic). Mineral. Depos. 2015, 50, 105–123. [Google Scholar] [CrossRef]
- Van der Weijden, C.H. Cahiers of Geochemistry; Utrecht University: Utrecht, The Netherlands, 2007. [Google Scholar]
- Anderson, D.L. Theory of the Earth; Blackwell Scientific Publications: Boston, MA, USA, 1989. [Google Scholar]
- Toulmin, P.; Barton, P.B. A thermodynamic study of pyrite and pyrrhotite. Geochim. Cosmochim. Acta 1964, 23, 641–671. [Google Scholar] [CrossRef]
- Robie, R.A.; Seal, R.R.; Hemingway, B.S. Heat capacity and entropy of bornite (Cu5FeS4) between 6 and 760 K and the thermodynamic properties of phases in the system Cu–Fe–S. Can. Mineral. 1994, 32, 945–956. [Google Scholar]
© 2016 by the authors; licensee MDPI, Basel, Switzerland. This article is an open access article distributed under the terms and conditions of the Creative Commons by Attribution (CC-BY) license (http://creativecommons.org/licenses/by/4.0/).
Share and Cite
Olivotos, S.; Economou-Eliopoulos, M. Gibbs Free Energy of Formation for Selected Platinum Group Minerals (PGM). Geosciences 2016, 6, 2. https://doi.org/10.3390/geosciences6010002
Olivotos S, Economou-Eliopoulos M. Gibbs Free Energy of Formation for Selected Platinum Group Minerals (PGM). Geosciences. 2016; 6(1):2. https://doi.org/10.3390/geosciences6010002
Chicago/Turabian StyleOlivotos, Spiros, and Maria Economou-Eliopoulos. 2016. "Gibbs Free Energy of Formation for Selected Platinum Group Minerals (PGM)" Geosciences 6, no. 1: 2. https://doi.org/10.3390/geosciences6010002