
Evaluation of Machine Learning Algorithms for Object-Based Mapping of Landslide Zones Using UAV Data


1
Faculty of Geology, Aristotle University of Thessaloniki, 54124 Thessaloniki, Greece
2
School of Civil Engineering, National Technical University of Athens, 15780 Athens, Greece
3
Faculty of Geology & Geoenvironment, National and Kapodistrian University of Athens, 15784 Athens, Greece
4
Department of Geoinformatics—Z_GIS, University of Salzburg, 5020 Salzburg, Austria
*
Author to whom correspondence should be addressed.
Geosciences 2021, 11(8), 305; https://doi.org/10.3390/geosciences11080305
Submission received: 1 July 2021
/
Revised: 20 July 2021
/
Accepted: 21 July 2021
/
Published: 22 July 2021
(This article belongs to the Special Issue Landslide Monitoring and Mapping)
Abstract
:Landslides are a critical geological phenomenon with devastating and catastrophic consequences. With the recent advancements in the geoinformation domain, landslide documentation and inventorization can be achieved with automated workflows using aerial platforms such as unmanned aerial vehicles (UAVs). As a result, ultra-high-resolution datasets are available for analysis at low operational costs. In this study, different segmentation and classification approaches were utilized for object-based landslide mapping. An integrated object-based image analysis (OBIA) workflow is presented incorporating orthophotomosaics and digital surface models (DSMs) with expert-based and machine learning (ML) algorithms. For segmentation, trial and error tests and the Estimation of Scale Parameter 2 (ESP 2) tool were implemented for the evaluation of different scale parameters. For classification, machine learning algorithms (K- Nearest Neighbor, Decision Tree, and Random Forest) were assessed with the inclusion of spectral, spatial, and contextual characteristics. For the ML classification of landslide zones, 60% of the reference segments have been used for training and 40% for validation of the models. The quality metrics of Precision, Recall, and F1 were implemented to evaluate the models’ performance under the different segmentation configurations. Results highlight higher performances for landslide mapping when DSM information was integrated. Hence, the configuration of spectral and DSM layers with the RF classifier resulted in the highest classification agreement with an F1 value of 0.85.

1. Introduction
Landslide phenomena are considered an important factor for landscape dynamics, and they pose a significant hazard in many regions around the world, causing incremental losses and damages in terms of finance and livelihood. Precise detection and documentation of landslide events over specific areas are important for accurate and objective landslide hazard and risk assessment [1]. Special attention should be given in post-disaster situations where there is a need for timely and cost-effective landslide documentation for supporting Disaster Risk Reduction (DRR) and decision-making. Developing landslide analysis capacity in a cost-effective manner constitutes a challenge, especially in the construction domain and mining operations where geological failures are a common problem [2]. In conventional site investigation approaches, a landslide inventory is often developed by conducting expensive and dangerous field surveys using the Global Positioning System (GPS) [3]. Remote sensing techniques demonstrate major advantages for landslide assessment compared to conventional approaches, which are costly, time-consuming, and often impossible due to poor site accessibility [4]. A large number of studies exploited the use of Earth observation (EO) data for landslide investigation and monitoring purposes [5]. However, the relatively low spatial resolution of earlier satellite missions (such as Landsat) do not allow the detection of different landslide types; consequently, studies mostly focused on extracting the landslide extent. With the advances of remote sensing technology satellite missions such as QuickBird, IKONOS, and WorldView-2 provided enriched spatial information at high-end costs. Terrestrial or aerial Light Detection and Ranging (LiDAR) data also provide useful insights into landslide geometry and assists in the identification of geomorphological zones via high-resolution digital elevation models (DEMs); however, their operational cost is relatively high [6]. Other sensors such as satellite-based Synthetic Aperture Radar (SAR) have proven effective in measuring centimeter surface displacement over large areas [7]. However, studies indicate that freely available datasets do not provide sufficient resolution to detect specific landslide sub-zones and separate landslide features such as scarp and runout zone or small fissures, which can provide significant information on the landslide mechanism [8].
Over the last decade, great advancements have been made in using Unmanned Aerial Vehicles (UAVs) or drones in a wide range of scenarios. They have been initially introduced in the defence domain while other applications are in Building Information Modeling (BIM) [9], civil engineering [10], geology [11], architecture [12], archaeology [13], mining operations [14], river morphology [15], precision agricultural [16], environmental management [17], wildfire mapping [18], glacier monitoring [19], and many more indicating the high potential of integrating UAV data collection in different disciplines. Colomina and Molina [20] provided a review of UAV systems and recently Giordan et al. [21] provided an extended review on UAV and engineering geological applications. Many studies have discussed the advantages of UAV in landslide and rockfall investigations mainly focusing on manual mapping, visualization purposes, and semi-automated procedures [22,23,24]. UAVs have emerged as indispensable tools for landslide management and analysis, as they offer ultra-high-resolution datasets with high repeatability and precision. Such platforms are particularly effective for 3D documentation of geomorphological changes after extreme events. Manifold landslide information can be extracted at the centimeter-scale from UAV platforms equipped with a variety of active or/and passive sensors. Consequently, a range of undiscovered landslide patterns and related information become distinguishable and can be further incorporated as advanced semantic knowledge in the characterisation phase. However, only a few studies have been published on detecting specific landslide types and their distinct attributes by using UAV imagery and DSM derivatives. While manual mapping is fraught with experts’ subjectivity [25], in semi-automated and automated image classification approaches, the most widely used approach is pixel-based classification.
Lately, object-based approaches have been increasingly implemented due to their effectiveness in handling and analyzing multivariate high-resolution data [26]. Object-Based Image Analysis (OBIA) or Geographic Object-Based Image Analysis (GEOBIA) refers to a modeling approach that conceptualizes the real world by using intellectual knowledge in a way that is machine-understandable [27]. In object-based approaches, objects are generated from image segmentation algorithms based on user-defined parameters which are further classified with rule-based or Machine Learning (ML) algorithms [28]. Attributes such as spatial, spectral, textural, geomorphologic, and even spatial relations with neighboring objects and/or classes can be integrated for classification. In contrast to pixel-based approaches, object-based approaches emulate the way humans interpret the sensed environment. Consequently, OBIA is advantageous for modeling the natural environment and especially when working with diverse datasets (spectral, topological, point clouds) simultaneously. Several studies [29,30,31,32] have implemented object-based methods for landslide detection, but also landslide susceptibility mapping [33], showcasing superior accuracies compared to pixel-based methods. Classification approaches can be either knowledge-based relying on expert’s knowledge or based on supervised classification algorithms. Several studies have applied rule-based classification approaches based on expert knowledge [25,34], but also supervised landslide classification approaches using ML algorithms can be found in literature, such as Random Forest (RF) [35], Decision Tree (DT) and Support Vector Machines (SVM) [36,37], and Artificial Neural Networks (ANN) [38]. ML offers the potential for effective and efficient classification of high-resolution heterogeneous datasets.
The aim of this study is to exploit different classification scenarios in an object-based environment for automated recognition and characterization of landslides. Three ML classification approaches are evaluated for classifying ultra-high-resolution datasets derived from UAV photogrammetry. The study analyzes the differences in the thematic agreement of landslide zone mapping with different methods and based on various features. In this way, we aim to determine which classification process is the most efficient for landslide mapping on site-specific scales. The main objectives are a) to investigate the effectiveness of UAV data for distinguishing and mapping landslide zones using OBIA, and b) to evaluate frequently used ML algorithms against a knowledge-based ruleset for specific landslide zone classification.
2. Study Site
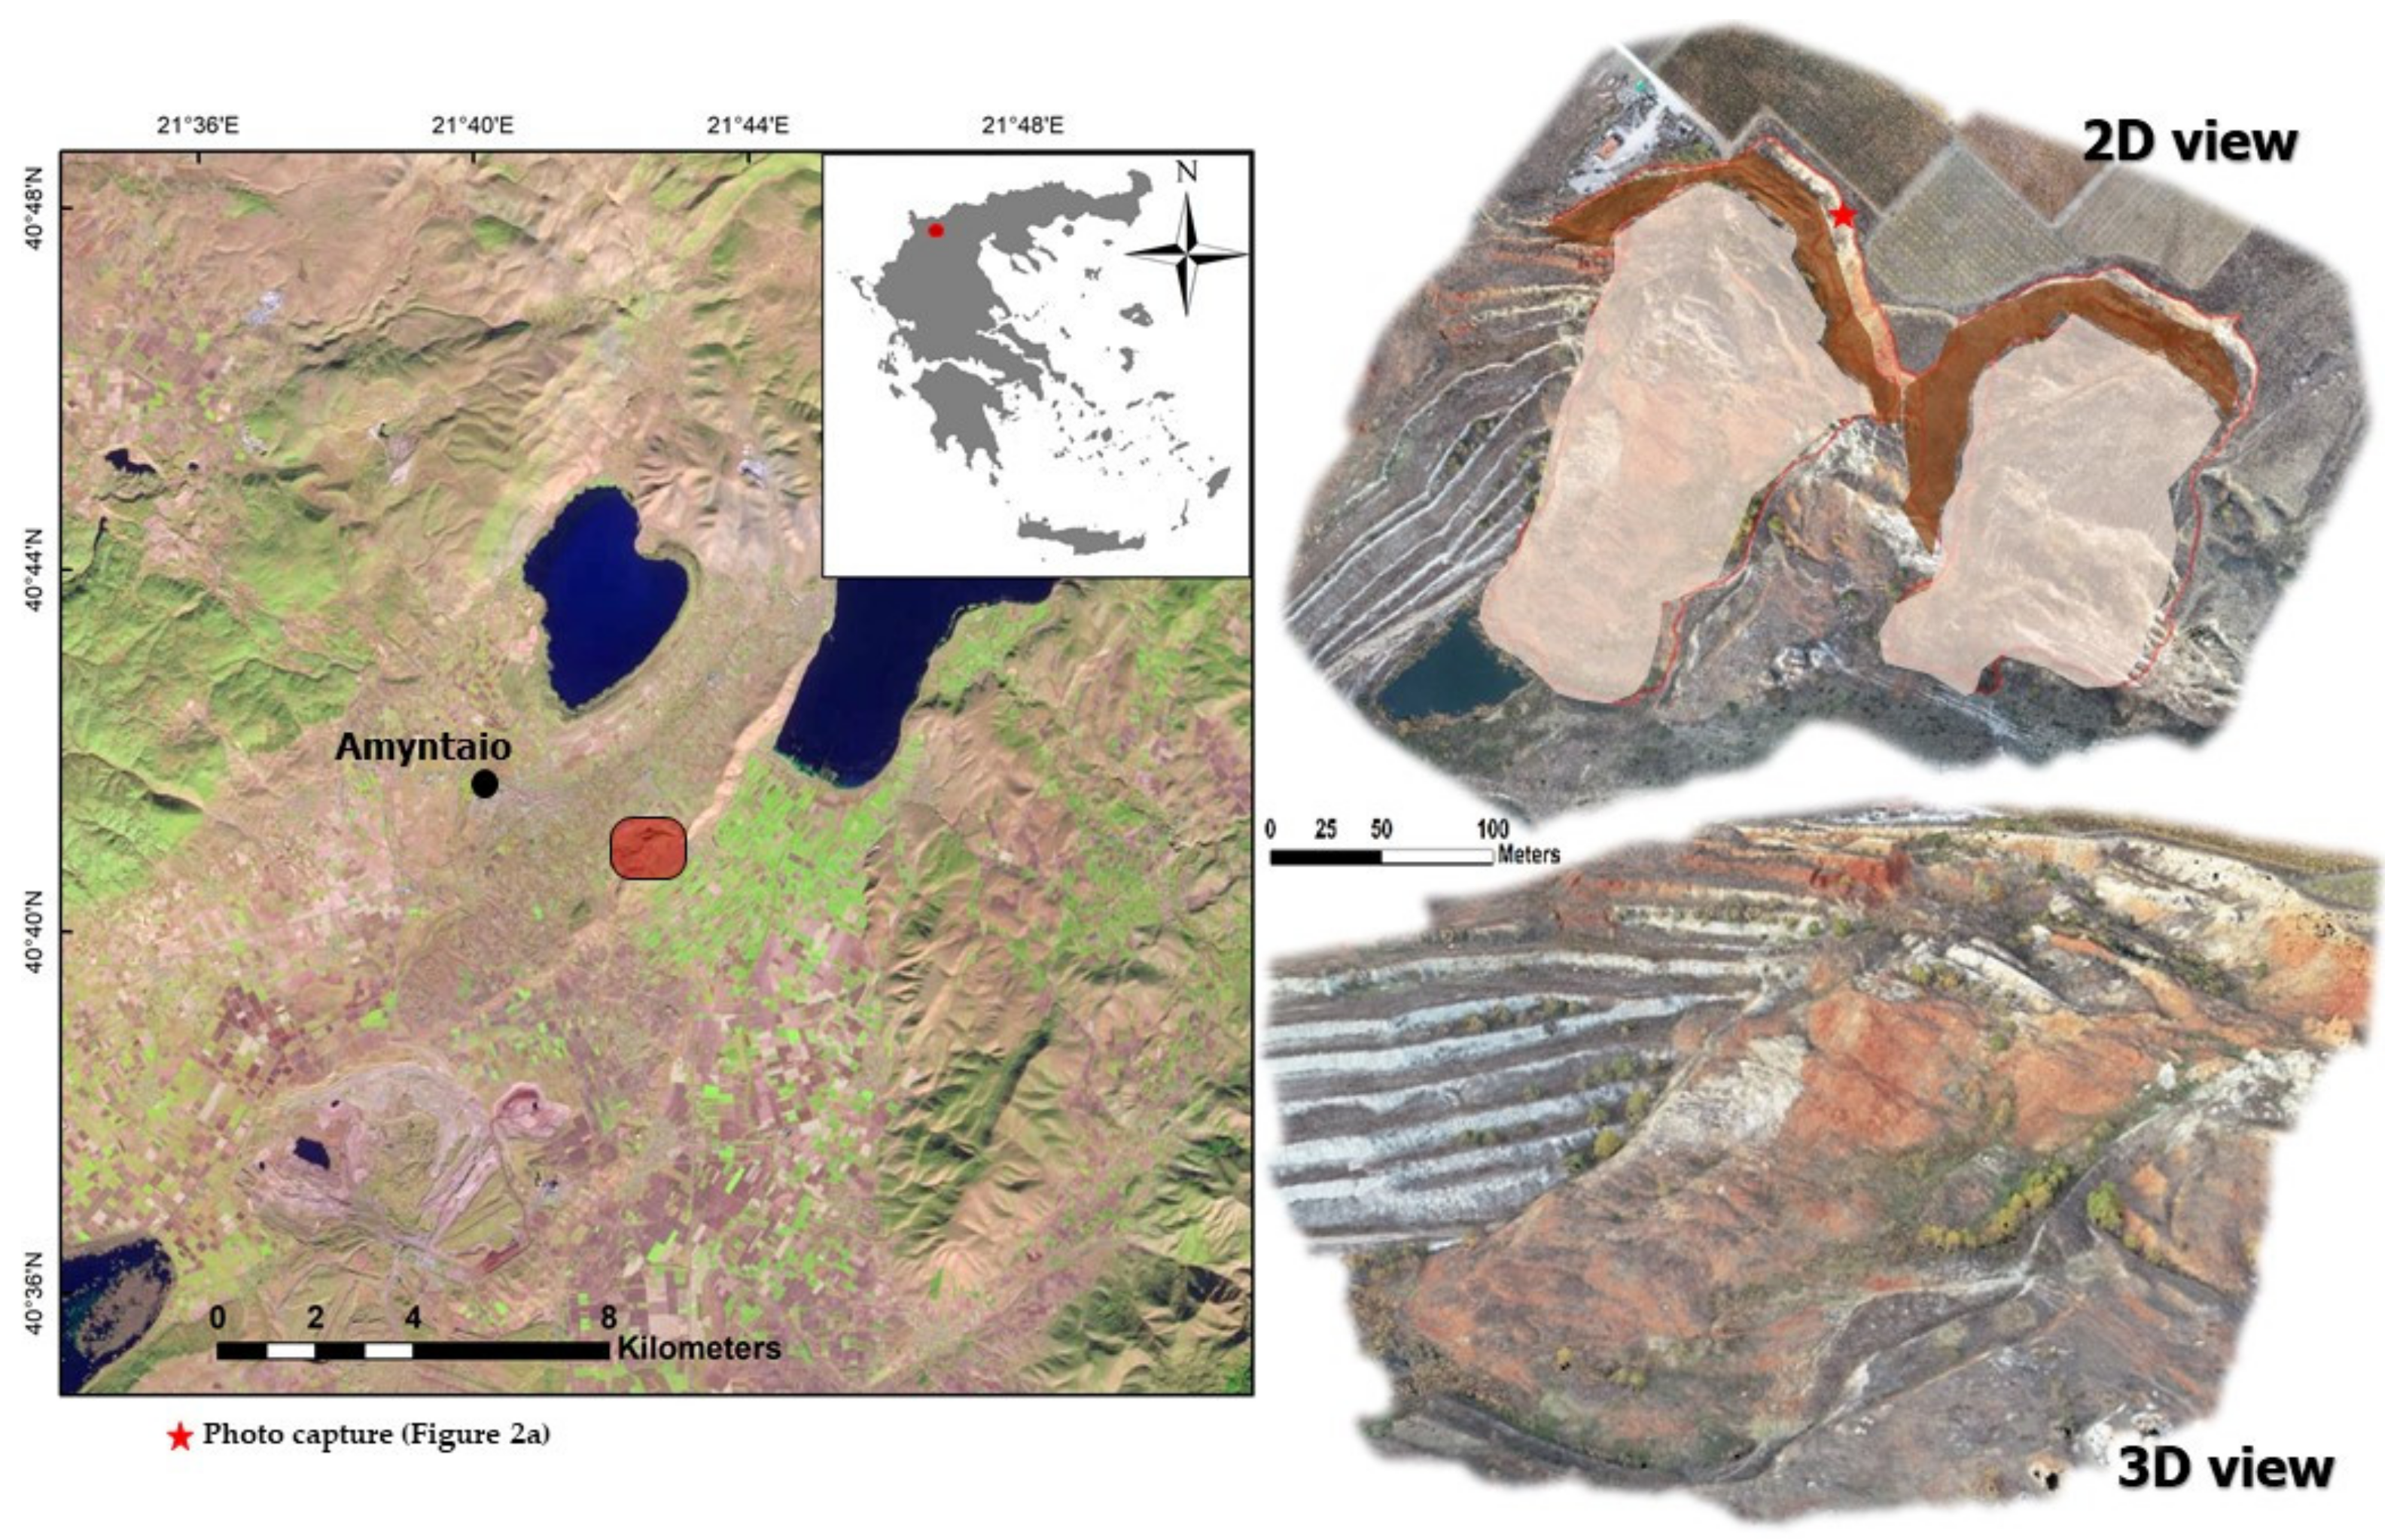
A characteristic site with two rotational landslides (slumps) in an old lignite open pit site in Florina prefecture, northwestern Greece, was used in this study. UAV datasets were collected for training and validation during fieldwork. The area under investigation is located next to Vegora village (40°41′ N, 21°43′ E) on the southwest bank of Vegoritida lake (Figure 1). The vegetation cover is mainly grass with occasional isolated small bushes; in addition, olive trees are growing in the vicinity. From a geological point of view, the open pit mine is situated at the elongated Florina-Ptolemais-Kozani tectonic graben which is known for its wealth in lignite deposits which are found within the marly formations. According to the geotectonic units of Greece, the test area belongs to the Pelagonian nappe and in the upper and the lower part of the elongated intermontane Florina-Ptolemais-Kozani tectonic graben. The landslide phenomena have occurred in locations where the excavated slopes have been left without any support after the open pit closure.
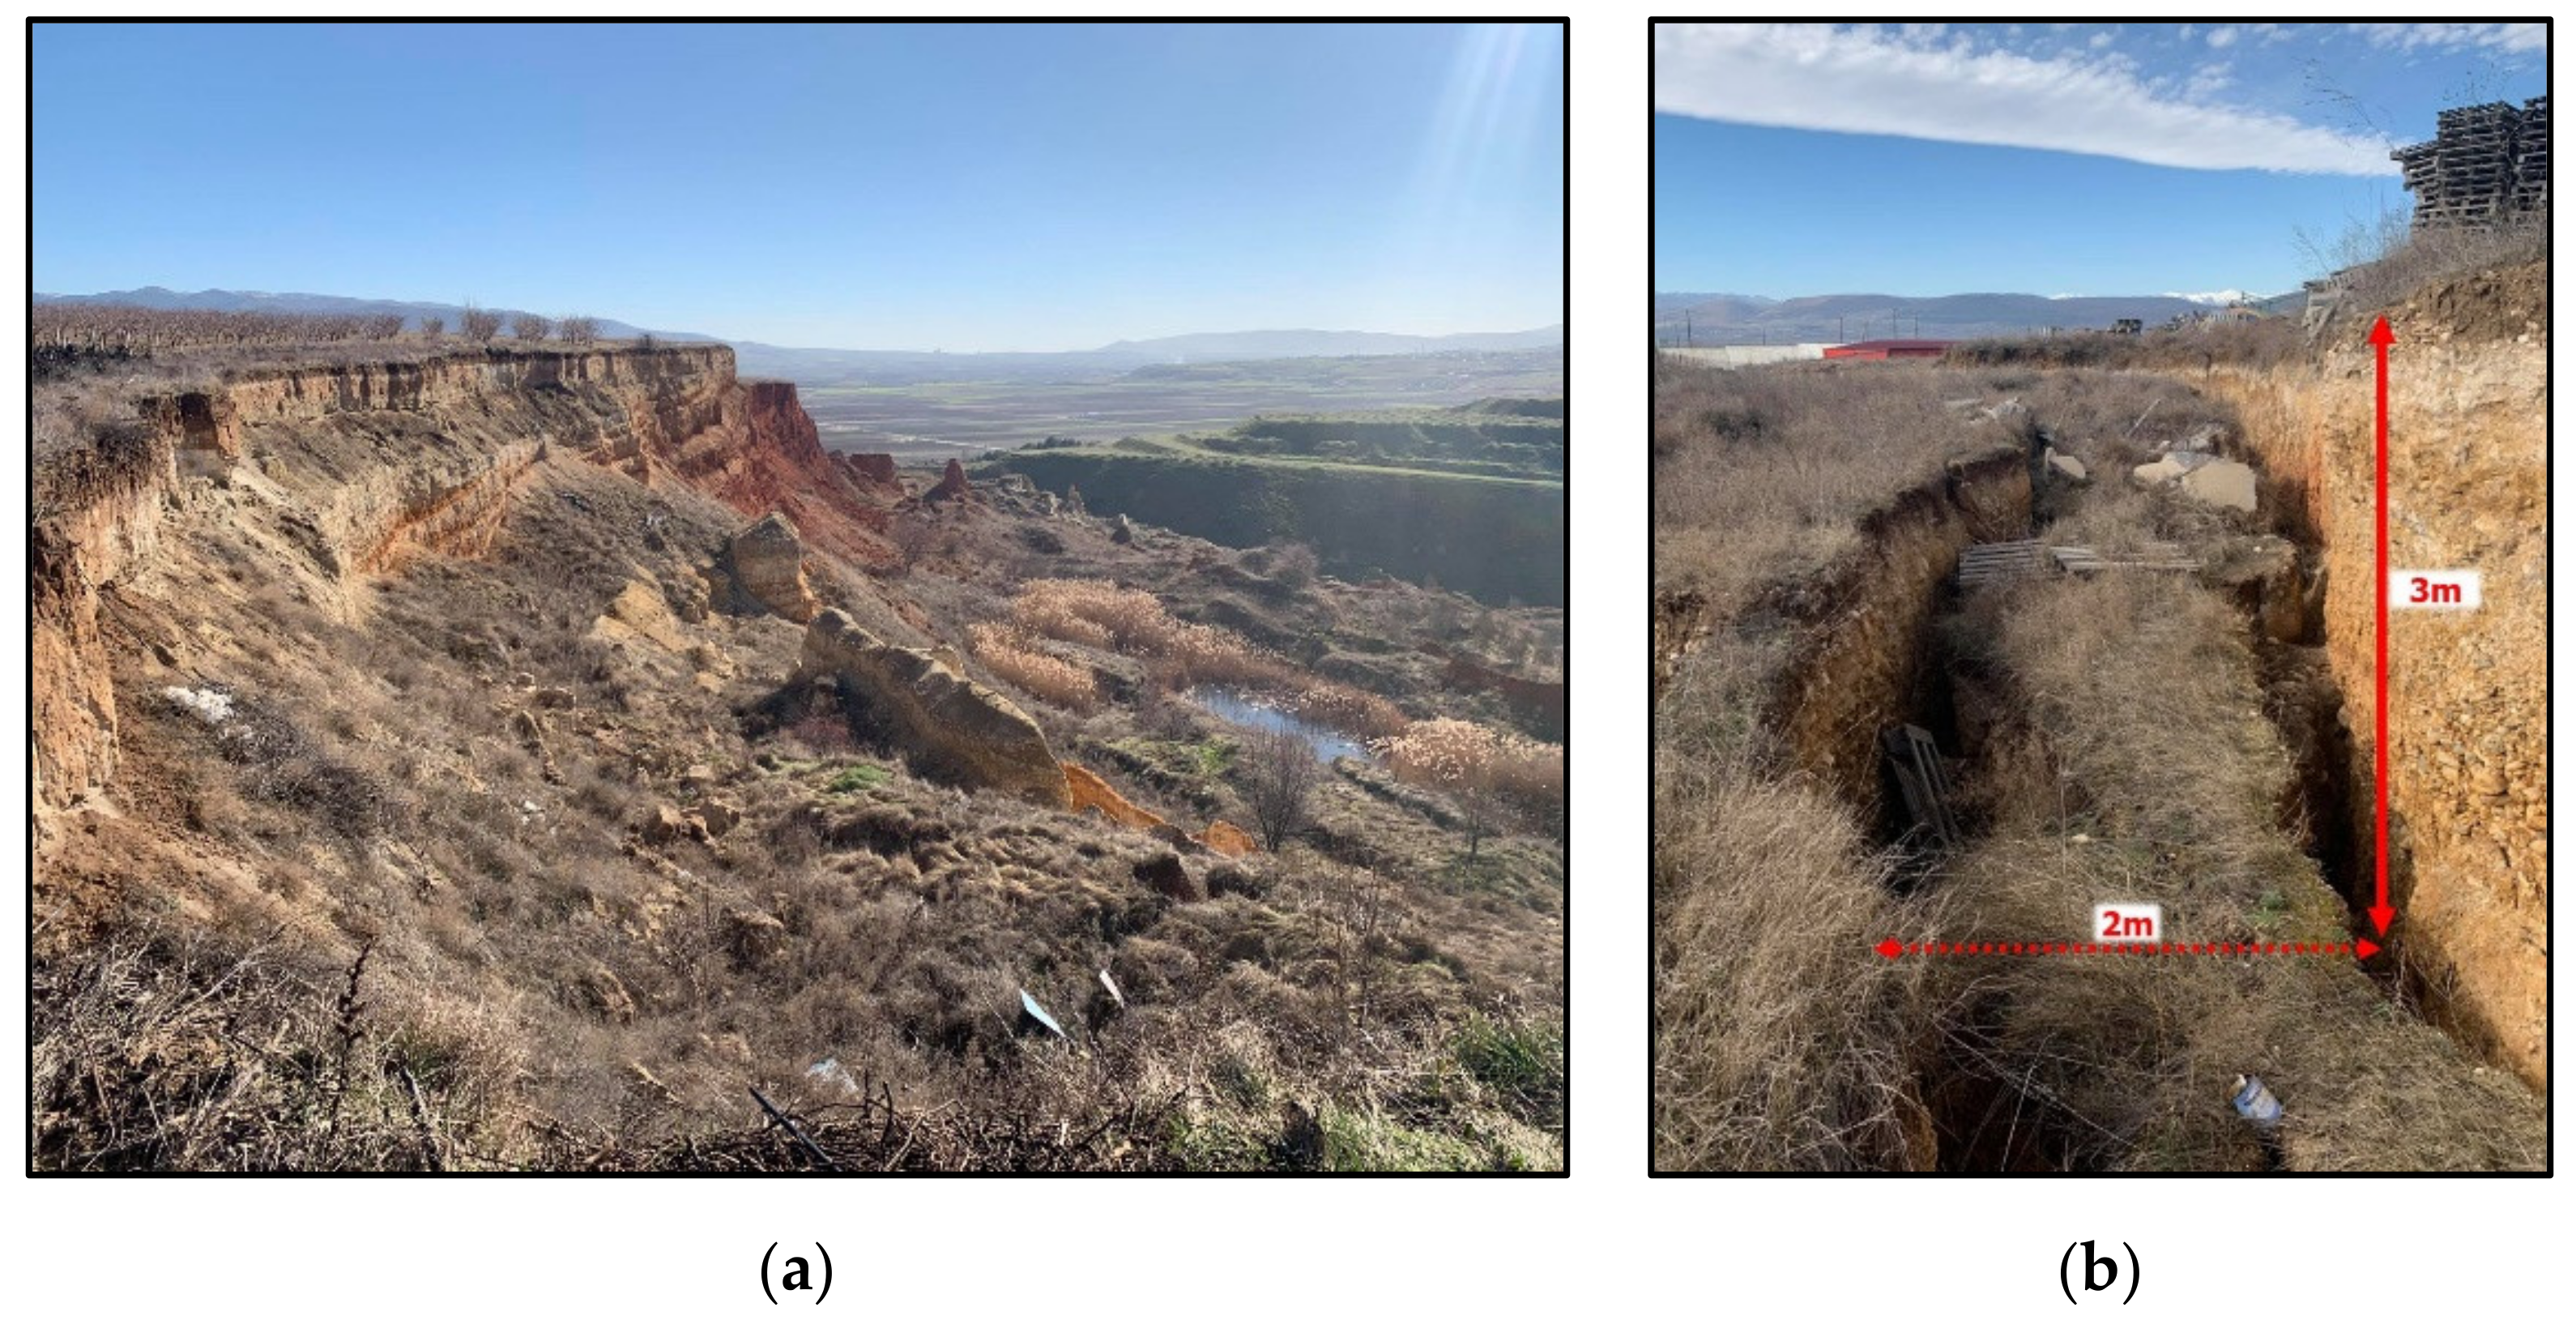
The geology of the wider area consists mainly of Paleozoic metamorphic rocks, Mesozoic carbonate cover with ophiolites, Neogene clays, marls in numerous forms in alternations with lignite ores, Quaternary terrestrial and fluvioterrestrial conglomerates, lateral fans, and alluvium deposits [39]. The slope geometry (height and angle) in combination with the geotechnical characteristics of the marl formation, i.e., cohesion and friction angle, play a major role in the slope instability which manifests as retrogressive rotational slides. In addition, the significant time since the closure of the open pit mine in relation to weathering processes (freeze-thaw) contributes to the progressive failure by creating large open cracks (Figure 2) on the surface, ranging from a few centimeters to multiple meters, which increase pore pressure and deteriorate the rock mass properties.
3. Methodology
This research aims to analyze different segmentation configurations and provide a semi-automated workflow that can optimize the individual mapping of landslide zones (scarp vs. depletion) and non-affected regions via ML methods. The applied methodological framework includes the UAV data collection, creation of the input datasets, segmentation, and classification phases, and finally the model evaluation.
3.1. Data Preparation
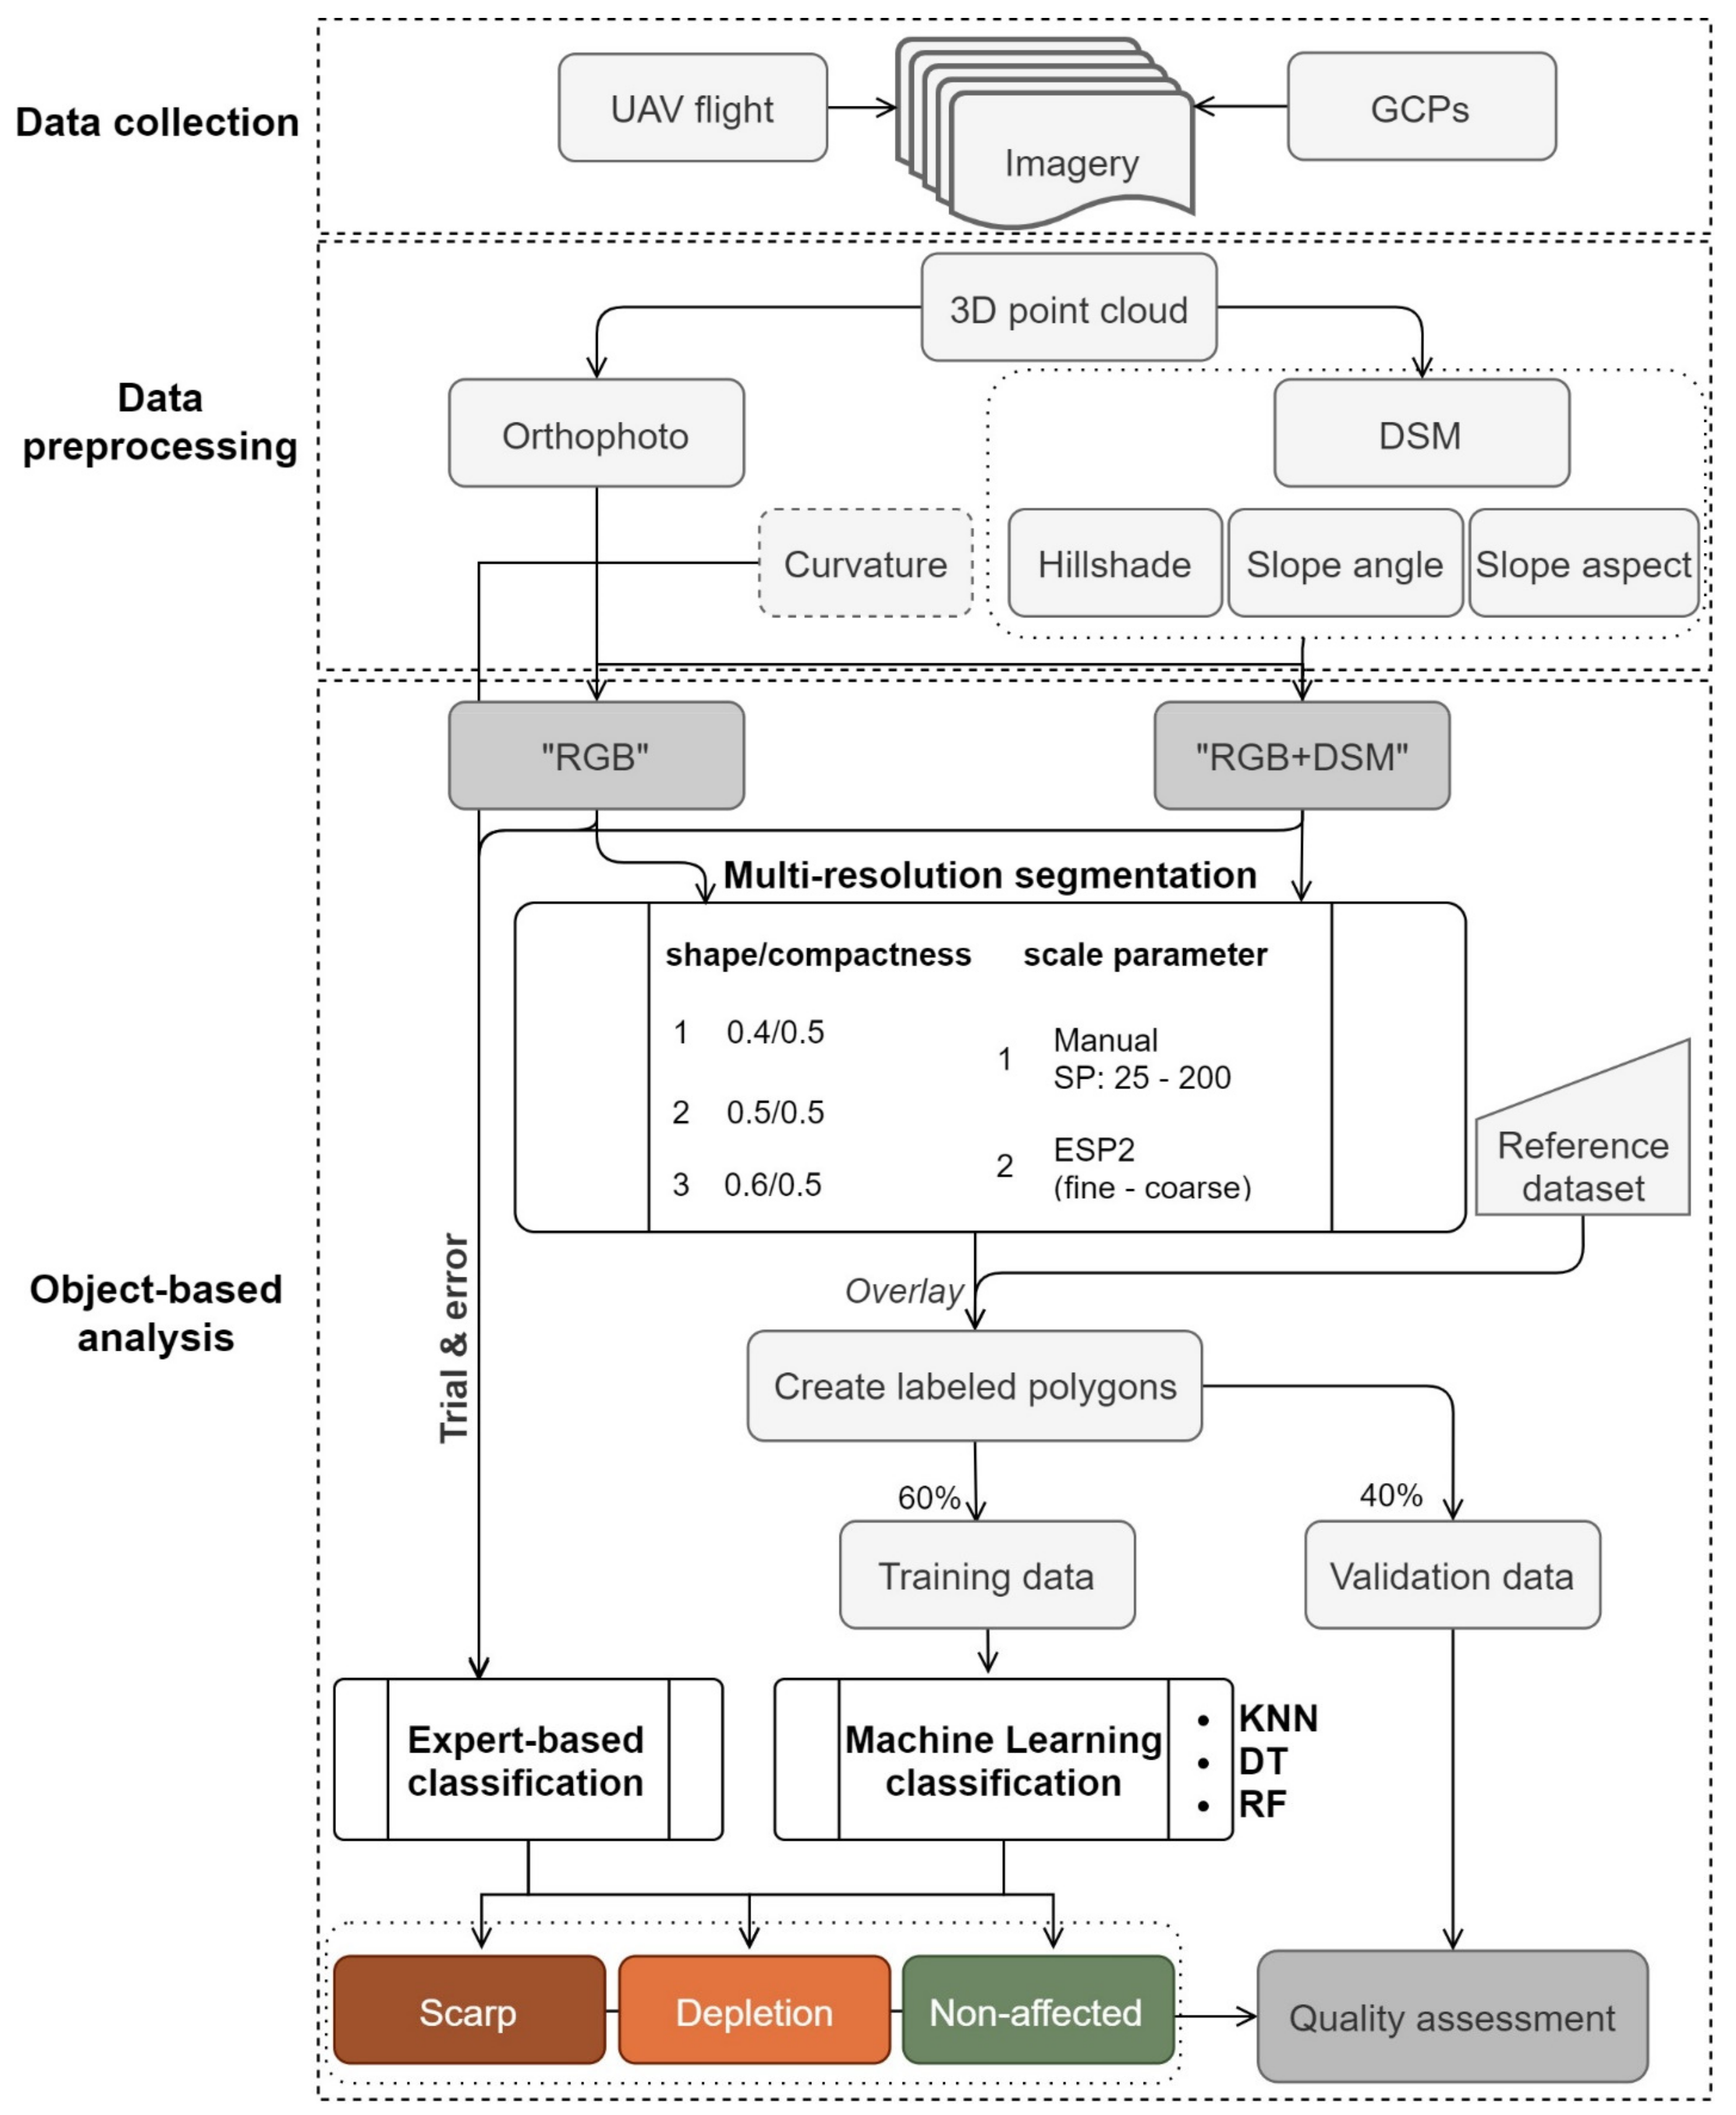
The workflow is structured in four distinct stages (Figure 3): (a) on-site data collection, (b) data preprocessing, (c) OBIA (segmentation and classification), and (d) evaluation. Data acquisition has been conducted with a commercial mini-UAV quadrotor platform (Phantom 4 Pro V2.0, DJI, Technology Co., Ltd., Shenzhen, China) equipped with a stabilized built-in camera (1” CMOS-20 megapixel). This platform has been chosen due to its relatively low cost and easy on-site operation in combination with the equipped miniaturized GPS/GLONASS system. Determining an efficient flight mission includes the selection of flight extent, overlapping among the photos and flying height. The flight path was composed of cross-stripes following surface morphology to completely cover the area under investigation. In addition, 180 photos have been acquired and imported for Structure from Motion (SfM) workflow and model development in the photogrammetric software Pix4D S.A. [40]. In terms of accuracy, the survey resulted in a root mean square error (RMSE) of 0.02 m in xy-axes and 0.03 m in the z-axis. The produced dense point cloud was constructed from 68 million points (2500 points/m2), and the area extent of the scene was approximately 38 ha. From the DSM, different derivatives have been calculated and exploited. Hillshade layers using eight different sun angles have been created and combined into one for better representation of the ultra-high-resolution DSM. Slope and aspect layers were calculated in degrees (°). Moreover, a curvature layer was created, but this layer was only used for classification and not for segmentation. The final datasets had a uniform spatial resolution of 0.05 m. Additionally, a reference map was manually created (Figure 1) based on UAV data, Google Earth imagery, previous research in the area [41], and multiple in situ field investigations.
After data collection and data preprocessing, OBIA aims to create homogeneous non-overlapping objects [42] and performs classification using various semi-automated approaches [43]. The baseline for analysis in OBIA is an image object, which gets enriched information. This is similar to expert perception, which intuitively identifies a landslide failure from an image and/or DSM based on distinct features rather than individual pixel values. The inclusion of contextual and shape information becomes important for recognizing morphological patterns [44]. This allows the accurate identification and extraction of natural features from UAV data on multiple scales and integration of their properties and spatial links to understand their interrelationships. In the proposed study, the object-based workflow includes four distinct phases: (a) segmentation, (b) training samples’ creation, (c) feature selection and tuning, and (d) classification, using Cognition Network programming language (CNL) within the eCognition Developer 10 software [45] (Trimble eCognition, 2020).
Two different input structures for segmentation have been explored. The red, green, and blue (R, G, B) bands of the orthophoto were used to formalize the “RGB” structure based solely on spectral values while the three spectral bands in combination with the DSM and three derivatives (hillshade, slope, aspect) formalize the “RGB + DSM” structure (the curvature layer was not included here since it was solely used during classification and not during segmentation). The two created dataset structures were processed distinctly following the same workflow for segmentation and classification during object-based analysis. Two major challenges exist during the OBIA process: first, the determination of optimal parameters for image segmentation and, second, the selection of suitable features and thresholds for the classification. Consequently, the selection of appropriate segmentation parameters is a challenging task, and they are often estimated subjectively by using trial and error. Several studies proposed automated approaches for objectively estimating the scale parameter (SP) value for multi-resolution segmentation (MRS) [46]. In [47], authors proposed using normalization heterogeneity indices amongst neighboring objects to determine object merging criteria, while Ref. [48] proposed integrating the local variation of two indices to determine the SP. In addition, Euclidean Distance was proposed by [49] and fuzzy active contour models by [50], whereby both studies entail user interaction for developing the reference objects. We investigated different methods for selecting the SP for the MRS algorithm in order to test its influence on landslide object characterization. Firstly, the Estimation of Scale Parameter 2 (ESP 2) [51] was employed to identify statistically relevant object levels for a set of input layers by evaluating the relative changes in local variance for a predefined scale spectrum. Second, trial and error tests based on expert’s prior site knowledge have been explored on both input structures (“RGB” and “RGB+DSM”). Each segmentation-derived setup resulted from the various SPs was initially overlaid with the reference landslide dataset, i.e., scarp, depletion, and non-affected area, in order to create the training and test labeled samples. However, in various overlay cases, reference polygons and created segments produced different topological relationships among them. Therefore, if more than one class was contained in the segment, the thematic value with the spatial majority was assigned to preserve object “pureness”.
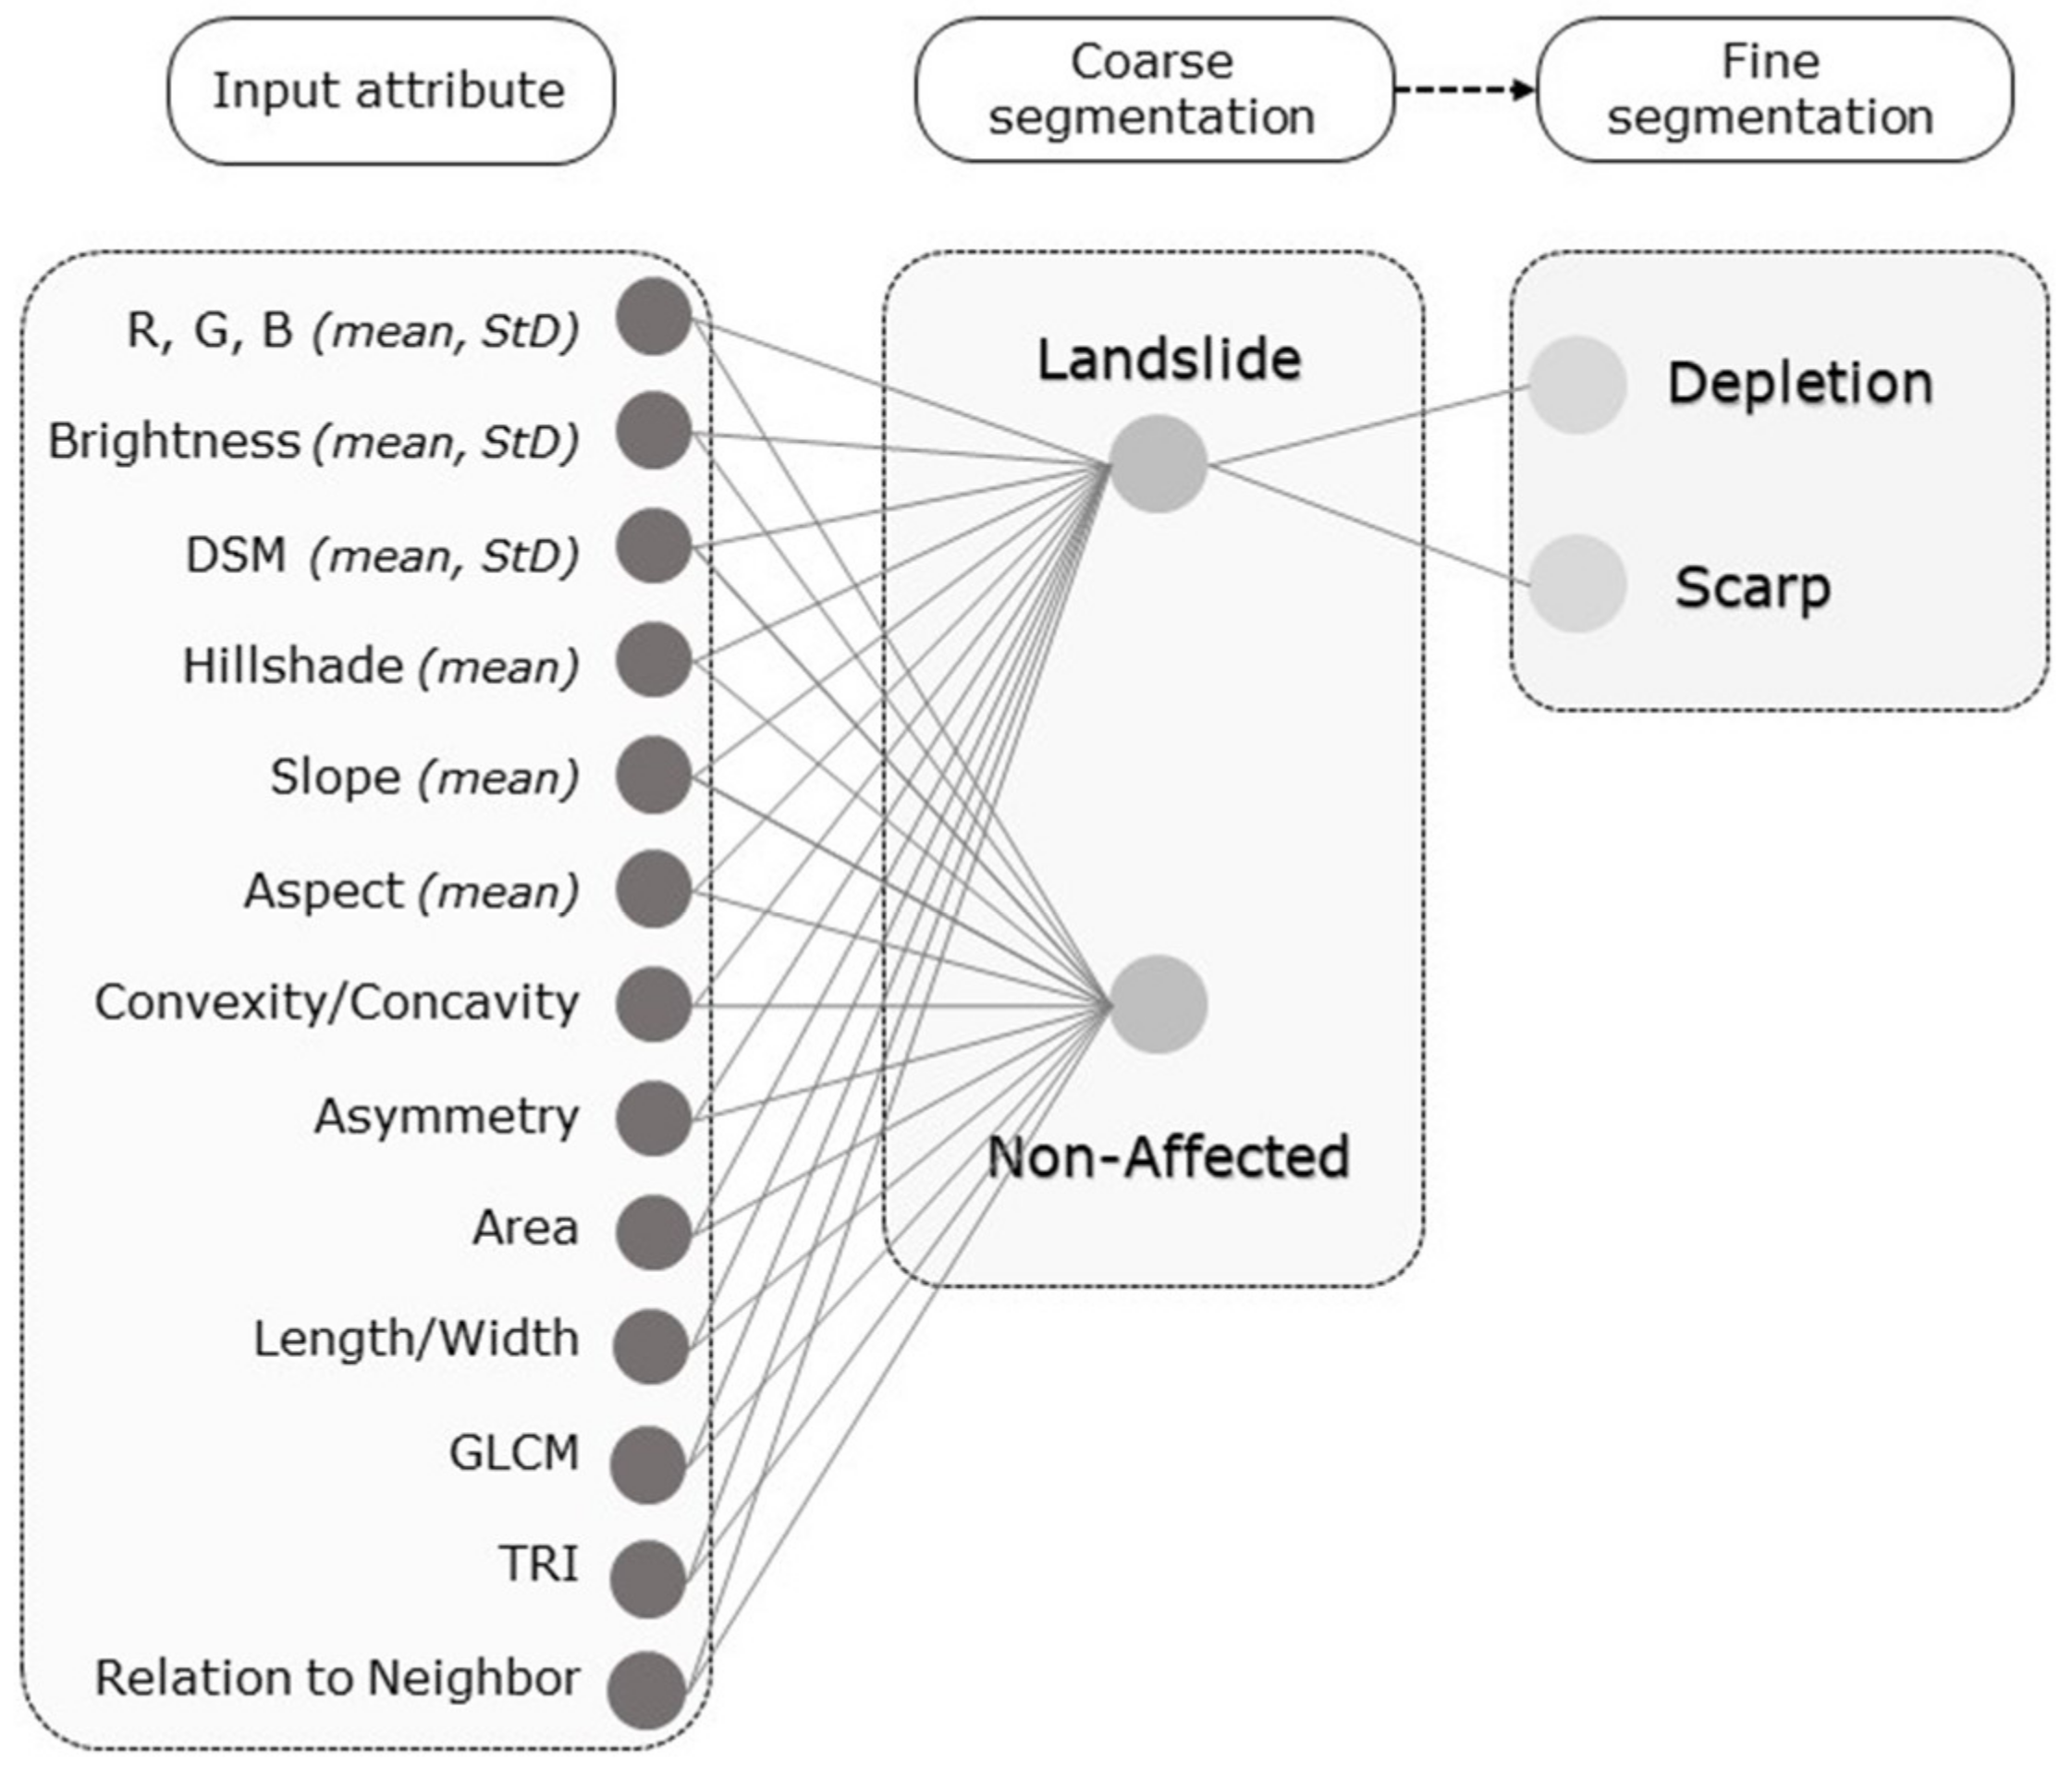
The second phase in OBIA involves object classification. Due to the fact that the processing units in OBIA are image objects, a diverse object’s features have been calculated for classification and characterization. In the rule-based classification approach, rulesets are developed based on human knowledge to extract meaningful classes from the data used. Since the rule-based classification is adaptive and flexible, the developed model can be applied to similar datasets. In supervised classification, different algorithms can be incorporated such as K-Nearest Neighbor (KNN), RF, SVM, etc. One of the main advantages is the capacity to handle high dimensionality data. On the other hand, ML classifiers require training data, and some classifiers are sensitive to the sample size of the training data. In this study, two different approaches have been utilized regarding the landslide classification. First, a knowledge-based fuzzy ruleset has been developed based on spectral, spatial, and contextual features. Second, three ML classifiers, i.e., KNN, DT, and RF, have been tested for landslide mapping and zoning (Figure 4) using training data from the created reference segments.
The number of segments mainly depends on the SP values. Small SP values result in a larger number of segments and vice-versa. We applied a cross-validation approach where the created (labeled) reference segments were split into two distinct partitions, a) the training (60%) and b) the validation (40%) data based on stratified random sampling proportionally to each entailed class [52], using scikit-learn in Python (http://scikit-learn.org/stable/ (accessed in December 2020)). In the final phase, the model with the highest performance among the ML classifiers was tested in a neighboring area to exploit the method’s transferability. Results were evaluated for their quality in terms of the spatial and thematic agreement.
3.1.1. Segmentation Settings
Multi-scale segmentation was performed on the two ultra-high-resolution input structures, namely “RGB” and “RGB + DSM”. The MRS algorithm [53], which is a region-growing segmentation based on pixel homogeneity criteria, was employed. Determining proper segmentation parameters is highly subjective and largely based on the analyst’s experience and interpretation. To overcome intuitive SP selection and to test its influence on the final classification result, two different approaches have been developed. First, multiple SP modifications have been tested on the two distinct input structures ranging from fine level (SP: 25) to coarser level (SP: 200) in increments of 25. Second, for the weight parameter between shape and color importance, three different configurations were investigated ranging from 0.4 to 0.6 to test the influence on the landslide mapping result. Finally, smoothness—compactness factor was kept to 0.5 in order not to favor compactness or smoothness of segments. In parallel, the ESP 2 tool was used on the two input structures as a customized algorithm integrated in eCognition. For the segmentation setup of the ESP 2 tool, we implemented a non-hierarchical approach, starting from a value of 1, and using increments of 1. During the segmentation procedures, the layers used were equally weighted. In total, 54 different segmentation configuration settings were obtained and tested based on the proposed workflow.
3.1.2. Expert-Based Classification
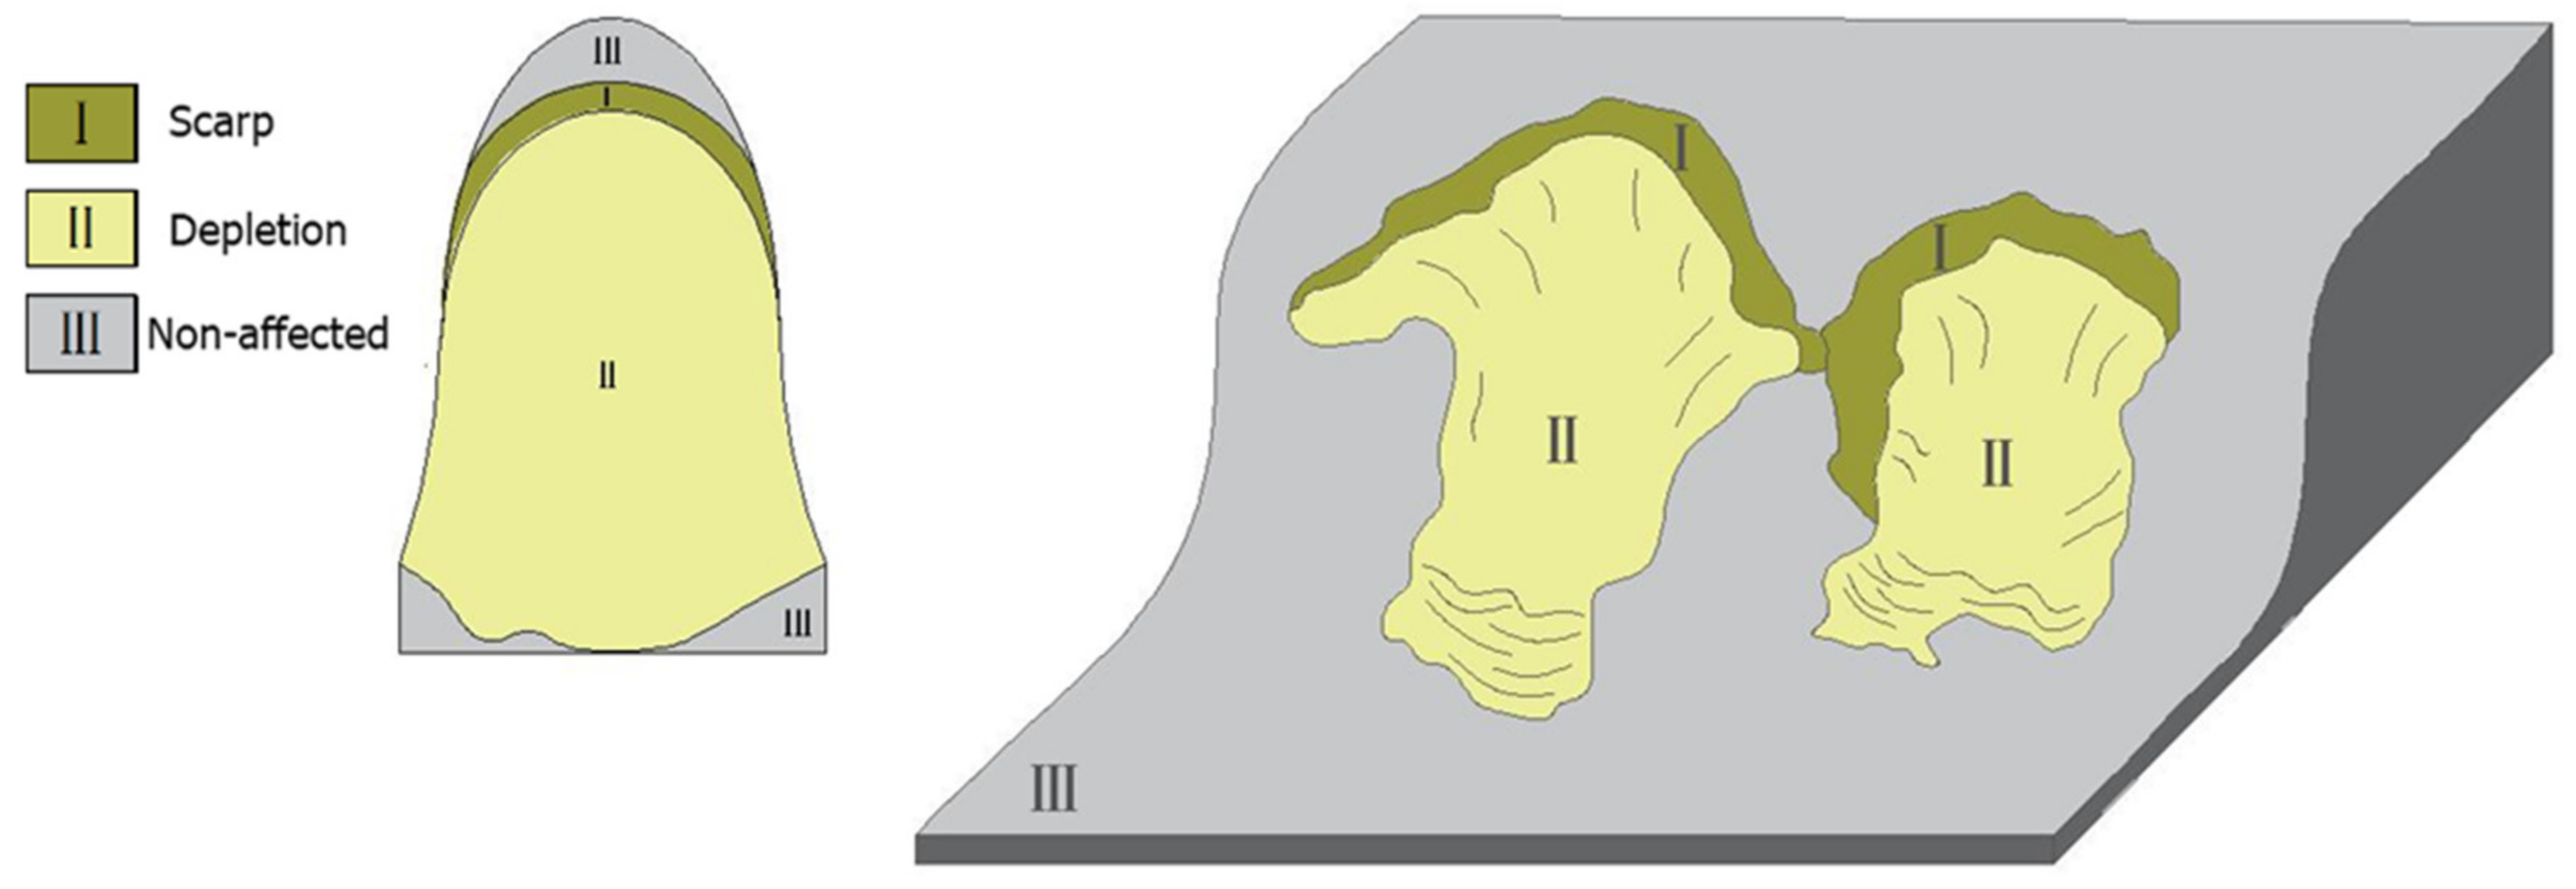
Object-based methods use homogeneous groups of pixels for classification, which can emulate how experts understand landslide features as entities. In the rule-based classification, specific object features were identified and integrated as descriptors in fuzzy characterization. The selection of features and tuning of thresholds was determined based on expert knowledge. For instance, a landslide scarp is characterized by its steep slope and semi-circular shape [54], while the landslide body has its main direction with the elevation flow, and it diffuses on the lower end. After segmentation, 60% of objects among landslide classes (scarp—depletion) and non-landslide (non-affected) have been chosen as samples for further analysis after polygon overlay with the reference dataset created in this study. The initial characterization on the coarse segmentation level included the expert-based classification into landslide and non-affected objects, followed by the differentiation of landslide objects into scarp and depletion zones on the fine level.
The selected features used for rule-based classification are illustrated in Figure 5. In brief, the three spectral bands from the orthophoto and the brightness value were used as the spectral metrics. The length/width ratio, the asymmetry, and the object’s size were used as the spatial metrics. Slope, aspect, and curvature were used as the morphological metrics. Grey-Level Co-occurrence Matrix (GLCM) was used as the textural metric, calculated on the DSM, in all directions, as it was proposed by Haralick et al. [55]. Seven textural features including mean, entropy, homogeneity, variance, dissimilarity, contrast, and correlation using two window sizes (9 × 9 and 18 × 18) were adopted. In addition, a measure of convexity–concavity has been used for classifying specific landslide features such as scarp regions. A positive curvature indicates that the surface is upwardly convex, and a negative curvature indicates that the surface is upwardly concave. Terrain Roughness Index (TRI) was calculated as the variation of slope within an object. TRI was derived by taking the root-mean-square (RMS) of the elevation differences, and it indicates the relief variations [56]. Scarp regions present lower roughness values than depletion due to their geometrical sharpness. Additionally, contextual information, such as the spatial relationships between objects and background, has been used for enhancing the object-based landslide classification. Prior to the classification phase, all the variables have been normalized for consistency while the same classification features have been used for the rule-based and machine learning approach.
3.2. Machine Learning (ML) Classifiers for Landslide Mapping
In this section, the supervised classifiers evaluated in the object-based environment for depicting landslide entities are introduced. Since the focus is on how to implement those classifiers for landslide mapping and zoning, rather than the theoretical aspects of their design, only a conceptual description of them is provided. ML algorithms have been extensively implemented in diverse scientific domains, especially in Earth Sciences [57], to overcome complexities. ML is a subdivision of artificial intelligence (AI). Three supervised classification algorithms, KNN, RF, and DT, were implemented and evaluated.
3.2.1. K-Nearest Neighbor (KNN) Algorithm
KNN is an instance-based learning method for classifying objects based on the closest training examples in the feature space. The KNN classifier has been initially proposed by [58], and it is the most widely used amongst the ML algorithms. A candidate object is classified by a vote majority of its neighbors, with the object being assigned to the class most common amongst its K nearest neighbors. For instance, if K is 1, then the object is simply assigned to the class of its nearest neighbor. This means K is the number of samples to be considered in the neighborhood of an unclassified object. The best choice of K depends mainly on the data, larger values reduce the effect of classification noise, but the class boundaries are becoming less distinct. In our study, a K value of 20 has been found to be most suitable for the different SP configurations.
3.2.2. Decision Tree (DT) Algorithm
DT classification algorithm or Classification and Regression Trees (CART) [59] is a method commonly used in data mining where a series of decisions are made to segment the datasets under investigation into homogeneous partitions. The model is quite popular due to its intelligibility and simplicity. The goal is to create a model that predicts the value of a target variable based on several input variables. One tree can be trained by splitting the source set into subsets based on an attribute value. Each root node represents a single input variable and a split point on that variable. Subsequently, data are categorized depending on whether the value in a certain layer is exceeding a threshold. The leaf nodes of the tree contain an output variable that is used to predict the outcome class in a recursive manner. The recursion is completed when the partition at a node has the same value as the target variable, or when splitting no longer adds value to the predictions. For the maximum allowed depth of the tree, we selected a value of 20 and a value of 30 as the minimum number of samples per node.
3.2.3. Random Forest (RF) Algorithm
RF constitutes an ensemble machine learning approach [60], and it has been widely used for landslide classification. It constructs multiple decision trees during the training process, using bootstrapping for the classification to overcome the weaknesses of a single tree [61]. RF has several advantages such as being a non-parametric method, capable of determining the importance of the variables used. Compared to DT, it uses multiple decision trees to provide accurate predictions. While, on most occasions, it provides superior predictive results compared to other ML classifiers [62], it behaves like a black box. The algorithm requires defining the number of trees and the number of variables assigned on each node. The maximum number of trees was set to 40 and the tree depth to 20. Based on multiple tests performed with a different number of trees, we found that the latter does not have a significant influence on the classifier performance. The prediction performance tends to plateau with a large enough number of trees. As the parameters also influence the classification results, we applied the same number of trees and tree depth to all SP configurations.
3.3. Validation and Transferability
For validation of the results, landslide zoning was assessed by comparing the OBIA results against the reference dataset. In addition, the overall workflow has been tested on a neighboring landslide area to evaluate methodological performance and transferability. As a consequence, the same workflow was applied to the “Prosilio” case site (open pit mine). For validation, instead of “accuracy”, we used the term “agreement” [63,64] since it better reflects the comparison outcome between the research results and the actual map entities in reality. Different object evaluation approaches exist in literature ranging from per pixel to per polygon, both with recognizable advantages and disadvantages [65,66]. In this study, a per polygon evaluation method has been used. Objects (scarp, depletion, non-affected) that were correctly identified represented true positives (TPs), objects that were incorrectly classified represented false positives (FPs), and false negatives (FNs) represented referenced areas that were not detected. A multi-class confusion matrix [67] has been calculated to evaluate the agreement of the final classification using (a) the Recall rate (1), which is defined as the proportion of correctly classified objects to the reference samples of a class, (b) the Precision rate (2), which is defined as the proportion of correctly classified objects within the total number of samples classified, and (c) the F1 index (3) which was used to balance the Precision and Recall metrics among the classes:
4. Results
4.1. Segmentation
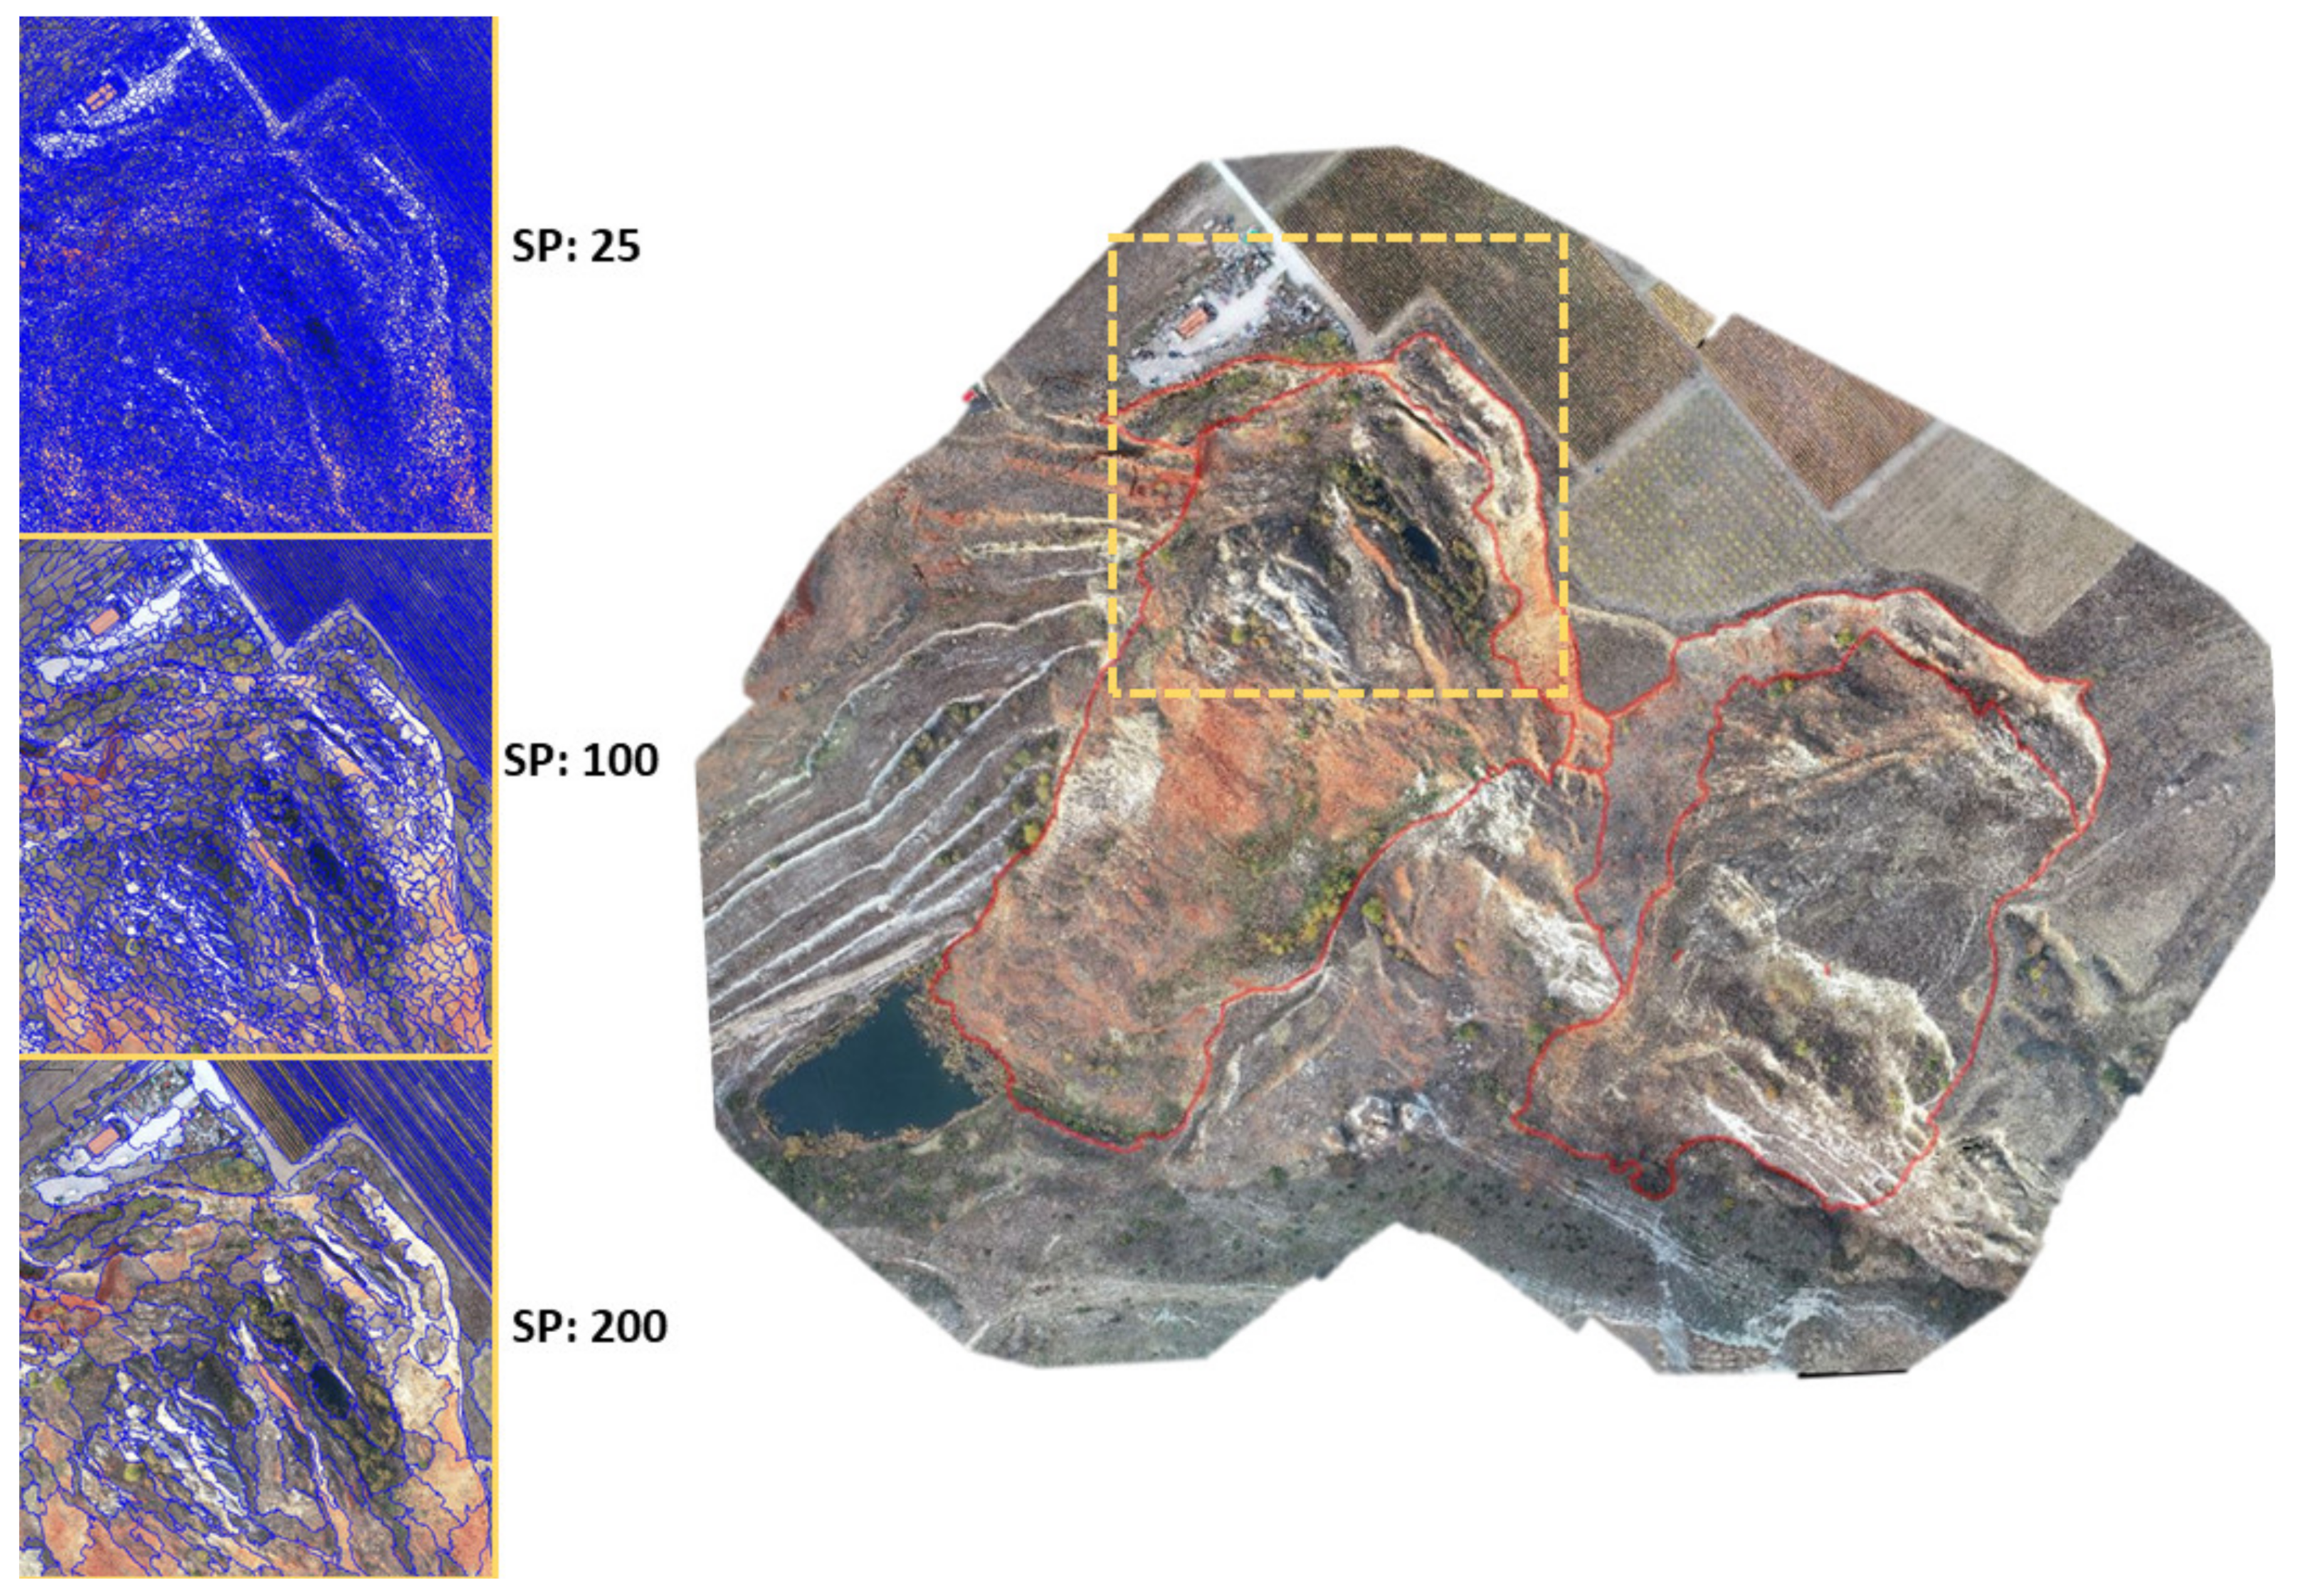
The segmentation is an essential phase for the accurate production of landslide maps through OBIA. For this reason, the MRS algorithm as implemented in eCognition was applied on the two input data structures as described earlier. In detail, the input structures were segmented by using seven distinct SPs. The ESP 2 tool produces a table output where the local variance (LV) values are recorded in relation to the segmentation level. Based on the result, we selected the first peak of the LV graph and called it “fine” SP of ESP 2, while the second significant peak in the graph has been chosen to form the “coarse” SP level. The different configurations and settings are presented in Table 1 and Table 2. An example of three incremental SPs is illustrated in Figure 6. It should be noted that low SP values resulted in a large number of objects and consequently in a larger number for the training samples and vice-versa. The number of objects resulting from segmentation setups and used for training (60%) and validation (40%) ranged from 2500 objects to more than 1,200,000 objects.
4.2. Classification
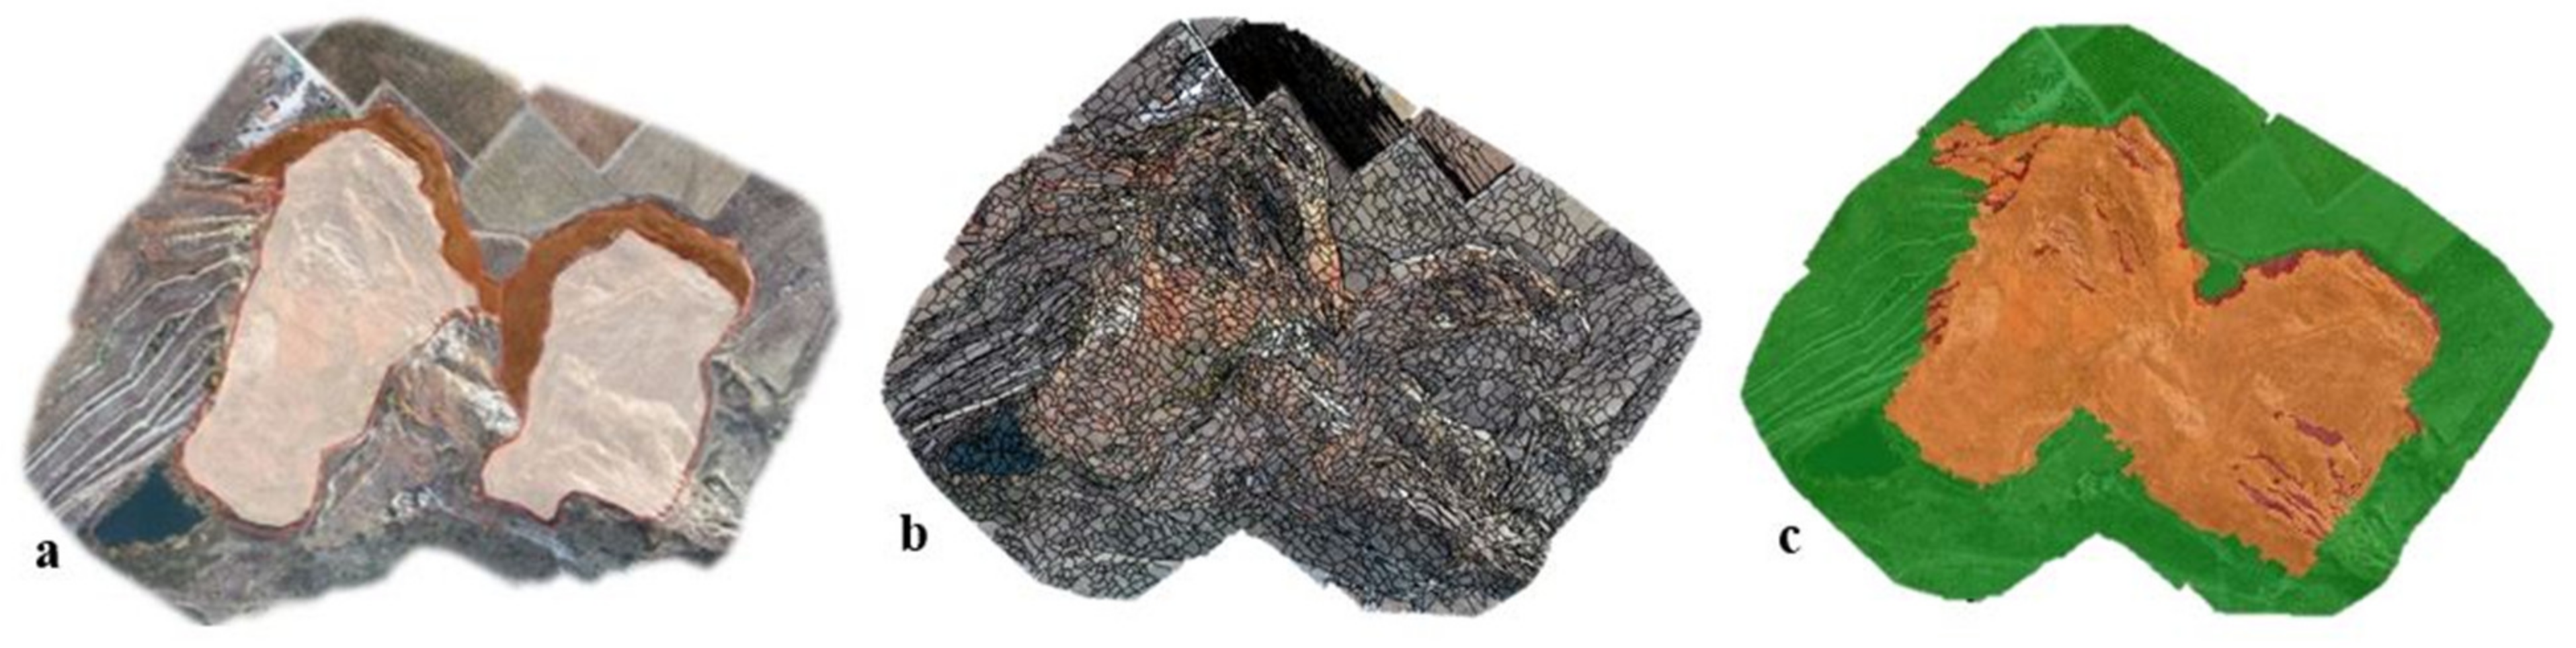
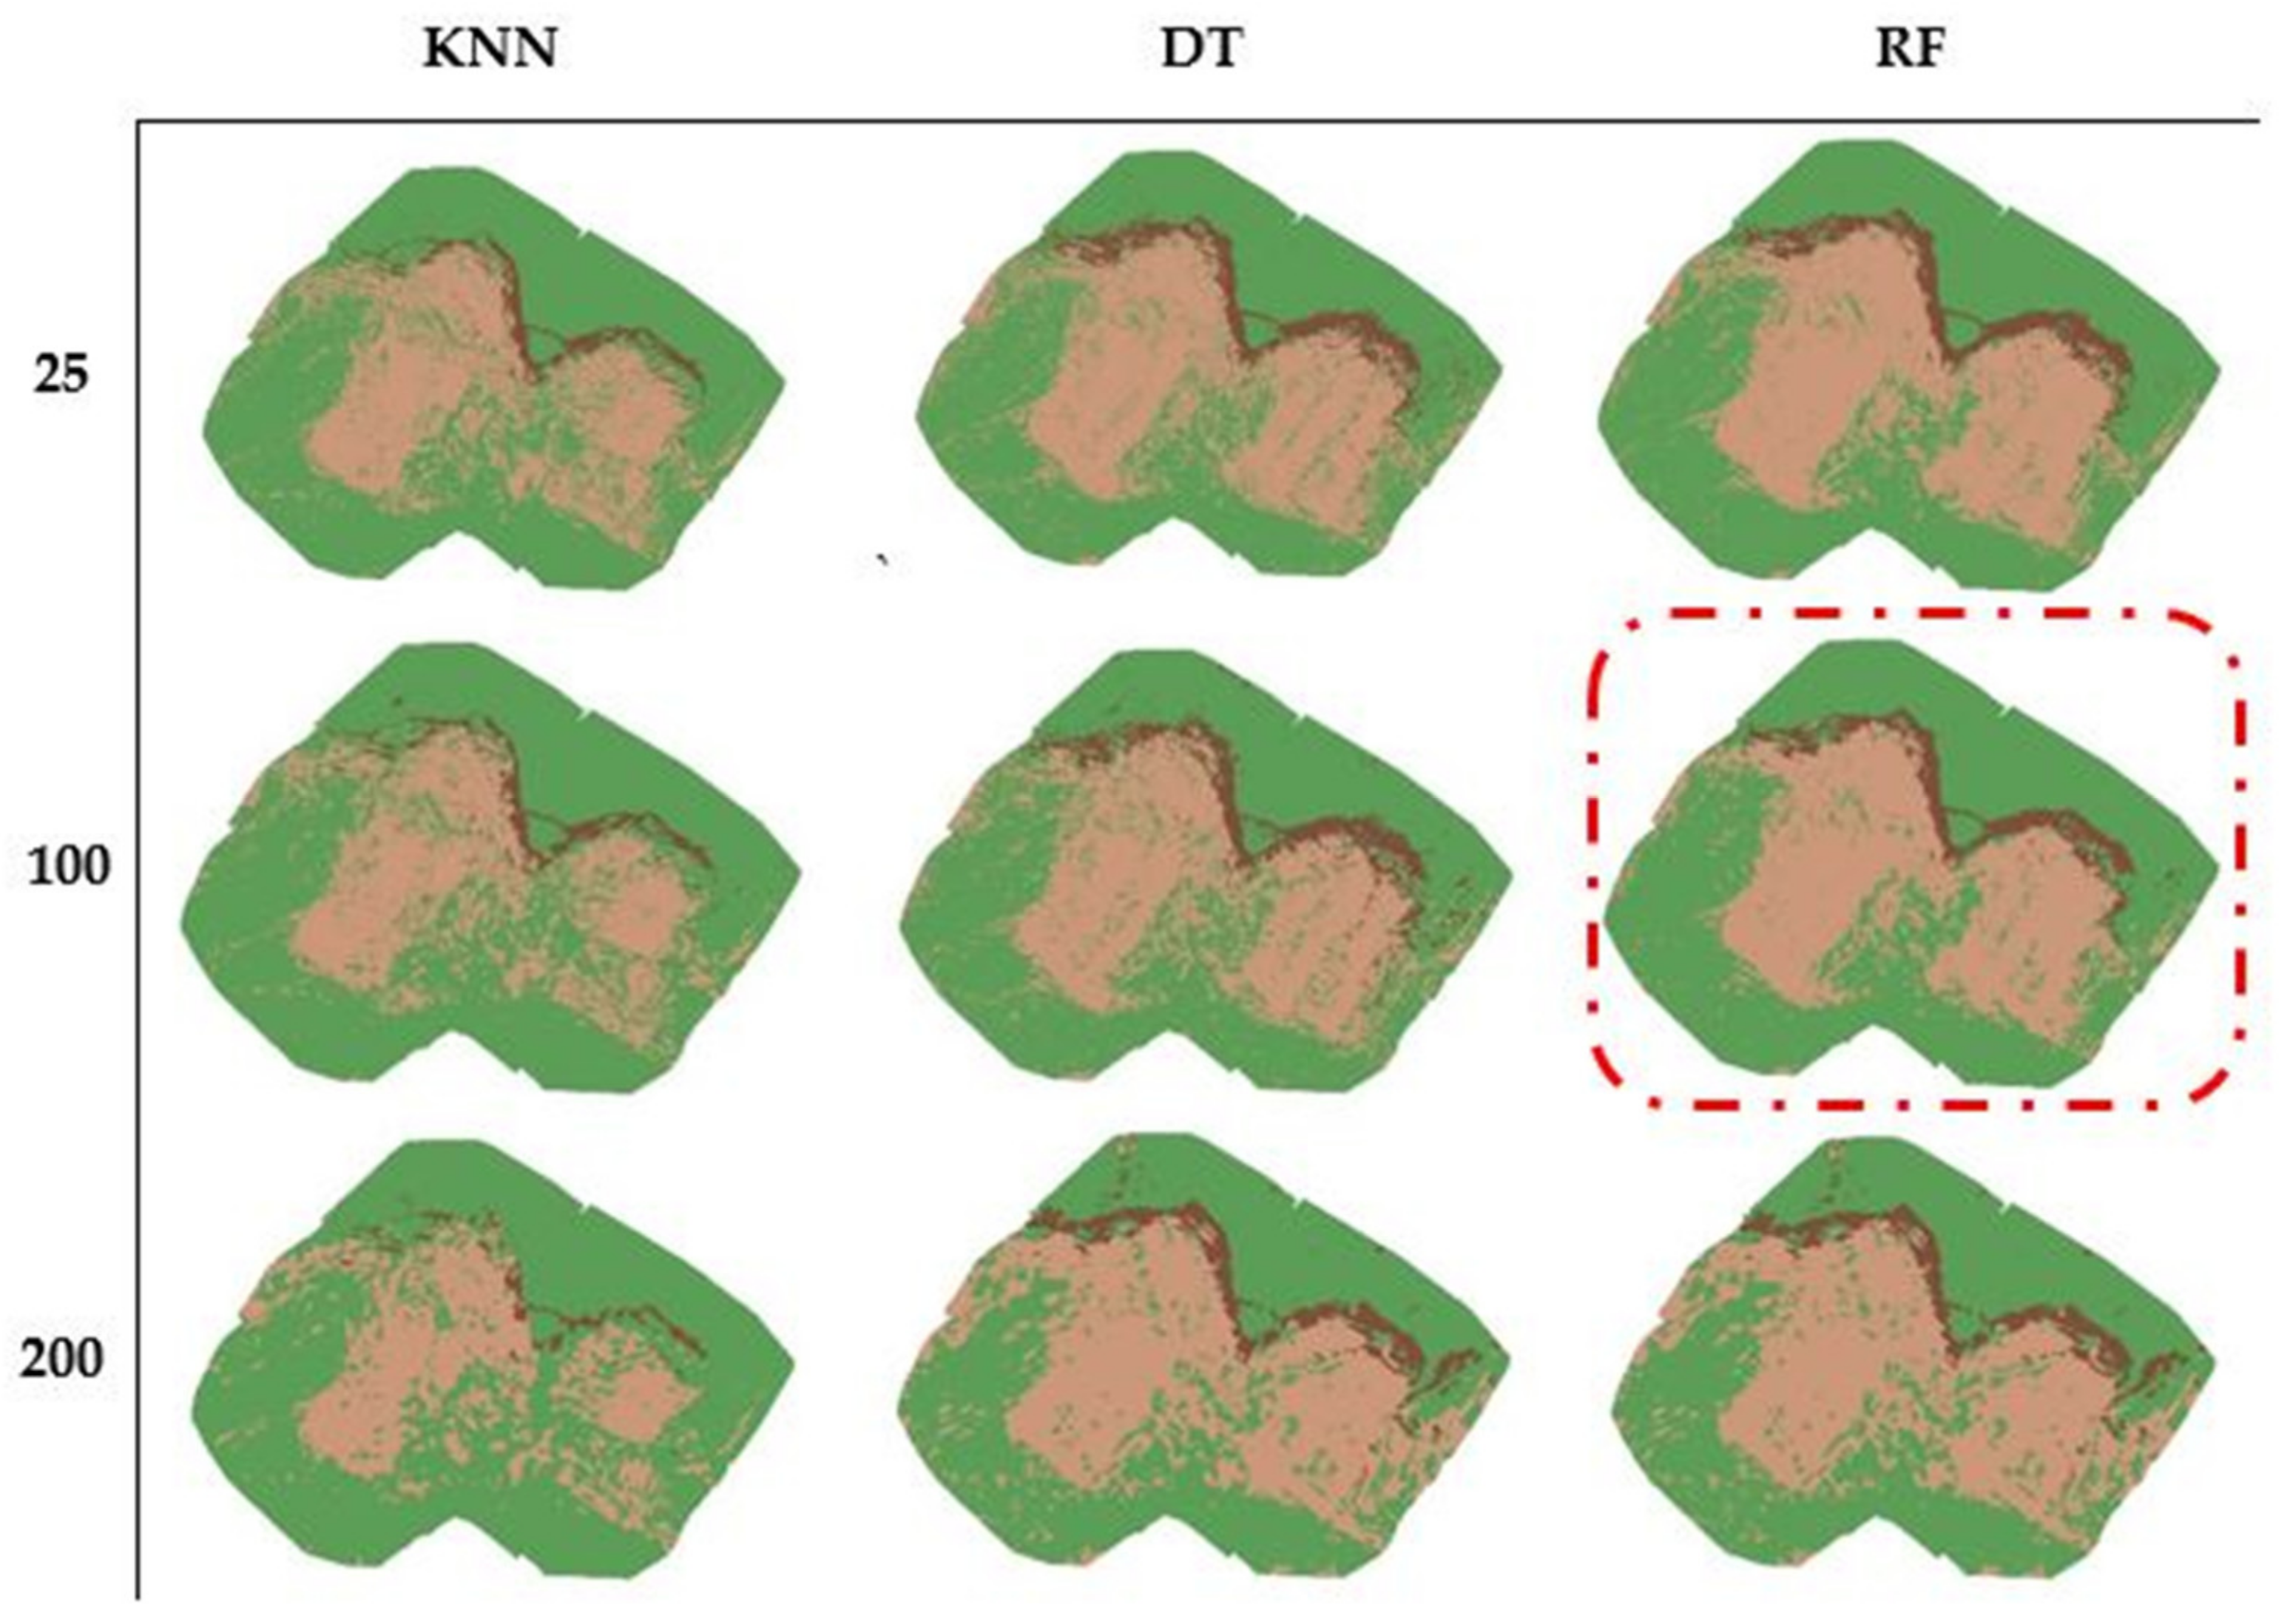
Initially, a knowledge-based ruleset has been developed using cognitive knowledge of landslide features and fuzzy membership functions to map the three predefined classes. The membership functions were constructed based on expert knowledge and the specific parameters selected after the feature analysis and comparison with the reference dataset. The classification results are illustrated in Figure 7 for the rule-based workflow, while, in Figure 8, examples of the results from the ML classifiers (shape: 0.6) based on the RGB+DSM structure are presented. It should be noted that the KNN algorithm has been proven inefficient for classifying heterogeneous datasets in terms of agreement performances. On the other hand, DTs and RFs were found superior for landslide mapping purposes. The workflow has been implemented on the Microsoft Windows 10 interface, with an Intel Core i9-9900K CPU, Z390 Gaming Pro Carbon motherboard and 32 GB RAM (Intel, Thessaloniki, Greece). Computational costs are illustrated in Table 3, which represent the specific time needed for the implementations of the algorithms within eCognition software.
To evaluate the performance of the classifiers, the quality metrics of precision, recall, and harmonized F1 score were examined. The first two indexes are often interrelated which means improving precision consistently reduces recall. The exported classified objects were transferred in an error matrix to correlate the classification results from different classifiers against the reference data. In general, the combination of spectral (orthophoto) and topological (DSM and derivatives) data outperformed the structure including only the spectral information. From all configurations tested, 54 classifications were extracted, with 13 of them resulting in an agreement of higher than 75% and four of them resulting in an agreement of higher than 80%, with the highest performance being with the RF classifier. Results show that the largest source of error is indicated at the scarp zones being classified as depletion due to the diffusing zone boundaries (Figure 8). The latter has resulted from the vegetation growth and the weathering effect which diminished the borders of the landslide sub-zones. The best classification configuration for the Amyntaio (pilot) landslide site, in terms of the overall agreement, was obtained using the RF classifier with the RGB+DSM structure with a value of 100 for the SP and a shape/color weight of 0.6. The recall and precision obtained were 0.83 and 0.86, respectively, and the overall model classification agreement (F1) was 0.85. As a result, 85% of the total scene was correctly identified as being either a scarp, depletion, or non-affected zone.
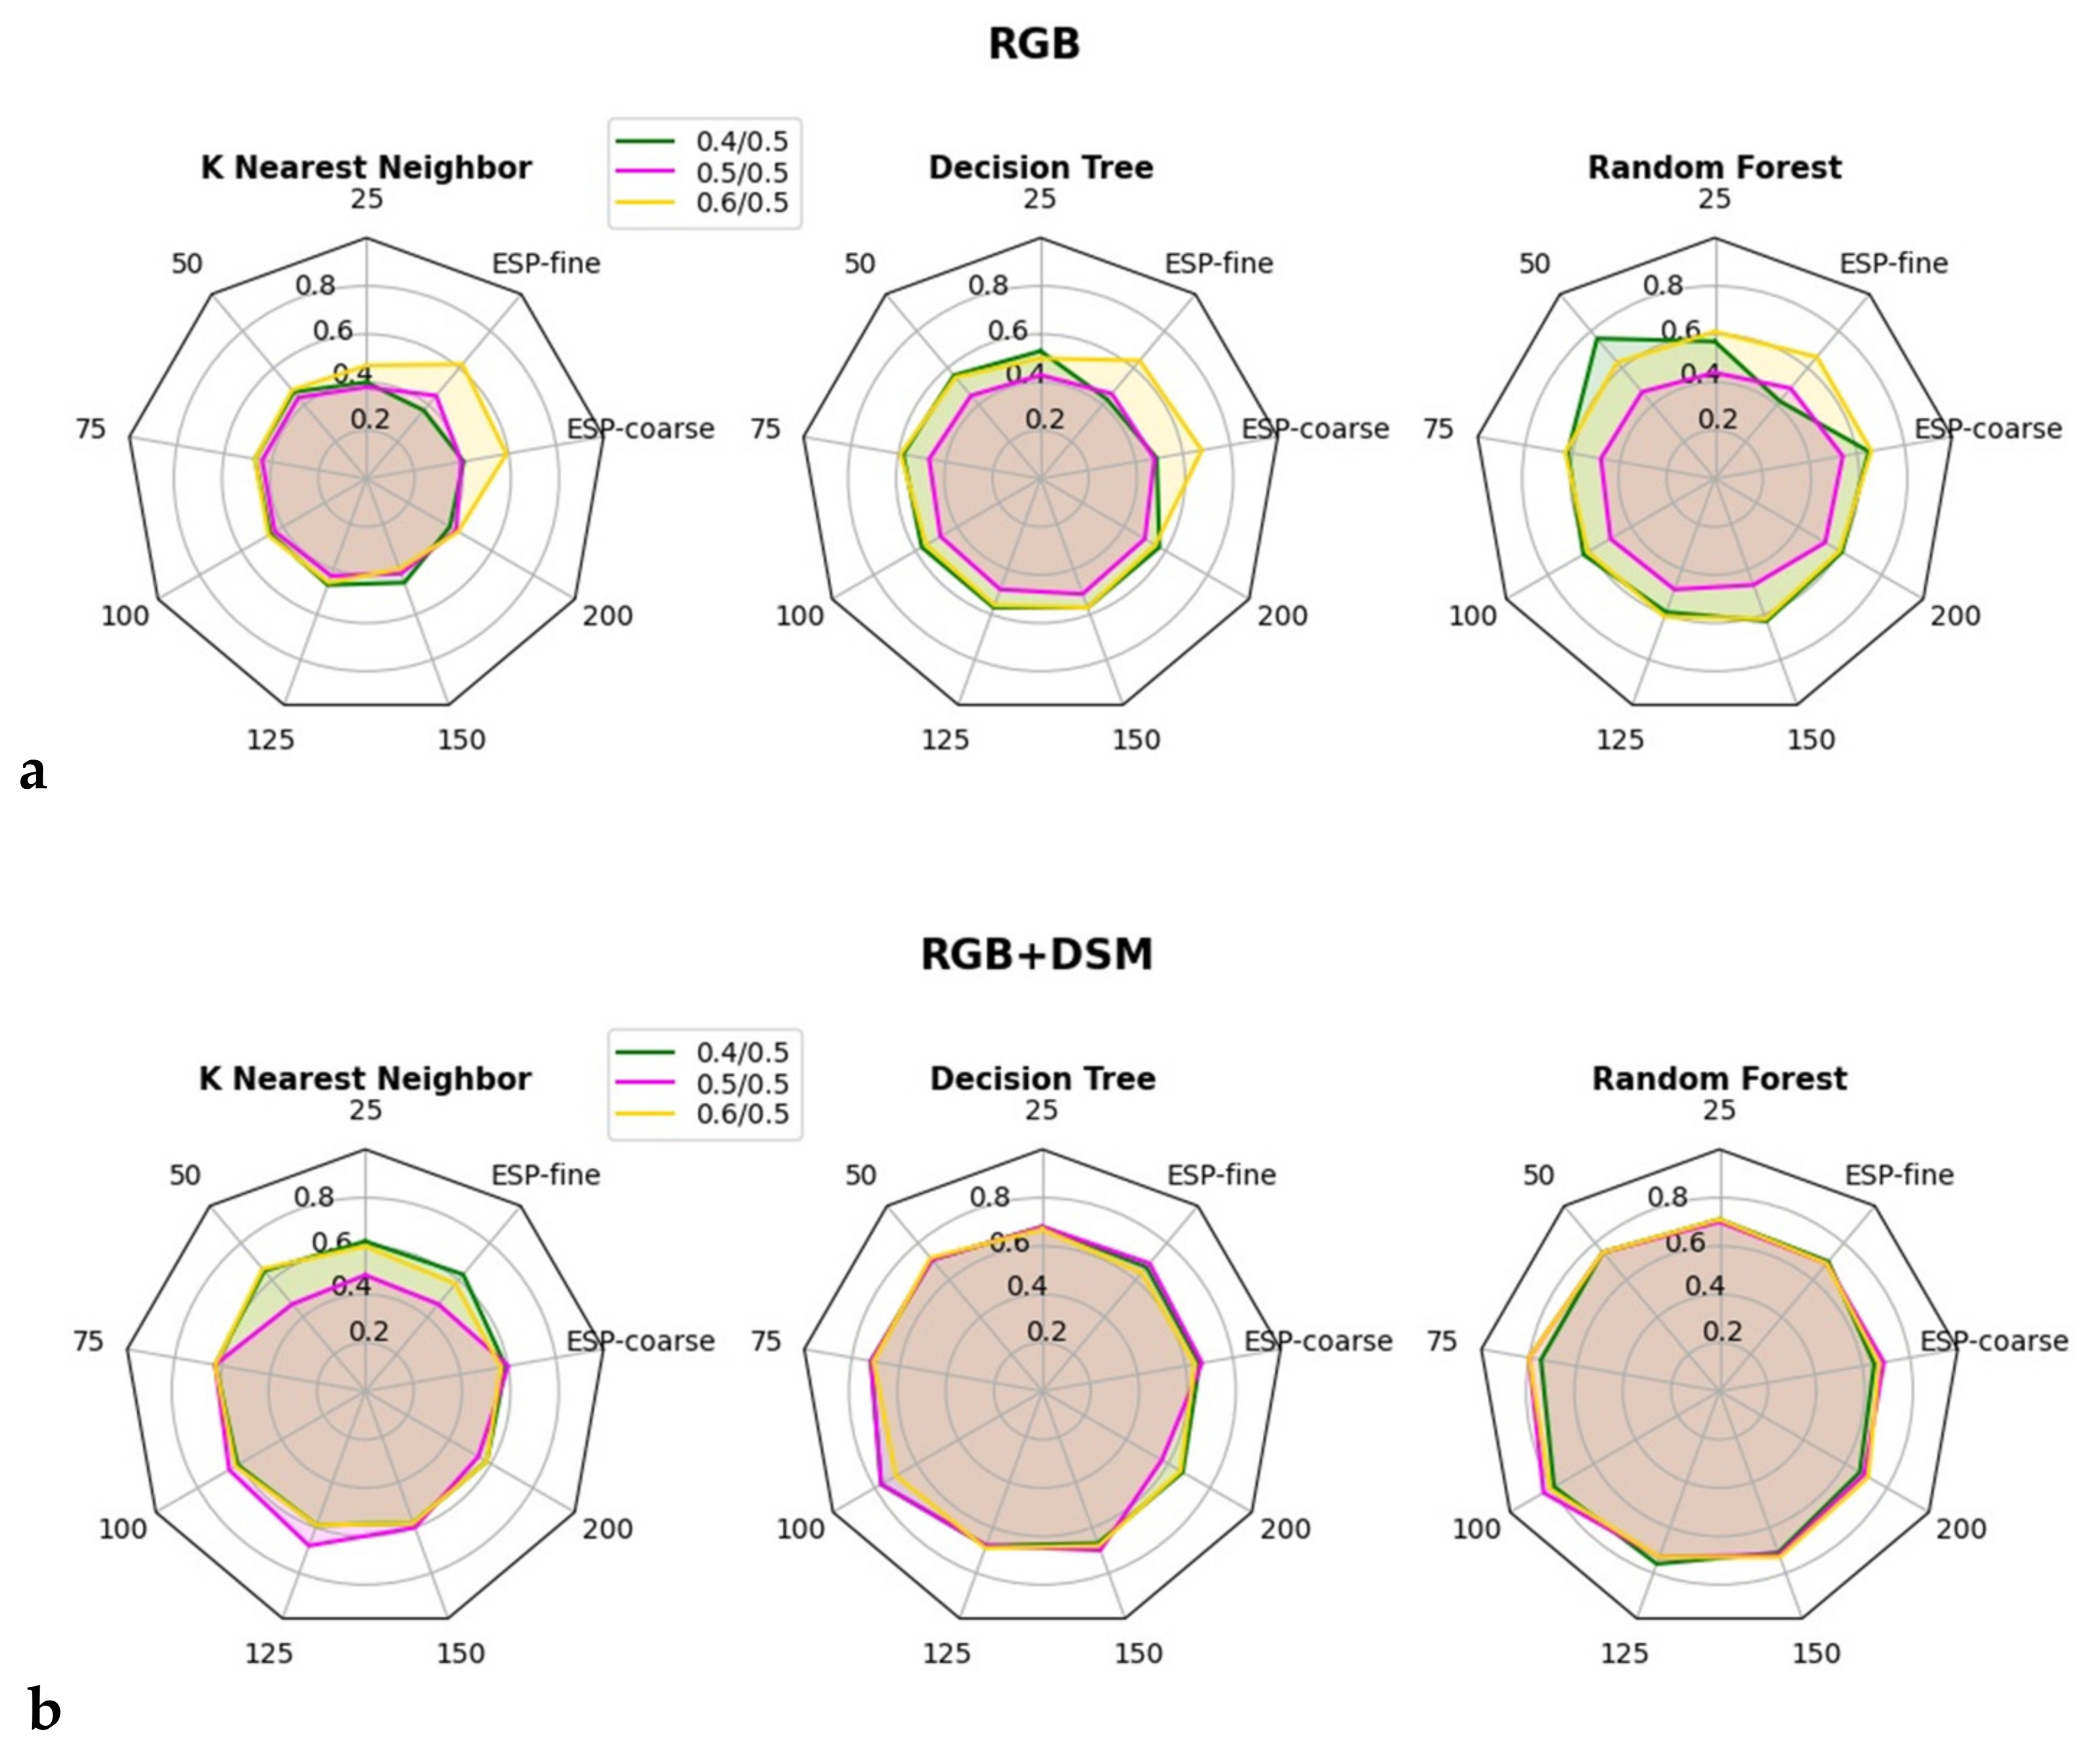
Despite KNN’s overall low performance, as the shape/color weight was increased, KNNs performed almost identically to DT. In general, the best results could be achieved when using SPs of 75 and 100 and a shape/color weight factor of 0.5 and 0.6, with the latter configuration resulting in better overall performance. The remarkably better performance of the RF classifier compared to others is due to its explicit adaptability to training data. Results are highlighting KNN’s weakness in dealing with heterogeneous natural environments and complex scenes such as landslide sub-zone mapping. Classification performances regarding the F1 index for RGB and RGB+DSM structures are also visualized with radar diagrams in Figure 9, highlighting the superiority of RF against the other two approaches especially regarding the RGB+DSM setup. The recall’s low values for SPs greater than 100 indicate that little relevant information was retrieved, and that under-prediction has occurred. Similar patterns have been observed for small SPs. It should be noted that the KNN and DT models presented decreased agreements compared to the RF model, especially for the scarp zones. The latter can be explained due to the smaller number of samples for the scarp zone which resulted in poor detection performances. This indicates that, in order to improve our model, we should collect more samples from the least-represented classes, particularly from scarp zones.
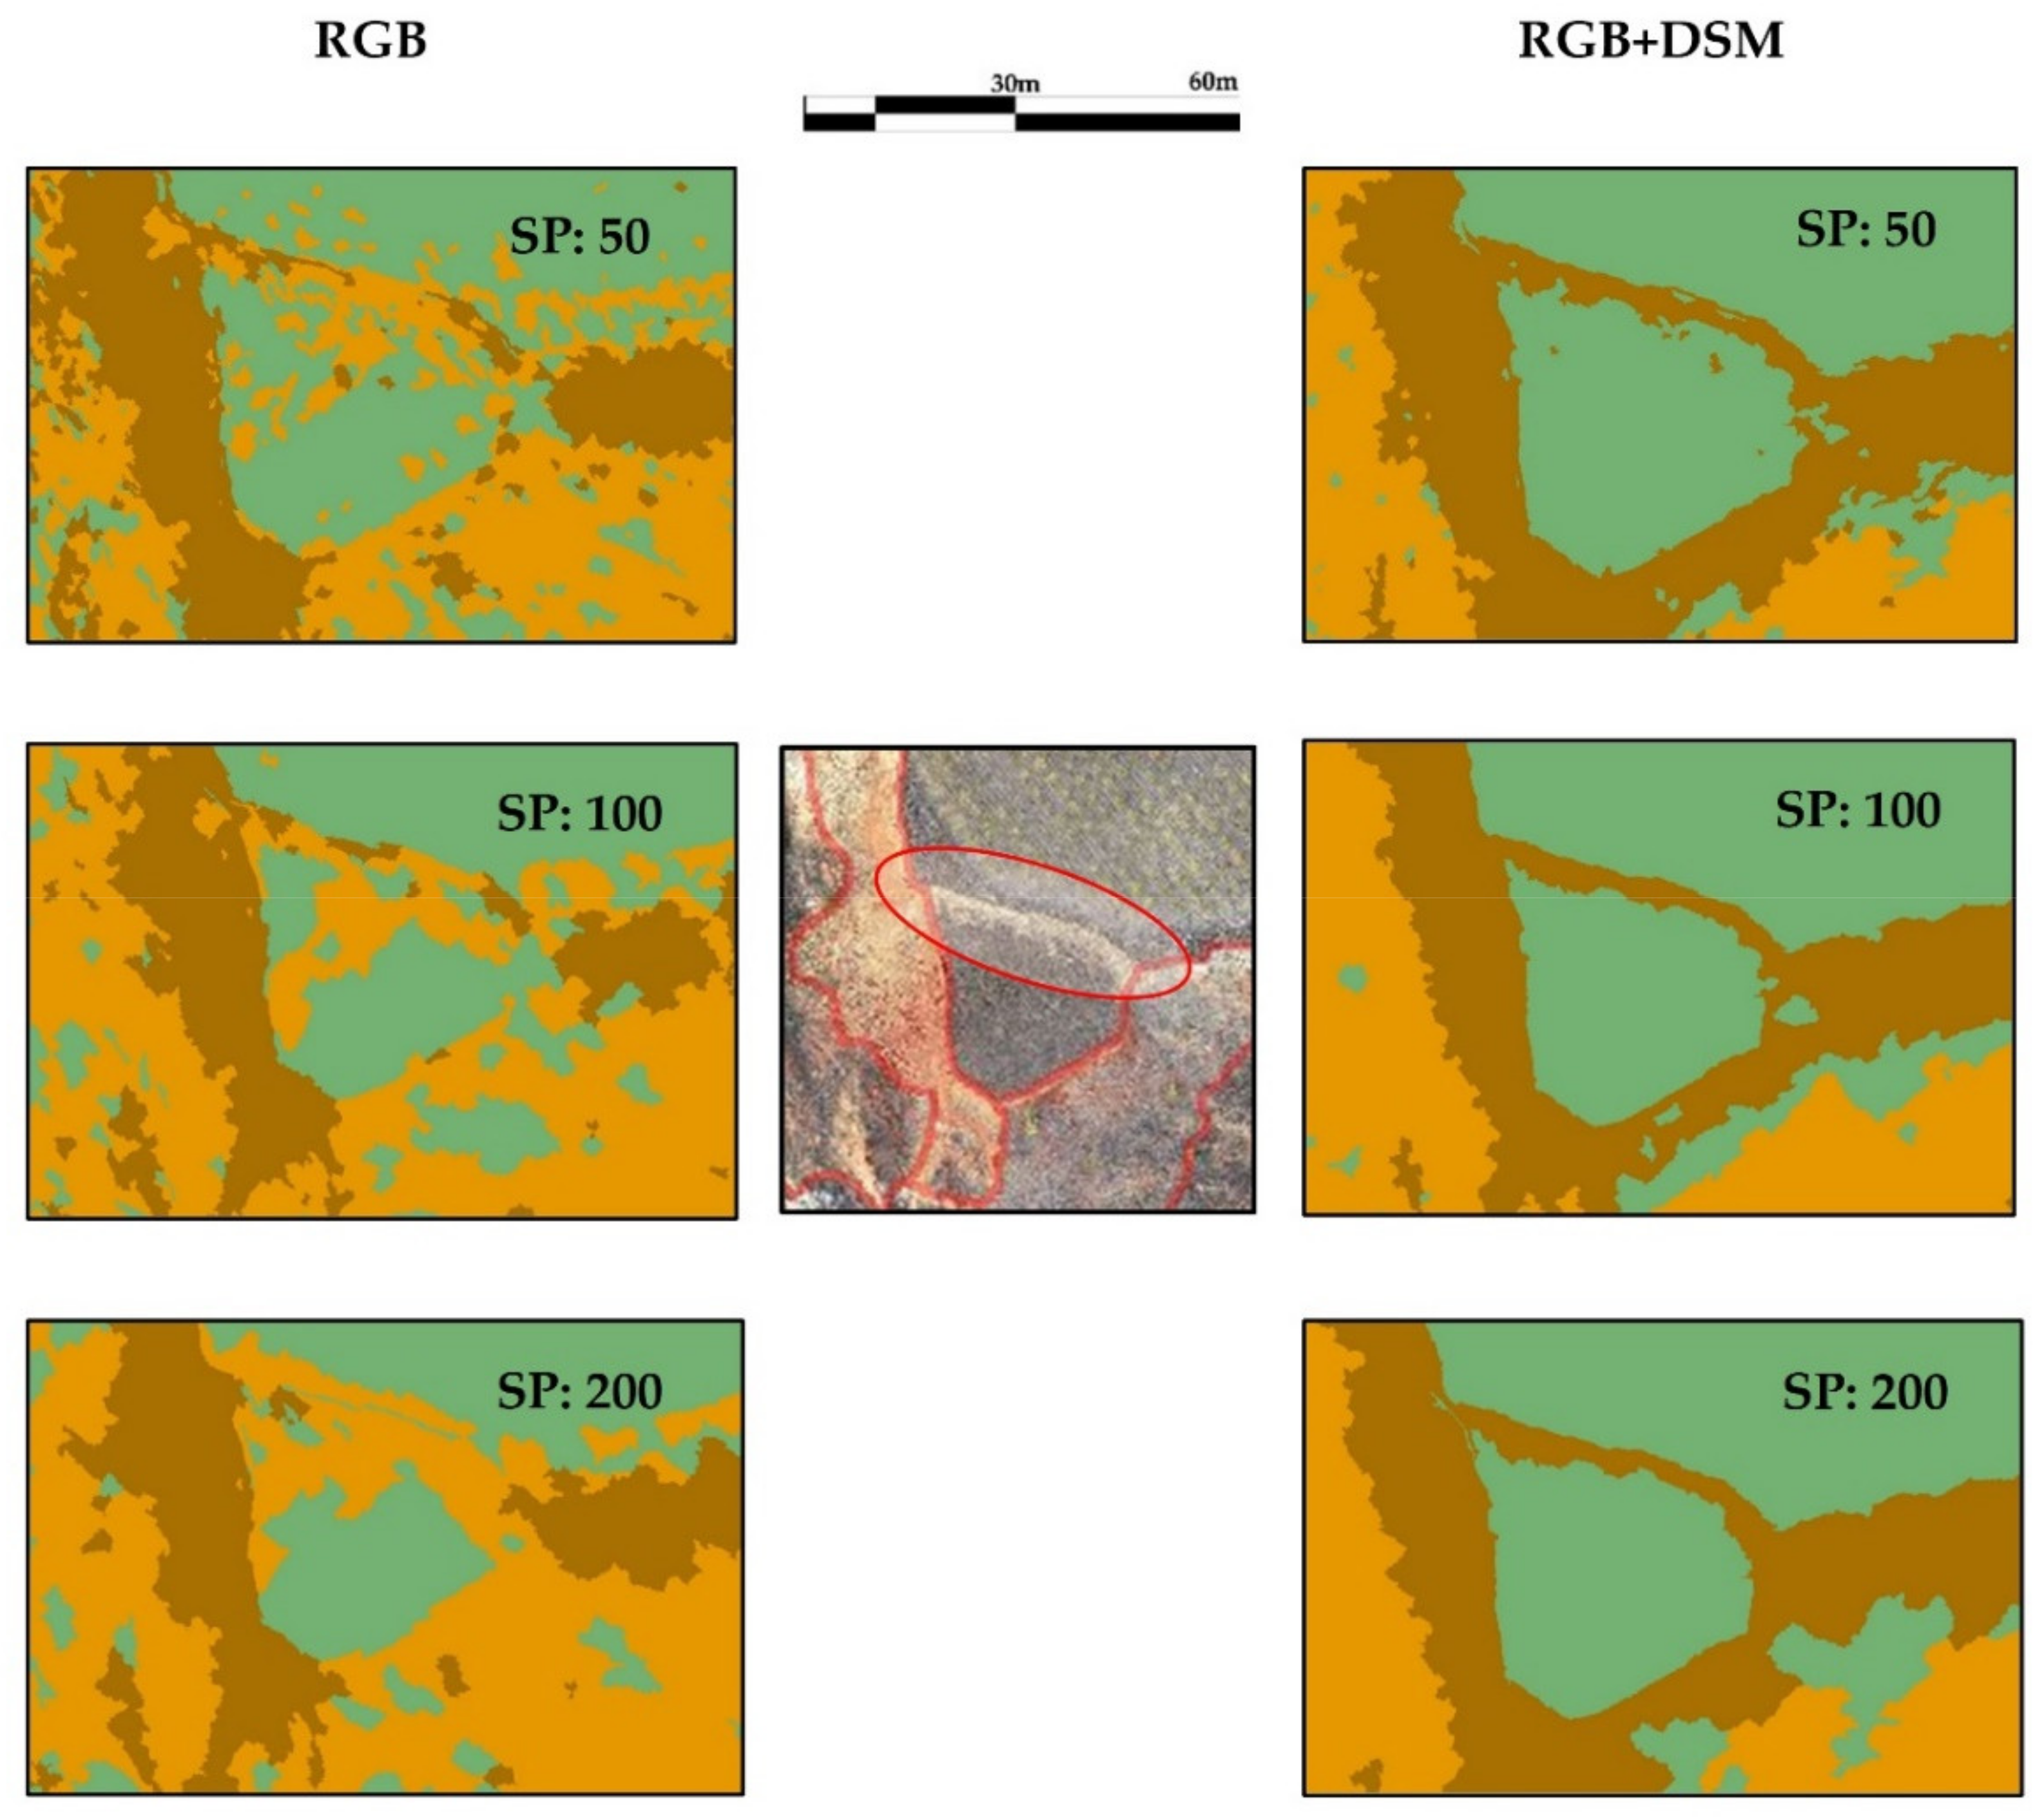
In Figure 10, a representative example for three incremental SPs is highlighted. RGB structure (spectral information solely) has resulted in mixed classification results, and it was found inefficient at classifying the different landslide sub-zones. Specifically, the discrimination between scarp and depletion zones was found to be the most challenging due to the existing geomorphological similarities when compared with the non-affected zone and the natural processes of weathering. However, with the integration of the elevation dataset and its derivatives, the mapping efficiency could be significantly increased. It should be noted that a scarp zone that was not found in the reference has been identified and validated from the visual inspection of the results, indicating the applicability of OBIA methods.
4.3. OBIA Workflow Transferability
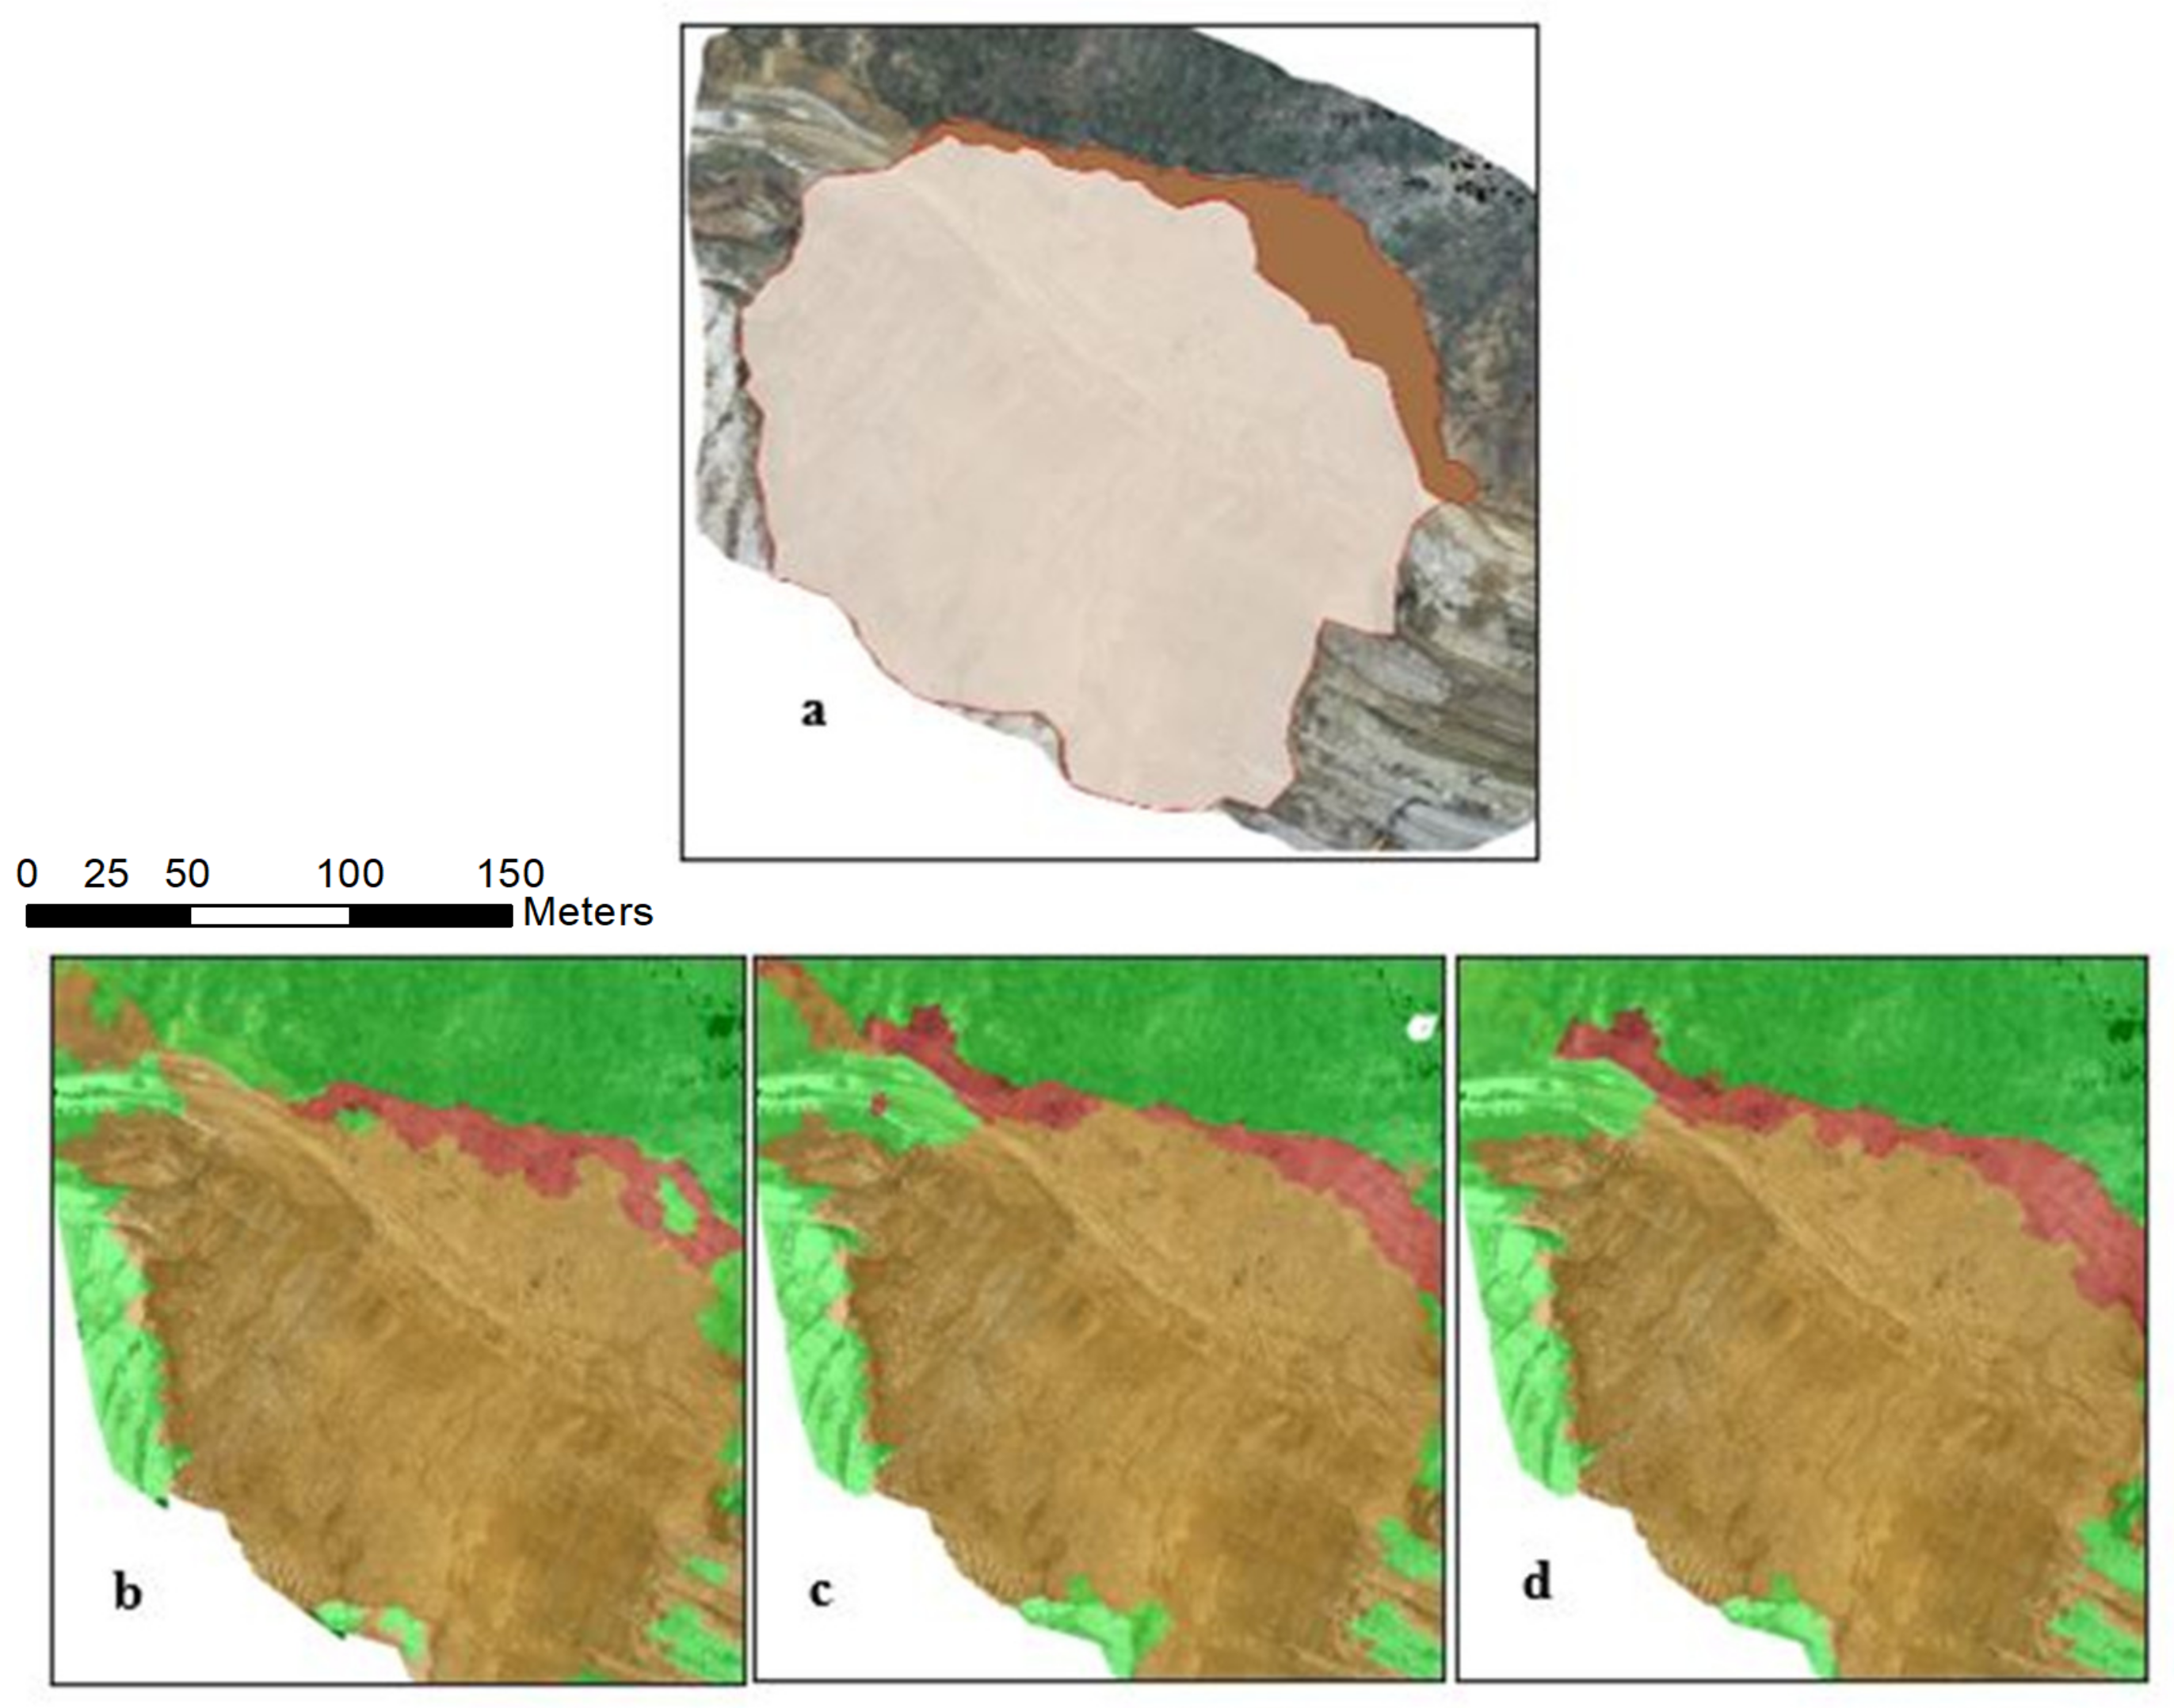
In order to test the transferability of the developed methodology, the most efficient classification configuration determined from the previous tests (input data structure: RGB+DSM, SP: 100 and shape/color weight: 0.6) was applied to the “Prosilio” landslide, which constitutes a similar failure in the wider region of the prefecture under the same landslide characteristics as the Amyntaio case (geological, lithological, failure type). Transferability constitutes a critical issue in image classification. As the ultimate goal is to provide a ready-to-use landslide mapping tool, a transferability study of the final classification workflow was conducted. The same object features and processes for segmentation and classification have been followed to keep a uniform implementation approach. Considering the extracted F1 metrics (Table 4), the RF model for the RGB+DSM structure illustrated the best classification agreement. A comparison of KNN, DT, and RF results is shown in Figure 11.
5. Discussion
In this study, the impact of the SP on three selected ML algorithms for detailed landslide zone mapping with UAV datasets using object-based methods has been evaluated. It is important to underline some limitations such as the precise detection and characterization of landslide geomorphic characteristics will always remain a challenge in the field of landslide mapping due to the dynamic nature of the phenomena. However, compared to airborne platforms and expensive very high-resolution (VHR) satellite data, classification results based on UAV data indicate a high potential for site-specific landslide zoning using an object-based ML classification workflow. The DSM and its derivatives proved critical for accurate and precise mapping in site-specific zoning of the landslide’s extent due to their characteristic morphometric patterns and signatures. On the contrary, spectral information solely from the RGB setup was not adequate to classify the segmented scene with supervised procedures in an effective manner. Furthermore, the tuning of segmentation parameters had a significant impact on the classification results. Large SPs resulted in undersegmented regions and vice-versa, leading to objects that did not well represent landslide objects. Defining the optimal SP while keeping the balance between over- and under-segmentation is a pre-condition and is a known challenge in OBIA. Similar studies such as Mohan Vamsee et al. [68] have outlined that SP selection is the most crucial step for an optimal classification result. Results indicate that RF is a powerful method for the classification of landslides with UAV-derived datasets, and, in general, it showed better performances compared to KNN and DT. Further research should focus on the optimization of the ML parameters, and more individually on the RF classifier, for enhancing the final classification agreement.
Concisely, from the implemented methods, RF and DT offer reasonable performances in relation to their computational costs, with the RF outperforming the DT. A challenge that remains is the optimal and objective selection of segmentation settings in a semi-automated approach considering class heterogeneity. Landslide phenomena represent natural scenes of complex and heterogeneous character. Such natural processes can be better understood by analyzing them with OBIA since this approach mimics the way humans recognize patterns. The proposed methodology can be adapted for different landslide types and processes. This study demonstrated that UAV platforms can provide valuable information for the discrimination of specific landslide zones. The selection of an appropriate method, i.e., an expert-based or ML approach, depends on the availability of training data and the scope of the study. Expert-based methods are more flexible and adaptive for site-specific landslide mapping compared to ML which needs a large number of training data. This suggests that the knowledge-based approach is applicable for similar failure mechanisms. By using OBIA for site-specific landslide assessment, sub-zones of the rotational landslides could be effectively identified with high precision. A limitation is the need for prior knowledge of the site under investigation in order to optimally adapt the ruleset. Moreover, the proposed object-based analysis workflow can be considered as site-adaptive for rotational landslide events. Automated landslide characterization approaches on a local scale can support the creation of informative landslide inventories with advanced semantic knowledge to be accompanied (relation among predefined slope zones), as presented also by Amatya et al. [69]. In addition, the sub-zones could be further used as inputs for site-specific landslide hazard and risk assessment by public authorities such as the Civil Protection. Future research directions should focus on improving automated sub-zone classification for different landslide types. In addition, the integration of deep learning and OBIA for landslide susceptibility mapping using UAV datasets is proposed as a future consideration.
6. Conclusions
UAVs have demonstrated their potential for landslide mapping investigation in terms of time, cost, and spatial resolution for efficient data collection after landslide events. ML algorithms and especially RF implemented in an integrated OBIA workflow proved to be adaptable for sub-zone landslide mapping purposes on a local scale. Due to the escalation in the frequency of extreme meteorological events driven by climate change, it is conceivable that more hazardous events will take place around the world in the near future. The integration of UAV datasets and SfM in combination with the advancements in OBIA and AI can serve as a response by enabling precise and accurate analysis of landslide and rockfall failures. Our results show that rotational landslides and their thematic sub-zones were recognized and mapped sufficiently from the ML procedure. The automatic sub-zones identification could be a key element for improving the quality of landslide susceptibility assessments through realistic 3D physical-based models. Further research should focus on further increasing the automation of the proposed OBIA workflow for mapping and characterizing different landslide types and processes.
Author Contributions
Conceptualization, E.K. and D.H.; methodology, E.K.; software, E.K.; validation, E.K.; formal analysis, E.K.; investigation, E.K.; resources, E.K.; data curation, E.K.; writing—original draft preparation, E.K. and D.H.; writing—review and editing, E.K., V.M., E.V., and D.H.; visualization, E.K.; supervision, V.M. and E.V.; project administration, E.K.; funding acquisition, E.K. and V.M. All authors have read and agreed to the published version of the manuscript.
Funding
This research is co-financed by Greece and the European Union (European Social Fund- ESF) through the Operational Program «Human Resources Development, Education and Lifelong Learning» in the context of the project “Strengthening Human Resources Research Potential via Doctorate Research” (MIS-5000432), implemented by the State Scholarships Foundation (ΙΚΥ).
Acknowledgments
The authors would like to thank eCognition Trimble for their assistance and support.
Conflicts of Interest
The authors declare no conflict of interest.
References
- Van Westen, C.J.; van Asch, T.W.J.; Soeters, R. Landslide Hazard and Risk Zonation—Why Is It Still so Difficult? Bull. Eng. Geol. Environ. 2006, 65, 167–184. [Google Scholar] [CrossRef]
- Steiakakis, E.; Kavouridis, K.; Monopolis, D. Large Scale Failure of the External Waste Dump at the “South Field” Lignite Mine, Northern Greece. Eng. Geol. 2009, 104, 269–279. [Google Scholar] [CrossRef]
- Parise, M. Landslide Mapping Techniques and Their Use in the Assessment of the Landslide Hazard. Phys. Chem. Earth Part. C Sol. Terr. Planet. Sci. 2001, 26, 697–703. [Google Scholar] [CrossRef]
- Zhong, C.; Liu, Y.; Gao, P.; Chen, W.; Li, H.; Hou, Y.; Nuremanguli, T.; Ma, H. Landslide Mapping with Remote Sensing: Challenges and Opportunities. Int. J. Remote Sens. 2020, 41, 1555–1581. [Google Scholar] [CrossRef]
- Raspini, F.; Bianchini, S.; Ciampalini, A.; Del Soldato, M.; Solari, L.; Novali, F.; Del Conte, S.; Rucci, A.; Ferretti, A.; Casagli, N. Continuous, Semi-Automatic Monitoring of Ground Deformation Using Sentinel-1 Satellites. Sci. Rep. 2018, 8, 7253. [Google Scholar] [CrossRef] [PubMed] [Green Version]
- Matese, A.; Toscano, P.; Di Gennaro, S.; Genesio, L.; Vaccari, F.; Primicerio, J.; Belli, C.; Zaldei, A.; Bianconi, R.; Gioli, B. Intercomparison of UAV, Aircraft and Satellite Remote Sensing Platforms for Precision Viticulture. Remote Sens. 2015, 7, 2971–2990. [Google Scholar] [CrossRef] [Green Version]
- Pepe, A.; Calo, F. A Review of Interferometric Synthetic Aperture RADAR (InSAR) Multi-Track Approaches for the Retrieval of Earth’s Surface Displacements. Appl. Sci. 2017, 7, 1264. [Google Scholar] [CrossRef] [Green Version]
- Casagli, N.; Cigna, F.; Bianchini, S.; Hölbling, D.; Füreder, P.; Righini, G.; Del Conte, S.; Friedl, B.; Schneiderbauer, S.; Iasio, C.; et al. Landslide Mapping and Monitoring by Using Radar and Optical Remote Sensing: Examples from the EC-FP7 Project SAFER. Remote Sens. Appl. Soc. Environ. 2016, 4, 92–108. [Google Scholar] [CrossRef] [Green Version]
- Ham, Y.; Han, K.K.; Lin, J.J.; Golparvar-Fard, M. Visual Monitoring of Civil Infrastructure Systems via Camera-Equipped Unmanned Aerial Vehicles (UAVs): A Review of Related Works. Vis. Eng. 2016, 4, 1. [Google Scholar] [CrossRef] [Green Version]
- Greenwood, W.W.; Lynch, J.P.; Zekkos, D. Applications of UAVs in Civil Infrastructure. J. Infrastruct. Syst. 2019, 25, 04019002. [Google Scholar] [CrossRef]
- Valkaniotis, S.; Papathanassiou, G.; Ganas, A. Mapping an Earthquake-Induced Landslide Based on UAV Imagery; Case Study of the 2015 Okeanos Landslide, Lefkada, Greece. Eng. Geol. 2018, 245, 141–152. [Google Scholar] [CrossRef]
- Achille, C.; Adami, A.; Chiarini, S.; Cremonesi, S.; Fassi, F.; Fregonese, L.; Taffurelli, L. UAV-Based Photogrammetry and Integrated Technologies for Architectural Applications—Methodological Strategies for the After-Quake Survey of Vertical Structures in Mantua (Italy). Sensors 2015, 15, 15520–15539. [Google Scholar] [CrossRef] [PubMed] [Green Version]
- Fernández-Hernandez, J.; González-Aguilera, D.; Rodríguez-Gonzálvez, P.; Mancera-Taboada, J. Image-Based Modelling from Unmanned Aerial Vehicle (UAV) Photogrammetry: An Effective, Low-Cost Tool for Archaeological Applications: Image-Based Modelling from UAV Photogrammetry. Archaeometry 2015, 57, 128–145. [Google Scholar] [CrossRef]
- Vassilakis, E.; Foumelis, M.; Erkeki, A.; Kotsi, E.; Lekkas, E. Post-Event Surface Deformation of Amyntaio Slide (Greece) by Complementary Analysis of Remotely Piloted Airborne System Imagery and SAR Interferometry. Appl. Geomat. 2020, 13, 65–67. [Google Scholar] [CrossRef]
- Hemmelder, S.; Marra, W.; Markies, H.; De Jong, S.M. Monitoring River Morphology & Bank Erosion Using UAV Imagery—A Case Study of the River Buëch, Hautes-Alpes, France. Int. J. Appl. Earth Obs. Geoinf. 2018, 73, 428–437. [Google Scholar] [CrossRef]
- Jin, X.; Liu, S.; Baret, F.; Hemerlé, M.; Comar, A. Estimates of Plant Density of Wheat Crops at Emergence from Very Low Altitude UAV Imagery. Remote Sens. Environ. 2017, 198, 105–114. [Google Scholar] [CrossRef] [Green Version]
- Manfreda, S.; McCabe, M.; Miller, P.; Lucas, R.; Pajuelo Madrigal, V.; Mallinis, G.; Ben Dor, E.; Helman, D.; Estes, L.; Ciraolo, G.; et al. On the Use of Unmanned Aerial Systems for Environmental Monitoring. Remote Sens. 2018, 10, 641. [Google Scholar] [CrossRef] [Green Version]
- Eltner, A.; Kaiser, A.; Castillo, C.; Rock, G.; Neugirg, F.; Abellán, A. Image-Based Surface Reconstruction in Geomorphometry –Merits, Limits and Developments. Earth Surf. Dyn. 2016, 4, 359–389. [Google Scholar] [CrossRef] [Green Version]
- Gindraux, S.; Boesch, R.; Farinotti, D. Accuracy Assessment of Digital Surface Models from Unmanned Aerial Vehicles’ Imagery on Glaciers. Remote Sens. 2017, 9, 186. [Google Scholar] [CrossRef] [Green Version]
- Colomina, I.; Molina, P. Unmanned Aerial Systems for Photogrammetry and Remote Sensing: A Review. ISPRS J. Photogramm. Remote Sens. 2014, 92, 79–97. [Google Scholar] [CrossRef] [Green Version]
- Giordan, D.; Adams, M.S.; Aicardi, I.; Alicandro, M.; Allasia, P.; Baldo, M.; De Berardinis, P.; Dominici, D.; Godone, D.; Hobbs, P.; et al. The Use of Unmanned Aerial Vehicles (UAVs) for Engineering Geology Applications. Bull. Eng. Geol. Environ. 2020, 79, 3437–3481. [Google Scholar] [CrossRef] [Green Version]
- Peppa, M.V.; Mills, J.P.; Moore, P.; Miller, P.E.; Chambers, J.E. Brief Communication: Landslide Motion from Cross Correlation of UAV-Derived Morphological Attributes. Nat. Hazards Earth Syst. Sci. 2017, 17, 2143–2150. [Google Scholar] [CrossRef] [Green Version]
- Lucieer, A.; de Jong, S.M.; Turner, D. Mapping Landslide Displacements Using Structure from Motion (SfM) and Image Correlation of Multi-Temporal UAV Photography. Prog. Phys. Geogr. Earth Environ. 2014, 38, 97–116. [Google Scholar] [CrossRef]
- D’Oleire-Oltmanns, S.; Marzolff, I.; Peter, K.; Ries, J. Unmanned Aerial Vehicle (UAV) for Monitoring Soil Erosion in Morocco. Remote Sens. 2012, 4, 3390–3416. [Google Scholar] [CrossRef] [Green Version]
- Hölbling, D.; Friedl, B.; Eisank, C. An Object-Based Approach for Semi-Automated Landslide Change Detection and Attribution of Changes to Landslide Classes in Northern Taiwan. Earth Sci. Inform. 2015, 8, 327–335. [Google Scholar] [CrossRef] [Green Version]
- Chen, G.; Weng, Q.; Hay, G.J.; He, Y. Geographic Object-Based Image Analysis (GEOBIA): Emerging Trends and Future Opportunities. GIScience Remote Sens. 2018, 55, 159–182. [Google Scholar] [CrossRef]
- Blaschke, T. Object Based Image Analysis for Remote Sensing. ISPRS J. Photogramm. Remote Sens. 2010, 65, 2–16. [Google Scholar] [CrossRef] [Green Version]
- Liu, T.; Abd-Elrahman, A.; Morton, J.; Wilhelm, V.L. Comparing Fully Convolutional Networks, Random Forest, Support Vector Machine, and Patch-Based Deep Convolutional Neural Networks for Object-Based Wetland Mapping Using Images from Small Unmanned Aircraft System. GIScience Remote Sens. 2018, 55, 243–264. [Google Scholar] [CrossRef]
- Keyport, R.N.; Oommen, T.; Martha, T.R.; Sajinkumar, K.S.; Gierke, J.S. A Comparative Analysis of Pixel- and Object-Based Detection of Landslides from Very High-Resolution Images. Int. J. Appl. Earth Obs. Geoinf. 2018, 64, 1–11. [Google Scholar] [CrossRef]
- Comert, R.; Avdan, U.; Gorum, T. Rapid Mapping of Forested Landslide from Ultra-High Resolution Unmanned Aerial Vehicle Data. ISPRS Int. Arch. Photogramm. Remote Sens. Spat. Inf. Sci. 2018, XLII-3/W4, 171–176. [Google Scholar] [CrossRef] [Green Version]
- Hölbling, D.; Abad, L.; Dabiri, Z.; Prasicek, G.; Tsai, T.-T.; Argentin, A.-L. Mapping and Analyzing the Evolution of the Butangbunasi Landslide Using Landsat Time Series with Respect to Heavy Rainfall Events during Typhoons. Appl. Sci. 2020, 10, 630. [Google Scholar] [CrossRef] [Green Version]
- Karantanellis, E.; Marinos, V.; Vassilakis, E.; Christaras, B. Object-Based Analysis Using Unmanned Aerial Vehicles (UAVs) for Site-Specific Landslide Assessment. Remote Sens. 2020, 12, 1711. [Google Scholar] [CrossRef]
- Gudiyangada Nachappa, T.; Kienberger, S.; Meena, S.R.; Hölbling, D.; Blaschke, T. Comparison and Validation of Per-Pixel and Object-Based Approaches for Landslide Susceptibility Mapping. Geomat. Nat. Hazards Risk 2020, 11, 572–600. [Google Scholar] [CrossRef]
- Aksoy, B.; Ercanoglu, M. Landslide Identification and Classification by Object-Based Image Analysis and Fuzzy Logic: An Example from the Azdavay Region (Kastamonu, Turkey). Comput. Geosci. 2012, 38, 87–98. [Google Scholar] [CrossRef]
- Stumpf, A.; Kerle, N. Object-Oriented Mapping of Landslides Using Random Forests. Remote Sens. Environ. 2011, 115, 2564–2577. [Google Scholar] [CrossRef]
- Tavakkoli Piralilou, S.; Shahabi, H.; Jarihani, B.; Ghorbanzadeh, O.; Blaschke, T.; Gholamnia, K.; Meena, S.; Aryal, J. Landslide Detection Using Multi-Scale Image Segmentation and Different Machine Learning Models in the Higher Himalayas. Remote Sens. 2019, 11, 2575. [Google Scholar] [CrossRef] [Green Version]
- Pawłuszek, K.; Marczak, S.; Borkowski, A.; Tarolli, P. Multi-Aspect Analysis of Object-Oriented Landslide Detection Based on an Extended Set of LiDAR-Derived Terrain Features. ISPRS Int. J. Geo. Inf. 2019, 8, 321. [Google Scholar] [CrossRef] [Green Version]
- Mezaal, M.R.; Pradhan, B.; Sameen, M.I.; Mohd Shafri, H.Z.; Yusoff, Z.M. Optimized Neural Architecture for Automatic Landslide Detection from High-Resolution Airborne Laser Scanning Data. Appl. Sci. 2017, 7, 730. [Google Scholar] [CrossRef] [Green Version]
- Pavlides, S.B.; Mountrakis, D.M. Extensional Tectonics of Northwestern Macedonia, Greece, since the Late Miocene. J. Struct. Geol. 1987, 9, 385–392. [Google Scholar] [CrossRef]
- Pix4D; Pix4D: Lausanne, Switzerland, 2020.
- Paraskevopoulos-Tsiakiris, F.; Karantanellis, E.; Marinos, V. Landslide Investigation Using UAV Photogrammetric Methods Within Marly Formations in Open Pit Lignite Mines in Northern Greece. In Proceedings of the 15th International Congress of the Geological Society of Greece, Athens, Greece, 22–24 May 2019. [Google Scholar]
- Espindola, G.M.; Camara, G.; Reis, I.A.; Bins, L.S.; Monteiro, A.M. Parameter Selection for Region-growing Image Segmentation Algorithms Using Spatial Autocorrelation. Int. J. Remote Sens. 2006, 27, 3035–3040. [Google Scholar] [CrossRef]
- Blaschke, T.; Lang, S.; Hay, G.J. Lecture Notes in Geoinformation and Cartography. In Object-Based Image Analysis: Spatial Concepts for Knowledge-Driven Remote Sensing Applications; Springer: Berlin/Heidelberg, Germany, 2015; ISBN 978-3-540-77057-2. [Google Scholar]
- Hölbling, D.; Füreder, P.; Antolini, F.; Cigna, F.; Casagli, N.; Lang, S. A Semi-Automated Object-Based Approach for Landslide Detection Validated by Persistent Scatterer Interferometry Measures and Landslide Inventories. Remote Sens. 2012, 4, 1310–1336. [Google Scholar] [CrossRef] [Green Version]
- Trimble ECognition. eCognition Developer; Trimble: Sunnyvale, CA, USA, 2020. [Google Scholar]
- Benz, U.C.; Hofmann, P.; Willhauck, G.; Lingenfelder, I.; Heynen, M. Multi-Resolution, Object-Oriented Fuzzy Analysis of Remote Sensing Data for GIS-Ready Information. ISPRS J. Photogramm. Remote Sens. 2004, 58, 239–258. [Google Scholar] [CrossRef]
- Johnson, B.; Xie, Z. Unsupervised Image Segmentation Evaluation and Refinement Using a Multi-Scale Approach. ISPRS J. Photogramm. Remote Sens. 2011, 66, 473–483. [Google Scholar] [CrossRef]
- Drǎguţ, L.; Tiede, D.; Levick, S.R. ESP: A Tool to Estimate Scale Parameter for Multiresolution Image Segmentation of Remotely Sensed Data. Int. J. Geogr. Inf. Sci. 2010, 24, 859–871. [Google Scholar] [CrossRef]
- Witharana, C.; Civco, D.L. Optimizing Multi-Resolution Segmentation Scale Using Empirical Methods: Exploring the Sensitivity of the Supervised Discrepancy Measure Euclidean Distance 2 (ED2). ISPRS J. Photogramm. Remote Sens. 2014, 87, 108–121. [Google Scholar] [CrossRef]
- Wu, Y.; Ma, W.; Gong, M.; Li, H.; Jiao, L. Novel Fuzzy Active Contour Model with Kernel Metric for Image Segmentation. Appl. Soft Comput. 2015, 34, 301–311. [Google Scholar] [CrossRef]
- Drăguţ, L.; Csillik, O.; Eisank, C.; Tiede, D. Automated Parameterisation for Multi-Scale Image Segmentation on Multiple Layers. ISPRS J. Photogramm. Remote Sens. 2014, 88, 119–127. [Google Scholar] [CrossRef] [PubMed] [Green Version]
- Stehman, S.V. Sampling Designs for Accuracy Assessment of Land Cover. Int. J. Remote Sens. 2009, 30, 5243–5272. [Google Scholar] [CrossRef]
- Baatz, M.; Schape, A. Multi Resolution Segmentation: An Optimum Approach for High Quality Multi Scale Image Segmentation; Strobl, J., Blaschke, T., Griesebner, G., Eds.; Wichmann: Berlin/Heidelberg, Germany, 2000. [Google Scholar]
- Eisank, C.; Smith, M.; Hillier, J. Assessment of Multiresolution Segmentation for Delimiting Drumlins in Digital Elevation Models. Geomorphology 2014, 214, 452–464. [Google Scholar] [CrossRef] [Green Version]
- Haralick, R.M.; Shanmugam, K.; Dinstein, I. Textural Features for Image Classification. IEEE Trans. Syst. Man Cybern. 1973, SMC-3, 610–621. [Google Scholar] [CrossRef] [Green Version]
- Riley, S.J.; DeGloria, S.D.; Elliot, R. A Terrain Ruggedness Index That Quantifies Topographic Heterogeneity. Intermt. J. Sci. 1999, 5, 23–27. [Google Scholar]
- Ma, L.; Li, M.; Ma, X.; Cheng, L.; Du, P.; Liu, Y. A Review of Supervised Object-Based Land-Cover Image Classification. ISPRS J. Photogramm. Remote Sens. 2017, 130, 277–293. [Google Scholar] [CrossRef]
- Cover, T.; Hart, P. Nearest Neighbor Pattern Classification. IEEE Trans. Inf. Theory 1967, 13, 21–27. [Google Scholar] [CrossRef]
- Breiman, L.; Friedman, J.H.; Olshen, R.A.; Stone, C.J. Classification and Regression Trees, 1st ed.; Routledge: London, UK, 1984; ISBN 978-1-315-13947-0. [Google Scholar]
- Breiman, L. Random Forests. Mach. Learn. 2001, 45, 5–32. [Google Scholar] [CrossRef] [Green Version]
- Belgiu, M.; Drăguţ, L. Random Forest in Remote Sensing: A Review of Applications and Future Directions. ISPRS J. Photogramm. Remote Sens. 2016, 114, 24–31. [Google Scholar] [CrossRef]
- Chen, F.; Yu, B.; Li, B. A Practical Trial of Landslide Detection from Single-Temporal Landsat8 Images Using Contour-Based Proposals and Random Forest: A Case Study of National Nepal. Landslides 2018, 15, 453–464. [Google Scholar] [CrossRef]
- Hölbling, D.; Eisank, C.; Albrecht, F.; Vecchiotti, F.; Friedl, B.; Weinke, E.; Kociu, A. Comparing Manual and Semi-Automated Landslide Mapping Based on Optical Satellite Images from Different Sensors. Geosciences 2017, 7, 37. [Google Scholar] [CrossRef] [Green Version]
- Albrecht, F.; Hölbling, D.; Friedl, B. Assessing The Agreement Between EO-Based Semi-Automated Landslide Maps With Fuzzy Manual Landslide Delineation. ISPRS Int. Arch. Photogramm. Remote Sens. Spat. Inf. Sci. 2017, XLII-2/W7, 439–446. [Google Scholar] [CrossRef] [Green Version]
- Radoux, J.; Bogaert, P. Good Practices for Object-Based Accuracy Assessment. Remote Sens. 2017, 9, 646. [Google Scholar] [CrossRef] [Green Version]
- Ye, S.; Pontius, R.G.; Rakshit, R. A Review of Accuracy Assessment for Object-Based Image Analysis: From per-Pixel to per-Polygon Approaches. ISPRS J. Photogramm. Remote Sens. 2018, 141, 137–147. [Google Scholar] [CrossRef]
- Congalton, R.; Green, K. Assessing the Accuzracy of Remotely Sensed Data: Principles and Practices, 3rd ed.; CRC Press: Boca Raton, FL, USA, 2019; ISBN 978-0-367-65667-6. [Google Scholar]
- Mohan Vamsee, A.; Kamala, P.; Martha, T.R.; Vinod Kumar, K.; Jai sankar, G.; Amminedu, E. A Tool Assessing Optimal Multi-Scale Image Segmentation. J. Indian Soc. Remote Sens. 2018, 46, 31–41. [Google Scholar] [CrossRef]
- Amatya, P.; Kirschbaum, D.; Stanley, T.; Tanyas, H. Landslide Mapping Using Object-Based Image Analysis and Open Source Tools. Eng. Geol. 2021, 282, 106000. [Google Scholar] [CrossRef]
Figure 1.
Location of the area under investigation in north-western Greece. The red box indicates the study site in the area of Amyntaio. 2D perspective with the created reference data overlaid (dark brown: scarp, light brown: depletion) and 3D view of the slope failure.
Figure 1.
Location of the area under investigation in north-western Greece. The red box indicates the study site in the area of Amyntaio. 2D perspective with the created reference data overlaid (dark brown: scarp, light brown: depletion) and 3D view of the slope failure.

Figure 2.
(a) Photo taken during the field investigations from the upper part of the scarp; (b) photo showcasing the large transversal cracks that occurred due to the retrogressive failure mechanism.
Figure 2.
(a) Photo taken during the field investigations from the upper part of the scarp; (b) photo showcasing the large transversal cracks that occurred due to the retrogressive failure mechanism.

Figure 3.
Flowchart of the applied methodology. Object-based landslide detection.

Figure 4.
Geomorphological landslide zones used for classification labelling.

Figure 5.
Information used for landslide zone classification.

Figure 6.
Selected subset of the area under investigation showing the segmentation results for different scale parameters (SPs).
Figure 6.
Selected subset of the area under investigation showing the segmentation results for different scale parameters (SPs).

Figure 7.
(a) Orthophoto overlaid by the reference data; (b) segmentation result; and (c) the final classification after refinement of the rule-based method for the RGB+DSM structure (green: non-affected, light brown: depletion, dark brown: scarp).
Figure 7.
(a) Orthophoto overlaid by the reference data; (b) segmentation result; and (c) the final classification after refinement of the rule-based method for the RGB+DSM structure (green: non-affected, light brown: depletion, dark brown: scarp).

Figure 8.
Example of classification results based on the RGB+DSM structure for different algorithms and SPs (Shape: 0.6) (green: non-affected, dark brown: scarp, light brown: depletion). The red polygon indicates the best classification result among the different setups.
Figure 8.
Example of classification results based on the RGB+DSM structure for different algorithms and SPs (Shape: 0.6) (green: non-affected, dark brown: scarp, light brown: depletion). The red polygon indicates the best classification result among the different setups.

Figure 9.
Radar plots are illustrating models’ agreement performances (no agreement: center; full agreement: perimeter) in relation to the investigated SP values for (a) RGB and (b) RGB+DSM structures.
Figure 9.
Radar plots are illustrating models’ agreement performances (no agreement: center; full agreement: perimeter) in relation to the investigated SP values for (a) RGB and (b) RGB+DSM structures.

Figure 10.
Classification close-up for three different SPs using the RGB and RGB+DSM input structures (green: non-affected, dark brown: scarp, light brown: depletion). The reference dataset is illustrated in the middle.
Figure 10.
Classification close-up for three different SPs using the RGB and RGB+DSM input structures (green: non-affected, dark brown: scarp, light brown: depletion). The reference dataset is illustrated in the middle.

Figure 11.
(a) Orthophoto with the reference zones overlaid; (b) KNN classification result; (c) DT classification result; and (d) RF classification result for the “Prosilio” landslide site (green: non-affected, brown: depletion, red: scarp). Applied configuration: dataset: RGB+DSM, SP: 100, shape/color: 0.6.


Table 1.
Number of resulting segments based on the different segmentation configurations.
| Shape/Compactness | |||||||
|---|---|---|---|---|---|---|---|
| 0.4/0.5 | 0.5/0.5 | 0.6/0.5 | |||||
| RGB | RGB + DSM | RGB | RGB + DSM | RGB | RGB + DSM | ||
| SP | 25 | 272,523 | 984,765 | 201,666 | 808,678 | 154,650 | 686,897 |
| 50 | 141,813 | 145,547 | 95,402 | 133,338 | 71,087 | 120,326 | |
| 75 | 60,754 | 72,720 | 57,594 | 67,030 | 48,119 | 60,797 | |
| 100 | 31,532 | 45,208 | 27,523 | 41,751 | 22,697 | 37,796 | |
| 125 | 17,686 | 36,718 | 14,885 | 24,594 | 12,751 | 17,587 | |
| 150 | 17,145 | 23,947 | 14,211 | 21,772 | 11,930 | 18,917 | |
| 200 | 9843 | 14,462 | 8972 | 12,331 | 6713 | 11,235 | |
Table 2.
Number of resulting segments using the ESP 2 tool.
| SP (Fine/Coarse) | Shape/ Compactness | No. of Objects (Fine/Coarse) | |
|---|---|---|---|
| RGB | 12/281 | 0.4/0.5 | 841,973/3989 |
| 79/251 | 0.5/0.5 | 52,121/4485 | |
| 41/311 | 0.6/0.5 | 87,546/2669 | |
| RGB + DSM | 12/481 | 0.4/0.5 | 1,267,698/4026 |
| 17/221 | 0.5/0.5 | 982,687/16,960 | |
| 14/431 | 0.6/0.5 | 909,678/3689 |
Table 3.
Computational costs (in time) of different classifiers in relation to the SP.
| Classification | KNN | DT | RF | Knowledge-Based | |||
|---|---|---|---|---|---|---|---|
| SP | 25 | 200 | 25 | 200 | 25 | 200 | 100 |
| Segmentation (sec) | 382.71 | 144.83 | 382.71 | 144.83 | 382.71 | 144.83 | 36.8 |
| Training (sec) | 2738.0 | 25.48 | 22.41 | 10.67 | 18.59 | 11.68 | - |
| Implementation (sec) | 1281.4 | 23.58 | 13.59 | 7.64 | 11.83 | 6.21 | 18.31 |
Table 4.
ML classification performances for the “Prosilio” landslide site. Applied configuration: structure: RGB+DSM, SP: 100, shape/color: 0.6.
Table 4.
ML classification performances for the “Prosilio” landslide site. Applied configuration: structure: RGB+DSM, SP: 100, shape/color: 0.6.
| Model | Precision | Recall | F1 |
|---|---|---|---|
| KNN | 0.72 | 0.68 | 0.69 |
| DT | 0.78 | 0.77 | 0.77 |
| RF | 0.84 | 0.81 | 0.82 |
Publisher’s Note: MDPI stays neutral with regard to jurisdictional claims in published maps and institutional affiliations. |
© 2021 by the authors. Licensee MDPI, Basel, Switzerland. This article is an open access article distributed under the terms and conditions of the Creative Commons Attribution (CC BY) license (https://creativecommons.org/licenses/by/4.0/).
Share and Cite
MDPI and ACS Style
Karantanellis, E.; Marinos, V.; Vassilakis, E.; Hölbling, D. Evaluation of Machine Learning Algorithms for Object-Based Mapping of Landslide Zones Using UAV Data. Geosciences 2021, 11, 305. https://doi.org/10.3390/geosciences11080305
AMA Style
Karantanellis E, Marinos V, Vassilakis E, Hölbling D. Evaluation of Machine Learning Algorithms for Object-Based Mapping of Landslide Zones Using UAV Data. Geosciences. 2021; 11(8):305. https://doi.org/10.3390/geosciences11080305
Chicago/Turabian StyleKarantanellis, Efstratios, Vassilis Marinos, Emmanuel Vassilakis, and Daniel Hölbling. 2021. "Evaluation of Machine Learning Algorithms for Object-Based Mapping of Landslide Zones Using UAV Data" Geosciences 11, no. 8: 305. https://doi.org/10.3390/geosciences11080305
Note that from the first issue of 2016, this journal uses article numbers instead of page numbers. See further details here.