Methylation Analysis of CpG Islands in Pineapple SERK1 Promoter

1
Tropical Crops Genetic Resources Institute of Chinese Academy of Tropical Agricultural Science, Haikou 571101, China
2
College of Horticulture, South China Agricultural University, Guangzhou 510642, China
*
Author to whom correspondence should be addressed.
Genes 2020, 11(4), 425; https://doi.org/10.3390/genes11040425
Submission received: 28 February 2020
/
Revised: 9 April 2020
/
Accepted: 9 April 2020
/
Published: 15 April 2020
(This article belongs to the Section Plant Genetics and Genomics)
Abstract
:Somatic embryogenesis (SE) is a more rapid and controllable method for plant propagation than traditional breeding methods. However, it often suffers from limited efficiency. SERK1 promotes SE in several plants, including pineapple (Ananas comosus L.). We investigate the embryonic cell-specific transcriptional regulation of AcSERK1 by methylation analysis of CpG islands in AcSERK1 regulatory sequences. This revealed differences in the methylation status of CpG islands between embryonic callus and non-embryonic callus; the methylation inhibitor 5-azaC increased AcSERK1 expression and also accelerated SE. These findings indicate that the expression of AcSERK1 is regulated epigenetically. This study lays the foundation for further analysis of epigenetic regulatory mechanisms that may enhance the efficiency of SE in pineapple and other plants.
1. Introduction
Pineapple (Ananas comosus L.) belongs to the Bromeliaceae family. Pineapple is self-sterile, and sucker propagation has been the most popular propagation method since it was first introduced into Europe. The sucker propagation method has several advantages, including simplicity and low-cost. However, there are also many disadvantages, such as low reproductive coefficient, prolonged production periods, and non-uniform growth and development [1]. Therefore, alternative breeding methods based on tissue culture have become a preferred choice for pineapple planting.
Somatic embryogenesis (SE) is an ideal rapid propagation method for many different types of plants and trees in vitro that also fits the requirements of industrialization [2]. However, it can suffer from limited efficiency. Therefore, a better understanding of the molecular mechanisms underlying SE may lead to the development of novel methods to improve efficiency. The physiological, biochemical, and morphological changes that underlie SE are regulated by many genes. SE can be divided into two stages. Stage one is the embryogenic induction stage, that is, an acquisition of the ability to undergo somatic embryogenesis. Stage two is the developmental stage of somatic embryos, including the process by which embryonic cells form mature embryos, which occurs via developmental processes similar to zygotic embryos. Most SE-related genes play a role in the later stages of somatic embryogenesis, such as LEC1 [3], LEC2 [4], AGL15 [5], BBM [6], and WU [7], which all increase SE or maintain the ability of the cells to undergo SE. Only somatic embryogenesis receptor kinases (SERKs) have been found to play an important role in the earlier transition from somatic cells to embryonic cells [7,8,9]. This small gene family of receptor-like kinases plays diverse roles in plants [10,11]. Among the SERK family, SERK1 is regarded as a SE marker gene of pineapple and other plants [12,13]. SERK1 expression is associated with the induction of SE, and also promotes the transformation of somatic cells to embryonic cells. For instance, the expression of SERK1 in Arabidopsis thaliana has been shown to increase its SE capacity by 3 to 4 times [14]. A similar phenomenon has also been reported in pineapple. The expression of SERK1 in pineapple has been shown to increase its SE capacity by about two times [12].
SE-mediated plant regeneration during in vitro culture is a complex process involving the actions of hormones, transcription factors, and epigenetic regulators [15,16]. One major epigenetic modification is DNA methylation, which plays a key role in SE and plant regeneration [17]. However, the relationship between the methylation levels of CpG islands in the promoter of key genes, gene expression levels, and the process of SE is still unclear. In this study, we report differences in the methylation status of CpG islands in the AcSERK1 regulatory sequence in embryonic versus non-embryonic callus from pineapple. We found that lower levels of DNA methylation at this locus were associated with higher expression, which may promote embryogenic competence during the in vitro culture of pineapple. The information provided here will form the foundation for future research on genetic and epigenetic control of plant SE during in vitro culture.
2. Materials and Methods
2.1. Plant Materials
The “Shenwan” pineapple species was used in this study. It was collected in 2013 from South China Agricultural University, Guangzhou, China. Suckers were obtained and cultured on Murashige and Skoog medium supplemented with 2 mg/L NAA and 3 mg/L BA to obtain callus [18].
For callus treatment, the proliferated callus was pre-cultured in liquid MS medium containing the methylation inhibitor 5-azaC [19] at 0.5, 5, 50, and 100 μmol·L−1 and for 3, 5, 7, and 9 days. 5-azaC was dissolved directly in the medium, therefore callus cultured in liquid MS medium without added 5-azaC served as a negative control (Control). Thereafter, the pre-treated-callus and negative control were transferred to embryonic induction medium (MS + 5 mg/L 2,4-D + 0.5 mg/L BA) at the same time to induce the production of embryonic callus [18]. The induction processes were both sampled every 5 days, quickly frozen in liquid nitrogen and stored in a −80 °C ultra-low temperature freezer to extract RNA for qPCR analysis to measure AcSERK1 expression during somatic embryo induction.
2.2. Gene Expression Analysis
Total RNA was extracted using TRIzol reagent (Invitrogen, Shanghai, China) from each callus sample and PrimeScriptTM RT reagent kit with gDNA Eraser (TaKaRa, Dalian, China) was used to synthesize the corresponding cDNAs. These cDNAs underwent quantitative real-time PCR (qPCR) using Thunderbird SYBR qPCR Mix (Toyobo, Shanghai, China) in the iQ5 Real-Time PCR system (BioRad, Hercules, CA, USA). The primers used are listed in Table 1. Each reaction was performed in biological triplicates. The cycling conditions were as follows: 95 °C for 10 s, 94 °C for 5 s, 53 °C for 20 s, 40 cycles. The reaction systems were as follows: cDNA template 1 μL, mix primers (forward and reverse, 2.5 μmol·L−1) 2 μL, SYBR Mix 10 μL, ddH2O 7 μL. The pineapple β-actin gene was used as a reference gene, and expression levels were normalized to this gene [12]. Relative gene expression values were calculated using the 2−∆∆CT method [12]. The expression differences between different treatments were compared using a one-way ANOVA in SPSS 19.0.
2.3. Methylation Analysis of the AcSERK1 Promoter Region
We used EMBOSS GUI v1.12: cpgplot (http://www.ebi.ac.uk/Tools/seqstats/emboss_cpgplot/) to predict the CpG islands in the regulatory sequences of AcSERK1, 2, and 3. Methprimer was used to design BSP (Bisulfite sequencing PCR) primers (Table 2) to amplify the CpG islands in the AcSERK1 regulatory sequences. These primers are not bisulfite-specific primers but could also amplify non-bisulfite treated genomic DNA. The reverse primer amplifying CpG-2 island is strongly biased for hybridization to a complementary methylated bisulfite-treated DNA.
Bisulfite treatment was performed as described in the EZ DNA Methylation-Gold KiTTM kit instructions. The main steps were as follows: 400 ng of genomic DNA was denatured at 98 °C for 10 min under CT Conversion Reagent transformation reagent, and vulcanized at 64 °C for 2.5 h, followed by desalting desulfurization, washing, and elution with 15 μL of eluate to recover the converted DNA. The reaction system of BSP amplification was as follows: bisulfite-treated template DNA 170 ng, forward primer (10 nmol·L−1) 1 μL, reverse primer (10 nmol·L−1) 1 μL, 2 × PCR Buffer 5 μL, dNTPs (1.25 mmol·L−1) 5 μL, ddH2O 5 μL. The cycling conditions of BSP amplification were as follows:
| 97 °C Pre-denaturation | 7 min |
| Hot-start Taq enzyme (5U·μL−1) | 0.55 μL |
| 97 °C Pre-denaturation | 7 min |
| 95 °C 1 min, 55 °C 1 min, 72 °C 1 min | 10 cycles |
| 95 °C 1 min, 53 °C 1 min, 72 °C 1 min | 10 cycles |
| 95 °C 1 min, 50 °C 1 min, 72 °C 1 min | 10 cycles |
| 95 °C 1 min, 48 °C 1 min, 72 °C 1 min | 10 cycles |
| 72 °C Extension | 10 min |
The BSP amplification product was ligated into the TA cloning vector and transfected into competent E. coli DH5α, and positive clones were identified by blue/white screening. Using the white colony as a template, PCR amplification was performed using methylation-specific primers. Positive clones were identified by 1% agarose gel electrophoresis. These were inoculated into LB/Amp + liquid medium and cultured overnight at 37 °C on a shaker at 220 rpm. The plasmids were extracted using a biochemical plasmid kit and sent to Guangzhou Meiji Biotechnology Co., Ltd. for Sanger sequencing.
2.4. Methylation Inhibitor Pretreatment before Somatic Embryogenesis Induction
We selected the concentration and the treatment time of 5-azaC that resulted in the highest AcSERK1 expression in the qPCR analysis as the optimal treatment conditions for 5-azaC pretreatment before embryonic induction. After somatic embryos were induced for 30 days, the somatic embryos arising from 5-azaC pre-treated callus and untreated callus (negative control) were observed microscopically, and the number of somatic embryos and adventitious buds were counted.
3. Results
3.1. Methylation Analysis of CpG Islands in the AcSERK1 Promoter Region
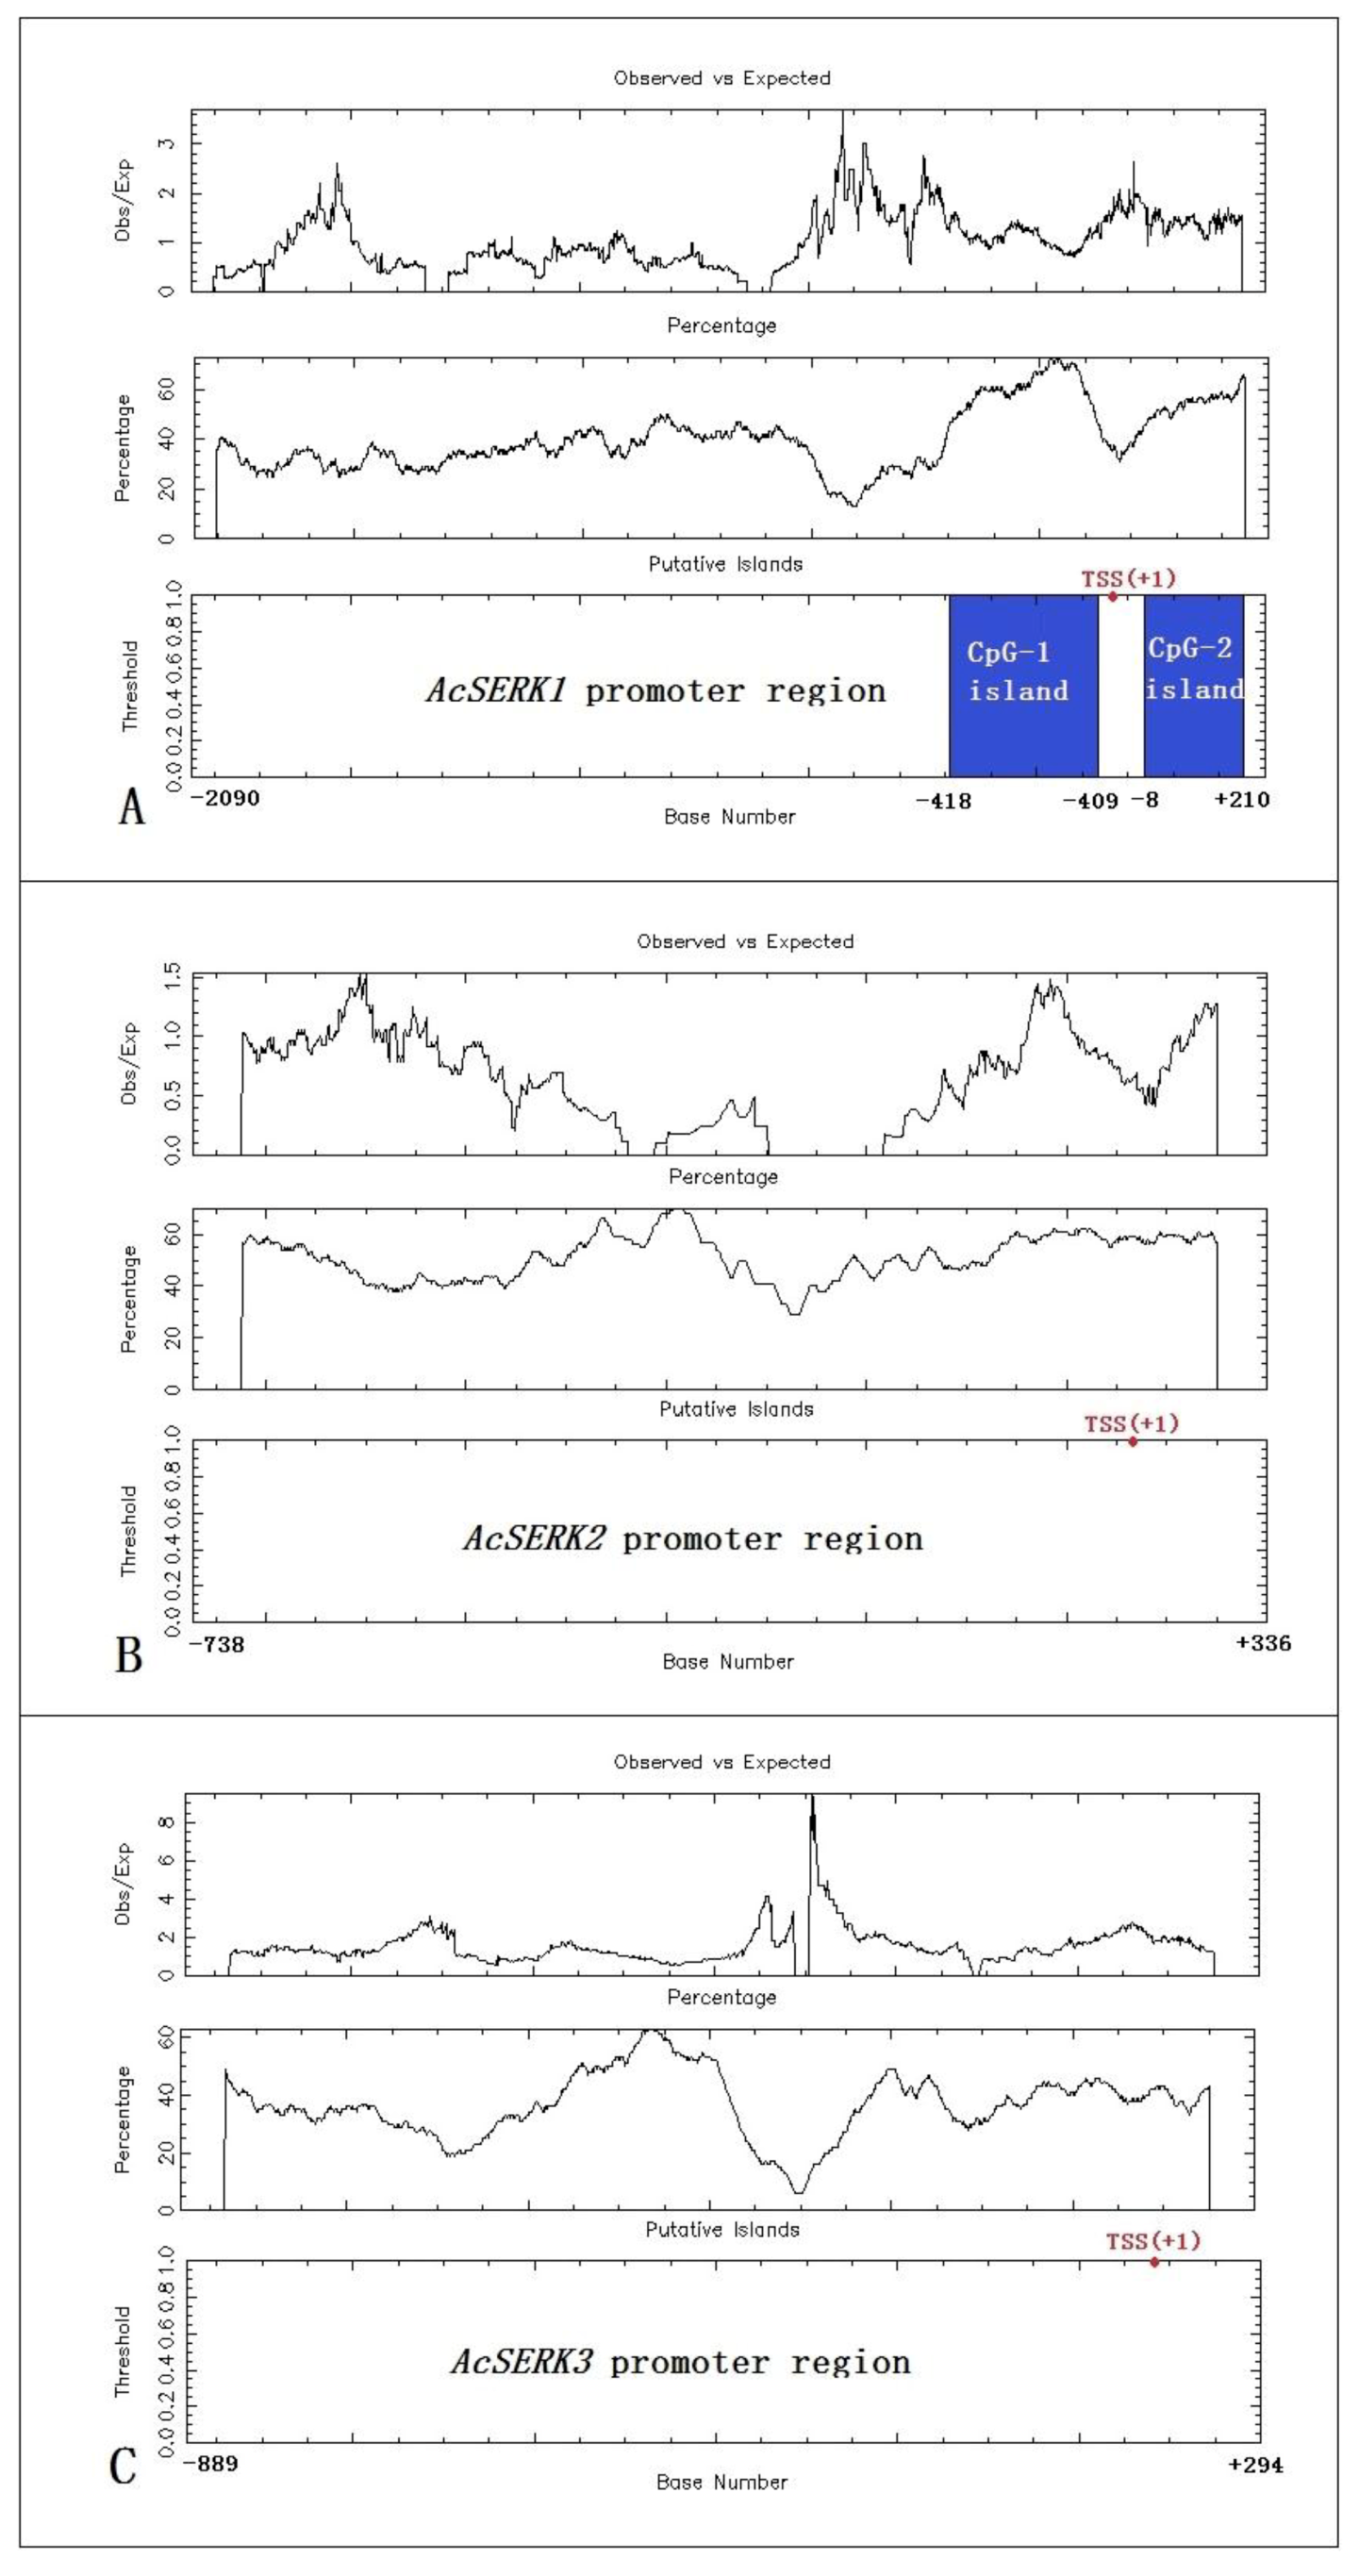
CpG island predictions were performed on the regulatory sequences of the three AcSERK genes using EMBOSS GUI v1.12: cpgplot. AcSERK1 is located on “Shenwan” pineapple chromosome 2. We identified two CpG islands in the promoter region. The CpG-1 island is located upstream of the transcription start site TSS (+1) and is 310 bp (−418 to −109). The CpG-2 island is located downstream of the TSS, but still within the designated promoter region, and is 219 bp (−8 to +210). AcSERK2 is located on chromosome 1, and AcSERK3 is located on chromosome 15. No CpG islands were predicted in their 5′ upstream regulatory sequences by EMBOSS GUI v1.12: cpgplot (Figure 1).
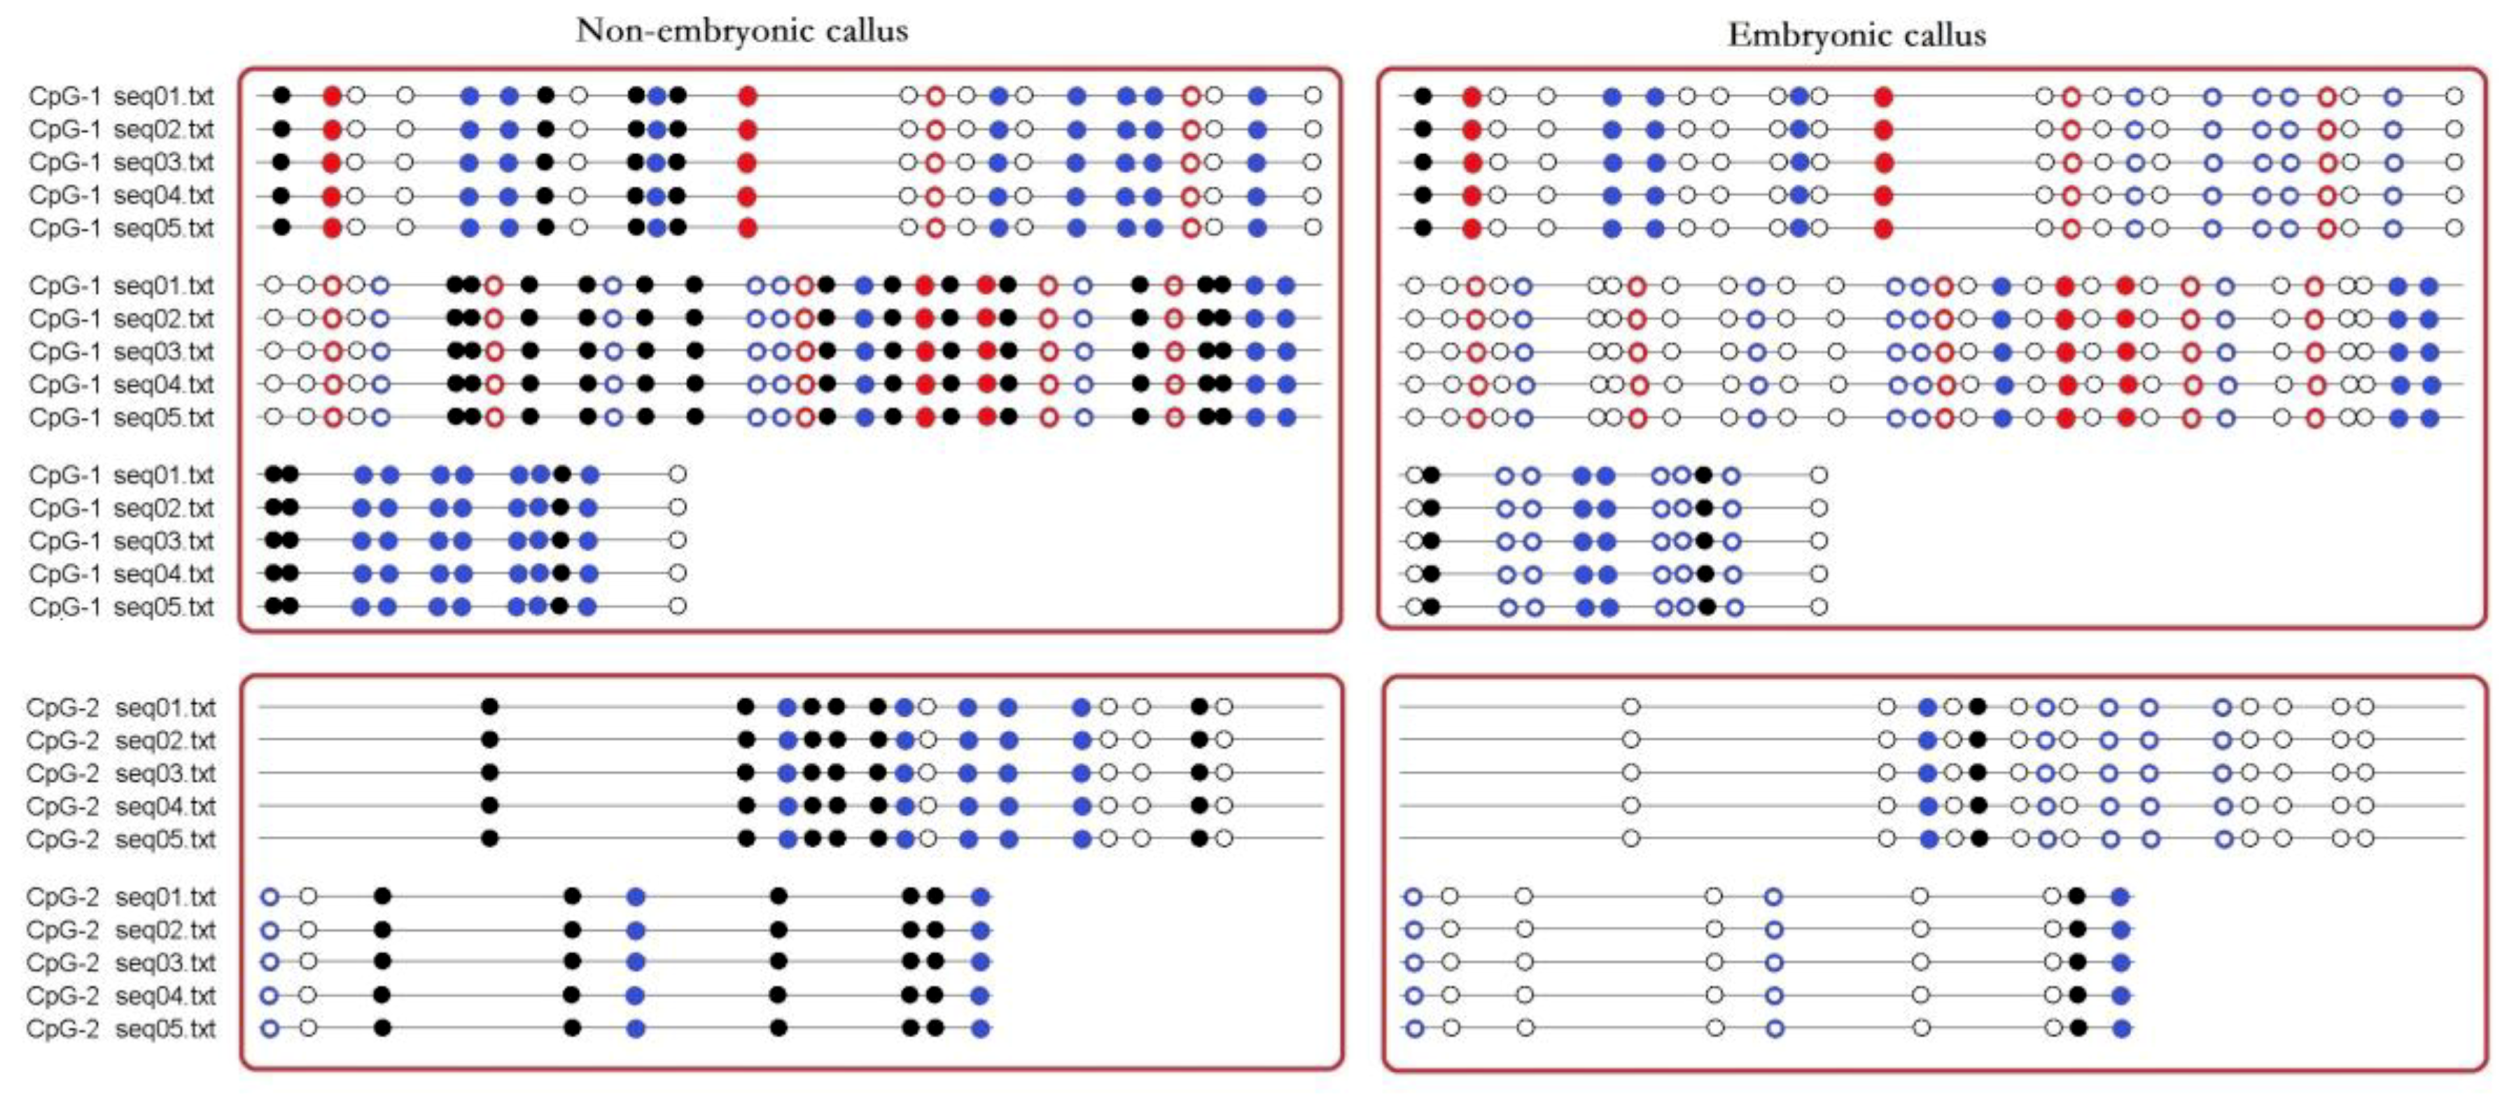
Although BSP primers could not exclude the amplification of non-bisulfite treated genomic DNA, the BSP sequencing results could still show the methylation status of the CpG island of the AcSERK1 promoter. Methylation of different sites in the CpG islands of the 5′ upstream regulatory region of AcSERK1 was observed in the embryonic and non-embryonic callus (Figure 2). Thirty-two CG, 11 CHG, and 23 CHH sites in the CpG-1 island were present. Of these, only 3 CG, 4 CHG, and 8 CHH sites were methylated in embryonic callus. In contrast, in non-embryonic callus, 20 CG, 4 CHG, and 18 CHH were methylated (Figure 2).
In the CpG-2 island, which was downstream of the TSS in the AcSERK1 promoter, there were a total of 16 CG and 8 CHH sites. Of these, only 2 CG and 2 CHH sites were methylated in embryonic callus. In contrast, in non-embryonic callus, 11 CG and 7 CHH were methylated (Figure 2). Thus, the methylation status of the two CpG islands in the AcSERK1 promoter during in vitro culture is differentially regulated between embryonic and non-embryonic callus.
3.2. Effect of Methylation on the Expression of AcSERK1
To determine whether methylation of AcSERK1 plays a role in its expression, we analyzed the expression pattern of AcSERK1 in non-embryonic callus by qPCR with and without treatment with different concentrations of the methylation inhibitor 5-azaC for different durations. We found that the 0.5 μmol·L−1 pre-treatment for three or five days could not induce AcSERK1 expression (Figure 3). The most dramatic effect of 5-azaC on AcSERK1 expression was observed with 5 μmol·L−1 5-azaC pretreatment for 5 days (Figure 3B). Briefly, 5 and 50 μmol·L−1 pre-treatments for 3 and 5 days were the most effective, with no statistical differences for longer pre-treatments (Figure 3A,B).
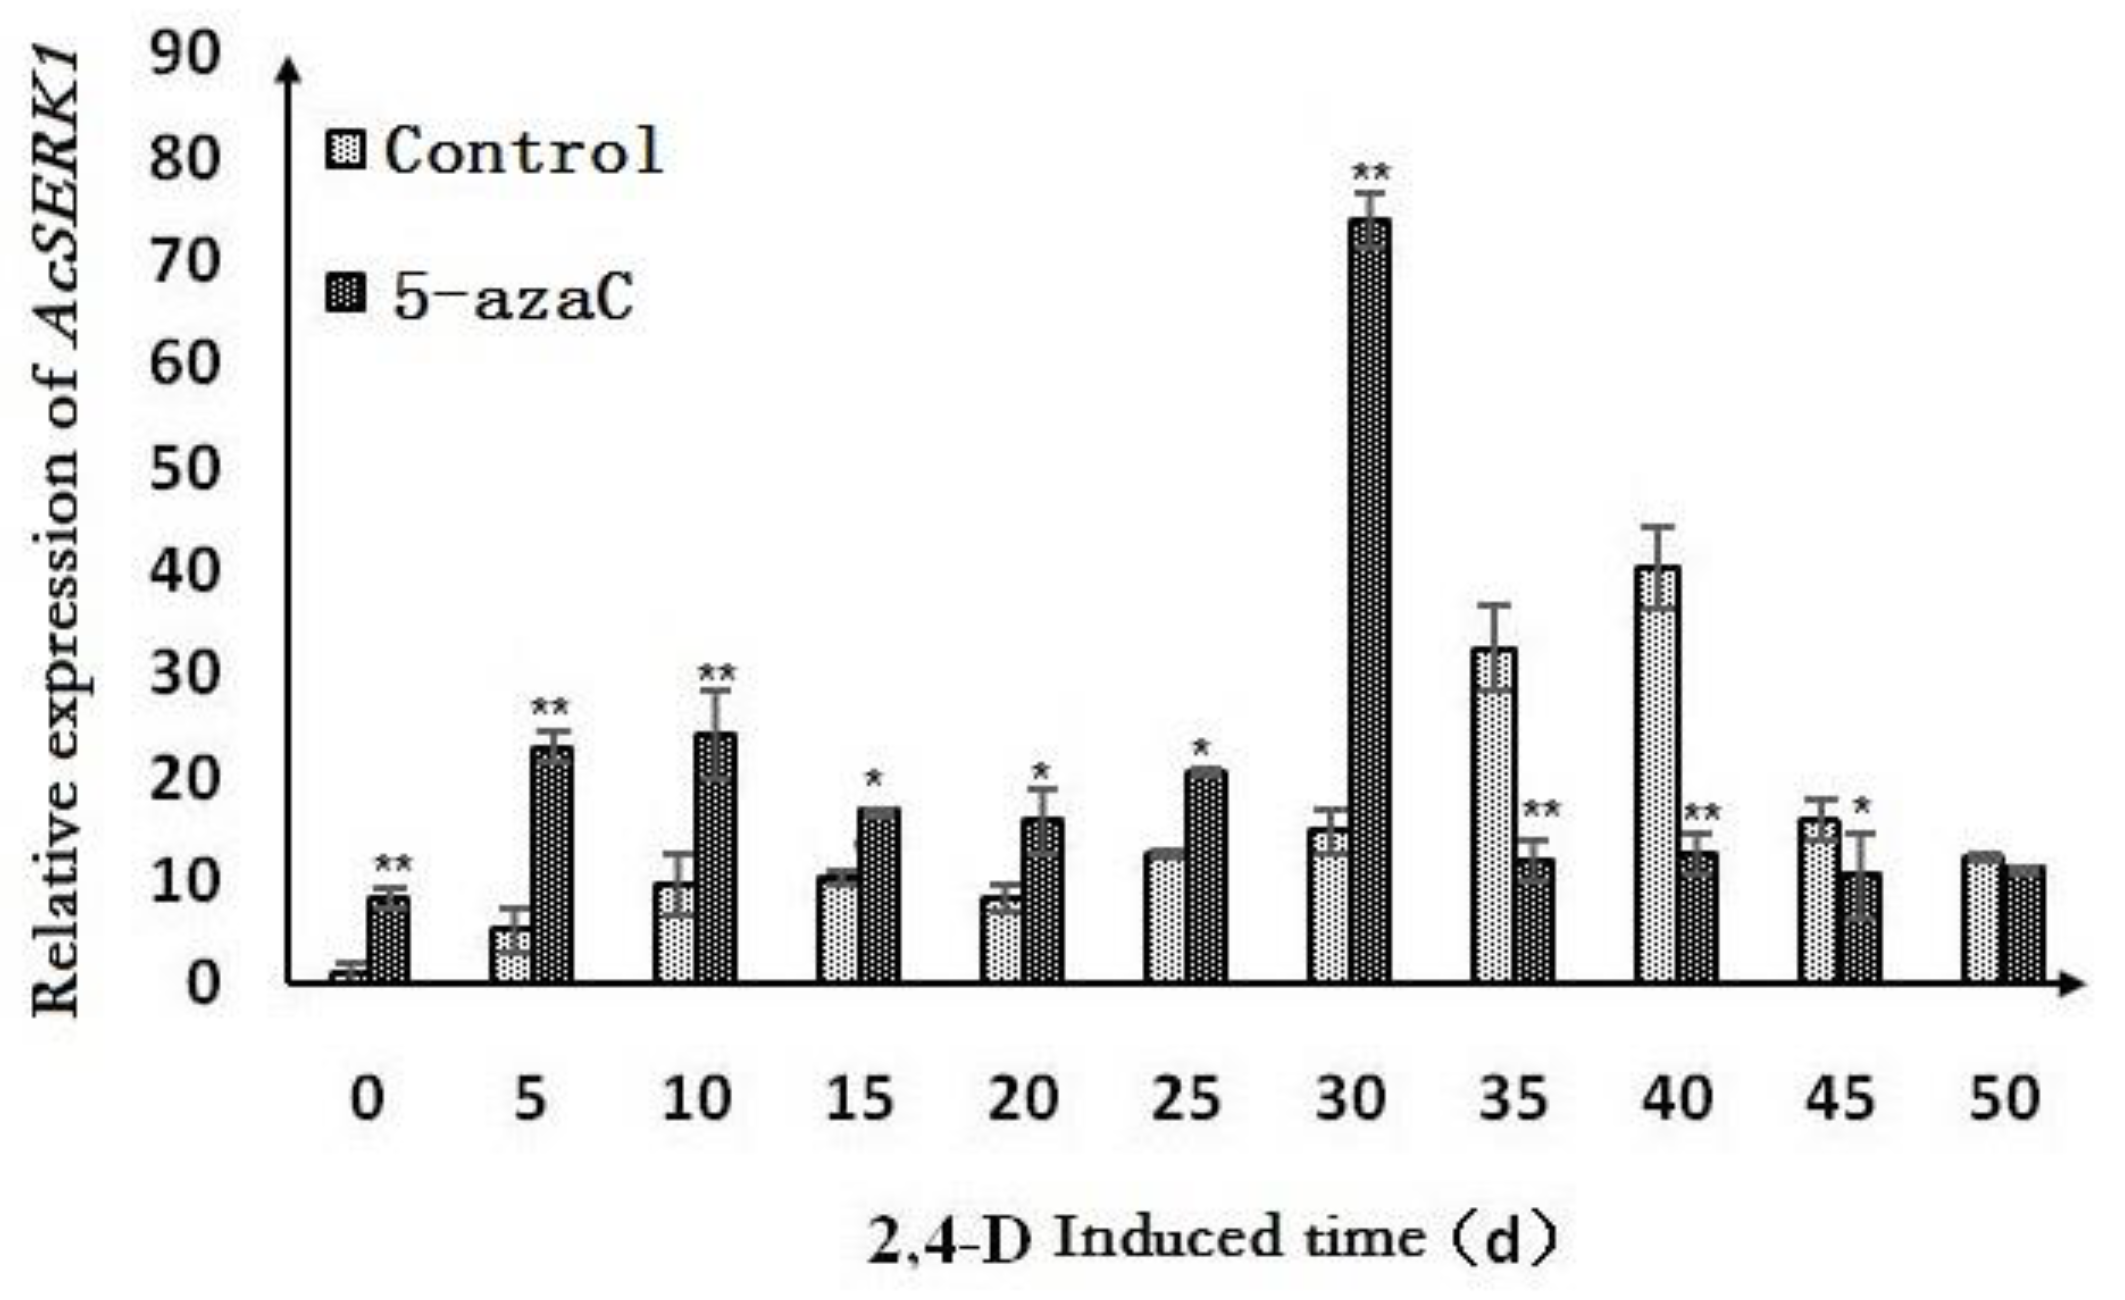
To analyze the effect of methylation inhibition on AcSERK1 expression in embryonic callus, we transferred callus to liquid MS medium containing 5 μmol·L−1 5-azaC and suspended it for 5 days before embryonic induction. We chose these conditions as they induced the highest increase in expression in the non-embryonic callus. During SE induced by 2,4-D, there were differences in the expression patterns of pineapple callus pre-treated with 5-azaC or without pretreatment (Figure 4). In the absence of 5-azaC pretreatment, the expression of AcSERK1 in callus induced by 2,4-D was consistent with published results [12]: increasing slowly from day 10 to peak at day 40, before decreasing. However, after 5-azaC pretreatment, the expression of AcSERK1 in the callus induced by 2,4-D increased more rapidly (already at day 5 after induction, with an earlier peak at day 30) before decreasing (Figure 4). Thus, methylation inhibition led to a more rapid onset of AcSERK1 expression during somatic embryo induction.
3.3. Effect of Methylation Inhibition on SE in Pineapple
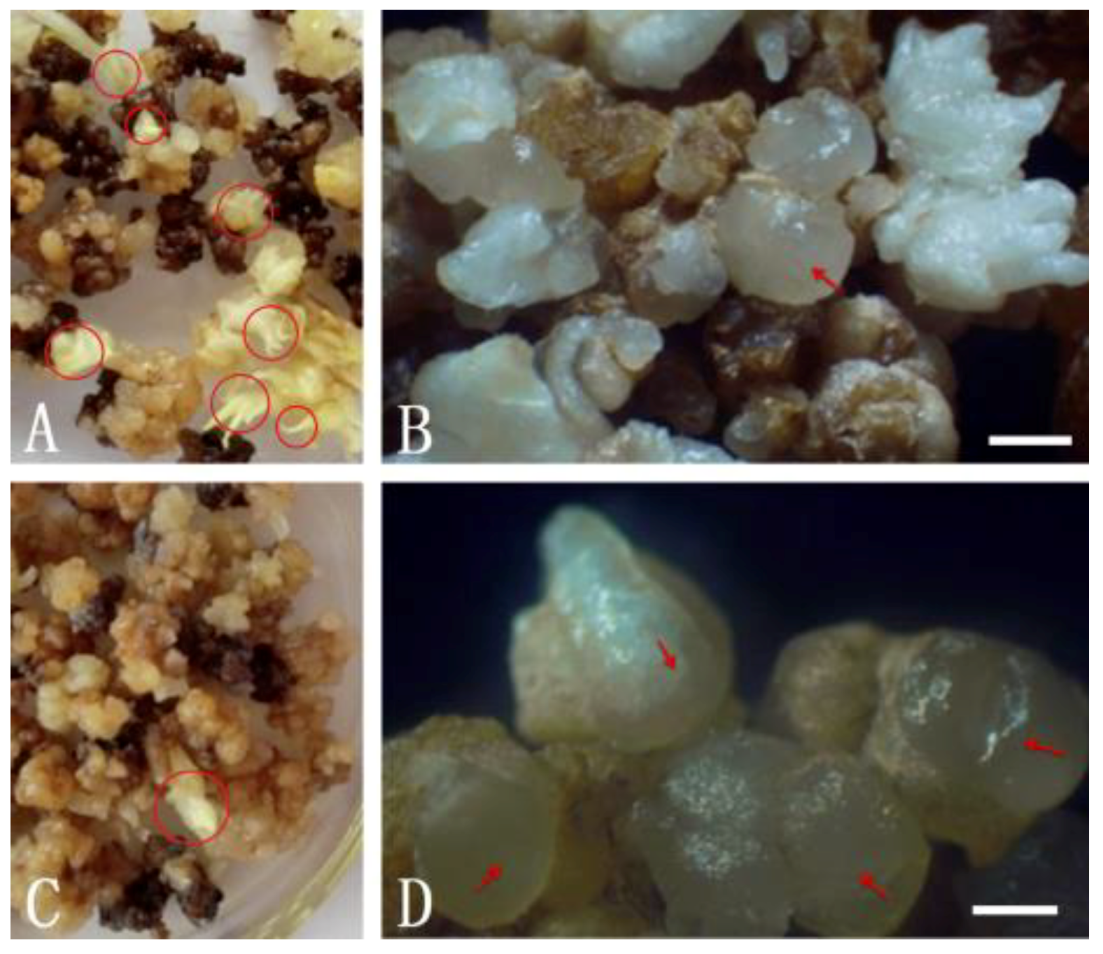
Somatic embryogenesis of pineapple proceeds through five stages: protoembryo, globular embryo, pear-shaped embryo, bamboo-shaped embryo, and mature embryo. Somatic embryos develop to the stage of globular embryo after somatic embryo induction of 30 days [18]. Somatic embryogenesis is often accompanied by germination of adventitious buds, which affects the efficiency of SE. To analyze the effect of 5-azaC on the process of SE in detail, callus in suspension culture were treated with 5 μmol·L−1 5-azaC liquid MS basic medium for 5 days, or left untreated, and then somatic embryo induction was performed. We then analyzed the somatic embryos 30 days later to determine if/how 5-azaC treatment affects the induction process. The results showed that 5-azaC at 5 μmol·L−1 significantly inhibited adventitious bud differentiation and increased the number of globular embryos (Figure 5). Specifically, with 5-azaC pretreatment, the amount of globular embryos was 22.15 per gram, which was twice that of the untreated control, with much lower adventitious bud differentiation (Figure 5B,D). Thus, pretreatment with 5-azaC promotes SE.
4. Discussion
The formation of plant embryos (zygotes and somatic embryos) involves the rearrangement of large numbers of cells [20,21,22,23,24]. Low levels of DNA methylation during this complex process are closely related to the morphogenesis of embryos and the acquisition of embryonic capacity [25]. For example, short-term DNA demethylation occurs after pollination of the ovules of tadpoles [26]. DNA demethylation also occurs in early stages of embryogenesis in Brassica napus and barley microspores [27,28]. In microspores, low levels of DNA methylation are associated with transcriptional activation and cell totipotency of related genes [27,28,29]. This study found significantly lower methylation levels in the CpG islands of the 5′ upstream regulatory region of AcSERK1 in embryonic callus compared to non-embryonic callus. This finding is consistent with results between specific development stages of somatic embryos and zygotes [17,25,27], but has not previously been described in CpG islands of a specific gene promoter, like SERK1. This is because most studies of SERK1 expression do not address epigenetic regulation, although this is important for gene expression and the transition of somatic cells to embryo cells [25,26,27,28,29]. Additionally, the absence of CpG islands in AcSERK2 and AcSERK3 suggests that their gene regulation may occur via a different epigenetic regulation mechanism than AcSERK1, where we did find CpG islands that were differentially methylated in embryonic versus non-embryonic callus. We went on to show that methylation inhibition also affects AcSERK1 expression levels, and somatic embryo induction. We cannot rule out that methylation of another gene besides AcSERK1 is responsible for the increase in AcSERK1 expression, or the acceleration of SE, as 5-azaC inhibits DNA methylation genome-wide. However, we consider that methylation of the AcSERK1 promoter is likely to be involved at least in part, given its known role in this process [30].
Recently, in a related study on the induction of microspore embryogenesis, 5-azaC was shown to promote the induction of embryogenesis [31]. Consistent with this result, in our study, when the concentration of 5-azaC was low (0~5 μmol·L−1), the expression level of the AcSERK1 gene generally increased with increasing concentration. However, at higher concentrations (>50 μmol·L−1), this relationship becomes reversed, and the expression levels decrease. AcSERK1 is a marker gene for pineapple SE, and its expression level in an individual plant corresponds with its capacity to undergo SE, i.e., the early embryonic induction phase of SE [14]. Thus, this result of increasing and decreasing AcSERK1 transcription indicates that low levels of demethylation increase a plant’s capacity for SE, and higher levels decrease it. Supporting this interpretation is a study of SE in woody plant leaves, showing that the global DNA is demethylated, and the appearance of demethylation reflects the potential for SE [32]. Thus, the reason why the AcSERK1 expression pattern does not consistently increase with increasing concentrations of the methylation inhibitor may be related to the effect of methylation inhibitors on the phenotype. This has been shown in carrots, where low concentrations of 5-azaC promote SE, while high concentrations (>4.1 μmol·L−1) inhibit SE [29]. In pineapple SE, here we show that 5-azaC at 5 μmol·L−1 can significantly inhibit adventitious bud differentiation and increase the number of globular embryos (i.e., promote SE). So, 5-azaC at low concentrations (≤5 μmol·L−1) promotes SE, whereas we have shown that at high concentrations (≥50 μmol·L−1), it inhibits SE in pineapple [33], consistent with the results in carrot [34]. Thus, we propose that 5 μmol·L−1 5-azaC for 5 days is the optimal pretreatment protocol to promote somatic embryogenesis, and it is the concentration that maximizes the expression of AcSERK1. However, the effect of 5-azaC toxicity on expression and SE requires further study.
Methylation regulates promoter activity, which likely influences the expression of SERK1. The activity of the SERK1 promoter has embryogenic cell specificity in pineapple, especially during development to the globular embryo stage [35]. In this study, we found that CpG islands in the SERK1 promoter are demethylated in embryonic callus. We assume this is why the gene expression level was increased in embryonic callus. The pretreatment with a methylation inhibitor verified the effect of demethylation on SE ability. Pretreatment with methylation inhibitors may promote the transformation of more nonembryonic callus to globular embryos during embryogenic induction. Thus, controlling the methylation level of the pineapple SERK1 promoter may increase the rate of SE. Our methylation analysis of CpG islands in the pineapple SERK1 promoter will help to decipher the likely complex epigenetic regulation mechanisms of SE, and thereby improve the efficiency of pineapple SE and in vitro propagation.
Author Contributions
A.L. and Y.H. designed and performed research. A.L. performed most of the experiments and wrote the paper. C.C. performed data analysis. A.L. and T.X. carried out part of material preparation and RNA extraction. J.H. revised the manuscript. All authors have read and approved the final manuscript.
Funding
This work was supported by the National Key R&D Program of China (NO. 2018YFD1000500), the National Natural Science Foundation of China (NO. 31572089), the Central Public-Interest Scientific Institution Basal Research Fund for the Chinese Academy of Tropical Agricultural Sciences (No. 1630032020005).
Conflicts of Interest
The authors declare no competing financial interests as defined by Nature Research, or other interests that might be perceived to influence the results and/or discussion reported in this paper.
References
- Sripaoraya, S.; Marchant, R.; Power, J.B.; Davey, M.R. Plant regeneration by somatic embryogenesis and organogenesis in commercial pineapple (Ananas comosus L.). In Vitro Cell. Dev. Biol. Plant 2003, 39, 450–454. [Google Scholar] [CrossRef]
- Gaj, M.D. Factors Influencing Somatic Embryogenesis Induction and Plant Regeneration with Particular Reference to Arabidopsis thaliana (L.) Heynh. Plant Growth Regul. 2004, 43, 27–47. [Google Scholar] [CrossRef]
- Lotan, T.; Ohto, M.A.; Yee, K.M.; West, M.A.; Lo, R.; Kwong, R.W.; Yamagishi, K.; Fischer, R.L.; Goldberg, R.B.; Harada, J.J. Arabidopsis LEAFY COTYLEDON1 is sufficient to induce embryo development in vegetative cells. Cell 1998, 93, 1195–1205. [Google Scholar] [CrossRef] [Green Version]
- Stone, S.L.; Kwong, L.W.; Yee, K.M. LEAFY COTYLEDON2 encodes a B3 domain transcription factor that induces embryo development. Proc. Natl. Acad. Sci. USA 2001, 98, 11806–11811. [Google Scholar] [CrossRef] [PubMed] [Green Version]
- Harding, E.W.; Tang, W.; Nichols, K.W. Expression and maintenance of embryogenic potential is enhanced through constitutive expression of AGAMOUS-Like 15. Plant Physiol. 2003, 133, 653–663. [Google Scholar] [CrossRef] [Green Version]
- Boutilier, K.; Offringa, R.; Sharma, V.K. Ectopic expression of BABY BOOM triggers a conversion from vegetative to embryonic growth. Plant Cell 2002, 14, 1737–1749. [Google Scholar] [CrossRef] [Green Version]
- Zuo, J.; Niu, Q.W.; Frugis, G. The WUSCHEL gene promotes vegetative-to-embryonic transition in Arabidopsis. Plant J. 2002, 30, 349–359. [Google Scholar] [CrossRef]
- Schmidt, E.D.; Guzzo, F.; Toonen, M.A. A leucine-rich repeat containing receptor-like kinase marks somatic plant cells competent to form embryos. Development 1997, 124, 2049–2062. [Google Scholar]
- Thomas, C.; Meyer, D.; Himber, C. Spatial expression of a sunflower SERK gene during induction of somatic embryogenesis and shoot organogenesis. Plant Physiol. Biochem. 2004, 42, 35–42. [Google Scholar] [CrossRef]
- Brandt, B.; Hothorn, M. SERK co-receptor kinases. Curr. Biol. 2016, 26, 225–226. [Google Scholar] [CrossRef] [Green Version]
- Fan, M.; Wang, M.; Bai, M.Y. Diverse roles of SERK family genes in plant growth, development and defense response. Sci. China Life Sci. 2016, 59, 889–896. [Google Scholar] [CrossRef] [PubMed] [Green Version]
- Ma, J.; He, Y.; Wu, C.; Liu, H.; Hu, Z.; Sun, G. Cloning and Molecular Characterization of a SERK Gene Transcriptionally Induced during Somatic Embryogenesis in Ananas comosus cv. Shenwan. Plant Mol. Biol. Rep. 2012, 30, 195–203. [Google Scholar] [CrossRef]
- Rocha, D.I.; Pinto, D.L.; Vieira, L.M.; Tanaka, F.A.; Dornelas, M.C.; Otoni, W.C. Cellular and molecular changes associated with competence acquisition during passion fruit somatic embryogenesis: Ultrastructural characterization and analysis of SERK gene expression. Protoplasma 2016, 253, 595–609. [Google Scholar] [CrossRef] [PubMed]
- Hecht, V.; Vielle-Calzada, J.P.; Hartog, M.V.; Boutilier, K.; Grossniklaus, U.; Vries, S.C.D. The Arabidopsis SOMATIC EMBRYOGENESIS RECEPTOR KINASE 1 Gene Is Expressed in Developing Ovules and Embryos and Enhances Embryogenic Competence in Culture. Plant Physiol. 2001, 127, 803–816. [Google Scholar] [CrossRef]
- Yamamuro, C.; Zhu, J.K.; Yang, Z. Epigenetic modifications and plant hormone action. Mol. Plant. 2016, 9, 57–70. [Google Scholar] [CrossRef] [Green Version]
- Yang, X.; Zhang, X. Regulation of somatic embryogenesis in higher plants. Crit. Rev. Plant Sci. 2010, 29, 36–57. [Google Scholar] [CrossRef]
- Rezaul, K.; Yew, S.T.; Pooja, S.; Norzulaani, K.; Jennifer, A.H. Expression and DNA methylation of SERK, BBM, LEC2 and WUS genes in in vitro cultures of Boesenbergia rotunda (L.). Mansf. Physiol. Mol. Biol. Plants 2018, 24, 741–751. [Google Scholar]
- He, Y.H.; Luo, J.; Wu, H.T.; Wang, R.X.; Gao, A.P.; Zhao, C.X.; Yu, X.L.; Ye, Z.X.; Wang, Z.H.; Hang, J.Z.; et al. Somatic embryogenesis from leaf base callus of Ananas comosus. J. Fruit Sci. 2007, 24, 59–63. (In Chinese) [Google Scholar]
- Christman, J.K. 5-Azacytidine and 5-aza-2′-deoxycytidine as inhibitors of DNA methylation: mechanistic studies and their implications for cancer therapy. Oncogene 2002, 21, 5483–5495. [Google Scholar] [CrossRef] [Green Version]
- Fehér, A. Somatic embryogenesis—Stress-induced remodeling of plant cell fate. Biochim. Biophys. Acta Gene Regul. Mech. 2015, 1849, 385–402. [Google Scholar] [CrossRef]
- Fortes, A.M.; Testillano, P.S.; Del, C.R.M.; Pais, M.S. Studies on callose and cutin during the expression of competence and determination for organogenic nodule formation from internodes of Humulus lupulus var. Nugget. Physiol. Plant 2002, 116, 113–120. [Google Scholar] [CrossRef] [PubMed]
- Testillano, P.S.; Risueño, M.C. Tracking Gene and Protein Expression During Microspore Embryogenesis by Confocal Laser Scanning Microscopy. In Advances in Haploid Production in Higher Plants; Springer: Dordrecht, The Netherlands, 2009; pp. 339–347. [Google Scholar]
- El-Tantawy, A.A.; Solís, M.T.; Costa, M.L.D.; Coimbra, S.; Risueño, M.C.; Testillano, P.S. Arabinogalactan protein profiles and distribution patterns during microspore embryogenesis and pollen development in Brassica napus. Plant Reprod. 2013, 26, 231–243. [Google Scholar] [CrossRef]
- Smertenko, A.; Bozhkov, P.V. Somatic embryogenesis: life and death processes during apical-basal patterning. J. Exp. Bot. 2014, 65, 1343–1360. [Google Scholar] [CrossRef] [PubMed] [Green Version]
- Valledor, L.; Hasbún, R.; Meijón, M.; Rodríguez, J.L.; Santamaría, E.; Viejo, M.; Berdasco, M.; Feito, I.; Fraga, F.M.; Rodríguez, R.; et al. Involvement of DNA methylation in tree development and micropropagation. Plant Cell Tissue Organ Cult. 2007, 91, 75–86. [Google Scholar] [CrossRef] [Green Version]
- Viejo, M.; Rodríguez, R.; Valledor, L.; Pérez, M.; Cañal, M.J.; Hasbún, R. DNA methylation during sexual embryogenesis and implications on the induction of somatic embryogenesis in Castanea sativa Miller. Sex. Plant Reprod. 2010, 23, 315–323. [Google Scholar] [CrossRef] [PubMed]
- Solís, M.; Rodríguezserrano, M.; Meijón, M.; Cifuentes, A.; Risueño, M.C.; Testillano, P.S. DNA methylation dynamics and MET1a-like gene expression changes during stress-induced pollen reprogramming to embryogenesis. J. Exp. Bot. 2012, 63, 6431–6444. [Google Scholar] [CrossRef] [PubMed]
- El-Tantawy, A.A.; Solís, M.T.; Risueño, M.C.; Testillano, P.S. Changes in DNA Methylation Levels and Nuclear Distribution Patterns after Microspore Reprogramming to Embryogenesis in Barley. Cytogenet. Genome Res. 2014, 143, 200–208. [Google Scholar] [CrossRef] [Green Version]
- Rodríguezsanz, H.; Morenoromero, J.; Solís, M.; Köhler, C.; Risueño, M.C.; Testillano, P.S. Changes in histone methylation and acetylation during microspore reprogramming to embryogenesis occur concomitantly with BnHKMT and BnHAT expression and are associated with cell totipotency, proliferation, and differentiation in Brassica napus. Cytogenet. Genome Res. 2014, 143, 209–218. [Google Scholar] [CrossRef] [Green Version]
- Karasawa, K.; Tanigawa, K.; Harada, A.; Yamashita, A. Transcriptional regulation of acyl-coa:Glycerol-sn-3-phosphate acyltransferases. Int. J. Mol. Sci. 2019, 20, 964. [Google Scholar] [CrossRef] [Green Version]
- Solís, M.; Eltantawy, A.A.; Cano, V.; Risueño, M.C.; Testillano, P.S. 5-azacytidine promotes microspore embryogenesis initiation by decreasing global DNA methylation, but prevents subsequent embryo development in rapeseed and barley. Front. Plant Sci. 2014, 6, 472. [Google Scholar] [CrossRef] [Green Version]
- Corredoira, E.; Cano, V.; Bárány, I.; Solís, M.-T.; Rodríguez, H.; Vieitez, A.-M.; Risueño, M.C.; Testillano, P.S. Initiation of leaf somatic embryogenesis involves high pectin esterification, auxin accumulation and DNA demethylation in Quercus alba. J. Plant Physiol. 2017, 213, 42–54. [Google Scholar] [CrossRef] [PubMed] [Green Version]
- Luan, A.P.; He, Y.H.; Guo, C.H.; Mao, Q.; Xie, T.; Gong, X.; Chen, C.J. Effect of methylation inhibitors in the synchronized regulation of pineapple SE. Acta Hortic. Sin. 2015, 42, 2649. [Google Scholar]
- Nozomi, Y.; Hatsumi, K.; Takashi, T.; Yukiko, M. Formation of embryogenic cell clumps from carrot epidermal cells is suppressed by 5-azacytidine, a DNA methylation inhibitor. J. Plant Physiol. 2005, 162, 47–54. [Google Scholar]
- Luan, A.; He, Y.; Xie, T.; Chen, C.; Mao, Q.; Wang, X.; Li, C.; Ding, Y.; Lin, W.; Xia, J.; et al. Identification of an Embryonic Cell-Specific Region within the Pineapple SERK1 Promoter. Genes 2019, 10, 883. [Google Scholar] [CrossRef]
Figure 1.
Bioinformatics prediction of CpG islands in the promoter regions of three AcSERKs. (A) AcSERK1 promoter region contains two CpG islands, which are indicated in blue. (B,C) The bioinformatics prediction results of CpG islands in the AcSERK2 and AcSERK3 promoters, respectively. Neither is predicted to contain CpG islands. The Cpgplot program defines a CpG island as a region corresponding to the following parameters: Observed/Expected ratio >0.60, Percentage C + Percentage G >50.00, and Length >200. The transcription start site is represented by TSS (red dot), and this site is defined as +1.

Figure 2.
Schematic diagram of CpG promoter methylation sites in AcSERK1. Black dots represent methylated CG sites, and white dots represent unmethylated CG sites. Red dots represent CHG. Blue dots represent CHH. H = A, C, or T. Solid dots represent methylated sites. Hollow dots represent unmethylated sites. The results represent 5 biological replicates (labeled as seq01.txt to seq05.txt).

Figure 3.
Effect of different concentrations of 5-azaC treatment for different times (3, 5, 7, or 9 days) on the expression levels of AcSERK1. (A–D) The effects of different concentrations on the expression of AcSERK1 during 5-azaC pretreatment at 3, 5, 7, and 9 d, respectively. The data were the average of 3 biological replicates, and the error bars denote the standard error of the mean. The expression differences with different treatments were compared using a one-way ANOVA by SPSS 19.0. * p < 0.01 and ** p < 0.05.

Figure 4.
Effect of 5-azaC on the expression of AcSERK1 during the process of SE. The data were the average of 3 biological replicates and the error bars denote standard error of the mean. Comparisons between pretreated (5-azaC) or untreated (“Control”—without 5-azaC) at the same induction times. The expression differences with different treatments were compared using a one-way ANOVA by SPSS 19.0. * p < 0.01 and ** p < 0.05.

Figure 5.
Effect of methylation inhibitor 5-azaC treatment on somatic embryo induction. (A,B) Display embryos without 5-azaC pretreatment, and (C,D) display embryos with 5-azaC pretreatment, and all panels are representative images of embryos 30 days after somatic embryo induction. Arrows indicate globular embryos. Circles indicate adventitious shoots. Scale bar = 400 μm.


Table 1.
Primers used for quantitative real-time PCR (qPCR).
| Primer Name | Primer Sequence | References |
|---|---|---|
| AcSERK1F | 5′-AACCGTTCTACTTTACTGGCTTTGG-3′ | Ma et al., 2012 [12] |
| AcSERK1R | 5′-GCATCTCTTCAGCGTAAGGGTAAT-3′ | |
| β-actinF | 5′-CTGGCCTACGTGGCACTTGACTT-3′ | |
| β-actinR | 5′-CACTTCTGGGCAGCGGAACCTTT-3′ |
Table 2.
Specific primers for CpG island amplification of AcSERK1 promoter.
| CpG Island | Forward | Reverse | Product Size |
|---|---|---|---|
| CpG-1 | AAAAAGAAGATATTTGGGAACTTTTG | CTAATTTATTTCTTTATTATCTTCTT | 392 bp |
| CpG-2 | GGGGGAAAAAAGTAGAAG | CATTGCCGCCGCCGCGAGCTCCGCCG | 292 bp |
© 2020 by the authors. Licensee MDPI, Basel, Switzerland. This article is an open access article distributed under the terms and conditions of the Creative Commons Attribution (CC BY) license (http://creativecommons.org/licenses/by/4.0/).
Share and Cite
MDPI and ACS Style
Luan, A.; Chen, C.; Xie, T.; He, J.; He, Y. Methylation Analysis of CpG Islands in Pineapple SERK1 Promoter. Genes 2020, 11, 425. https://doi.org/10.3390/genes11040425
AMA Style
Luan A, Chen C, Xie T, He J, He Y. Methylation Analysis of CpG Islands in Pineapple SERK1 Promoter. Genes. 2020; 11(4):425. https://doi.org/10.3390/genes11040425
Chicago/Turabian StyleLuan, Aiping, Chengjie Chen, Tao Xie, Junhu He, and Yehua He. 2020. "Methylation Analysis of CpG Islands in Pineapple SERK1 Promoter" Genes 11, no. 4: 425. https://doi.org/10.3390/genes11040425
Note that from the first issue of 2016, this journal uses article numbers instead of page numbers. See further details here.