Is Meat of Breeder Turkeys so Different from That of Standard Turkeys?


Abstract
:1. Introduction
2. Materials and Methods
2.1. Experimental Design
2.2. Analysis of Technological Quality of Meat
2.3. Analysis of Nutritional Quality of Meat
2.4. Analysis of Sensorial Quality of Meat
2.5. Histological Analysis of PM Muscle
2.6. Statistical Analysis
3. Results
3.1. Meat Yields (Table 1)
3.2. Technological Quality of Meat (Table 2)
3.3. Nutritional Quality of Meat (Table 3, Table 4 and Table 5)
3.4. Sensorial Quality of Meat (Table 6)
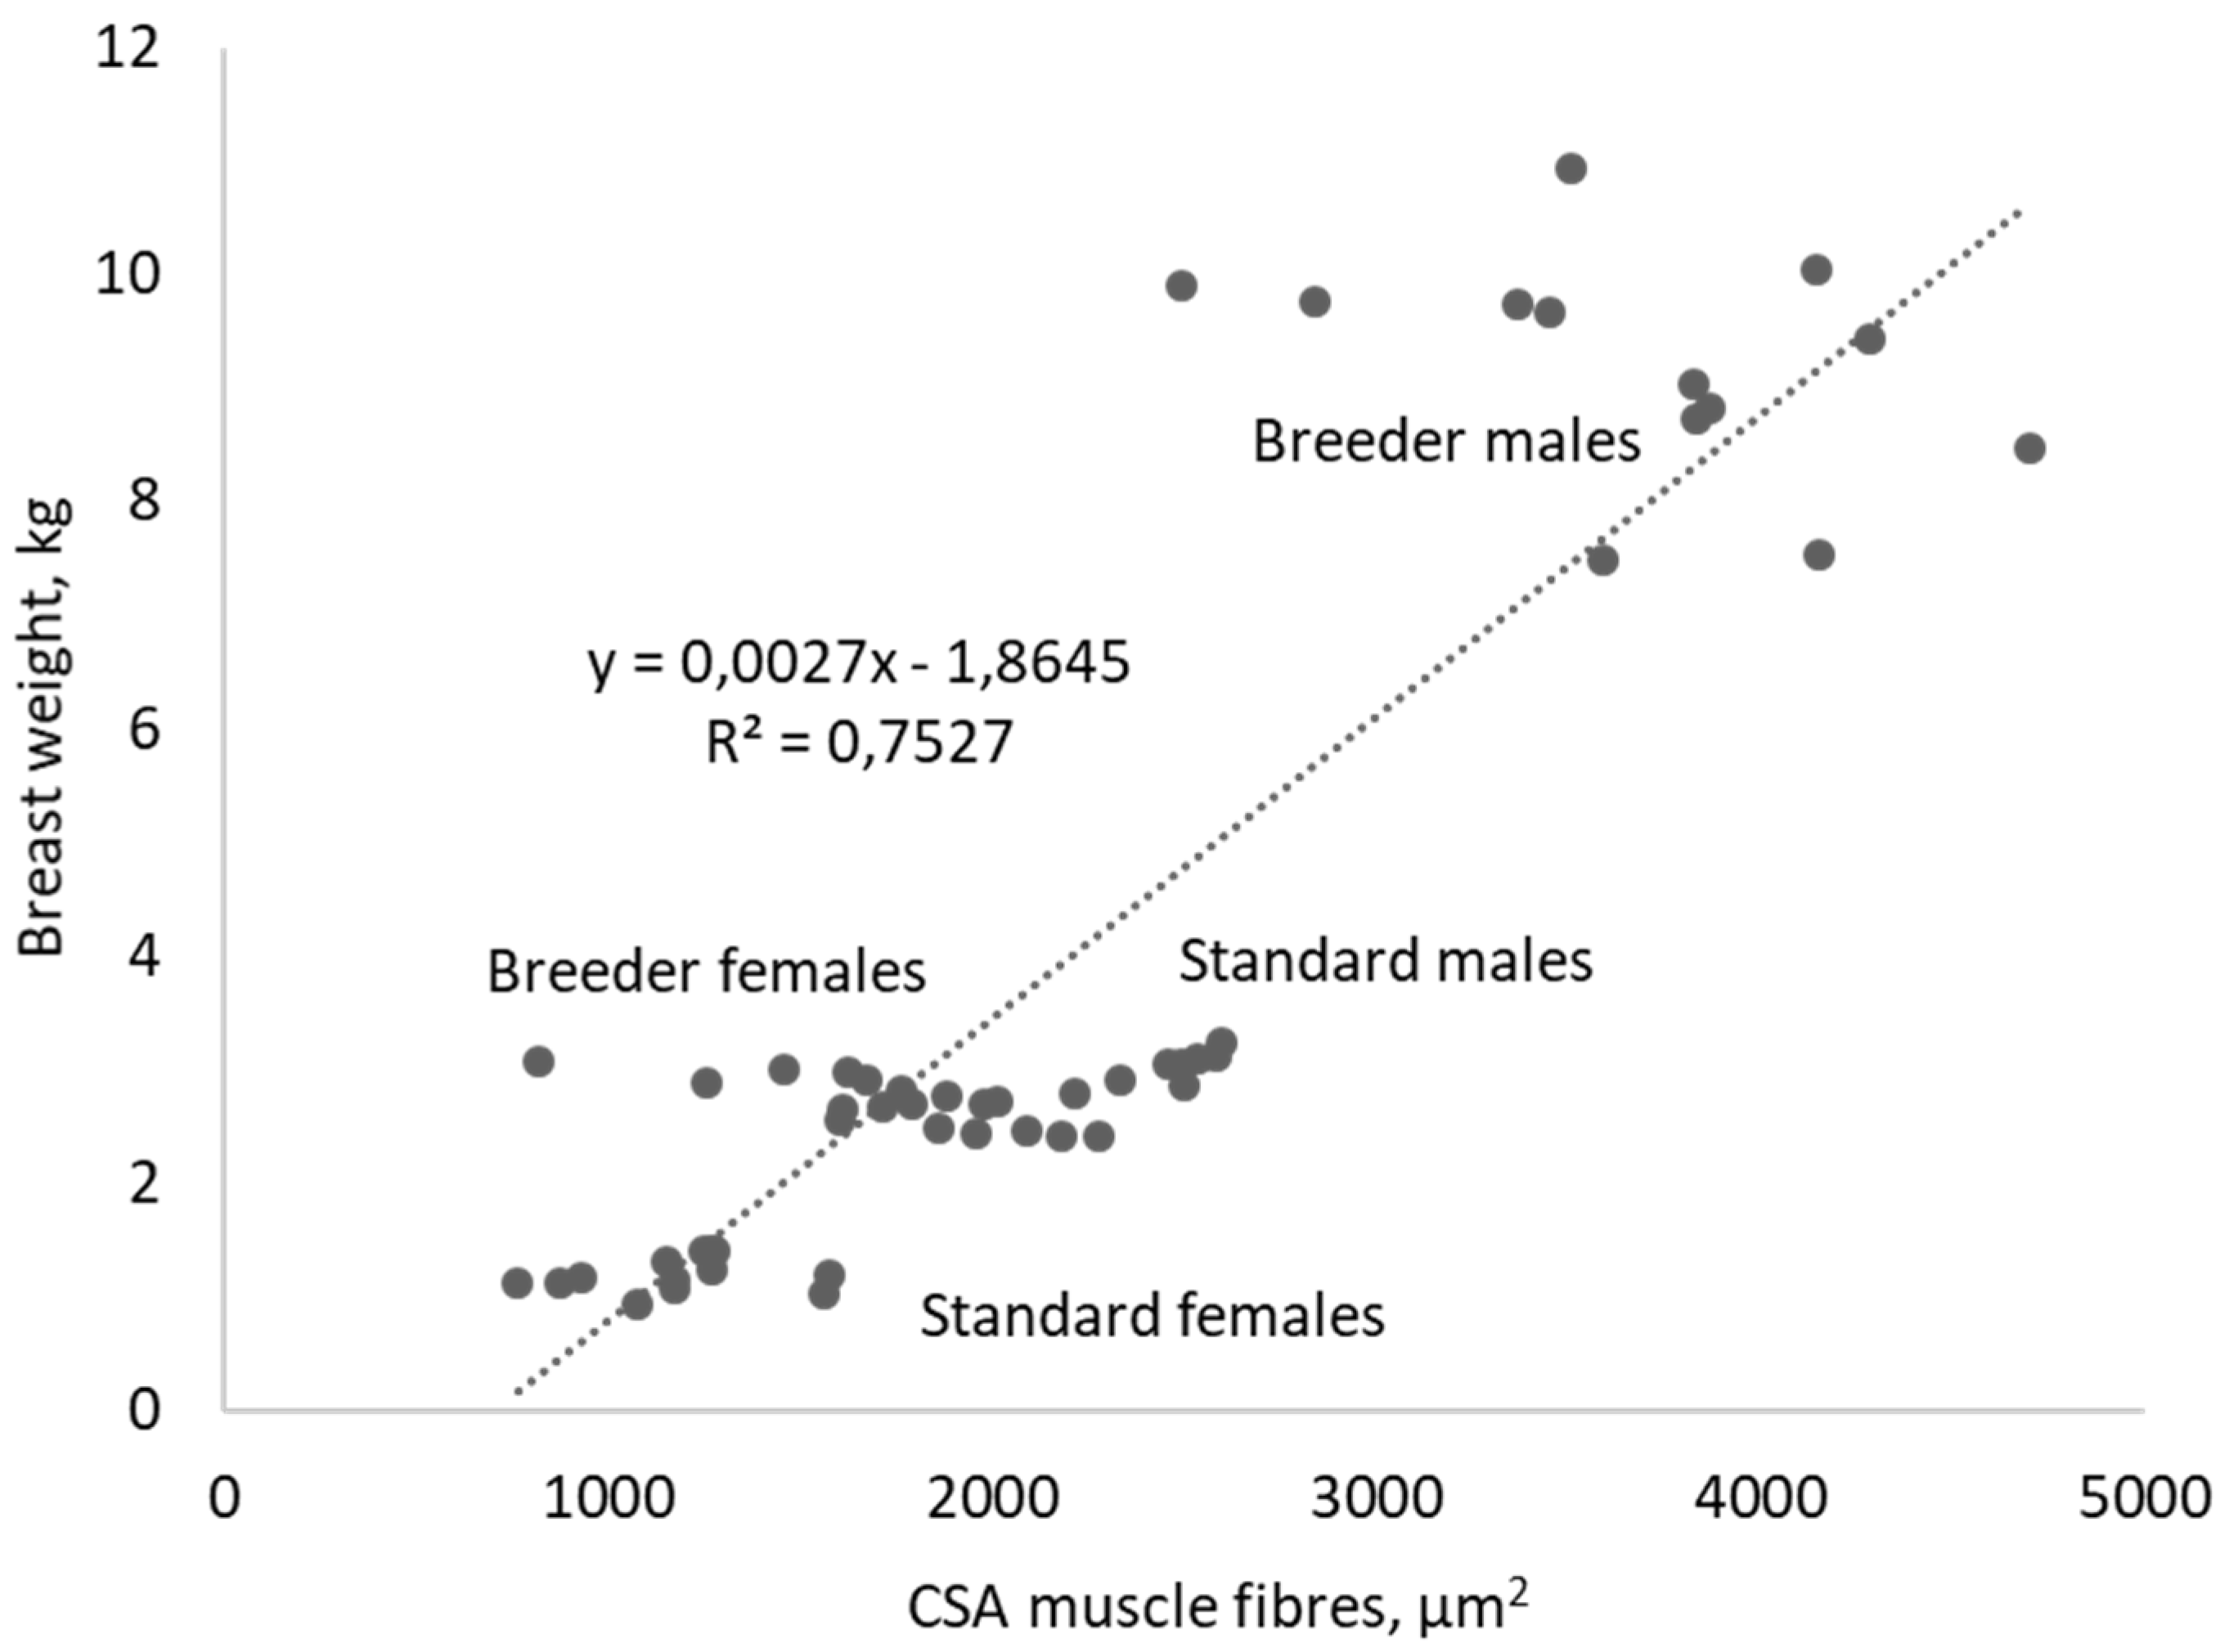
3.5. Histological Characteristics of Pectoralis Major Muscle (Table 7, Figure 1 and Figure 2)
4. Discussion
4.1. Sex Effect
4.2. Effect of Physiological Stage
5. Conclusions
Author Contributions
Funding
Conflicts of Interest
References
- FranceAgriMer. Données et Bilans: Les Filières Animales Terrestres et Aquatiques; Bilan 2015 et Perspectives 2016; FranceAgriMer: Paris, France, 2016; p. 137. [Google Scholar]
- Institut Technique de l’Aviculture (ITAVI). Situation de la Production et des Marchés des Volailles de Chair. Bilan 2015. Available online: https://www.google.com/search?q=2.+ITAVI.+Situation+de+la+Production+et+des+March%C3%A9s+des+Volailles+de+Chair.+Bilan+2015&rlz=1C1GCEU_frFR821FR821&oq=2.+ITAVI.+Situation+de+la+Production+et+des+March%C3%A9s+des+Volailles+de+Chair.+Bilan+2015&aqs=chrome..69i57j69i59.4742j1j9&sourceid=chrome&ie=UTF-8 (accessed on 23 December 2018).
- Werner, C.; Riegel, J.; Wicke, M. Slaughter performance of four different turkey strains with special focus on the muscle fiber structure and the meat quality of the breast muscle. Poult. Sci. 2008, 87, 1849–1859. [Google Scholar] [CrossRef] [PubMed]
- Werner, C.; Janisch, S.; Kuembet, U.; Wicke, M. Comparative study of the quality of broiler and turkey meat. Br. Poult. Sci. 2009, 50, 318–324. [Google Scholar] [CrossRef] [PubMed]
- Konca, Y.; Kirkipinar, F.; Mert, S. Effect of mannan-oligosaccharides and live yeast in diets on the carcass, cut yields, meat composition and colour of finishing turkeys. Asian Australas J. Anim. Sci. 2009, 22, 550–556. [Google Scholar] [CrossRef]
- Krischek, C.; Janisch, S.; Günther, R.; Wicke, M. Nutrient composition of broiler and turkey breast meat in relation to age, gender and genetic line of the animals. Arch. Lebensmittelhyg. 2011, 62, 76–81. [Google Scholar]
- Jankowski, J.; Lecewicz, A.; Chwastowska-Siwiecka, I.; Juskiewicz, J.; Zdunczyk, Z. Performance, slaughter value and meat quality of turkeys fed diets with different content of sunflower. Arch. Geflügelk. 2011, 75, 104–112. [Google Scholar]
- Jankowski, J.; Juskiewicz, J.; Lichtorowicz, K.; Zdunczyk, Z. Effects of the dietary level and source of sodium on growth performance, gastrointestinal digestion and meat characteristics in turkeys. Anim. Feed Sci. Technol. 2012, 178, 74–83. [Google Scholar] [CrossRef]
- Mikulski, D.; Jankowski, J.; Zdunczyk, Z.; Juskiewicz, J.; Slominski, B.A. The effect of different dietary levels of rapeseed meal on growth performance, carcass traits and meat quality in turkeys. Poult. Sci. 2012, 91, 215–223. [Google Scholar] [CrossRef]
- Damaziak, K.; Pietrzak, D.; Michalczuk, M.; Mroczek, J.; Niemiec, J. Effect of genotype and sex on selected quality attributes of turkey meat. Arch. Geflügelk. 2013, 77, 206–214. [Google Scholar]
- Damaziak, K.; Michalczuk, M.; Zdanowska-Sasiadek, Z.; Niemiec, J.; Gozdowski, D. Variation in growth performance and carcass yield of pure and reciprocal crossbred turkeys. Ann. Anim. Sci. 2015, 15, 51–66. [Google Scholar] [CrossRef]
- Damaziak, K.; Pietrzak, D.; Michalczuk, M.; Adamczak, L.; Chmiel, M.; Florowski, T.; Gozdowski, D.; Niemiec, J. Early and 24 h post-mortem changes in breast muscle quality traits of two turkey genotypes and their reciprocal crosses raised under semi-confined conditions. Br. Poult. Sci. 2016, 57, 51–62. [Google Scholar] [CrossRef]
- Murawska, D.; Kozlowski, K.; Tomaszewska, K.; Brzozowski, W.; Zawacka, M.; Michalik, D. Age-related chages in the tissue composition of carcass parts and in the distribution of lean meat, fat with skin and bones in turkey carcasses. Eur. Poult. Sci. 2015, 79. [Google Scholar] [CrossRef]
- Krawczyk, M.; Mikulski, D.; Przywitowski, M.; Jankowski, J. The effect of dietary yellow lupine (L. luteus cv. Baryt) on growth performance, carcass characteristics, meat quality and selected serum parameters of turkeys. J. Anim. Feed Sci. 2015, 24, 61–70. [Google Scholar]
- Przywitowski, M.; Mikulski, D.; Zdunczyk, Z.; Rogiewicz, A.; Jankowski, J. The effect of dietary high-tannin and low-tannin faba bean (Vicia faba L.) on the growth performance, carcass traits and breast meat characteristics of finisher turkeys. Anim. Feed Sci. Technol. 2016, 221, 124–136. [Google Scholar] [CrossRef]
- Fernandez, X.; Santé, V.; Baéza, E.; Le Bihan-Duval, E.; Berri, C.; Rémignon, H.; Babilé, R.; Le Pottier, G.; Millet, N.; Berge, P.; et al. Post mortem muscle metabolism and meat quality in three genetic types of turkey. Br. Poult. Sci. 2001, 42, 462–469. [Google Scholar] [CrossRef] [PubMed]
- Fernandez, X.; Santé, V.; Baéza, E.; Le Bihan-Duval, E.; Berri, C.; Rémignon, H.; Babilé, R.; Le Pottier, G.; Astruc, T. Effects of the rate of muscle post mortem pH fall on the technological yield of turkey meat. Br. Poult. Sci. 2002, 43, 245–252. [Google Scholar] [CrossRef] [PubMed]
- Le Bihan-Duval, E.; Berri, C.; Baéza, E.; Santé, V.; Astruc, T.; Rémignon, H.; Le Pottier, G.; Bentley, J.; Beaumont, C.; Fernandez, X. Genetic parameters of meat technological quality traits in a grand-parental commercial line of turkey. Gen. Select. Evol. 2003, 35, 623–635. [Google Scholar] [CrossRef]
- El Rammouz, R.; Babilé, R.; Fernandez, X. Effect of ultimate pH on the physico-chemical and biochemical characteristics of turkey breast muscle showing normal rate of postmortem pH fall. Poult. Sci. 2004, 83, 1750–1757. [Google Scholar] [CrossRef] [PubMed]
- Karwowska, M.; Stadnik, J.; Dolatowski, Z.J.; Grela, E.R. Effect of protein-xanthophylls (PX) concentrate of alfalfa supplementation on physico-chemical properties of turkey breast and thigh muscles during ageing. Meat Sci. 2010, 86, 486–490. [Google Scholar] [CrossRef]
- Sarica, M.; Ocak, N.; Turhan, S.; Kop, C.; Yamak, U.S. Evaluation of meat quality from 3 turkey genotypes reared with or without outdoor access. Poult. Sci. 2011, 90, 1313–1323. [Google Scholar] [CrossRef] [Green Version]
- Aslam, M.L.; Muhammad, L.; Bastiaansen, J.W.M.; Crooijmans, R.P.M.A.; Ducro, B.J.; Vereijken, A.; Groenen, M.A.M. Genetic variances, heritabilities and maternal effects on body weight, breast meat yield, meat quality traits and the shape of the growth curve in turkey birds. BMC Genet. 2011, 12, 14. [Google Scholar] [CrossRef]
- Jankowski, J.; Zdunczyk, Z.; Mikulski, D.; Juskiewicz, J.; Naczmanski, J.; Pomianowski, J.F.; Zdunczyk, P. Fatty acid profile, oxidative stability and sensory properties of breast meat from turkeys fed diets with a different n-6/n-3 PUFA ratio. Eur. J. Lipid Sci. Technol. 2012, 114, 1025–1035. [Google Scholar] [CrossRef]
- Carvalho, R.H.; Soares, A.L.; Honorato, D.C.B.; Guarnieri, P.D.; Pedrao, M.R.; Paiao, F.G.; Oba, A.; Ida, E.I.; Shimokomaki, M. The incidence of pale, soft and exudative (PSE) turkey meat at a Brazilian commercial plant and the functional properties in its meat product. LWT-Food Sci. Technol. 2014, 59, 883–888. [Google Scholar] [CrossRef]
- Ozturk, B.; Serdaroglu, M. Quality characteristics of PSE-like turkey Pectoralis major muscles generated by high post-mortem temperature in a local Turkish slaughterhouse. Korean J. Food Sci. Anim. Resour. 2015, 35, 524–532. [Google Scholar] [CrossRef] [PubMed]
- Celen, M.F.; Sögüt, B.; Zorba, O.; Demirulus, H.; Tekell, A. Comparison of normal and PSE turkey breast meat for chemical composition, pH, color, myoglobin and drip loss. Rev. Bras. Zoot. 2016, 45, 441–444. [Google Scholar] [CrossRef]
- Patterson, B.A.; Matarneh, S.K.; Stufft, K.M.; England, E.M.; Scheffler, T.L.; Preisser, R.H.; Shi, H.; Stewart, E.C.; Eilert, S.; Gerrard, D.E. Pectoralis major muscle of turkey displays divergent function as correlated with meat quality. Poult. Sci. 2017, 96, 1492–1503. [Google Scholar] [PubMed]
- Soglia, F.; Baldi, G.; Laghi, L.; Mudalal, S.; Cavani, C.; Petracci, M. Effect of white striping on turkey breast meat quality. Animal 2018, 12, 2198–2204. [Google Scholar] [CrossRef] [PubMed]
- Honikel, K.O. Reference methods for the assessment of physical characteristics of meat. Meat Sci. 1998, 49, 447–457. [Google Scholar] [CrossRef]
- Berri, C.; Le Bihan-Duval, E.; Baéza, E.; Chartrin, P.; Picgirard, L.; Jehl, N.; Quentin, M.; Picard, M.; Duclos, M.J. Further processing characteristics of breast and leg meat from fast-, medium- and slow-growing commercial chickens. Anim. Res. 2005, 54, 123–134. [Google Scholar] [CrossRef] [Green Version]
- Hornsey, H.C. The colour of cooked cured pork. Estimation of the nitric oxide-haem pigments. J. Sci. Food Agric. 1956, 7, 534–540. [Google Scholar] [CrossRef]
- Folch, J.; Lees, M.; Sloane Stanley, G.H. A simple method for the isolation and purification of total lipids from animal tissues. J. Biol. Chem. 1957, 226, 497–509. [Google Scholar]
- Morrisson, W.R.; Smith, M.L. Preparation of fatty acid methyl esters and dimethylacetates from lipid with boron trifluoride methanol. J. Lipid Res. 1964, 5, 600–608. [Google Scholar]
- Chartrin, P.; Berri, C.; Le Bihan-Duval, E.; Quentin, M.; Baéza, E. Lipid and fatty acid composition of fresh and cured-cooked breast meat of standard, certified and label chickens. Arch. Geflügelk. 2005, 69, 219–225. [Google Scholar]
- Mares, P.; Ranny, M.; Sedlacek, J.; Skorepa, J. Chromatography analysis of blood lipids. Comparison between gas chromatography and thin layer chromatography with flame ionisation detector. J. Chromatogr. 1983, 277, 295–305. [Google Scholar]
- Lynch, S.M.; Frei, B. Mechanisms of copper- and iron-dependent oxidative modification of human low-density lipoprotein. J. Lipid Res. 1993, 34, 1745–1753. [Google Scholar] [PubMed]
- Mercier, Y.; Gatellier, P.; Viau, M.; Rémignon, H.; Renerre, M. Effect of dietary fat and vitamin E on colour stability and on lipid and protein oxidation in turkey meat during storage. Meat Sci. 1998, 48, 301–318. [Google Scholar] [CrossRef]
- Morzel, M.; Gatellier, P.; Sayd, T.; Renerre, M.; Laville, E. Chemical oxidation decreases proteolytic susceptibility of skeletal muscle myofibrillar proteins. Meat Sci. 2006, 73, 536–543. [Google Scholar] [CrossRef] [PubMed]
- AFNOR. Analyse Sensorielle; AFNOR: La Plaine Saint-Denis, France, 2007; p. 648. [Google Scholar]
- Baéza, E.; Marché, G.; Wacrenier, N. Effect of sex on muscular development of Muscovy ducks. Reprod. Nutr. Dev. 1999, 39, 675–682. [Google Scholar] [CrossRef] [PubMed] [Green Version]
- Petracci, M.; Soglia, F.; Berri, C. Muscle metabolism and meat quality abnormalities. In Poultry Quality Evaluation: Quality Attributes and Consumer Values; Woodhead Publishing: Duxford, UK, 2017; pp. 51–75. [Google Scholar]
- Guerder, F.; Parafita, E.; Debut, M.; Vialter, S. Première approche de la caractérisation de la qualité technologique de la viande de poule. In 8èmes Journées de la Recherche Avicole; ITAVI: Saint-Malo, France, 2009; pp. 507–511. [Google Scholar]
- Kokoszynski, D.; Bernacki, Z.; Steczny, K.; Saleh, M.; Wasilewski, P.D.; Kotowicz, M.; Wasilewski, R.; Biegniewska, M.; Grzonkowska, K. Comparison of carcass composition, physicochemical and sensory traits of meat from spent broiler breeders with broilers. Eur. Poult. Sci. 2016, 80. [Google Scholar] [CrossRef]
- Qiao, Y.; Huang, J.; Chen, Y.; Chen, H.; Zhao, L.; Huang, M.; Zhou, G. Meat quality, fatty acid composition and sensory evaluation of Cherry Valley, spent layer and crossbred ducks. Anim. Sci. J. 2017, 88, 156–165. [Google Scholar] [CrossRef]
- Puchala, M.; Krawczyk, J.; Calik, J. Influence of origin of laying hens on the quality of their carcasses and meat after the first laying period. Ann. Anim. Sci. 2014, 14, 685–696. [Google Scholar] [CrossRef]


| Female Breeders | Male Breeders | Standard Females | Standard Males | Physiological Stage Effect | Sex Effect | Interaction Effect | |
|---|---|---|---|---|---|---|---|
| Slaughter age (days) | 397 | 410 | 75 | 103 | |||
| Body weight at slaughter (kg) | 10.42 ± 0.75 c | 32.67 ± 1.51 a | 5.89 ± 0.35 d | 13.48 ± 0.56 b | 0.001 | 0.001 | 0.001 |
| Carcass weight (kg) | 7.46 ± 0.56 c | 25.08 ± 1.33 a | 4.15 ± 0.31 d | 9.74 ± 0.42 b | 0.001 | 0.001 | 0.001 |
| Breast weight (kg) | 2.64 ± 0.23 c | 9.20 ± 0.99 a | 1.22 ± 0.13 d | 2.97 ± 0.19 b | 0.001 | 0.001 | 0.001 |
| Thigh + drumstick weight (kg) | 2.22 ± 0.18 c | 7.83 ± 0.78 a | 1.43 ± 0.10 d | 3.40 ± 0.19 b | 0.001 | 0.001 | 0.001 |
| Carcass yield (%) | 71.62 ± 1.09 c | 76.75 ± 1.58 a | 70.36 ± 1.59 d | 72.25 ± 1.36 b | 0.001 | 0.001 | 0.001 |
| Breast yield (%) | 25.31 ± 1.16 b | 28.15 ± 2.51 a | 20.69 ± 1.27 d | 22.01 ± 1.02 c | 0.001 | 0.001 | 0.001 |
| Thigh + drumstick yield (%) | 21.26 ± 0.70 b | 23.98 ± 2.26 a | 24.32 ± 0.73 a | 25.19 ± 0.91 a | 0.001 | 0.001 | 0.002 |
| Female Breeders | Male Breeders | Standard Females | Standard Males | Physiological Stage Effect | Sex Effect | Interaction Effect | |
|---|---|---|---|---|---|---|---|
| pHu PM | 5.68 ± 0.08 b | 5.70 ± 0.13 ab | 5.77 ± 0.07 a | 5.68 ± 0.05 b | 0.09 | 0.04 | 0.005 |
| pHu IT | 6.03 ± 0.11 | 5.79 ± 0.12 | 6.14 ± 0.14 | 5.92 ± 0.10 | 0.001 | 0.001 | 0.66 |
| L* PM | 49.14 ± 3.01 a | 51.00 ± 3.24 a | 49.30 ± 2.07 a | 46.00 ± 2.21 b | 0.001 | 0.23 | 0.001 |
| a* PM | −0.38 ± 0.90 | 0.48 ± 1.02 | −0.75 ± 0.73 | −0.62 ± 0.86 | 0.001 | 0.01 | 0.07 |
| b* PM | 7.69 ± 1.44 a | 6.27 ± 1.56 b | 7.06 ± 1.23 ab | 7.00 ± 1.31 ab | 0.87 | 0.02 | 0.03 |
| L* IT | 36.90 ± 3.50 b | 42.64 ± 4.48 a | 42.85 ± 2.03 a | 42.46 ± 2.02 a | 0.001 | 0.001 | 0.001 |
| a* IT | 5.63 ± 1.04 a | 5.97 ± 1.02 a | 2.08 ± 0.99 c | 4.03 ± 1.21 b | 0.001 | 0.001 | 0.001 |
| b* IT | 4.00 ± 1.00 | 2.57 ± 1.74 | 4.66 ± 1.09 | 3.85 ± 0.80 | 0.001 | 0.001 | 0.26 |
| PM texture (N/cm2) | 16.62 ± 1.65 b | 27.00 ± 4.12 a | 15.73 ± 1.63 b | 16.68 ± 1.78 b | 0.001 | 0.001 | 0.001 |
| PM drip loss (%) | 0.77 ± 0.34 | 1.29 ± 0.72 | 0.76 ± 0.31 | 0.97 ± 0.32 | 0.12 | 0.001 | 0.14 |
| PM cooking loss (%) | 11.08 ± 1.48 b | 15.29 ± 2.43 a | 8.59 ± 0.94 c | 9.78 ± 1.08 bc | 0.001 | 0.001 | 0.001 |
| PM technological yield (%) | 86.38 ± 2.16 a | 72.38 ± 4.68 c | 84.28 ± 2.72 ab | 81.35 ± 2.03 b | 0.001 | 0.001 | 0.001 |
| PM carbonyl content | 2.03 ± 0.38 | 2.14 ± 0.39 | 2.33 ± 0.30 | 2.26 ± 0.37 | 0.01 | 0.81 | 0.27 |
| SART carbonyl content | 3.43 ± 0.52 | 3.00 ± 0.42 | 3.21 ± 0.73 | 3.06 ± 0.56 | 0.52 | 0.03 | 0.27 |
| PM thiol content | 31.36 ± 6.96 | 35.76 ± 8.97 | 34.64 ± 6.84 | 35.99 ± 9.50 | 0.34 | 0.12 | 0.41 |
| SART thiols content | 34.84 ± 4.02 | 37.64 ± 4.81 | 37.03 ± 3.59 | 37.82 ± 4.40 | 0.21 | 0.06 | 0.29 |
| PM TBARS value | 0.80 ± 0.35 | 0.79 ± 0.25 | 0.44 ± 0.19 | 0.66 ± 0.34 | 0.001 | 0.13 | 0.09 |
| SART TBARS value | 1.34 ± 0.48 | 1.30 ± 0.45 | 0.89 ± 0.31 | 1.06 ± 0.38 | 0.001 | 0.48 | 0.26 |
| Female Breeders | Male Breeders | Standard Females | Standard Males | Physiological Stage Effect | Sex Effect | Interaction Effect | |
|---|---|---|---|---|---|---|---|
| Dry matter PM (%) | 27.70 ± 0.87 | 24.11 ± 1.82 | 25.60 ± 0.70 | 26.16 ± 0.51 | 0.001 | 0.26 | 0.23 |
| Proteins PM (%) | 24.72 ± 0.87 a | 21.68 ± 1.80 b | 25.21 ± 0.89 a | 25.41 ± 0.52 a | 0.001 | 0.001 | 0.001 |
| Lipides PM (%) | 3.01 ± 0.86 | 2.51 ± 0.96 | 1.01 ± 0.33 | 1.02 ± 0.15 | 0.001 | 0.26 | 0.23 |
| Ashes PM (%) | 1.08 ± 0.04 b | 1.05 ± 0.04 b | 1.42 ± 0.05 a | 1.10 ± 0.13 b | 0.001 | 0.001 | 0.001 |
| Iron (µg/g PM) | 3.03 ± 0.56 | 3.42 ± 1.31 | 2.37 ± 1.15 | 3.77 ± 1.45 | 0.65 | 0.01 | 0.14 |
| Myoglobin (µg/g PM) | 922 ± 170 | 1042 ± 399 | 722 ± 349 | 1147 ± 441 | 0.65 | 0.01 | 0.14 |
| Dry matter IT (%) | 26.14 ± 0.46 a | 24.92 ± 1.05 ab | 23.69 ± 1.12 b | 24.52 ± 0.75 ab | 0.001 | 0.50 | 0.001 |
| Proteins IT (%) | 22.70 ± 0.31 a | 20.25 ± 1.03 b | 21.79 ± 0.67 ab | 21.39 ± 0.95 b | 0.65 | 0.001 | 0.001 |
| Lipids IT (%) | 3.50 ± 0.69 | 4.20 ± 1.13 | 2.56 ± 0.73 | 2.91 ± 0.77 | 0.001 | 0.06 | 0.52 |
| Ash IT (%) | 1.12 ± 0.04 a | 1.08 ± 0.05 ab | 1.02 ± 0.07 b | 1.05 ± 0.04 b | 0.001 | 0.57 | 0.02 |
| Iron (µg/g IT) | 10.33 ± 2.48 | 12.70 ± 2.51 | 5.58 ± 1.68 | 8.21 ± 2.35 | 0.001 | 0.001 | 0.84 |
| Myoglobin (µg/g IT) | 3143 ± 756 | 3865 ± 765 | 1699 ± 511 | 2500 ± 714 | 0.001 | 0.001 | 0.84 |
| Triglycerides PM (%) | 2.51 ± 0.81 | 2.02 ± 0.90 | 0.54 ± 0.21 | 0.64 ± 0.13 | 0.001 | 0.33 | 0.14 |
| Cholesterol PM (%) | 0.04 ± 0.02 b | 0.07 ± 0.02 a | 0.05 ± 0.02 ab | 0.04 ± 0.01 b | 0.31 | 0.15 | 0.001 |
| Phospholipids PM (%) | 0.46 ± 0.08 | 0.42 ± 0.07 | 0.40 ± 0.13 | 0.34 ± 0.07 | 0.01 | 0.09 | 0.77 |
| Triglycerides IT (%) | 2.76 ± 0.57 | 3.29 ± 0.95 | 1.77 ± 0.59 | 2.16 ± 0.70 | 0.001 | 0.05 | 0.77 |
| Cholesterol IT (%) | 0.07 ± 0.03 b | 0.09 ± 0.04 ab | 0.14 ± 0.04 a | 0.08 ± 0.03 b | 0.01 | 0.10 | 0.001 |
| Phospholipids IT (%) | 0.67 ± 0.12 | 0.82 ± 0.25 | 0.65 ± 0.11 | 0.67 ± 0.35 | 0.24 | 0.25 | 0.38 |
| Female Breeders | Male Breeders | Standard Females | Standard Males | Physiological Stage Effect | Sex Effect | Interaction Effect | |
|---|---|---|---|---|---|---|---|
| C14:0 | 0.90 ± 0.54 a | 0.54 ± 0.06 ab | 0.41 ± 0.06 b | 0.52 ± 0.08 ab | 0.006 | 0.18 | 0.01 |
| C14:1 | 0.10 ± 0.04 ab | 0.14 ± 0.06 a | 0.09 ± 0.06 ab | 0.06 ± 0.02 b | 0.004 | 0.74 | 0.05 |
| C16:0 | 26.11 ± 0.83 a | 22.05 ± 1.15 c | 24.03 ± 1.03 bc | 25.60 ± 0.53 ab | 0.001 | 0.18 | 0.03 |
| C16:1 | 3.93 ± 0.79 a | 4.12 ± 0.76 a | 2.07 ± 0.68 b | 1.28 ± 0.46 b | 0.001 | 0.18 | 0.03 |
| C18:0 | 7.09 ± 0.54 | 7.11 ± 1.26 | 11.21 ± 1.49 | 9.81 ± 1.46 | 0.001 | 0.09 | 0.08 |
| C18:1 | 35.63 ± 1.65 | 34.94 ± 1.62 | 24.88 ± 1.77 | 26.06 ± 0.97 | 0.001 | 0.61 | 0.06 |
| C18:2 n-6 | 22.02 ± 1.23 c | 25.89 ± 2.20 bc | 29.38 ± 1.77 ab | 29.68 ± 1.43 a | 0.001 | 0.001 | 0.01 |
| C18:3 n-3 | 1.17 ± 0.15 | 1.95 ± 0.40 | 1.77 ± 0.36 | 2.15 ± 0.40 | 0.001 | 0.001 | 0.07 |
| C20:0 | 0.05 ± 0.03 | 0.07 ± 0.02 | 0.09 ± 0.02 | 0.11 ± 0.02 | 0.001 | 0.10 | 0.14 |
| C20:1 | 0.20 ± 0.06 | 0.25 ± 0.06 | 0.17 ± 0.02 | 0.17 ± 0.02 | 0.001 | 0.10 | 0.14 |
| C20:4 n-6 | 1.53 ± 0.46 c | 1.92 ± 1.20 bc | 4.53 ± 1.05 a | 3.42 ± 0.91 ab | 0.001 | 0.24 | 0.02 |
| C20:5 n-3 | 0.62 ± 0.59 | 0.48 ± 0.74 | 0.10 ± 0.07 | 0.09 ± 0.04 | 0.01 | 0.60 | 0.66 |
| C22:4 n-6 | 0.11 + 0.03 | 0.10 + 0.07 | 0.22 + 0.05 | 0.20 + 0.04 | 0.001 | 0.37 | 0.52 |
| C22:5 n-3 | 0.12 ± 0.03 c | 0.28 ± 0.15 bc | 0.69 ± 0.19 a | 0.57 ± 0.13 ab | 0.001 | 0.62 | 0.01 |
| C22:6 n-3 | 0.41 ± 0.17 | 0.16 ± 0.15 | 0.36 ± 0.11 | 0.27 ± 0.08 | 0.49 | 0.001 | 0.07 |
| SFA | 34.16 ± 0.82 a | 29.77 ± 1.79 b | 35.74 ± 2.16 a | 36.04 ± 1.55 a | 0.001 | 0.001 | 0.001 |
| MUFA | 39.86 ± 1.43 | 39.45 ± 2.10 | 27.20 ± 2.21 | 27.57 ± 1.38 | 0.001 | 0.96 | 0.50 |
| PUFA | 25.99 ± 1.05 c | 30.78 ± 2.55 b | 37.05 ± 2.63 a | 36.38 ± 1.28 a | 0.001 | 0.01 | 0.001 |
| n-6 FA | 23.66 ± 0.98 c | 27.91 ± 2.18 b | 34.13 ± 2.31 a | 33.31 ± 1.11 a | 0.001 | 0.01 | 0.001 |
| n-3 FA | 2.32 ± 0.57 | 2.87 ± 0.89 | 2.92 ± 0.36 | 3.08 ± 0.24 | 0.03 | 0.06 | 0.29 |
| n-6 FA/n-3 FA | 10.70 ± 2.47 | 10.27 ± 2.14 | 11.79 ± 0.91 | 10.87 ± 0.68 | 0.13 | 0.23 | 0.65 |
| Female Breeders | Male Breeders | Standard Females | Standard Males | Physiological Stage Effect | Sex Effect | Interaction Effect | |
|---|---|---|---|---|---|---|---|
| C14:0 | 0.68 ± 0.04 a | 0.54 ± 0.08 b | 0.52 ± 0.04 b | 0.60 ± 0.04 a | 0.01 | 0.07 | 0.001 |
| C14:1 | 0.12 ± 0.03 | 0.13 ± 0.02 | 0.07 ± 0.02 | 0.05 ± 0.02 | 0.001 | 0.97 | 0.14 |
| C16:0 | 24.60 ± 0.49 ab | 21.32 ± 1.05 c | 23.32 ± 1.15 bc | 25.13 ± 0.62 a | 0.001 | 0.01 | 0.001 |
| C16:1 | 3.44 ± 0.57 ab | 3.89 ± 0.77 a | 2.28 ± 0.78 bc | 1.41 ± 0.48 c | 0.001 | 0.33 | 0.01 |
| C18:0 | 8.39 ± 0.51 | 7.95 ± 0.84 | 9.64 ± 0.93 | 8.89 ± 0.93 | 0.001 | 0.03 | 0.57 |
| C18:1 | 32.52 ± 0.73 | 33.26 ± 1.24 | 24.69 ± 2.03 | 25.87 ± 0.84 | 0.001 | 0.03 | 0.60 |
| C18:2 n-6 | 25.51 ± 1.06 b | 27.91 ± 1.52 b | 32.55 ± 2.17 a | 32.10 ± 0.72 a | 0.001 | 0.001 | 0.01 |
| C18:3 n-3 | 1.17 ± 0.13 c | 1.85 ± 0.23 b | 2.43 ± 0.27 a | 2.67 ± 0.19 a | 0.001 | 0.001 | 0.01 |
| C20:0 | 0.08 ± 0.01 | 0.08 ± 0.01 | 0.10 ± 0.02 | 0.11 ± 0.02 | 0.001 | 0.21 | 0.10 |
| C20:1 | 0.22 ± 0.03 ab | 0.27 ± 0.04 a | 0.18 ± 0.02 b | 0.19 ± 0.02 b | 0.001 | 0.001 | 0.01 |
| C20:4 n-6 | 2.37 ± 0.29 ab | 2.33 ± 0.70 b | 3.35 ± 0.95 a | 2.32 ± 0.56 b | 0.03 | 0.02 | 0.03 |
| C20:5 n-3 | 0.07 ± 0.06 | 0.06 ± 0.04 | 0.08 ± 0.09 | 0.10 ± 0.04 | 0.15 | 0.98 | 0.49 |
| C22:4 n-6 | 0.19 + 0.04 a | 0.11 + 0.03 b | 0.15 + 0.03 ab | 0.12 + 0.04 b | 0.35 | 0.001 | 0.04 |
| C22:5 n-3 | 0.12 ± 0.02 c | 0.21 ± 0.06 b | 0.45 ± 0.13 a | 0.32 ± 0.08 ab | 0.001 | 0.52 | 0.001 |
| C22:6 n-3 | 0.54 ± 0.14 a | 0.12 ± 0.04 c | 0.21 ± 0.08 b | 0.12 ± 0.05 c | 0.001 | 0.001 | 0.001 |
| SFA | 33.75 ± 0.94 a | 29.88 ± 1.16 b | 33.58 ± 1.19 a | 34.74 ± 0.82 a | 0.001 | 0.001 | 0.001 |
| MUFA | 36.29 ± 0.97 a | 37.55 ± 1.85 a | 27.21 ± 2.75 b | 27.52 ± 1.29 b | 0.001 | 0.38 | 0.01 |
| PUFA | 29.89 ± 0.97 b | 32.51 ± 1.93 b | 39.13 ± 3.20 a | 37.65 ± 1.08 a | 0.001 | 0.38 | 0.01 |
| n-6 FA | 28.07 ± 0.94 b | 30.34 ± 1.93 b | 36.05 ± 2.85 a | 34.54 ± 1.03 a | 0.001 | 0.02 | 0.03 |
| n-3 FA | 1.83 ± 0.12 c | 2.18 ± 0.19 b | 3.09 ± 0.38 a | 3.10 ± 0.11 a | 0.001 | 0.02 | 0.03 |
| n-6 FA/n-3 FA | 15.41 ± 0.98 | 14.05 ± 1.65 | 11.76 ± 0.84 | 11.14 ± 0.42 | 0.001 | 0.01 | 0.28 |
| Female Breeders | Male Breeders | Standard Females | Standard Males | Physiological Stage Effect | Sex Effect | Interaction Effect | |
|---|---|---|---|---|---|---|---|
| Thighs | |||||||
| Colour | 4.78 ± 1.41 b | 6.29 ± 1.49 a | 3.04 ± 1.32 c | 3.43 ± 1.43 c | 0.001 | 0.001 | 0.001 |
| Tenderness | 2.45 ± 1.03 c | 2.99 ± 1.45 b | 4.38 ± 1.34 a | 4.01 ± 1.21 a | 0.001 | 0.46 | 0.001 |
| Juiciness | 1.54 ± 0.85 | 1.81 ± 1.21 | 2.22 ± 0.97 | 2.36 ± 1.32 | 0.001 | 0.05 | 0.56 |
| Stinginess | 2.18 ± 1.15 | 2.86 ± 1.40 | 1.47 ± 1.18 | 1.99 ± 1.21 | 0.001 | 0.001 | 0.47 |
| Compactness | 3.03 ± 1.75 | 2.60 ± 1.97 | 1.64 ± 1.11 | 1.76 ± 1.25 | 0.001 | 0.29 | 0.07 |
| Oily sensation | 1.35 ± 1.19 | 1.50 ± 1.42 | 1.54 ± 1.29 | 1.47 ± 1.14 | 0.51 | 0.73 | 0.37 |
| Global flavour | 3.92 ± 1.05 | 4.08 ± 1.01 | 3.83 ± 1.00 | 3.88 ± 0.95 | 0.13 | 0.29 | 0.55 |
| Rancid flavour | 0.37 ± 0.41 | 0.37 ± 0.37 | 0.36 ± 0.39 | 0.32 ± 0.29 | 0.36 | 0.45 | 0.63 |
| Global appreciation | 2.52 ± 1.26 | 2.51 ± 1.21 | 3.38 ± 1.54 | 3.58 ± 1.33 | 0.001 | 0.46 | 0.39 |
| Breast | |||||||
| Colour | 2.25 ± 1.43 | 2.49 ± 1.35 | 2.23 ± 1.37 | 2.45 ± 1.36 | 0.83 | 0.07 | 0.93 |
| Tenderness | 3.79 ± 1.16 b | 2.07 ± 1.14 c | 4.71 ± 1.39 a | 4.41 ± 1.33 a | 0.001 | 0.001 | 0.001 |
| Juiciness | 3.05 ± 1.46 | 2.78 ± 1.61 | 3.33 ± 1.50 | 3.15 ± 1.31 | 0.02 | 0.11 | 0.74 |
| Stringiness | 2.28 ± 1.26 b | 3.15 ± 1.61 a | 1.69 ± 1.24 c | 2.03 ± 1.21 bc | 0.001 | 0.001 | 0.04 |
| Sticky | 1.63 ± 1.13 | 1.11 ± 1.00 | 1.83 ± 1.33 | 1.71 ± 1.19 | 0.001 | 0.004 | 0.07 |
| Global flavour | 3.41 ± 0.94 a | 3.00 ± 1.04 b | 3.37 ± 1.03 a | 3.38 ± 0.99 a | 0.06 | 0.03 | 0.03 |
| Acid flavour | 1.11 ± 0.80 | 1.03 ± 1.00 | 1.36 ± 1.13 | 1.26 ± 1.02 | 0.01 | 0.31 | 0.93 |
| Rancid flavour | 0.33 ± 0.29 | 0.37 ± 0.42 | 0.33 ± 0.34 | 0.29 ± 0.28 | 0.23 | 0.82 | 0.23 |
| Global appréciation | 2.27 ± 1.16 a | 1.60 ± 1.03 b | 2.28 ± 1.23 a | 2.42 ± 1.25 a | 0.001 | 0.02 | 0.001 |
| Female Breeders | Male Breeders | Standard Females | Standard Males | Physiological Stage Effect | Sex Effect | Interaction Effect | |
|---|---|---|---|---|---|---|---|
| Collagen, % | 19.09 ± 3.20 | 17.06 ± 2.37 | 20.75 ± 1.88 | 18.85 ± 3.50 | 0.03 | 0.02 | 0.94 |
| AST, µm2 | 1826 ± 419 b | 3695 ± 593 a | 1181 ± 238 c | 2117 ± 439 b | 0.001 | 0.001 | 0.001 |
© 2018 by the authors. Licensee MDPI, Basel, Switzerland. This article is an open access article distributed under the terms and conditions of the Creative Commons Attribution (CC BY) license (http://creativecommons.org/licenses/by/4.0/).
Share and Cite
Chartrin, P.; Bordeau, T.; Godet, E.; Méteau, K.; Gicquel, J.-C.; Drosnet, E.; Brière, S.; Bourin, M.; Baéza, E. Is Meat of Breeder Turkeys so Different from That of Standard Turkeys? Foods 2019, 8, 8. https://doi.org/10.3390/foods8010008
Chartrin P, Bordeau T, Godet E, Méteau K, Gicquel J-C, Drosnet E, Brière S, Bourin M, Baéza E. Is Meat of Breeder Turkeys so Different from That of Standard Turkeys? Foods. 2019; 8(1):8. https://doi.org/10.3390/foods8010008
Chicago/Turabian StyleChartrin, Pascal, Thierry Bordeau, Estelle Godet, Karine Méteau, Jean-Christian Gicquel, Estelle Drosnet, Sylvain Brière, Marie Bourin, and Elisabeth Baéza. 2019. "Is Meat of Breeder Turkeys so Different from That of Standard Turkeys?" Foods 8, no. 1: 8. https://doi.org/10.3390/foods8010008