
The “Crosstalk” between Microbiota and Metabolomic Profile of Kefalograviera Cheese after the Innovative Feeding Strategy of Dairy Sheep by Omega-3 Fatty Acids

 , ,
, ,  , ,
, ,  and
and 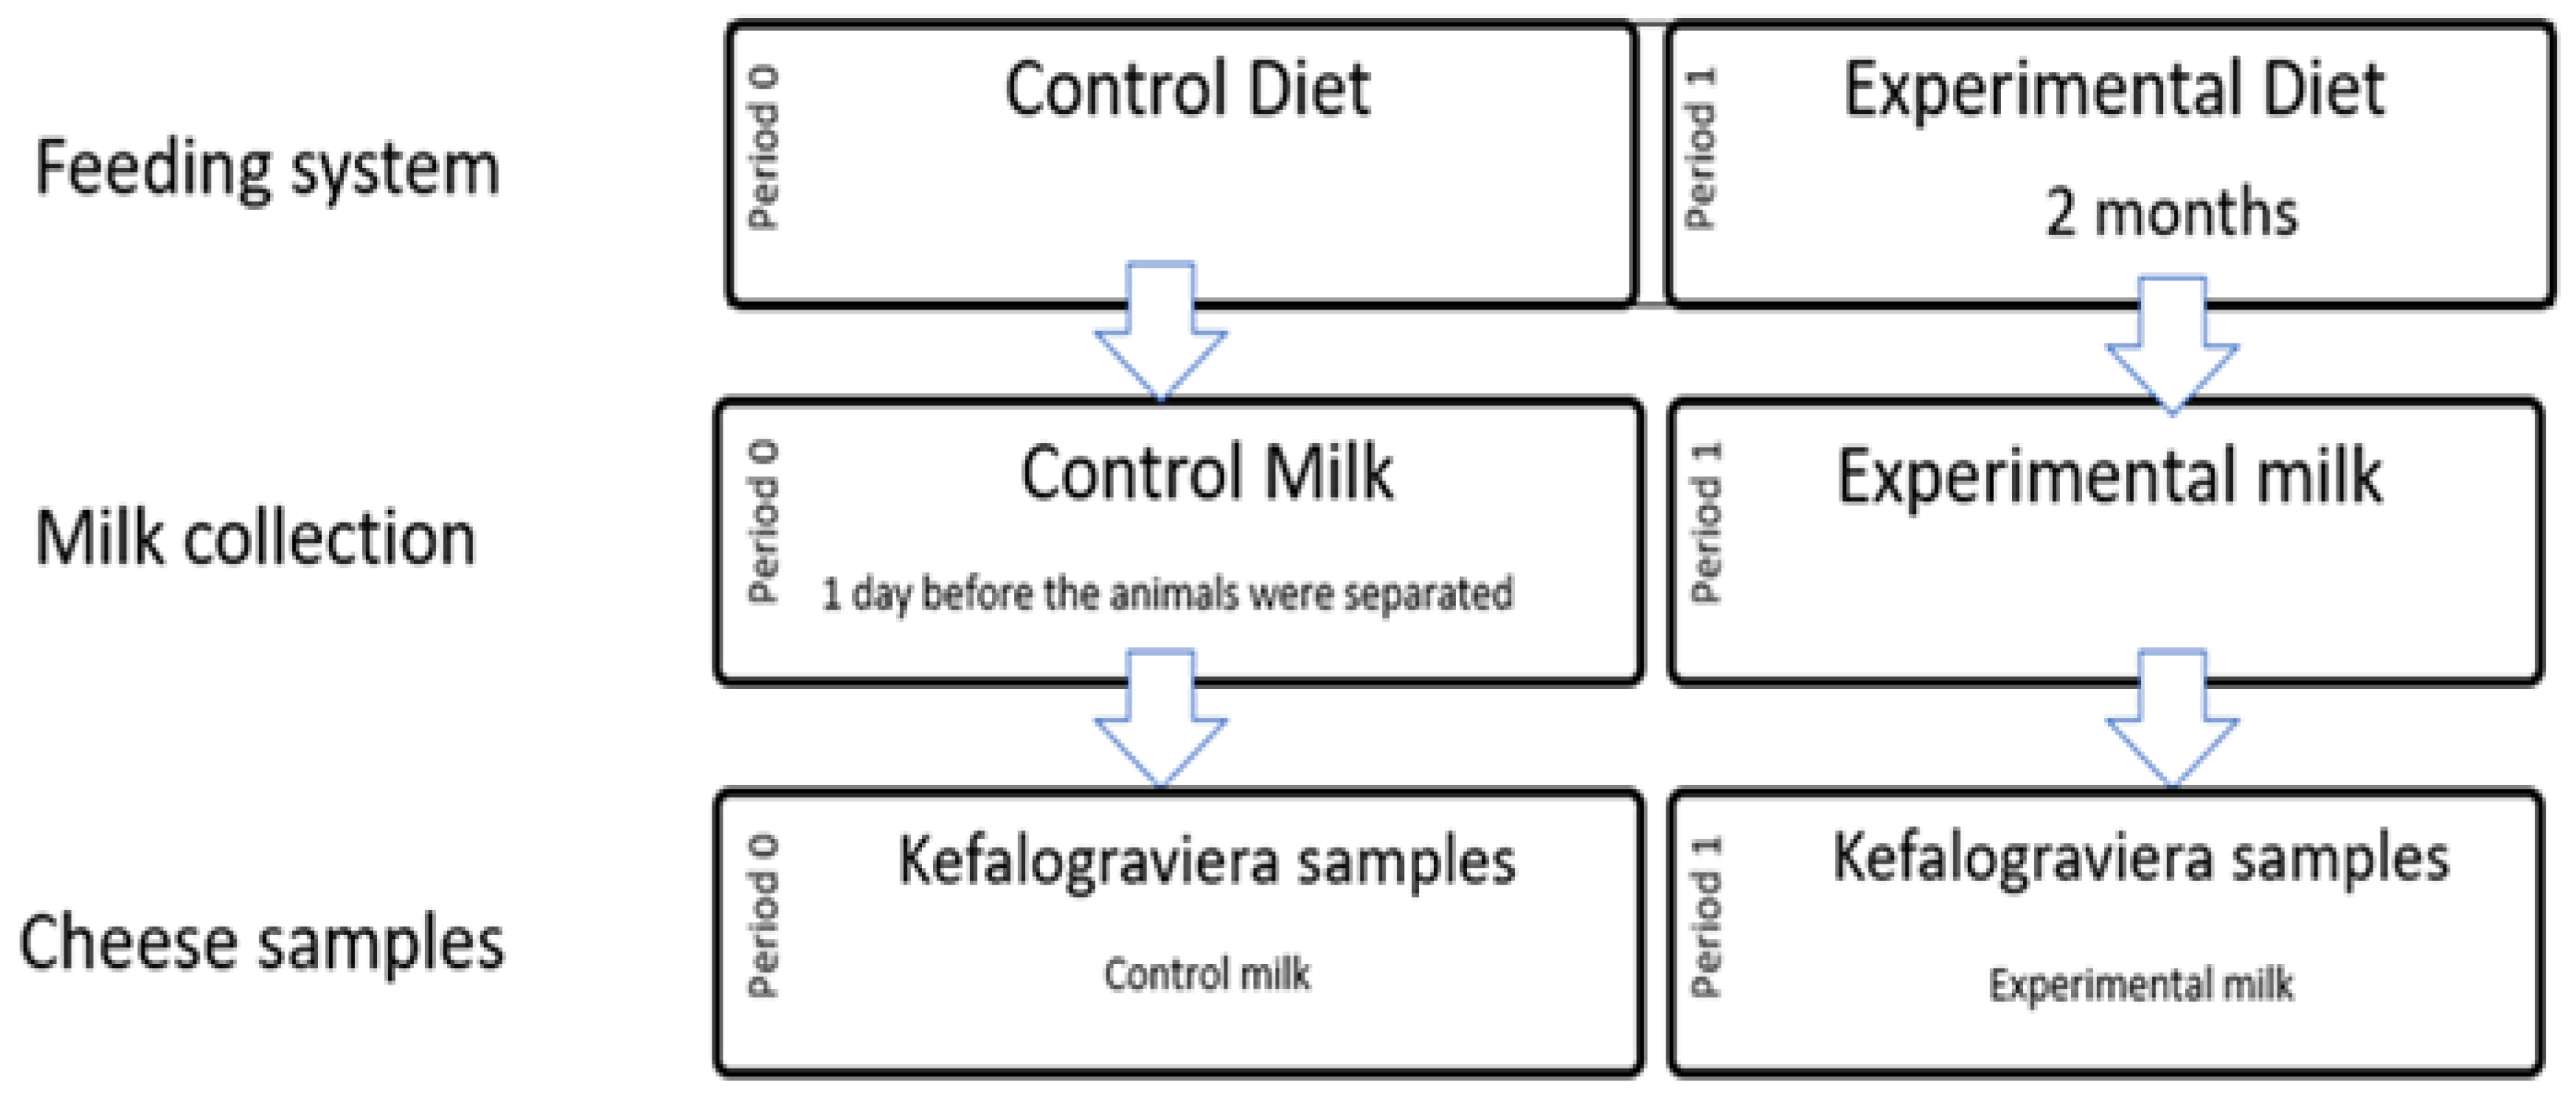
Abstract
:1. Introduction
2. Materials and Methods
2.1. Animals, Dietary Treatments, and Milk Collection
2.2. Kefalograviera Cheese Production and Sampling
2.3. DNA Isolation
2.4. Sequencing Preparation, Run, and Processing
Data Processing—Operational Taxonomic Units (OTUs) Analysis
2.5. Chemicals and Reagents
2.6. Metabolomics Sample Preparation Protocol
2.7. LC-ESI-QTOFMS Instrumentation
2.8. LC-HRMS—Metabolomics Data Processing Workflow
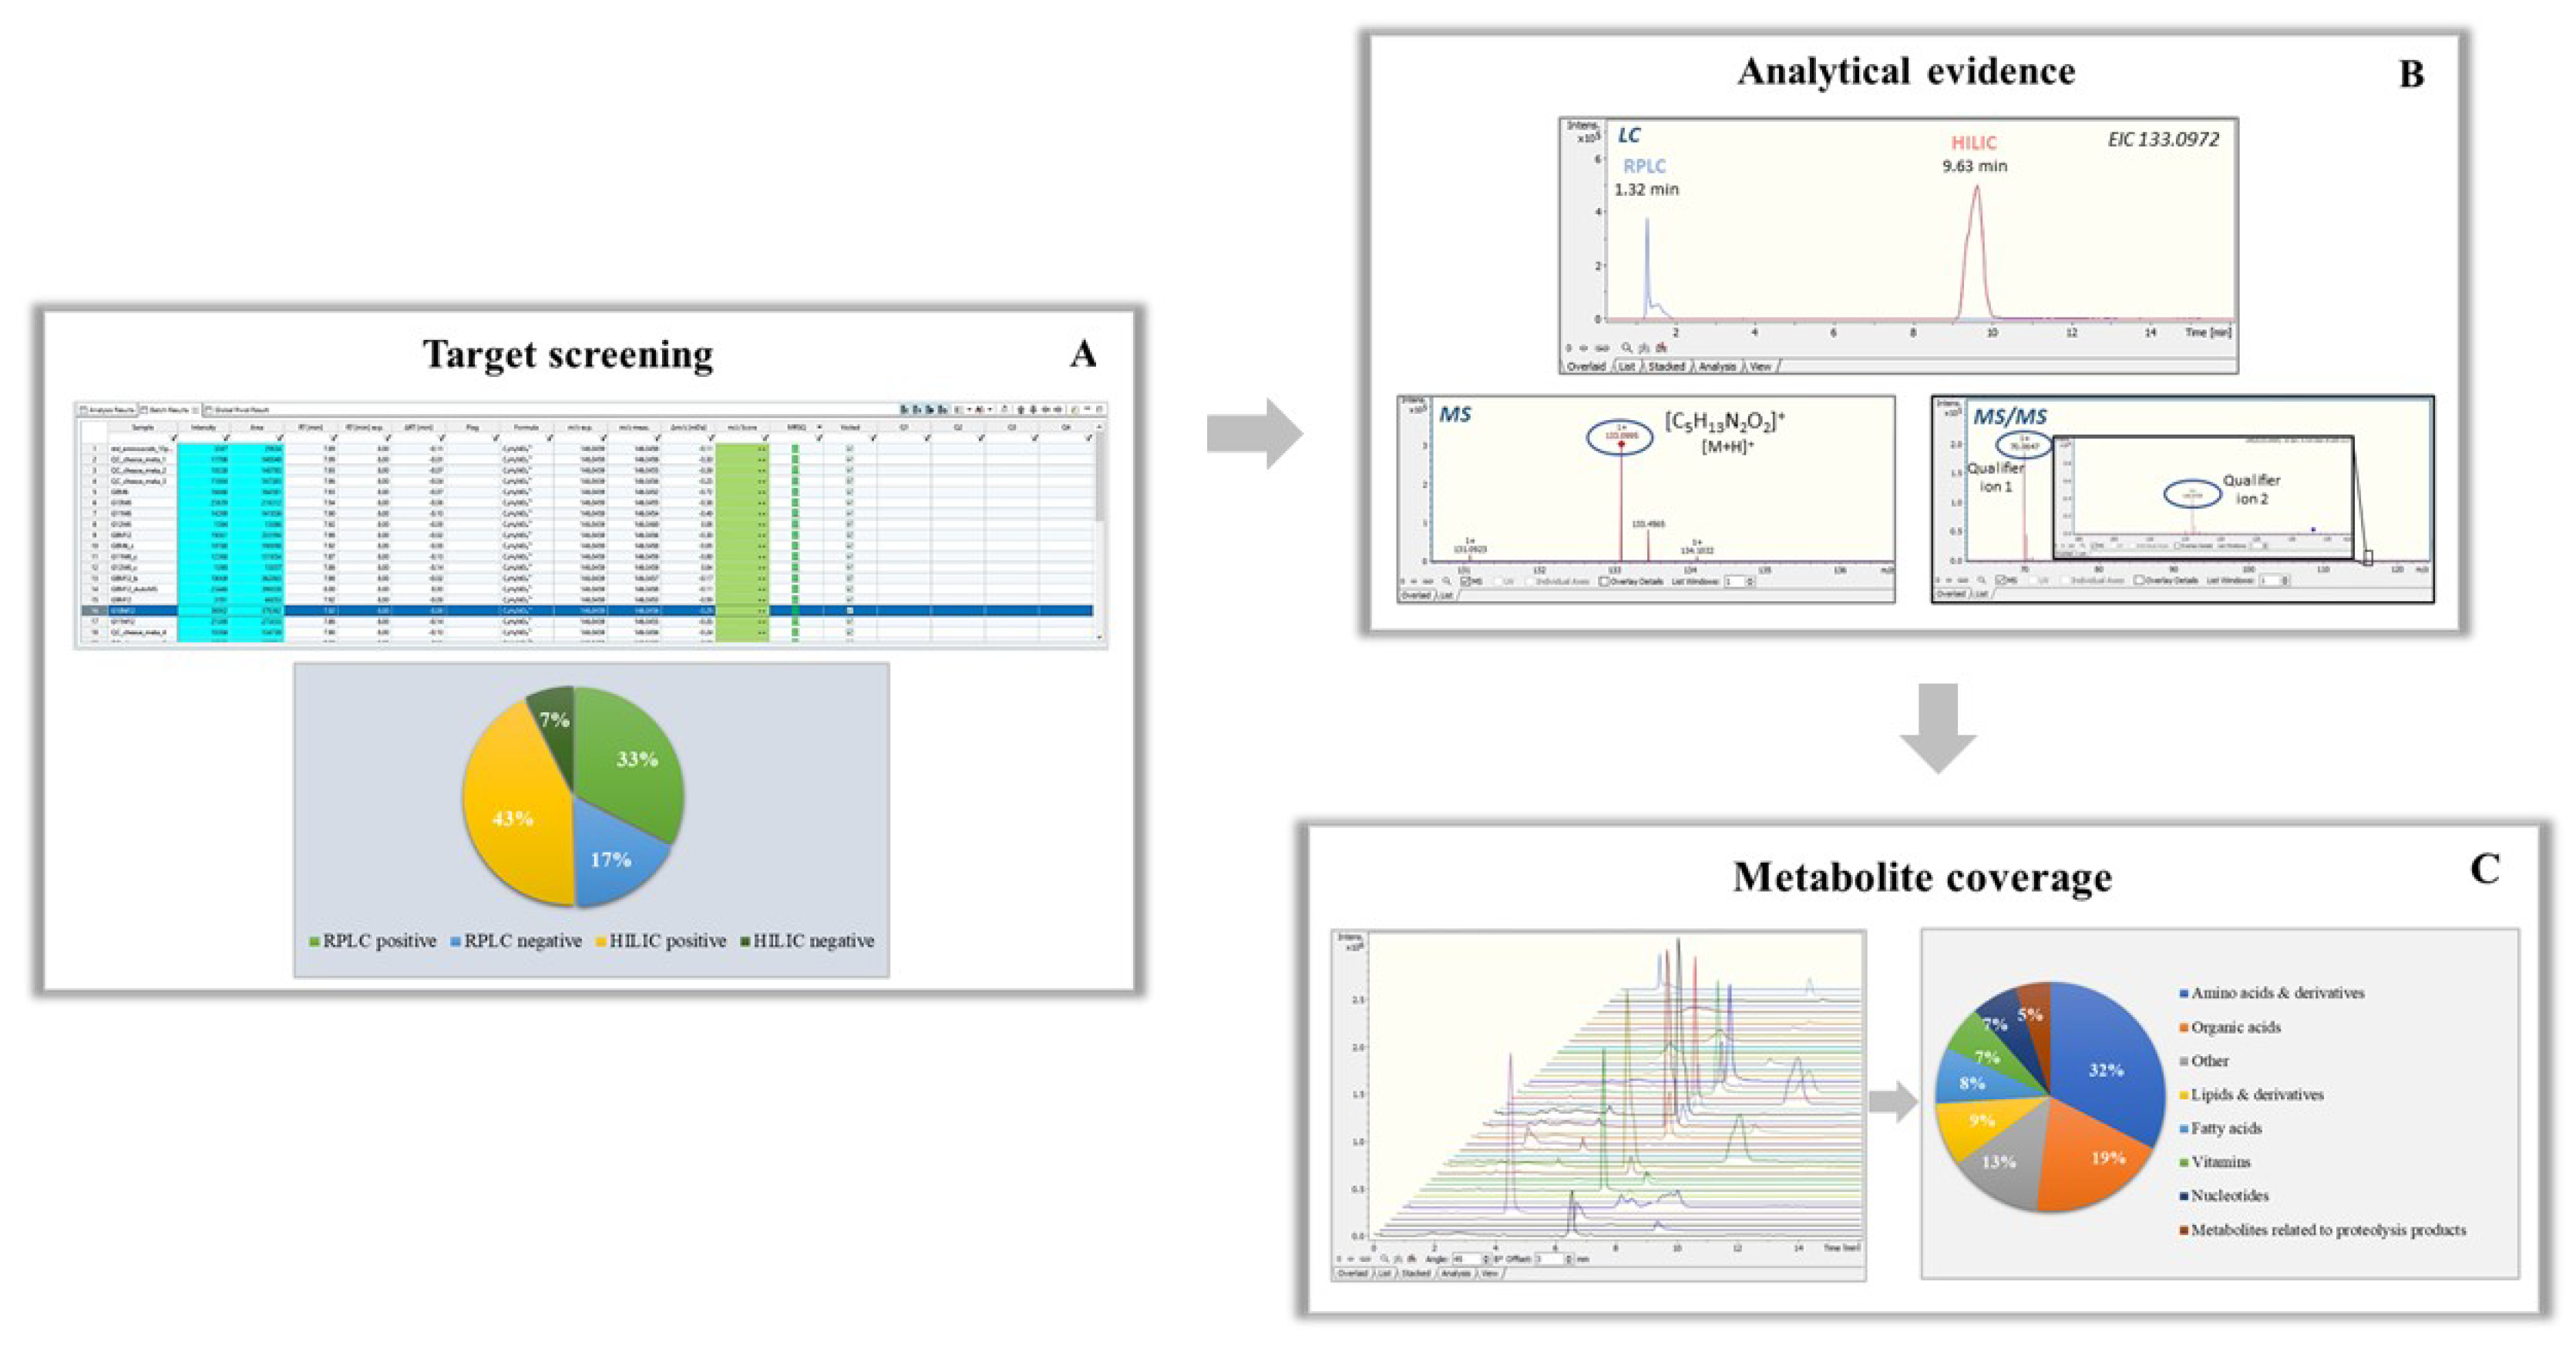
2.8.1. Target Screening Workflow
2.8.2. Statistical Analysis
2.9. Correlation Statistical Analysis
3. Results and Discussion
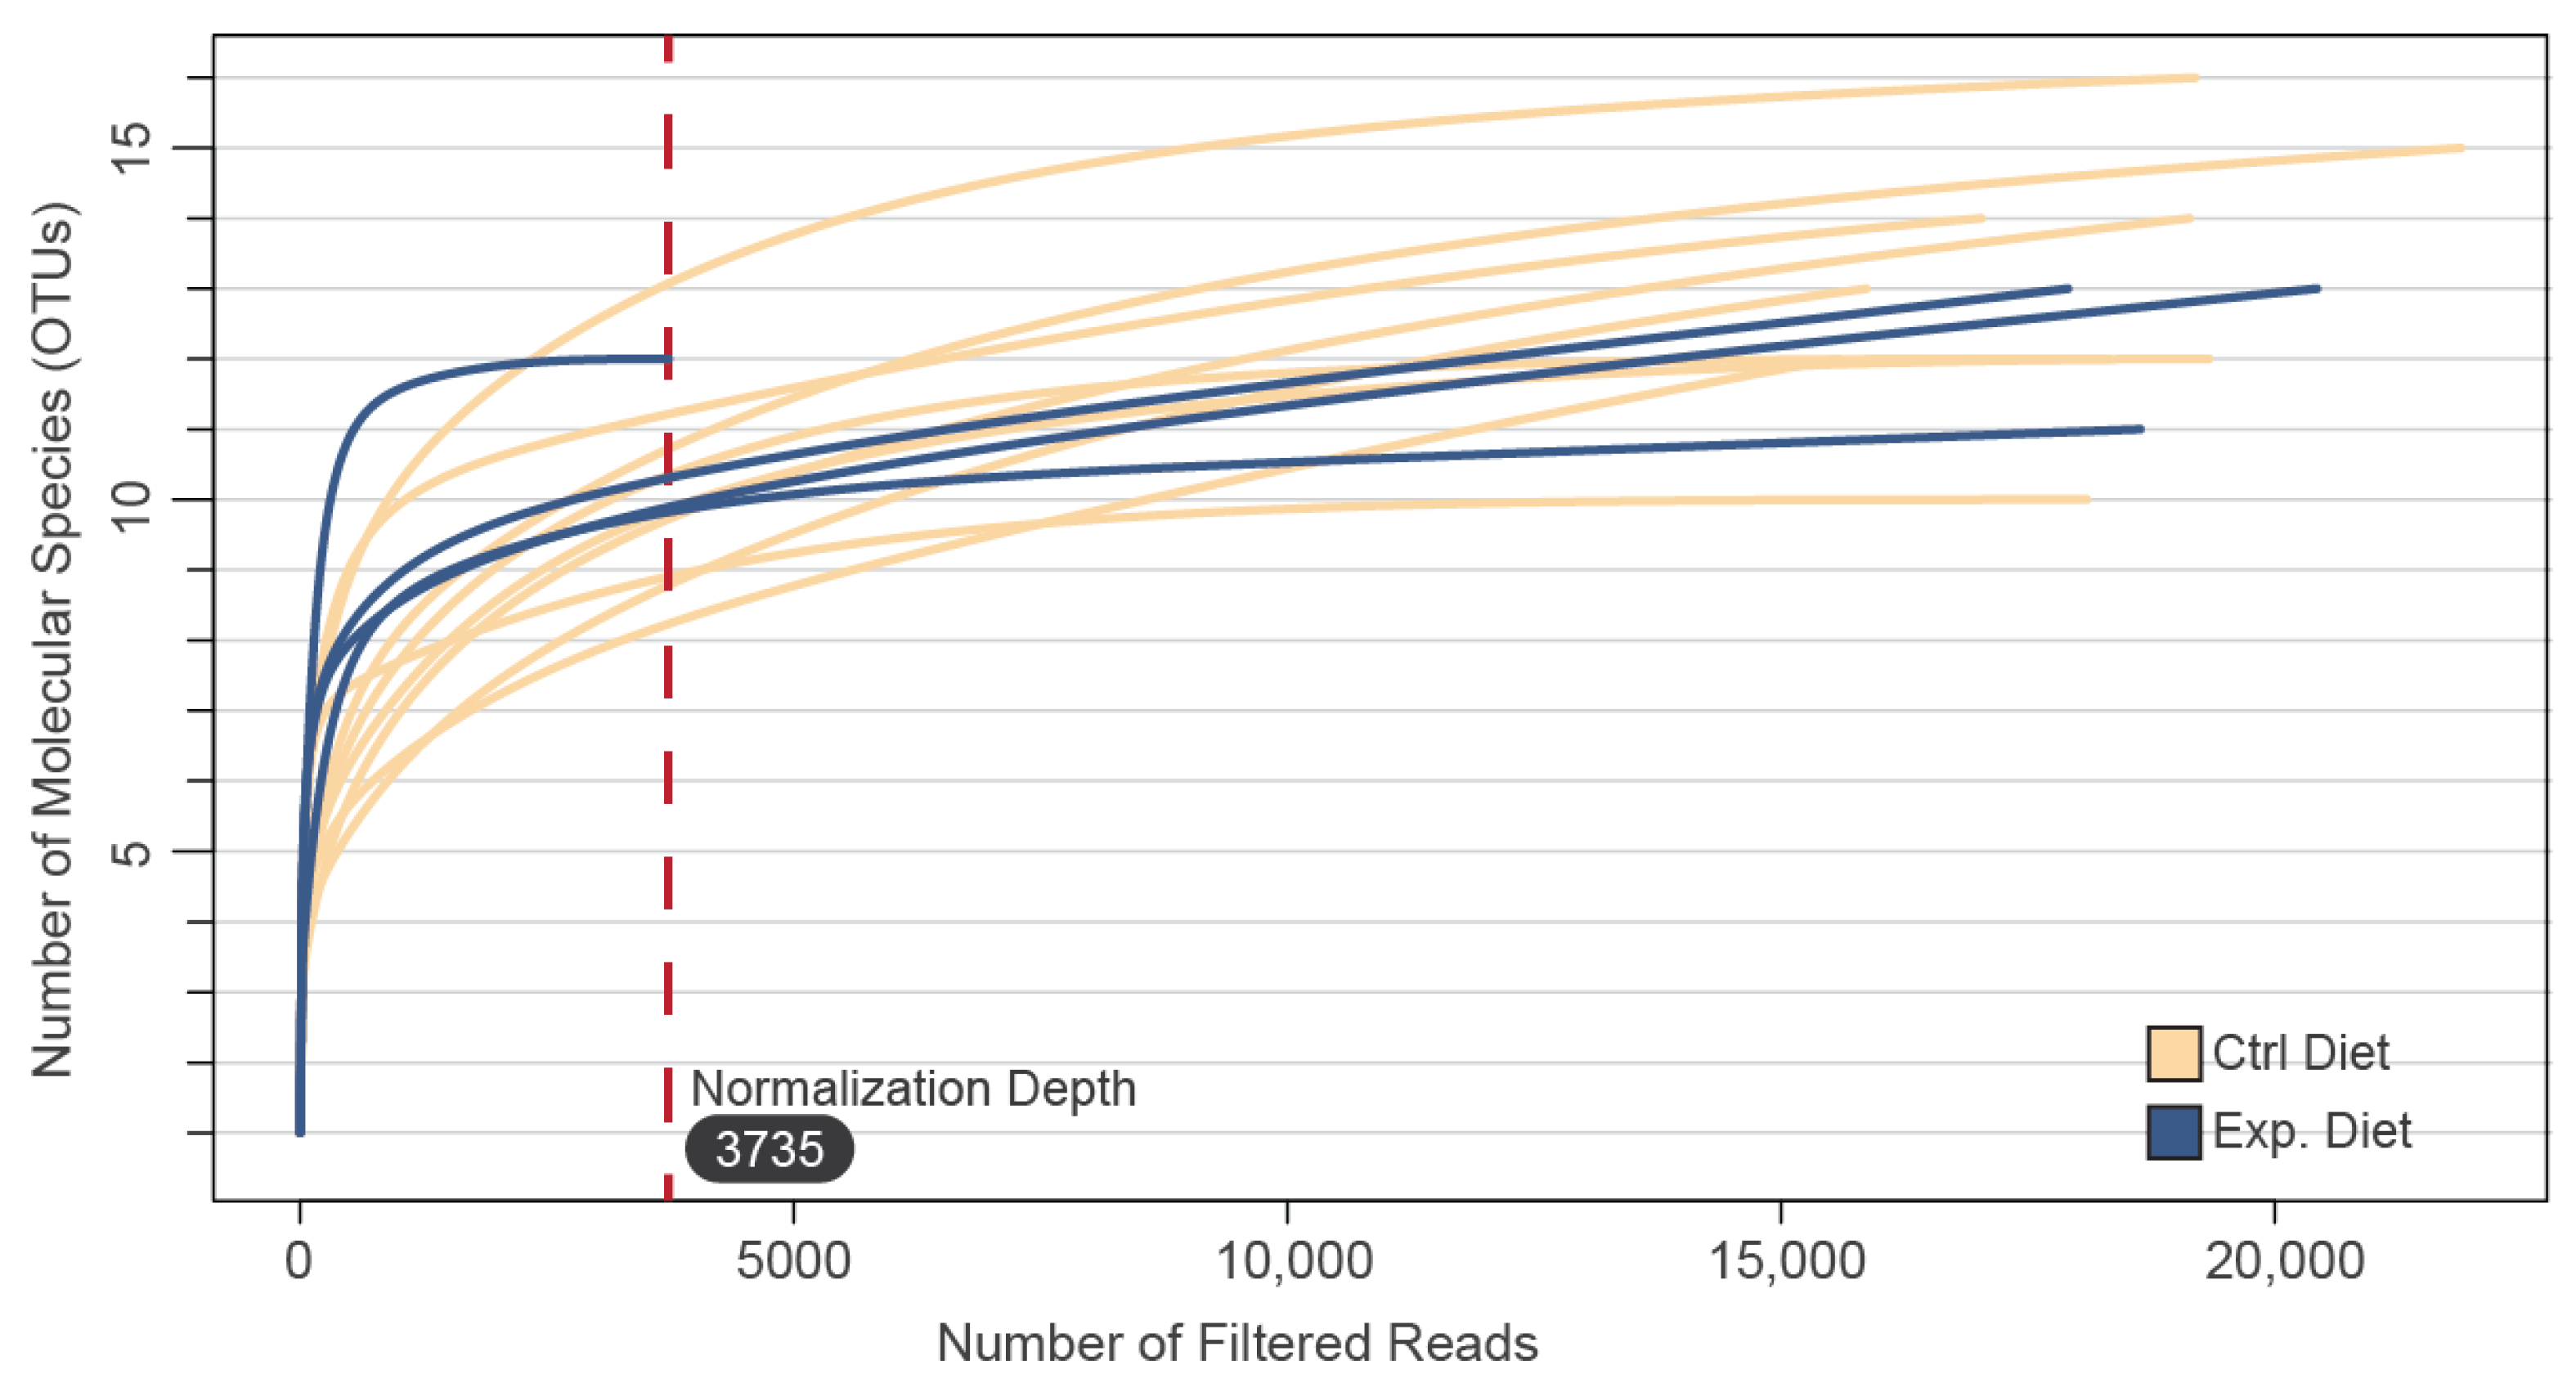
3.1. Sequencing Coverage
3.1.1. α-Diversity
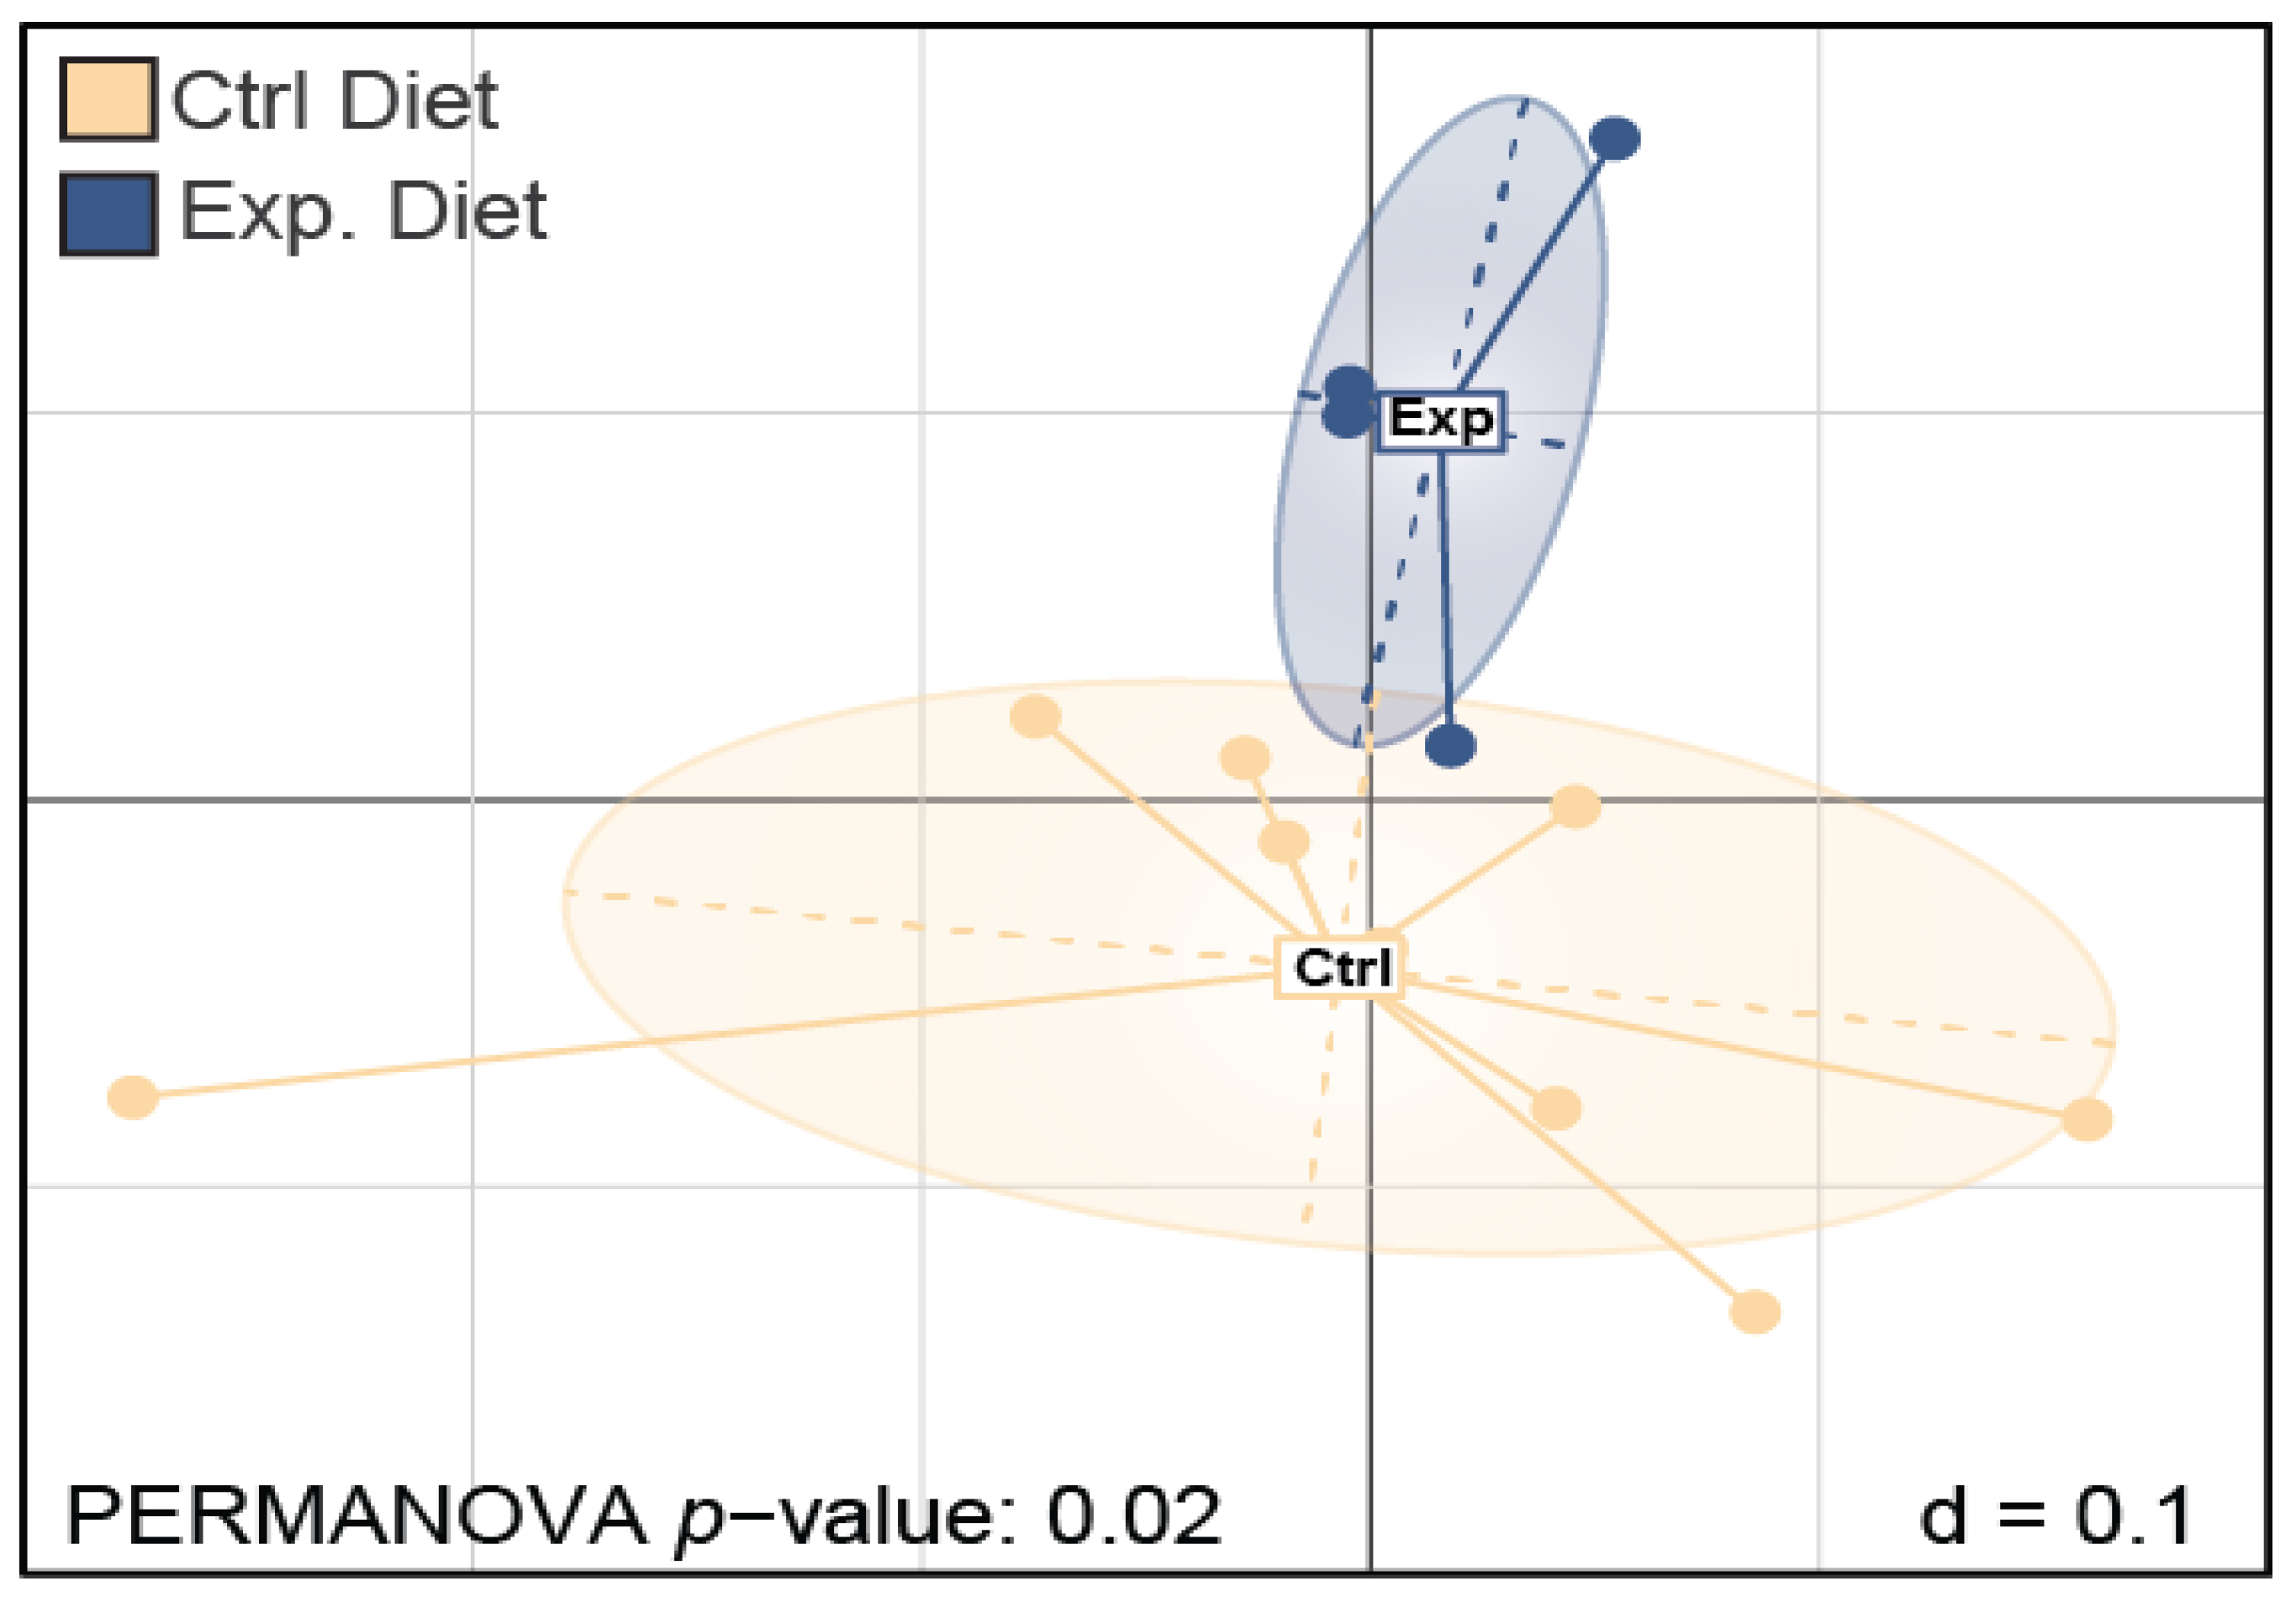
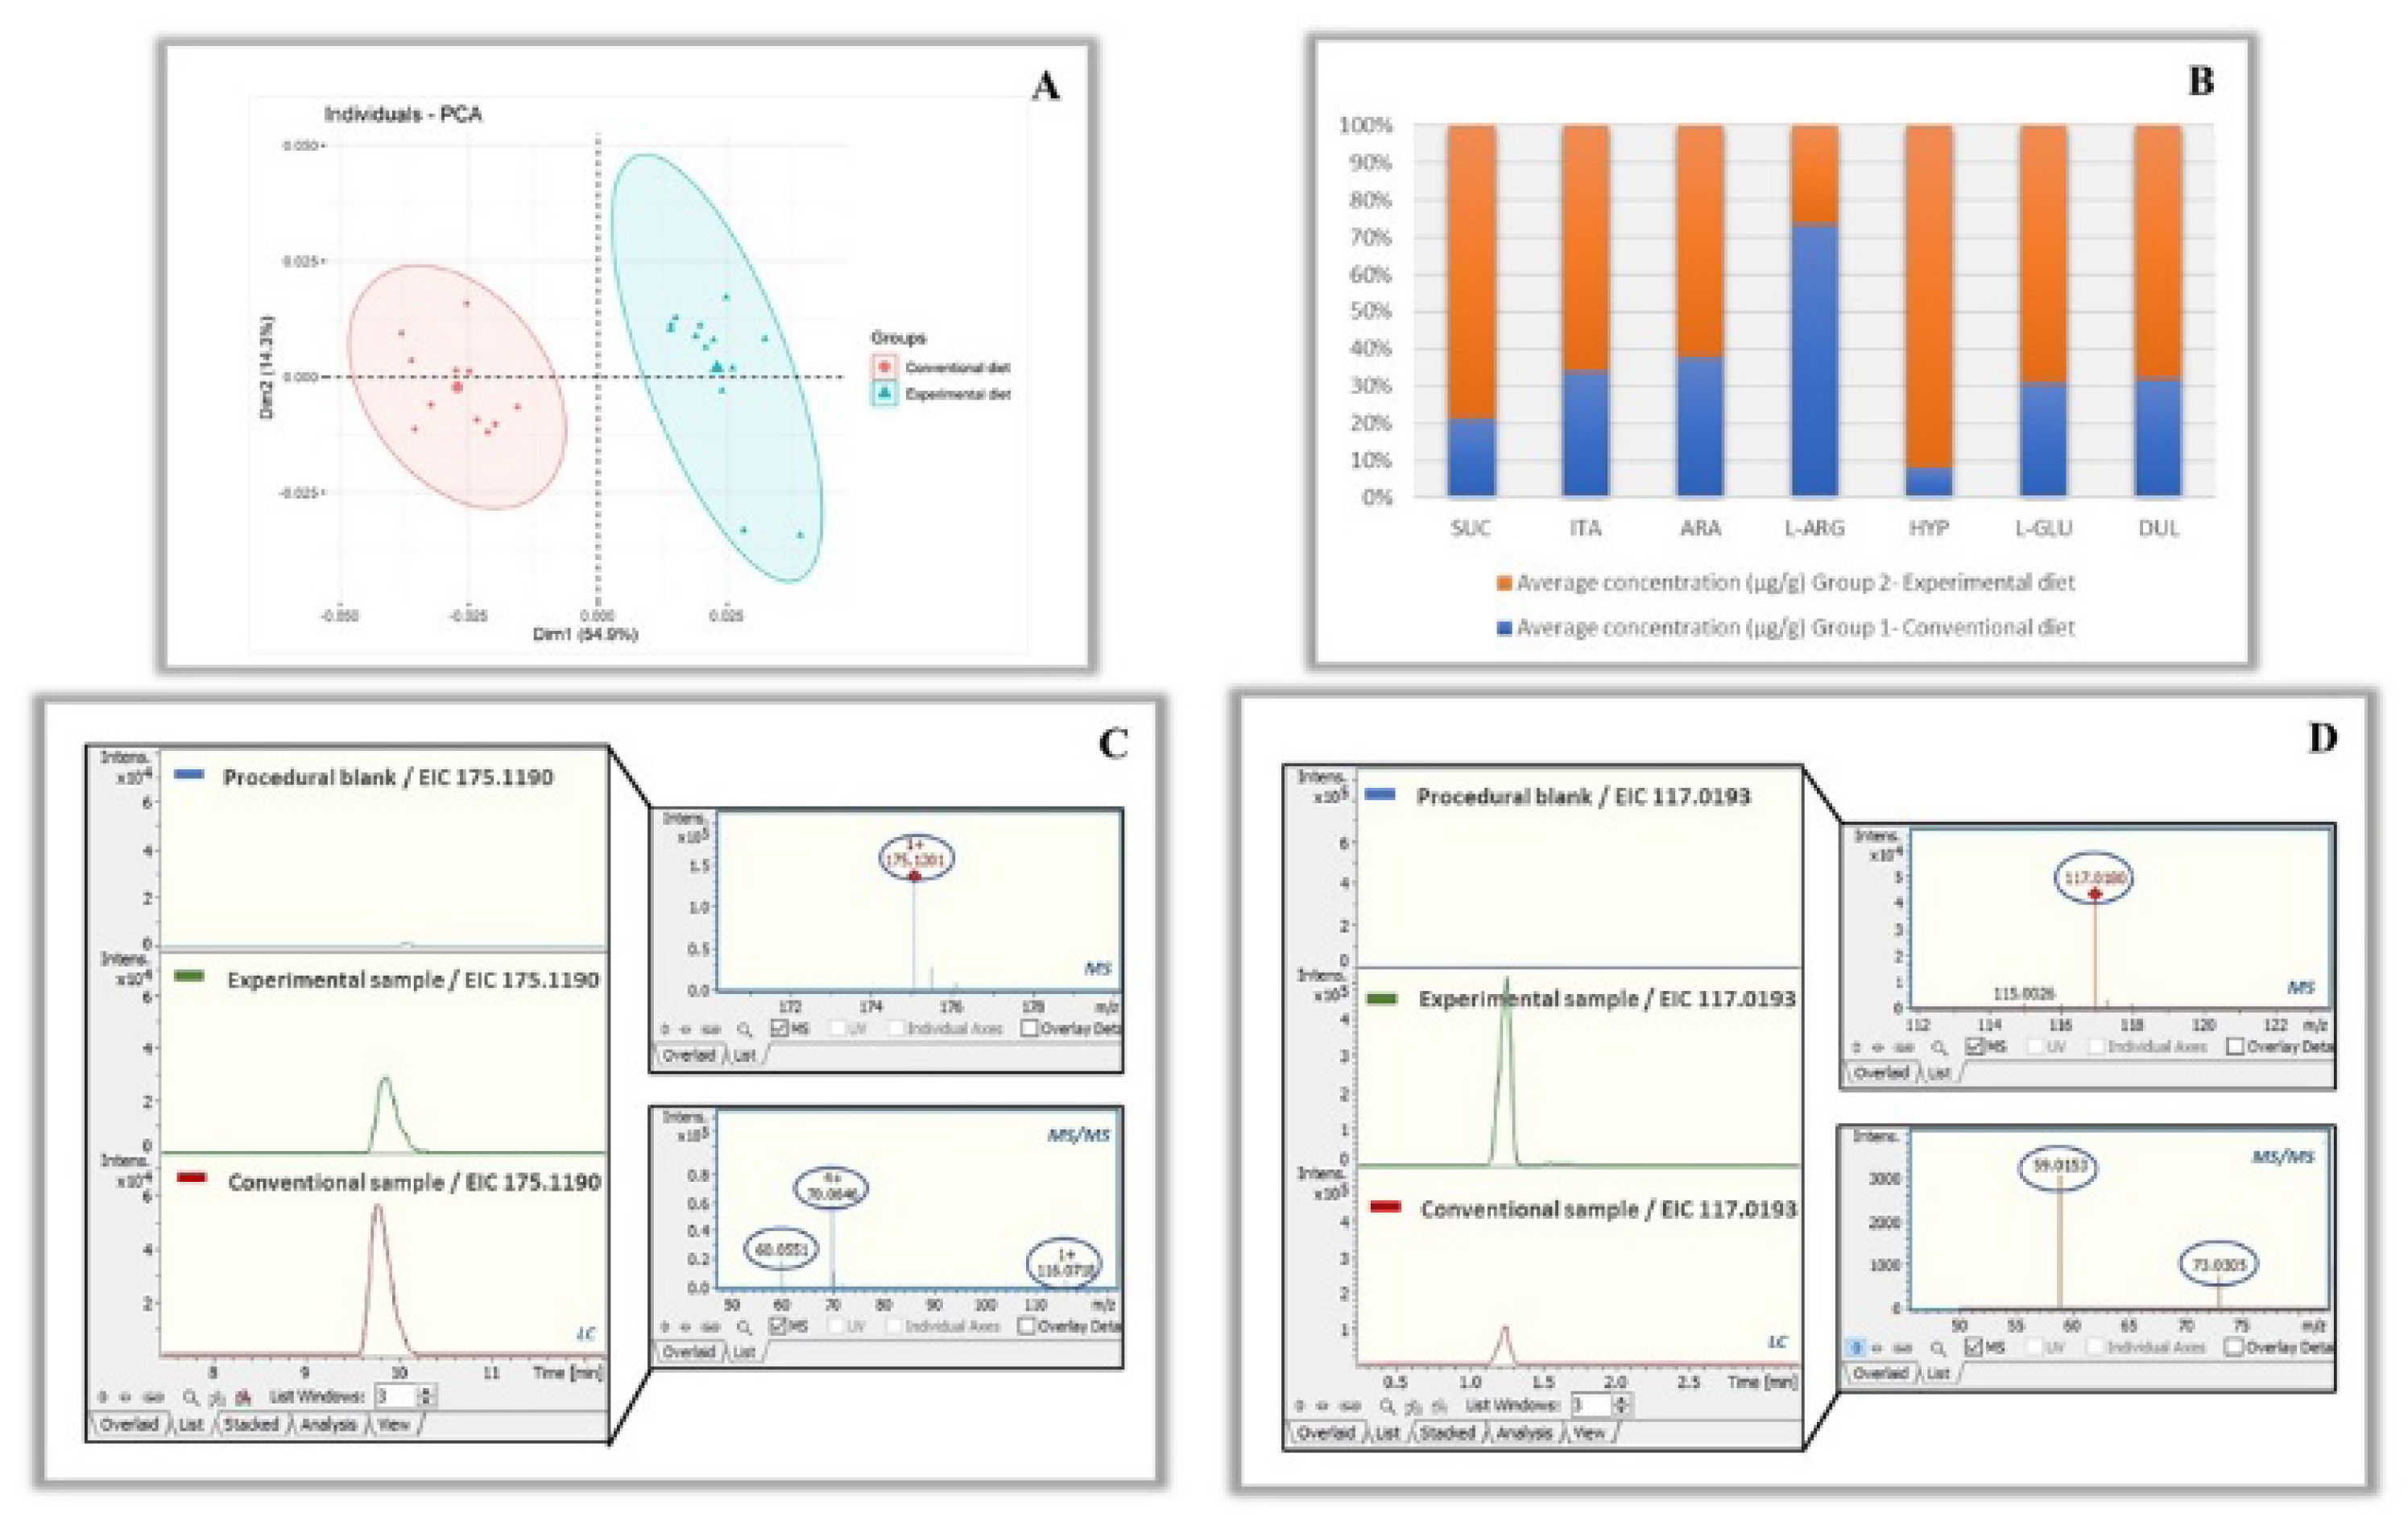
3.1.2. β-Diversity
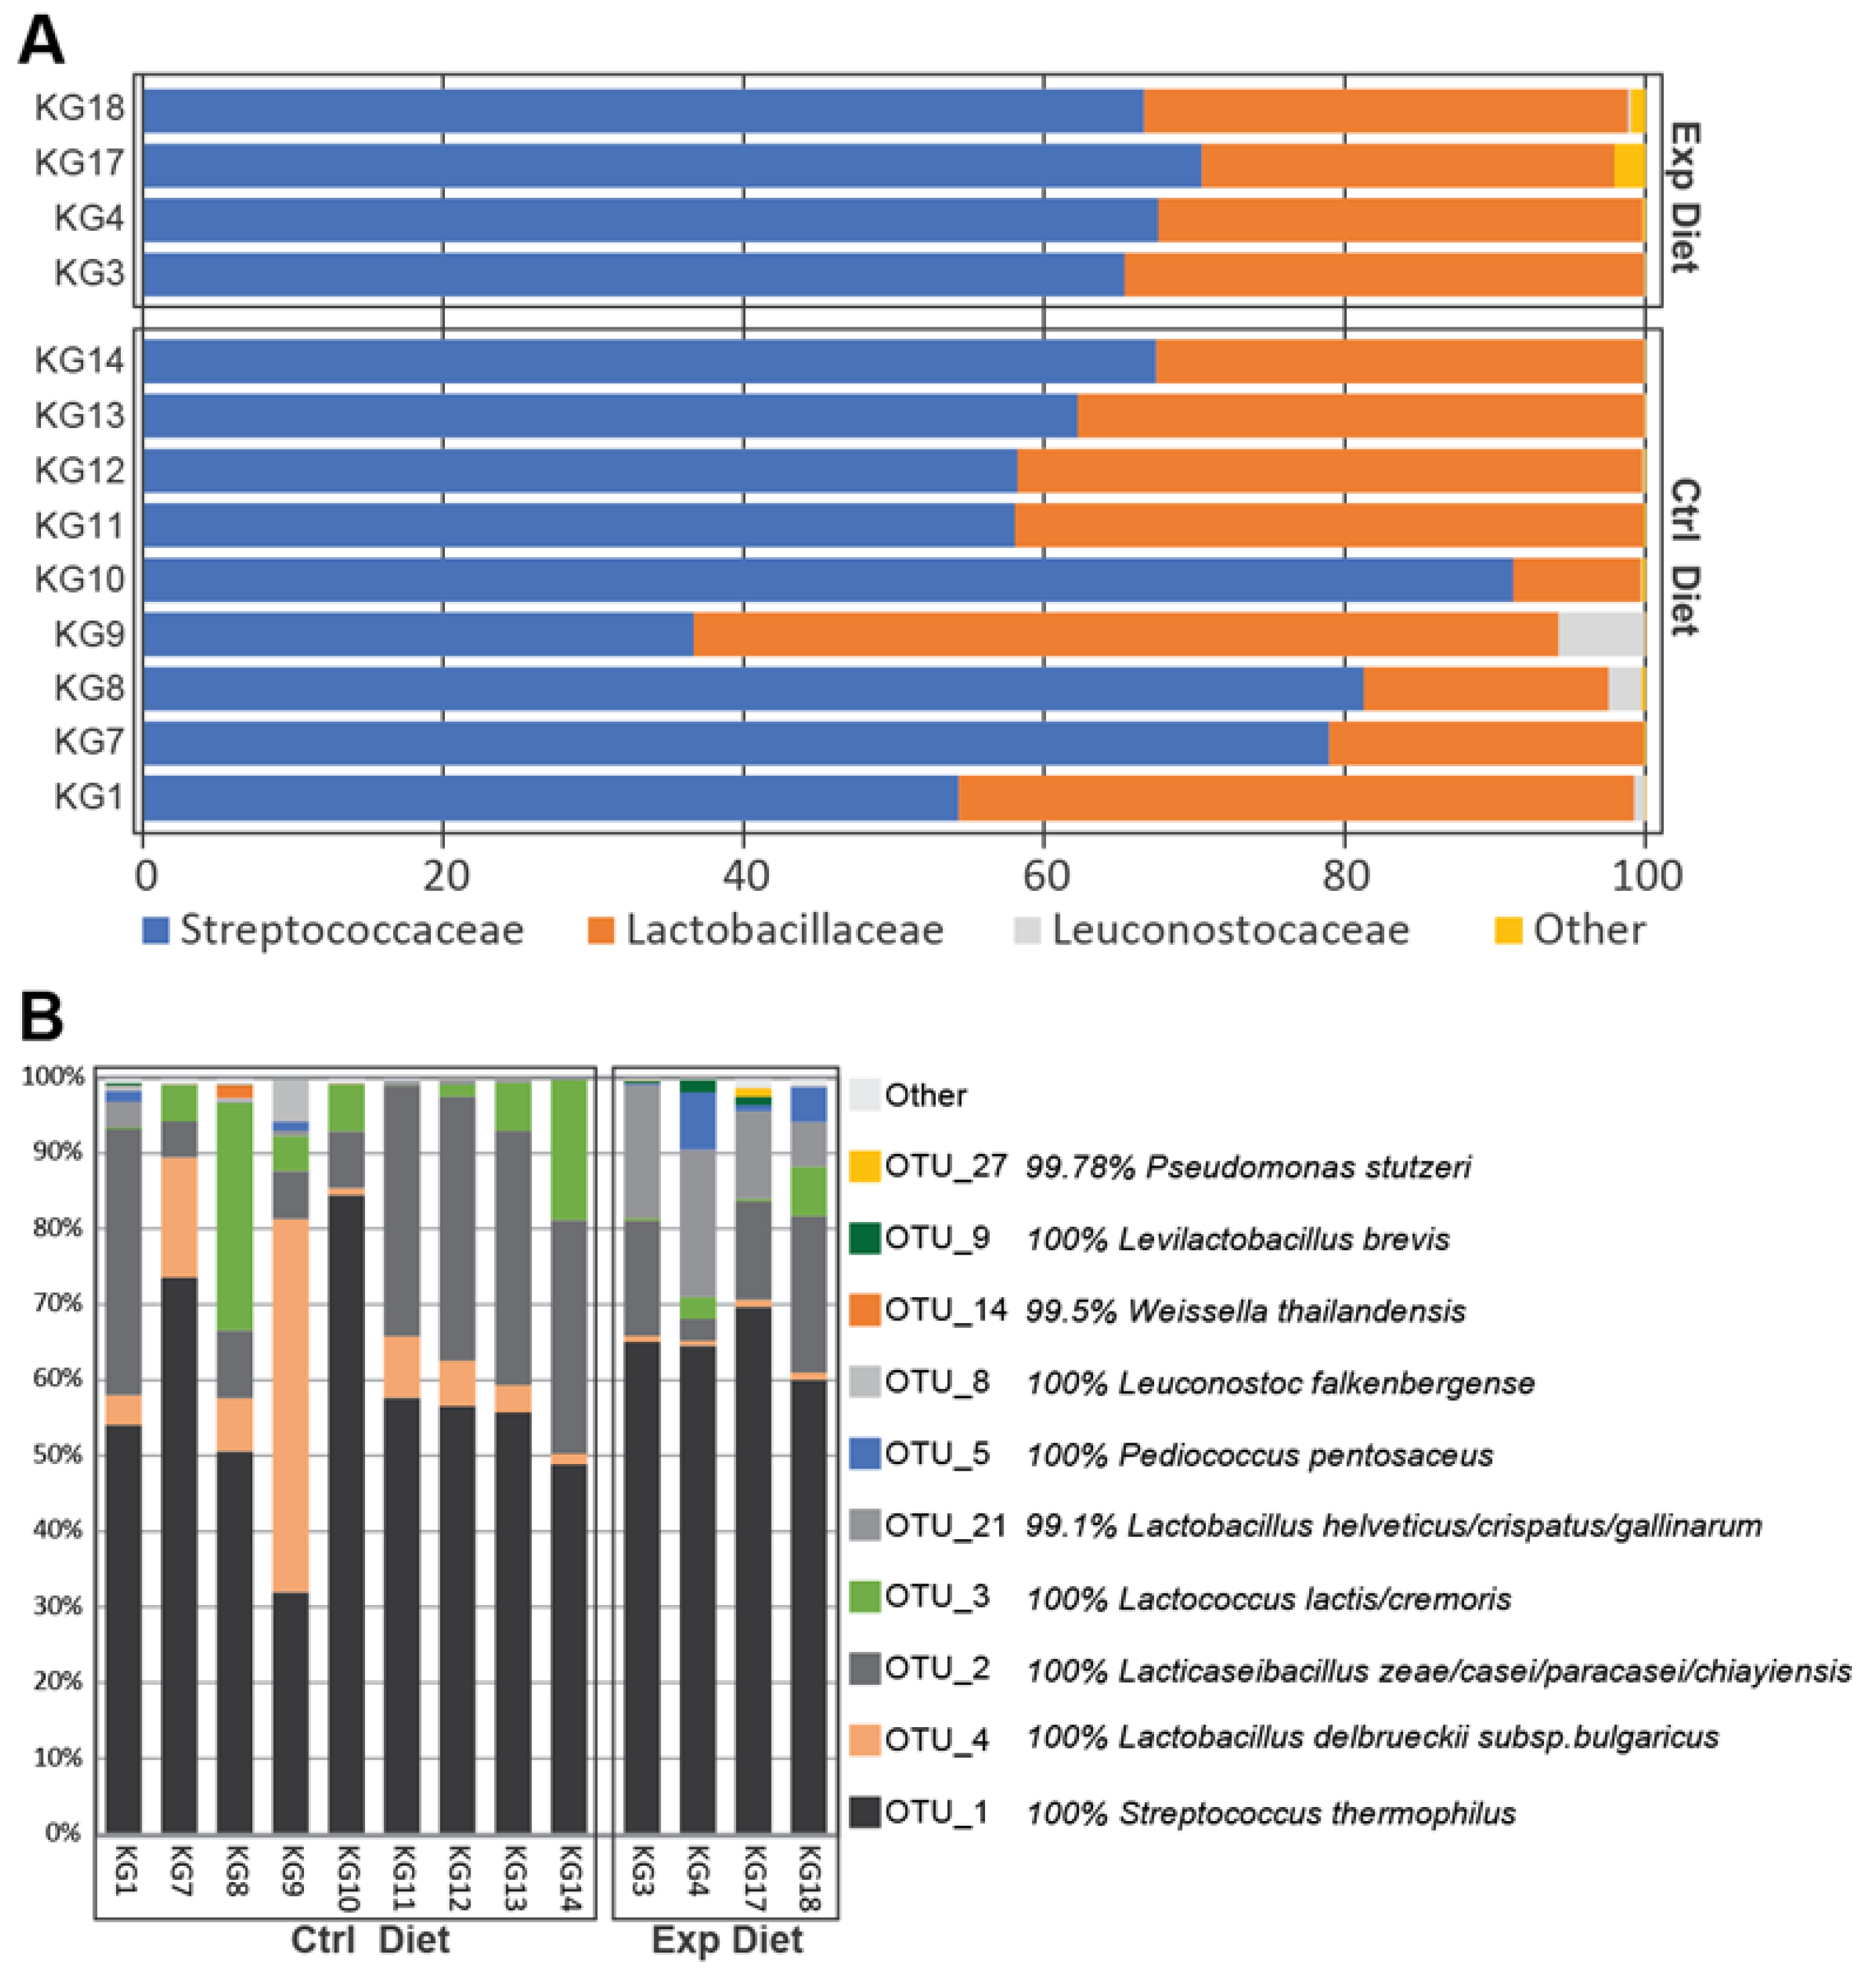
3.2. Bacterial Diversity Estimation
3.3. Target Metabolomic Screening
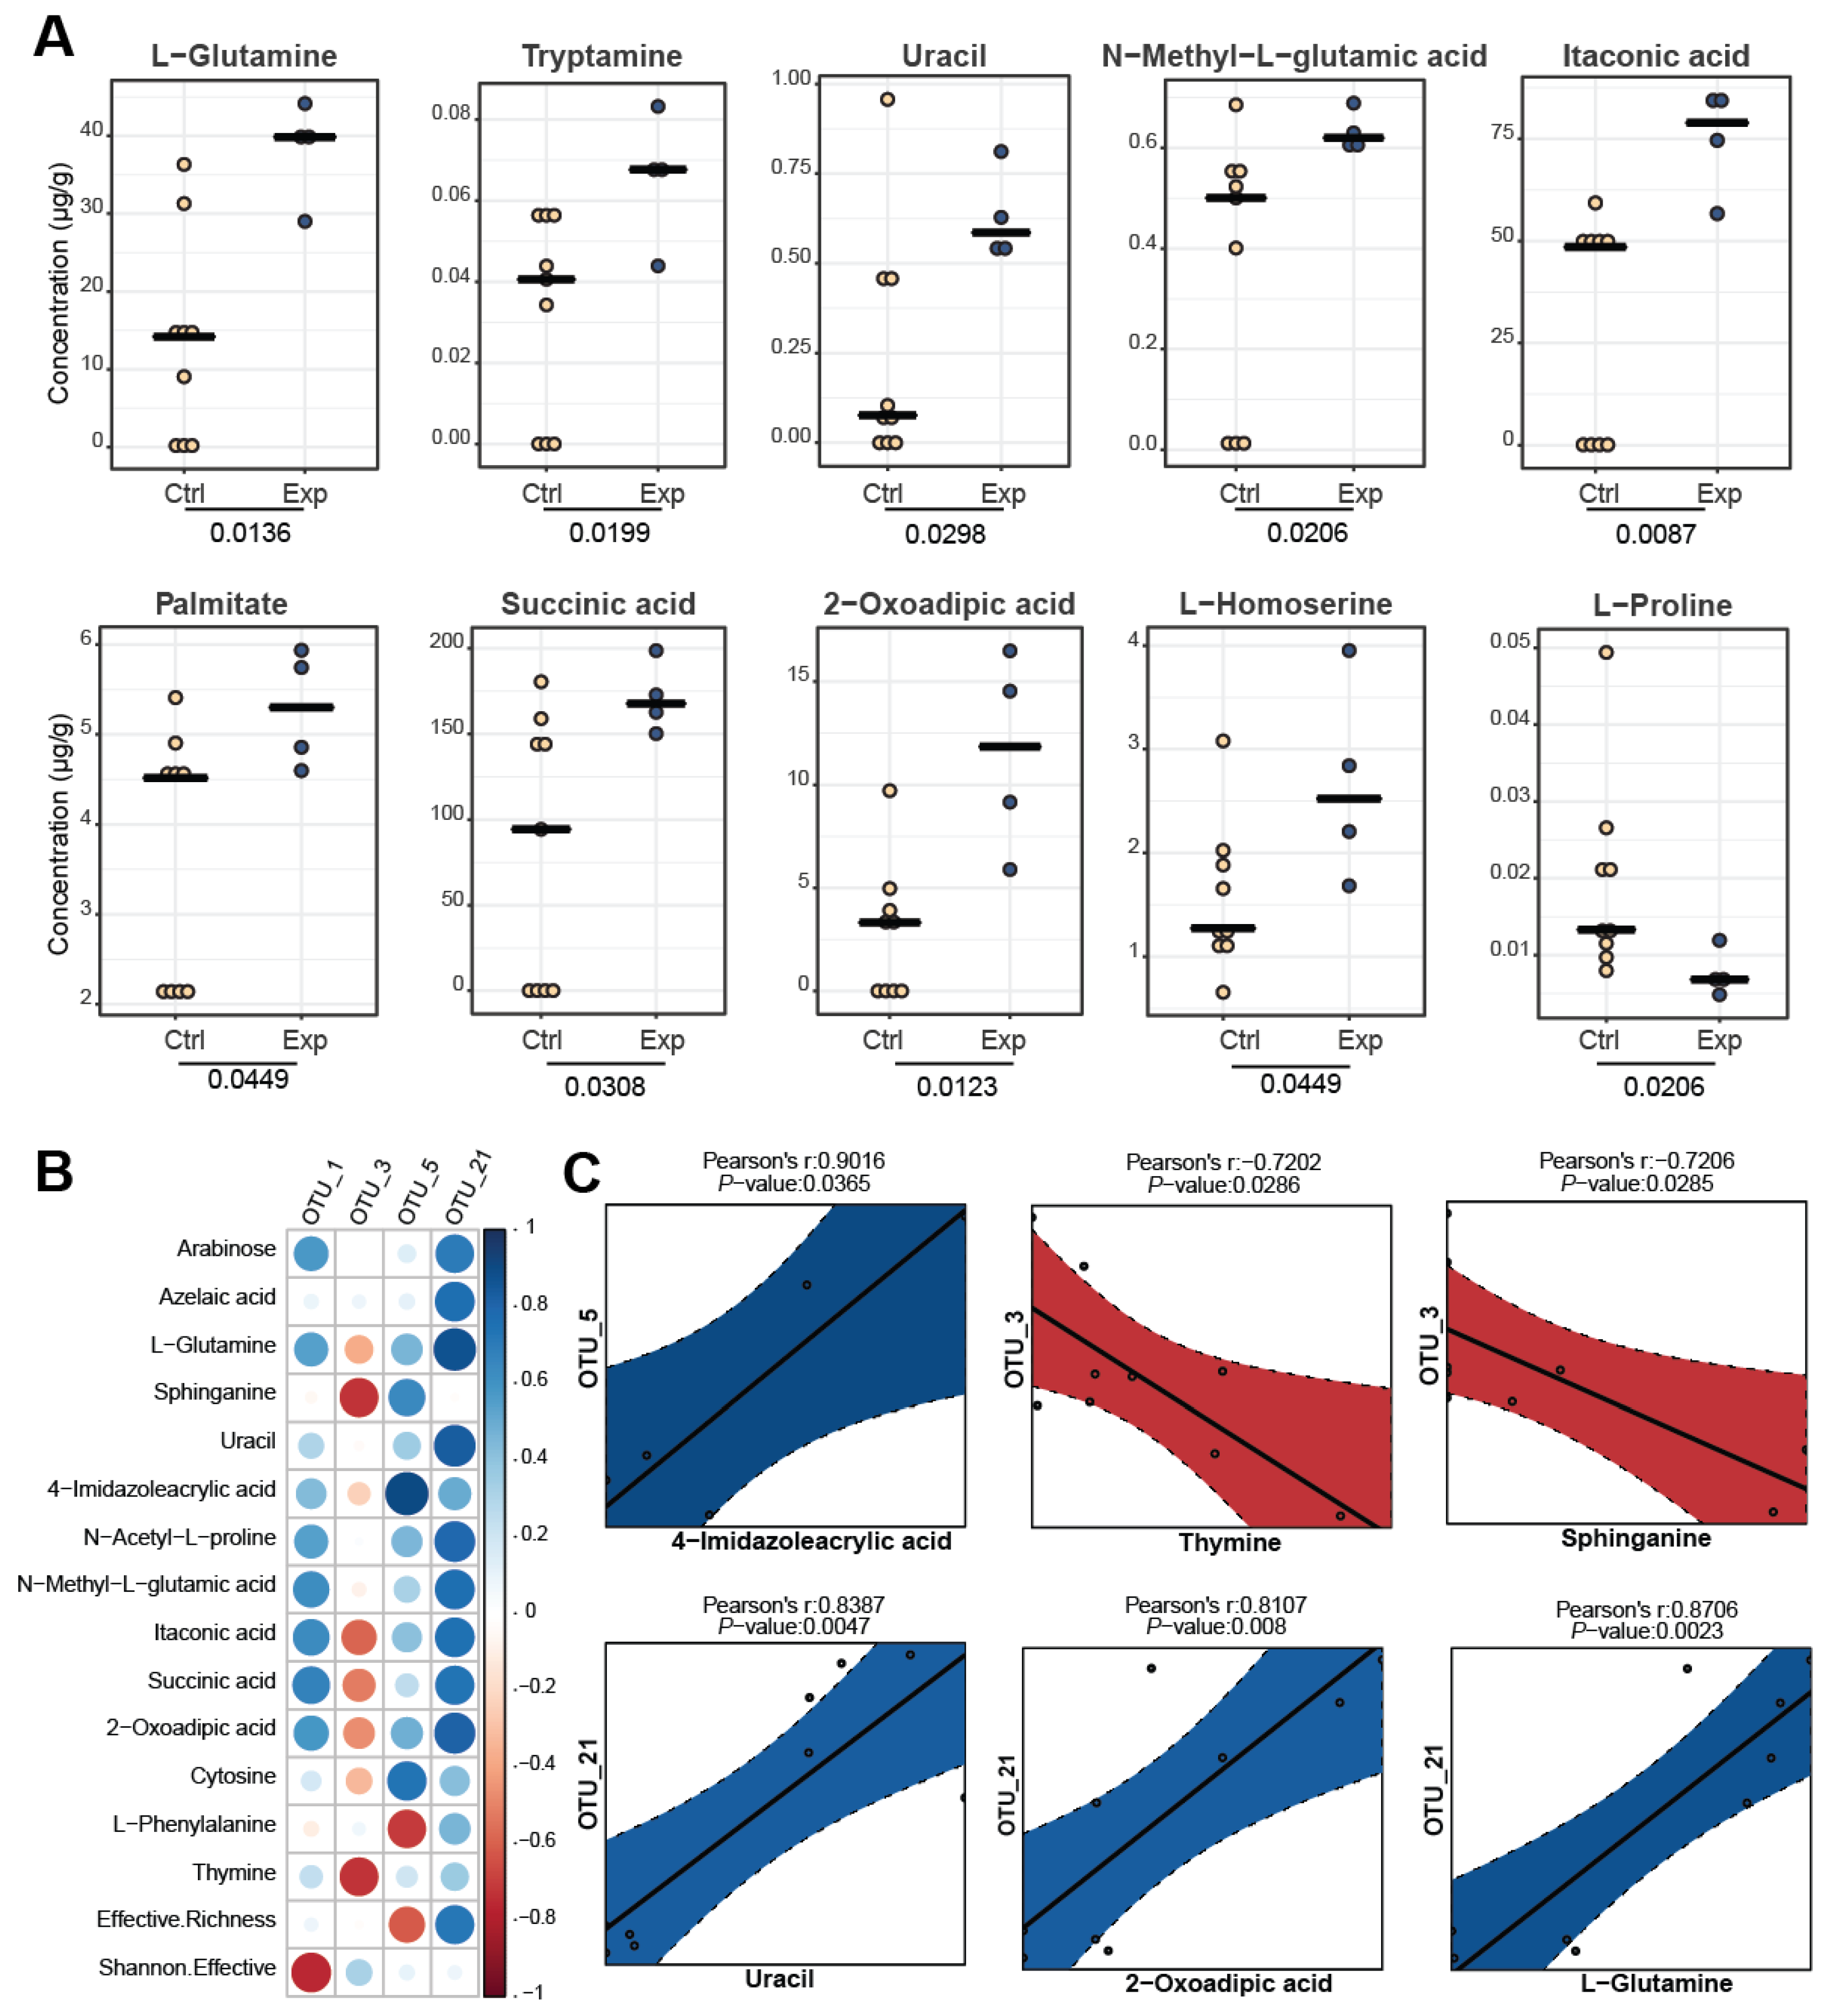
3.4. Comparison of Metabolite Profiles between the Different Groups
3.5. Correlating Metabolomic and Metagenomic Profiles
4. Conclusions
Supplementary Materials
Author Contributions
Funding
Informed Consent Statement
Data Availability Statement
Conflicts of Interest
References
- Skoufos, I.; Tzora, A.; Giannenas, I.; Karamoutsios, A.; Tsangaris, G.; Fthenakis, G.C. Milk quality characteristics of Boutsiko, Frisarta and Karagouniko sheep breeds reared in the mountainous and semimountainous areas of Western and Central Greece. Int. J. Dairy Technol. 2017, 70, 345–353. [Google Scholar] [CrossRef]
- Magan, J.B.; O′ Callaghan, T.F.; Kelly, A.L.; McCarthy, N.A. Compositional and functional properties of milk and dairy products derived from cows fed pasture or concentrate-based diets. Compr. Rev. Food Sci. Food Saf. 2021, 20, 2769–2800. [Google Scholar] [CrossRef] [PubMed]
- Rocchetti, G.; O’ Callaghan, T.F. Application of metabolomics to assess milk quality and traceability. Curr. Opin. Food Sci. 2021, 40, 168–178. [Google Scholar] [CrossRef]
- Wendorff, W.L.; Haenlein, G.F.W. Sheep Milk-Composition and Nutrition. In Handbook of Milk of Non-Bovine Mammals; John Wiley and Sons, Ltd.: Chichester, UK, 2017; pp. 210–221. [Google Scholar]
- Mohapatra, A.; Shinde, A.K.; Singh, R. Sheep milk: A pertinent functional food. Small Rumin. Res. 2019, 181, 6–11. [Google Scholar] [CrossRef]
- Rettedal, E.A.; Altermann, E.; Roy, N.C.; Dalziel, J.E. The Effects of Unfermented and Fermented Cow and Sheep Milk on the Gut Microbiota. Front. Microbiol. 2019, 10, 458. [Google Scholar] [CrossRef] [PubMed] [Green Version]
- Xu, W.; Kenez, A.; Mann, S.; Overton, T.R.; Wakshlag, J.J.; Nydam, D.V.; Feng, T.; Yepes, F.L. Effects of dietary branched-chain amino acid supplementation on serum and milk metabolome profiles in dairy cows during early lactation. J. Dairy Sci. 2022. [Google Scholar] [CrossRef] [PubMed]
- Renes, E.; Fernandez, D.; Abarquero, D.; Ladero, V.; Alvarez, M.A.; Tornadijo, M.E.; Fresno, J.M. Effect of forage type, season, and ripening time on selected quality properties of sheep milk cheese. J. Dairy Sci. 2021, 104, 2539–2552. [Google Scholar] [CrossRef]
- Aguiar, S.C.; Cottica, S.M.; Boeing, J.S.; Samensari, R.B.; Santos, G.T.; Visentainer, J.V.; Zeoula, L.M. Effect of feeding phenolic compounds from propolis extracts to dairy cows on milk production, milk fatty acid composition, and the antioxidant capacity of milk. Anim. Feed Sci. Technol. 2014, 193, 148–154. [Google Scholar] [CrossRef]
- O’ Callaghan, T.F.; Mannion, D.T.; Hennessy, D.; McAuliffe, S.; O’ Sullivan, M.G.; Leeuwendaal, N.; Beresford, T.P.; Dillon, P.; Kilcawley, K.N.; Sheehan, J.J.; et al. Effect of pasture versus indoor feeding systems on quality characteristics, nutritional composition, and sensory and volatile properties of full-fat Cheddar cheese. J. Dairy Sci. 2017, 100, 6053–6073. [Google Scholar] [CrossRef]
- Hanus, O.; Samkova, E.; Krizova, L.; Hasonova, L.; Kala, R. Role of Fatty Acids in Milk Fat and the Influence of Selected Factors on Their Variability-A Review. Molecules 2018, 23, 1636. [Google Scholar] [CrossRef]
- Litopoulou-Tzanetaki, E.; Tzanetakis, N. Microbiological characteristics of Greek traditional cheeses. Small Rumin. Res. 2011, 101, 17–32. [Google Scholar] [CrossRef]
- Tzora, A.; Nelli, A.; Voidarou, C.; Fthenakis, G.; Rozos, G.; Theodorides, G.; Bonos, E.; Skoufos, I. Microbiota “Fingerprint” of Greek Feta Cheese through Ripening. Appl. Sci. 2021, 11, 5631. [Google Scholar] [CrossRef]
- Afshari, R.; Pillidge, C.J.; Dias, D.A.; Osborn, A.M.; Gill, H. Cheesomics: The future pathway to understanding cheese flavour and quality. Crit Rev. Food Sci. Nutr. 2020, 60, 33–47. [Google Scholar] [CrossRef]
- Cocolin, L.; Ercolini, D. Zooming into food-associated microbial consortia: A ‘cultural’ evolution. Curr. Opin. Food Sci. 2015, 2, 43–50. [Google Scholar] [CrossRef]
- van Hijum, S.A.; Vaughan, E.E.; Vogel, R.F. Application of state-of-art sequencing technologies to indigenous food fermentations. Curr. Opin. Biotechnol. 2013, 24, 178–186. [Google Scholar] [CrossRef] [PubMed]
- Le Boucher, C.; Courant, F.; Royer, A.-L.; Jeanson, S.; Lortal, S.; Dervilly-Pinel, G.; Thierry, A.; Le Bizec, B. LC–HRMS fingerprinting as an efficient approach to highlight fine differences in cheese metabolome during ripening. Metabolomics 2015, 11, 1117–1130. [Google Scholar] [CrossRef]
- Pan, S.; Zhang, K.; Ding, X.; Wang, J.; Peng, H.; Zeng, Q.; Xuan, Y.; Su, Z.; Wu, B.; Bai, S. Effect of High Dietary Manganese on the Immune Responses of Broilers Following Oral Salmonella typhimurium Inoculation. Biol. Trace Element Res. 2018, 181, 347–360. [Google Scholar] [CrossRef]
- Rocchetti, G.; Lucini, L.; Gallo, A.; Masoero, F.; Trevisan, M.; Giuberti, G. Untargeted metabolomics reveals differences in chemical fingerprints between PDO and non-PDO Grana Padano cheeses. Food Res. Int. 2018, 113, 407–413. [Google Scholar] [CrossRef]
- Manis, C.; Scano, P.; Nudda, A.; Carta, S.; Pulina, G.; Caboni, P. LC-QTOF/MS Untargeted Metabolomics of Sheep Milk under Cocoa Husks Enriched Diet. Dairy 2021, 2, 112–121. [Google Scholar] [CrossRef]
- Amaral, J.S. Target and Non-Target Approaches for Food Authenticity and Traceability. Foods 2021, 10, 172. [Google Scholar] [CrossRef]
- Tzora, A.; Nelli, A.; Voidarou, C.C.; Fotou, K.; Bonos, E.; Rozos, G.; Grigoriadou, K.; Papadopoulos, P.; Basdagianni, Z.; Giannenas, I.; et al. Impact of an Omega-3-Enriched Sheep Diet on the Microbiota and Chemical Composition of Kefalograviera Cheese. Foods 2022, 11, 843. [Google Scholar] [CrossRef] [PubMed]
- de Paula, A.C.L.; Medeiros, J.D.; Fernandes, G.R.; da Silva, V.L.; Diniz, C.G. Microbiome of industrialized Minas Frescal Cheese reveals high prevalence of putative bacteria: A concern in the One Health context. LWT 2021, 139, 110791. [Google Scholar] [CrossRef]
- Lagkouvardos, I.; Joseph, D.; Kapfhammer, M.; Giritli, S.; Horn, M.; Haller, D.; Clavel, T. IMNGS: A comprehensive open resource of processed 16S rRNA microbial profiles for ecology and diversity studies. Sci. Rep. 2016, 6, 33721. [Google Scholar] [CrossRef] [Green Version]
- Lagkouvardos, I.; Fischer, S.; Kumar, N.; Clavel, T. Rhea: A transparent and modular R pipeline for microbial profiling based on 16S rRNA gene amplicons. PeerJ 2017, 5, e2836. [Google Scholar] [CrossRef] [PubMed] [Green Version]
- Dasenaki, M.E.; Thomaidis, N.S. Multi-residue determination of 115 veterinary drugs and pharmaceutical residues in milk powder, butter, fish tissue and eggs using liquid chromatography-tandem mass spectrometry. Anal. Chim. Acta 2015, 880, 103–121. [Google Scholar] [CrossRef]
- Kalogiouri, N.P.; Alygizakis, N.A.; Aalizadeh, R.; Thomaidis, N.S. Olive oil authenticity studies by target and nontarget LC-QTOF-MS combined with advanced chemometric techniques. Anal. Bioanal. Chem. 2016, 408, 7955–7970. [Google Scholar] [CrossRef] [PubMed]
- Thevenot, E.A.; Roux, A.; Xu, Y.; Ezan, E.; Junot, C. Analysis of the Human Adult Urinary Metabolome Variations with Age, Body Mass Index, and Gender by Implementing a Comprehensive Workflow for Univariate and OPLS Statistical Analyses. J. Proteome Res. 2015, 14, 3322–3335. [Google Scholar] [CrossRef]
- Pearson, K. Determination of the Coefficient of Correlation. Science 1909, 30, 23–25. [Google Scholar] [CrossRef]
- Aitchison, J. The Statistical Analysis of Compositional Data; Chapman and Hall: London, UK, 1986. [Google Scholar]
- Benjamini, Y.; Hochberg, Y. Controlling the False Discovery Rate: A Practical and Powerful Approach to Multiple Testing. J. R. Stat. Soc. Ser. B 1995, 57, 289–300. [Google Scholar] [CrossRef]
- Tsigkrimani, M.; Bakogianni, M.; Paramithiotis, S.; Bosnea, L.; Pappa, E.; Drosinos, E.H.; Skandamis, P.N.; Mataragas, M. Microbial Ecology of Artisanal Feta and Kefalograviera Cheeses, Part I: Bacterial Community and Its Functional Characteristics with Focus on Lactic Acid Bacteria as Determined by Culture-Dependent Methods and Phenotype Microarrays. Microorganisms 2022, 10, 161. [Google Scholar] [CrossRef]
- Irmler, S.; Bavan, T.; Oberli, A.; Roetschi, A.; Badertscher, R.; Guggenbuhl, B.; Berthoud, H. Catabolism of serine by Pediococcus acidilactici and Pediococcus pentosaceus. Appl. Environ. Microbiol. 2013, 79, 1309–1315. [Google Scholar] [CrossRef] [PubMed] [Green Version]
- Shin, S.-Y.; Han, N.S. Leuconostoc spp. as Starters and Their Beneficial Roles in Fermented Foods. In Beneficial Microorganisms in Food and Nutraceuticals; Microbiology Monographs; Springer International Publishing: Cham, Switzerland, 2015; pp. 111–132. [Google Scholar]
- Reitmeier, S.; Hitch, T.C.A.; Treichel, N.; Fikas, N.; Hausmann, B.; Ramer-Tait, A.E.; Neuhaus, K.; Berry, D.; Haller, D.; Lagkouvardos, I.; et al. Handling of spurious sequences affects the outcome of high-throughput 16S rRNA gene amplicon profiling. ISME Commun. 2021, 1, 31. [Google Scholar] [CrossRef]
- Schymanski, E.L.; Jeon, J.; Gulde, R.; Fenner, K.; Ruff, M.; Singer, H.P.; Hollender, J. Identifying small molecules via high resolution mass spectrometry: Communicating confidence. Environ. Sci. Technol. 2014, 48, 2097–2098. [Google Scholar] [CrossRef]
- Kritikou, A.S.; Aalizadeh, R.; Damalas, D.E.; Barla, I.V.; Baessmann, C.; Thomaidis, N.S. MALDI-TOF-MS integrated workflow for food authenticity investigations: An untargeted protein-based approach for rapid detection of PDO feta cheese adulteration. Food Chem. 2022, 370, 131057. [Google Scholar] [CrossRef] [PubMed]
- Xia, Y.; Yu, J.; Miao, W.; Shuang, Q. A UPLC-Q-TOF-MS-based metabolomics approach for the evaluation of fermented mare’s milk to koumiss. Food Chem. 2020, 320, 126619. [Google Scholar] [CrossRef] [PubMed]


Publisher’s Note: MDPI stays neutral with regard to jurisdictional claims in published maps and institutional affiliations. |
© 2022 by the authors. Licensee MDPI, Basel, Switzerland. This article is an open access article distributed under the terms and conditions of the Creative Commons Attribution (CC BY) license (https://creativecommons.org/licenses/by/4.0/).
Share and Cite
Tzora, A.; Nelli, A.; Kritikou, A.S.; Katsarou, D.; Giannenas, I.; Lagkouvardos, I.; Thomaidis, N.S.; Skoufos, I. The “Crosstalk” between Microbiota and Metabolomic Profile of Kefalograviera Cheese after the Innovative Feeding Strategy of Dairy Sheep by Omega-3 Fatty Acids. Foods 2022, 11, 3164. https://doi.org/10.3390/foods11203164
Tzora A, Nelli A, Kritikou AS, Katsarou D, Giannenas I, Lagkouvardos I, Thomaidis NS, Skoufos I. The “Crosstalk” between Microbiota and Metabolomic Profile of Kefalograviera Cheese after the Innovative Feeding Strategy of Dairy Sheep by Omega-3 Fatty Acids. Foods. 2022; 11(20):3164. https://doi.org/10.3390/foods11203164
Chicago/Turabian StyleTzora, Athina, Aikaterini Nelli, Anastasia S. Kritikou, Danai Katsarou, Ilias Giannenas, Ilias Lagkouvardos, Nikolaos S. Thomaidis, and Ioannis Skoufos. 2022. "The “Crosstalk” between Microbiota and Metabolomic Profile of Kefalograviera Cheese after the Innovative Feeding Strategy of Dairy Sheep by Omega-3 Fatty Acids" Foods 11, no. 20: 3164. https://doi.org/10.3390/foods11203164