
Influence of Vertically Treaded Outsoles on Interfacial Fluid Pressure, Mass Flow Rate, and Shoe–Floor Traction during Slips

1
Centre for Biomedical Engineering, Indian Institute of Technology (IIT), Delhi 110016, India
2
Department of Biomedical Engineering, All India Institute of Medical Science (AIIMS), Delhi 110029, India
*
Author to whom correspondence should be addressed.
Fluids 2023, 8(3), 82; https://doi.org/10.3390/fluids8030082
Submission received: 25 November 2022
/
Revised: 20 February 2023
/
Accepted: 21 February 2023
/
Published: 27 February 2023
Abstract
:Accidental injuries due to slips and falls are considered serious threats to public safety. Sufficient friction at the footwear and flooring interface is essential to reduce slip-related risks. The presence of slippery fluidic contaminants, such as water, further reduces friction and increases the risks of slip-related accidents drastically. While the effect of floorings and contaminants on footwear traction has been measured extensively across a variety of footwear designs, only a few studies have explored the science of the outsole design and its role in providing sufficient traction. In this work, the tread design of a commonly encountered outsole pattern, i.e., with vertically oriented tread channels, was parametrically altered across its width and gap. Based on the impressions of an original footwear design, nine outsoles were fabricated. The induced fluid pressures, mass flow rates, and traction were quantified by using a computational fluid dynamics (CFD) framework and through slip testing experiments. Outsoles that had wide treads with small gaps decreased the overall slipping risk on dry floorings. As compared to the tread area, tread gaps were found to be a dominating parameter in providing adequate shoe–floor traction in wet slipping conditions. The methods, including the outcomes presented in this work, are anticipated to advance the understanding of the science behind footwear friction and help footwear manufacturers optimize outsole designs to reduce slip and fall risks.
1. Introduction
Slips and falls are among the predominant causes of occupational, sports, recreational, and industrial accidents [1]. Slips, trips, and falls alone have accounted for over 30% of all non-fatal workplace accidents in the United States [2] and were reported to lead to an annual economic strain of more than $170 billion [3]. These accidents are also responsible for over $10 billion in direct worker’s compensation, including large- and small-scale industries and workplaces [4]. Slip-related injuries such as dislocations, tears, and other lower limb issues have led workers to withdraw from medical leave, which causes more than 25 days of delay in work [5]. Unintentional slips are usually initiated by a sudden decrease in the available coefficient of friction (ACOF) at the shoe–floor interface [6]. Hence, to ensure sufficient shoe–floor friction, it becomes essential for footwear manufacturers and the public to be aware of the frictional performance of footwear and other related parameters.
Friction is affected by its tread pattern, type of flooring, contact area, outsole materials, shore hardness, the presence of contaminants (i.e., water), and wear of the outsoles [7,8,9,10,11,12,13]. Specifically, the presence of liquid contaminants over flooring drastically reduces the shoe and floor interface friction, which results in increased slipping hazards [14]. Slipping risks can be measured by employing devices such as tribometers or slip testers, which vary widely based on their designs and operating parameters [15]. An ACOF of 0.3 was considered by Chanda et al. [16] as a threshold value above which slip risks decrease significantly. It was observed that 95% of the commonly available shoes were incapable of providing an adequate friction value when tested on fluid-contaminated floorings. Hence, it is important to understand the role of commonly available footwear and its characteristics in providing sufficient friction on dry and fluid-contaminated floorings.
Topographical features (i.e., treads) of the footwear’s outsole play an important role in its performance in dry and wet slipping conditions [17]. In a recent study by Gupta et al. [18], outsole features such as tread design, area, and orientation have been observed to affect the ACOF drastically. In another study by Yamaguchi et al. [19], the effect of the tread characteristics on the ACOF was investigated through the study of the dispersion of excessive fluid through the tread channels during fluid-contaminated sliding. Furthermore, high fluid pressure and the formation of a hydrodynamic fluid film at the shoe–floor interface have been observed to be correlated with increased slipping risks in the previous studies [20,21,22,23]. Several studies have reported that increasing fluid pressures over the un-treaded or worn region resulted in decreased traction. In another study by Li et al. [24], the effect of varying tread parameters on the ACOF was studied in several slipping conditions, and significant differences were reported in the ACOF outcomes. Quantifying fluid pressure and the capability of an outsole to disperse the excess fluid require additional attachments to the slip testers and are dependent on the flow losses and sensitivity of the sensor, which can hamper the results. Also, slip-testing experiments considering several shoes, floorings, and contaminants can become a time-consuming and tedious task. Hence, research related to the fluid flow and pressures over footwear outsoles and the understanding of the influence of the outsole tread’s geometry on the induced friction is lacking in the literature.
In this work, a commonly used tread design with a vertical orientation (i.e., the treads parallel to the slipping motion axis) was extensively studied. The treads were parametrically modified and assessed for their traction performance on dry and water-contaminated floorings. During the slipping, the fluid pressure and flow rates were quantified by employing a computational fluid dynamics (CFD) framework. The study outcomes were correlated with the slip-testing experiments by analyzing a range of correlations between the tread parameters and friction. It is anticipated that the results of this pioneering work will clarify the influence of the outsole tread characteristics on footwear traction and enhance the knowledge of the science behind the footwear’s outsoles.
2. Materials and Methods
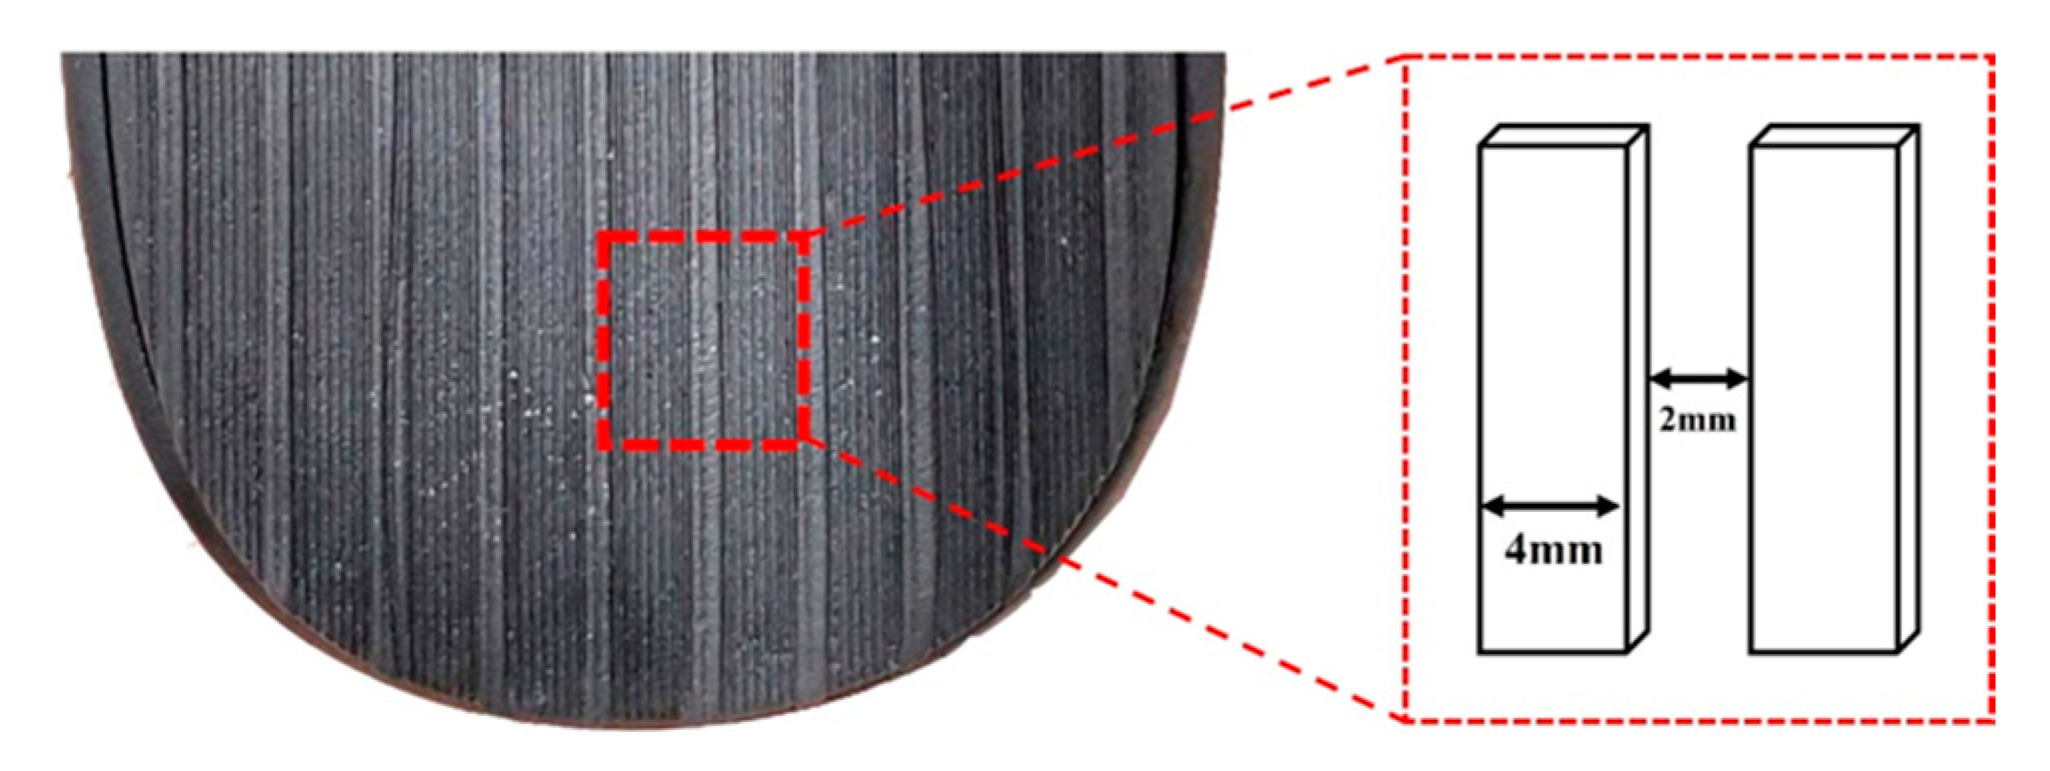
The footwear outsole design included in this work had vertically oriented treads (i.e., parallel to the slipping motion) based on the geometry of the original footwear. Outsole features such as shore hardness and tread dimensions were measured using a durometer (Precision Instruments, India) and a digital depth gauge (Precision Instruments, India). These variables were measured over the footwear’s heel region, measuring up to 50 mm from the posterior point of the heel. The shore hardness, tread geometry, and the 50 mm metric has previously been reported to be adequate in quantifying a footwear’s performance in any slipping condition [8,9,11,16,18,25]. The outsole material was polyurethane with a shore A hardness of 60. Figure 1 shows the original footwear outsole design with a tread width of 4 mm and a tread gap of 2 mm. The outsole geometry was imported and traced in a 3D modeling software (SolidWorks, Dassault Systèmes, France) to perform the parametrical modifications across the tread widths and gaps. Tread width was varied with an interval of 2 mm, whereas tread gaps were varied by an interval of 1 mm. Table 1 represents the dimensions of all nine parametrically modified outsoles.
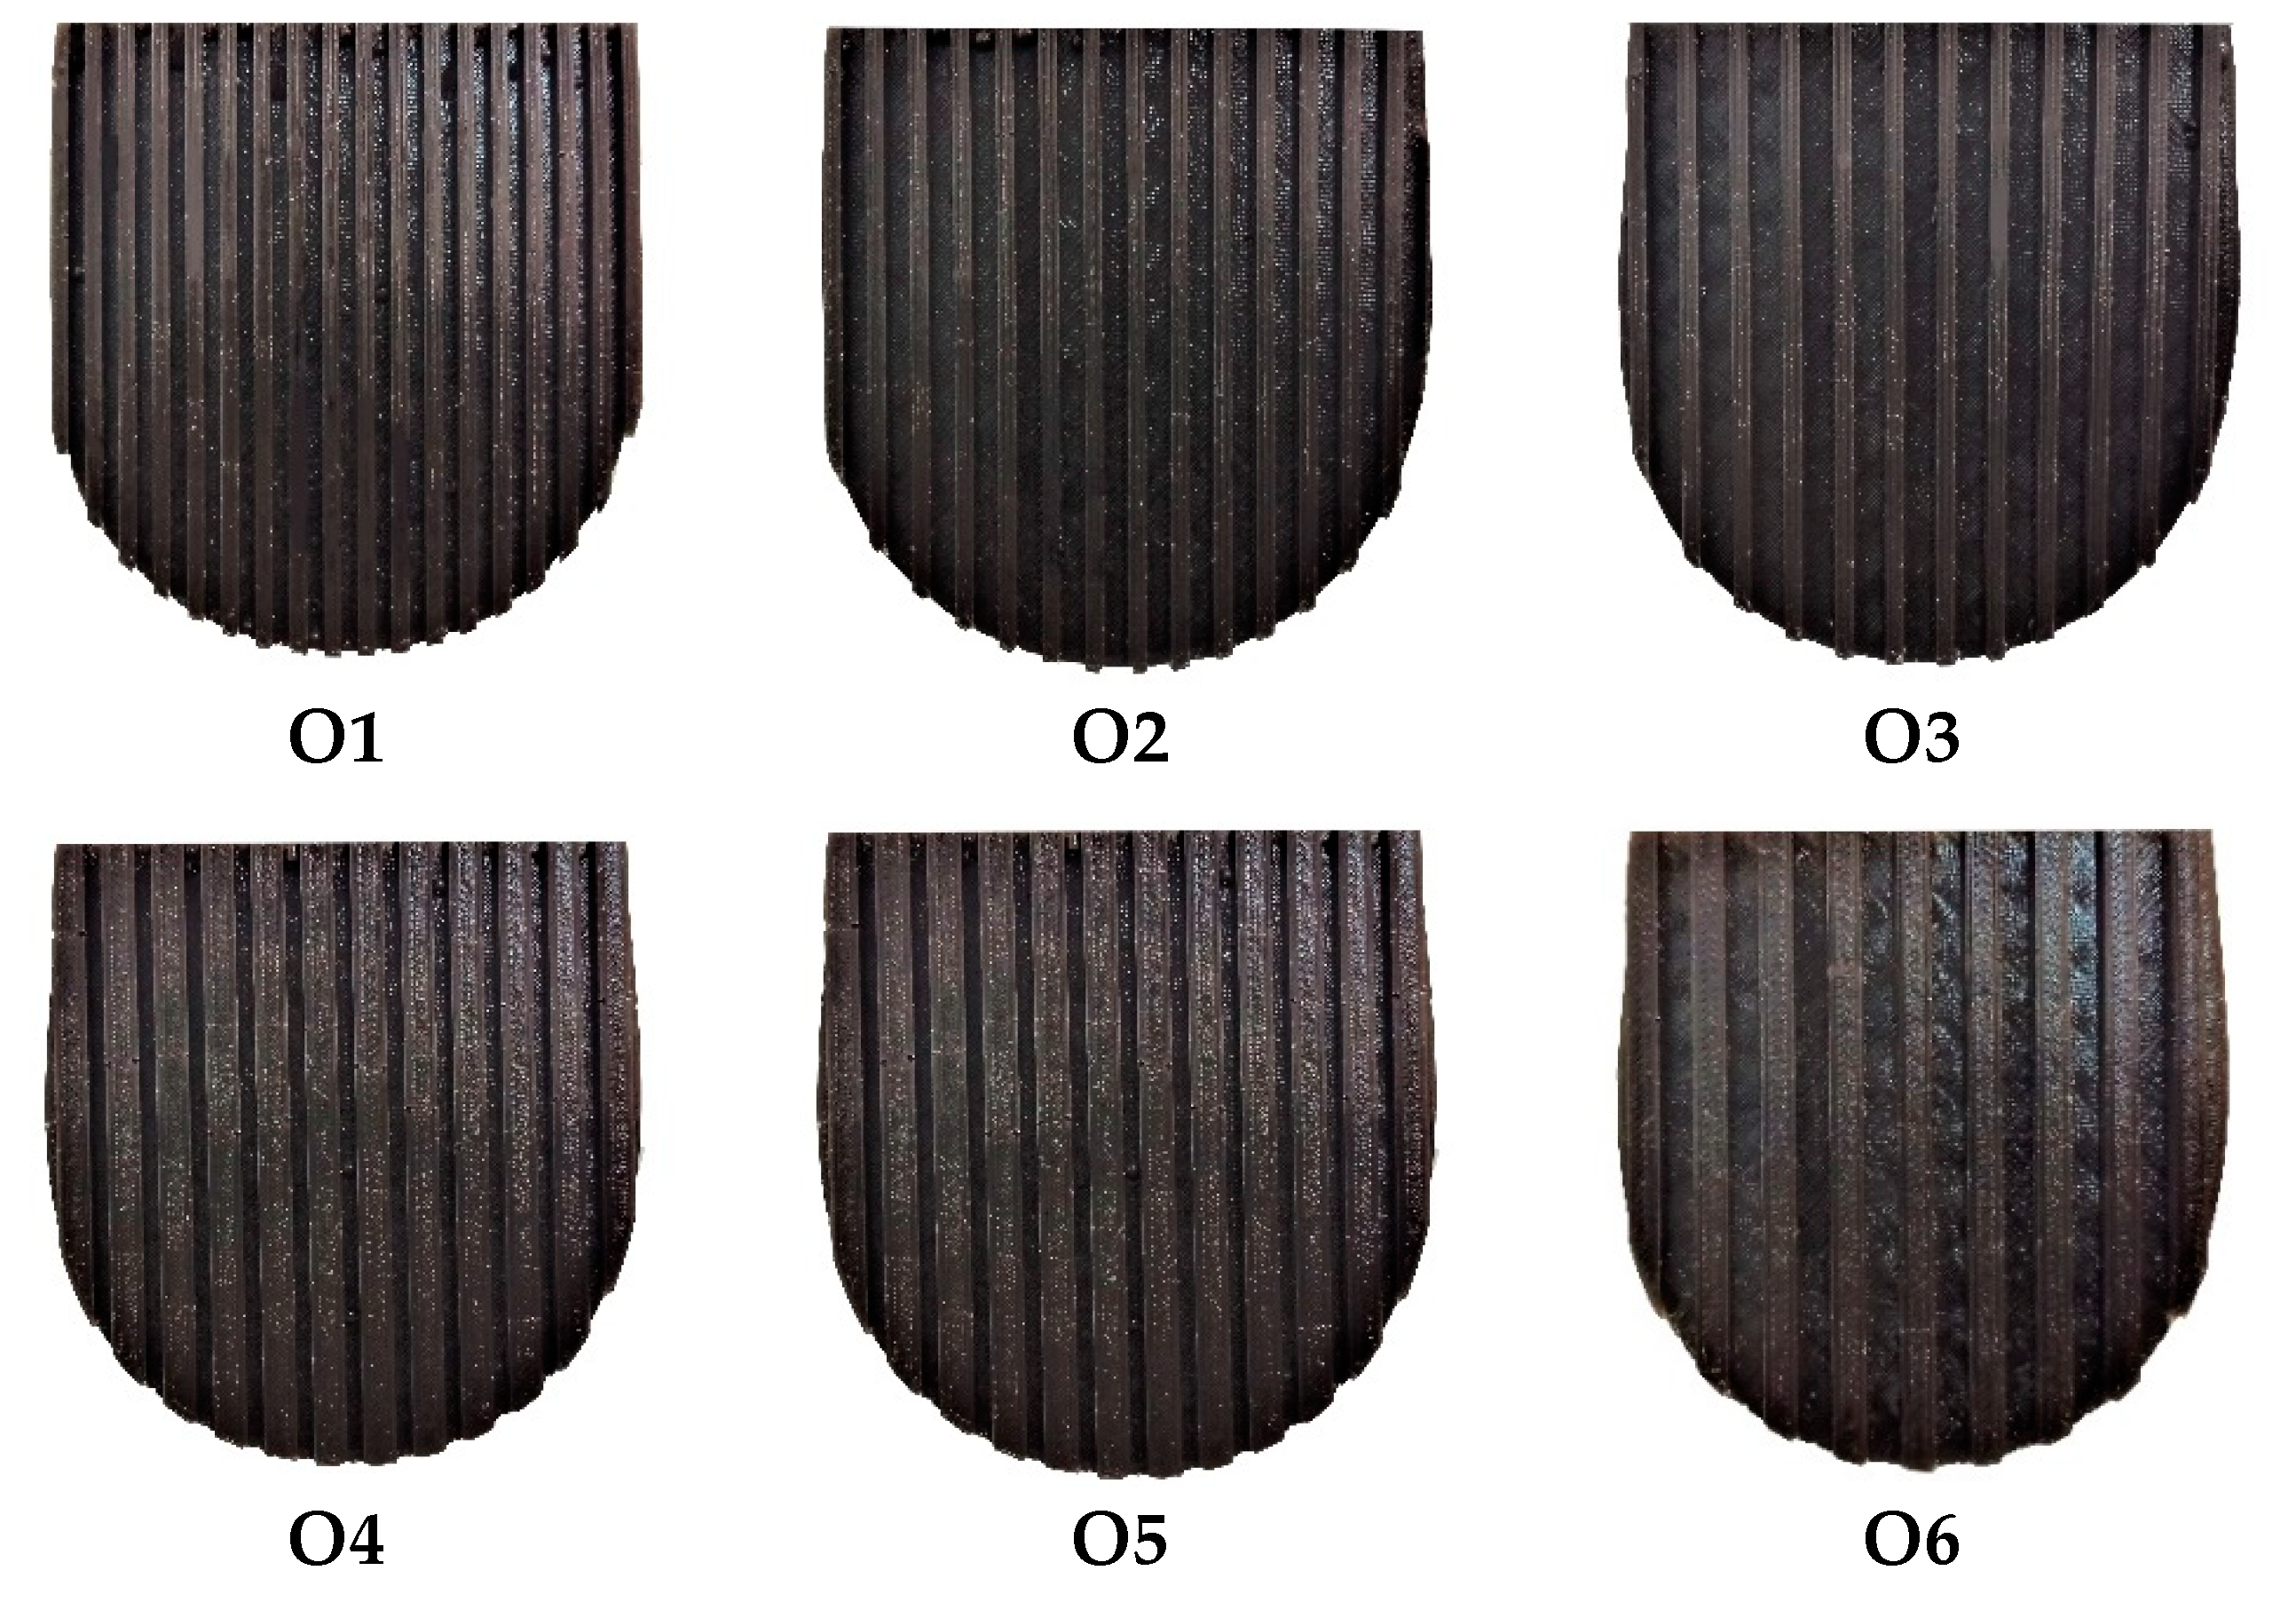
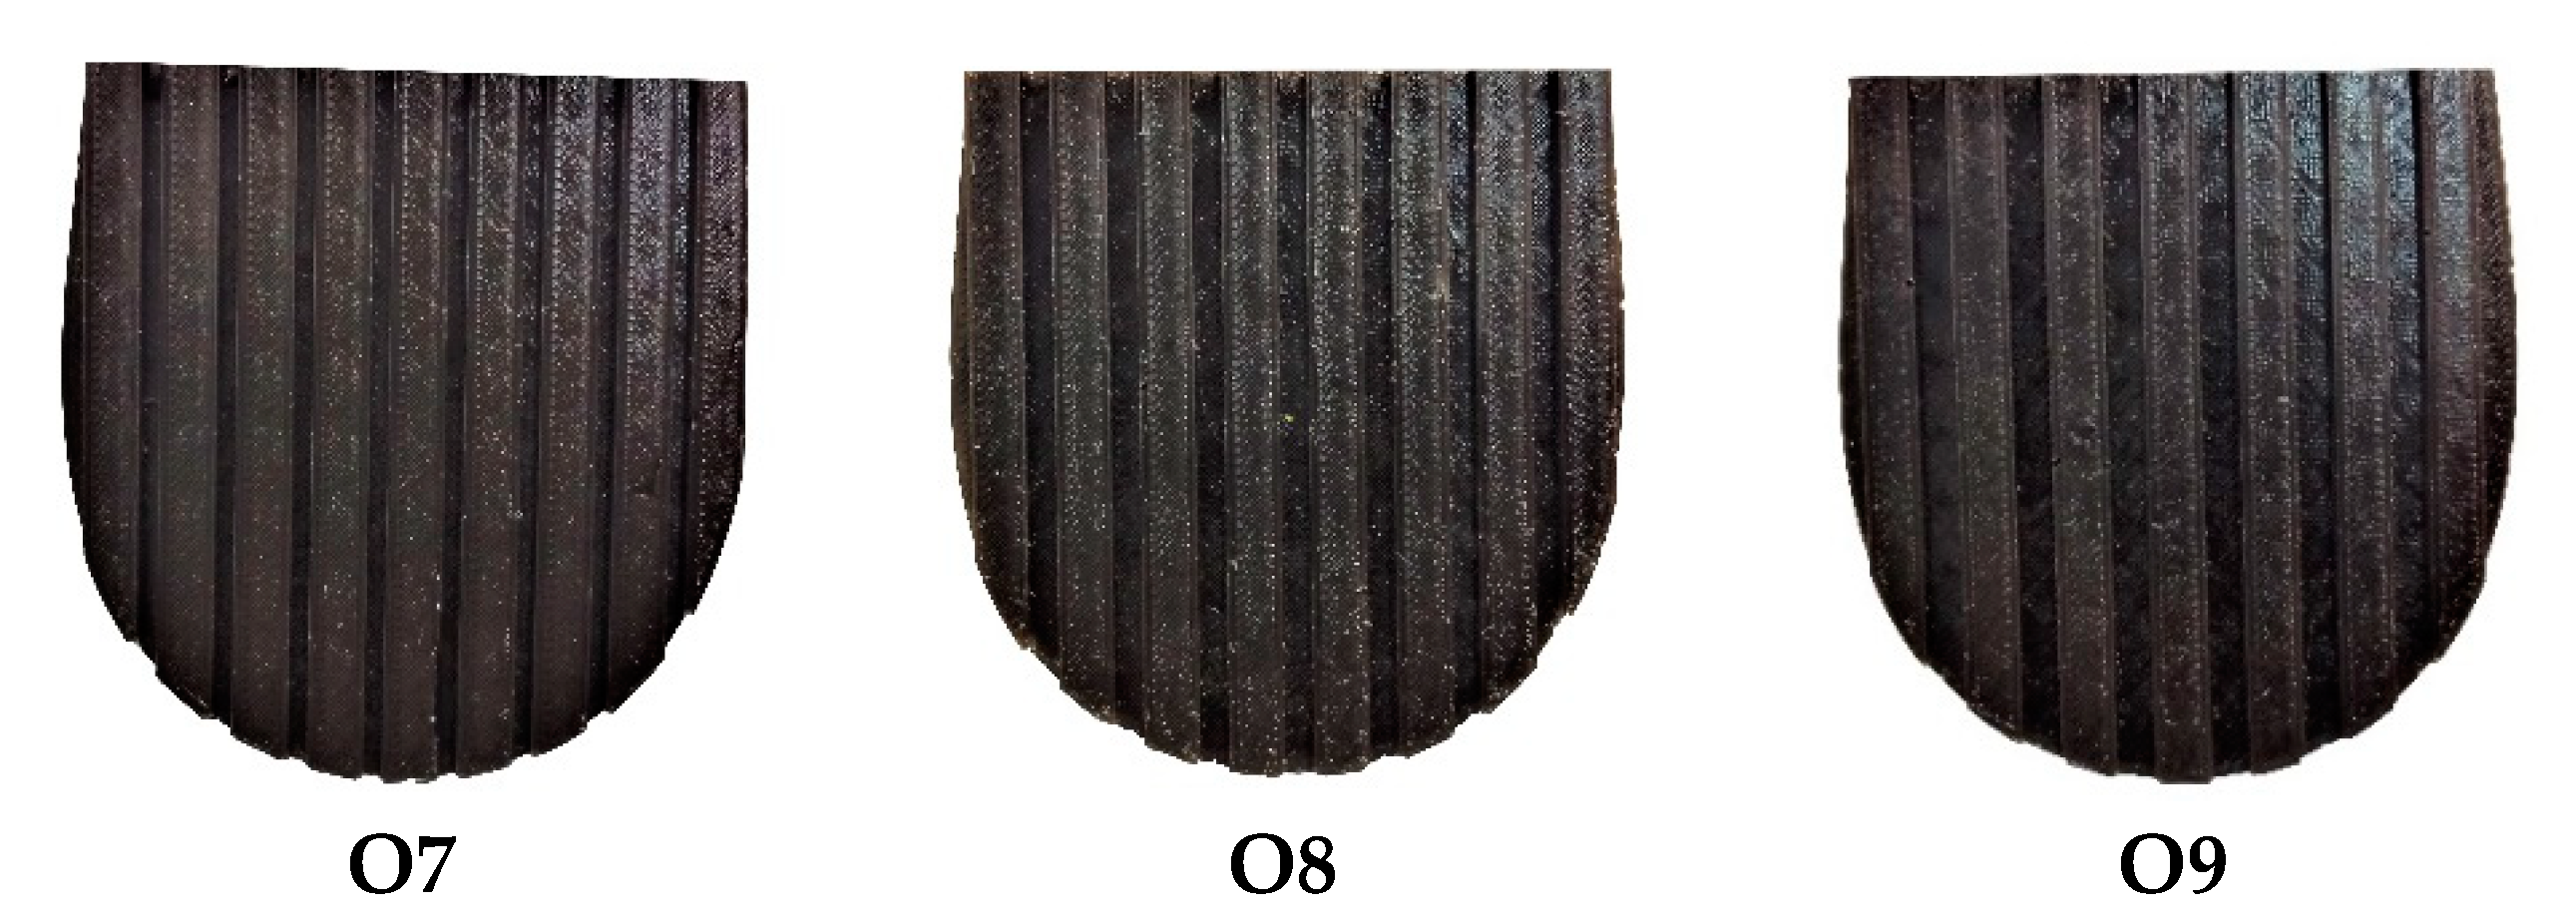
After the generation of CAD models of all the outsoles, their respective positive molds were 3D-printed using a Creality Ender 3D printer (Shenzhen Creality 3D Technology, China). The molds were then filled with liquid silicone polymer and left to cure for 7 h. After the curing process, the negative silicone molds were removed and poured with two-part polyurethane of shore A hardness 60 to mimic the original footwear material properties. The molds were left to cure for 36 h and again measured for their dimensional and shore hardness accuracy. Figure 2 shows the nine developed outsoles.
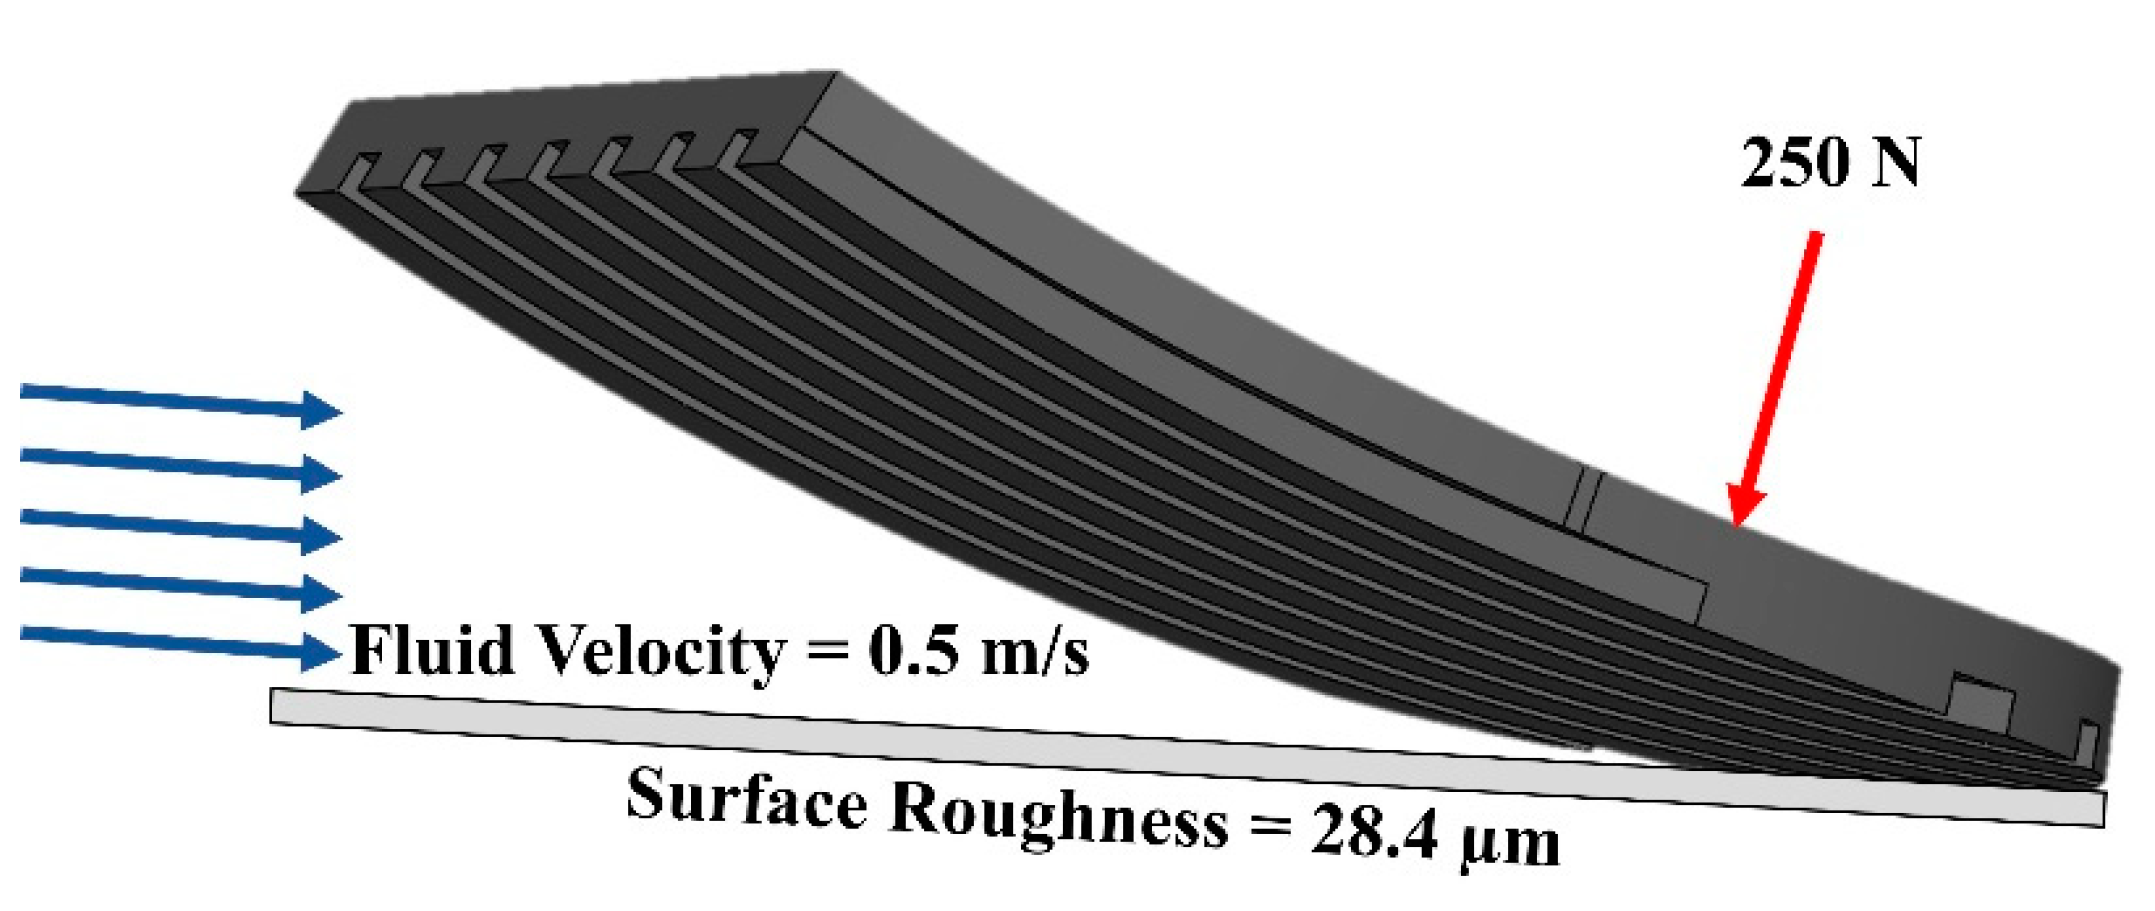
To assess the fluid pressure and flow rate over the modeled outsoles, a realistic slipping mechanism was simulated numerically (Fluent 20.0, Ansys Inc., Canonsburg, PA, USA). The simulations included the deformation of the outsole treads due to the application of a normal load, as well as fluid pressure and flow to simulate wet slip conditions. The simulation was performed in two parts. Primarily, the parametrically modified 3D models of the outsoles were bent by 17° and up to 50 mm measured from the posterior point of the heel. The considered angle and length metric has previously been reported to be adequate in determining the traction performance during unintentional slips [16,26]. Furthermore, the outsoles were applied with a normal load of 250 N, which has been reported to be the force applied by humans during unintentional slips [8,16,27,28]. The outsoles were modeled with a hyperelastic neo-Hookean material to mimic the original footwear’s material (i.e., polyurethane) [18,29]. A contact pair between the outsoles and the ground was generated to model the interface. For the ease in mesh convergence and precision of the models, the outsoles were meshed with 10-node SOLID 187 tetrahedral elements. The deformed outsole geometries were then analyzed for the fluid flow simulations using CFD. A detailed mesh convergence study was considered, which included five different meshes at regular intervals. The mesh that showed low variations in the results (i.e., within 5%) was selected as the optimal mesh. Hence, the outsole model, O1, was generated with 785,575 elements, O2 with 657,883 elements, O3 with 617,457 elements, O4 with 777,845 elements, O5 with 620,475 elements, O6 with 610,847 elements, O7 with 691,700 elements, O8 with 562,435 elements, and O9 with 607,064 elements. A steady-state incompressible turbulent flow regime was utilized to characterize the wet slipping motion. The Reynolds-averaged Navier–Stokes equation for the conservation of momentum (1) and Reynolds-averaged continuity equation for the conservation of mass (2) were pre-programmed for the simulations.
The boundaries of the flow domain were applied with a surface roughness of 28.4 µm, which mimics the realistic flooring conditions on which the slip-testing experiments were performed. A value of 1 × 10⁻³ was considered as the convergence criterion for the scaled residuals. The pressure–velocity modeling was based on the SIMPLE algorithm with second-order and second-order upwind for pressure and momentum, respectively. At last, a fluid velocity of 0.5 m/s was provided to simulate the actual slipping situation [8]. Figure 3 represents the consolidated computational framework, and Table 2 represents the summary of the CFD parameters based on a recent study by Gupta et al. [30].
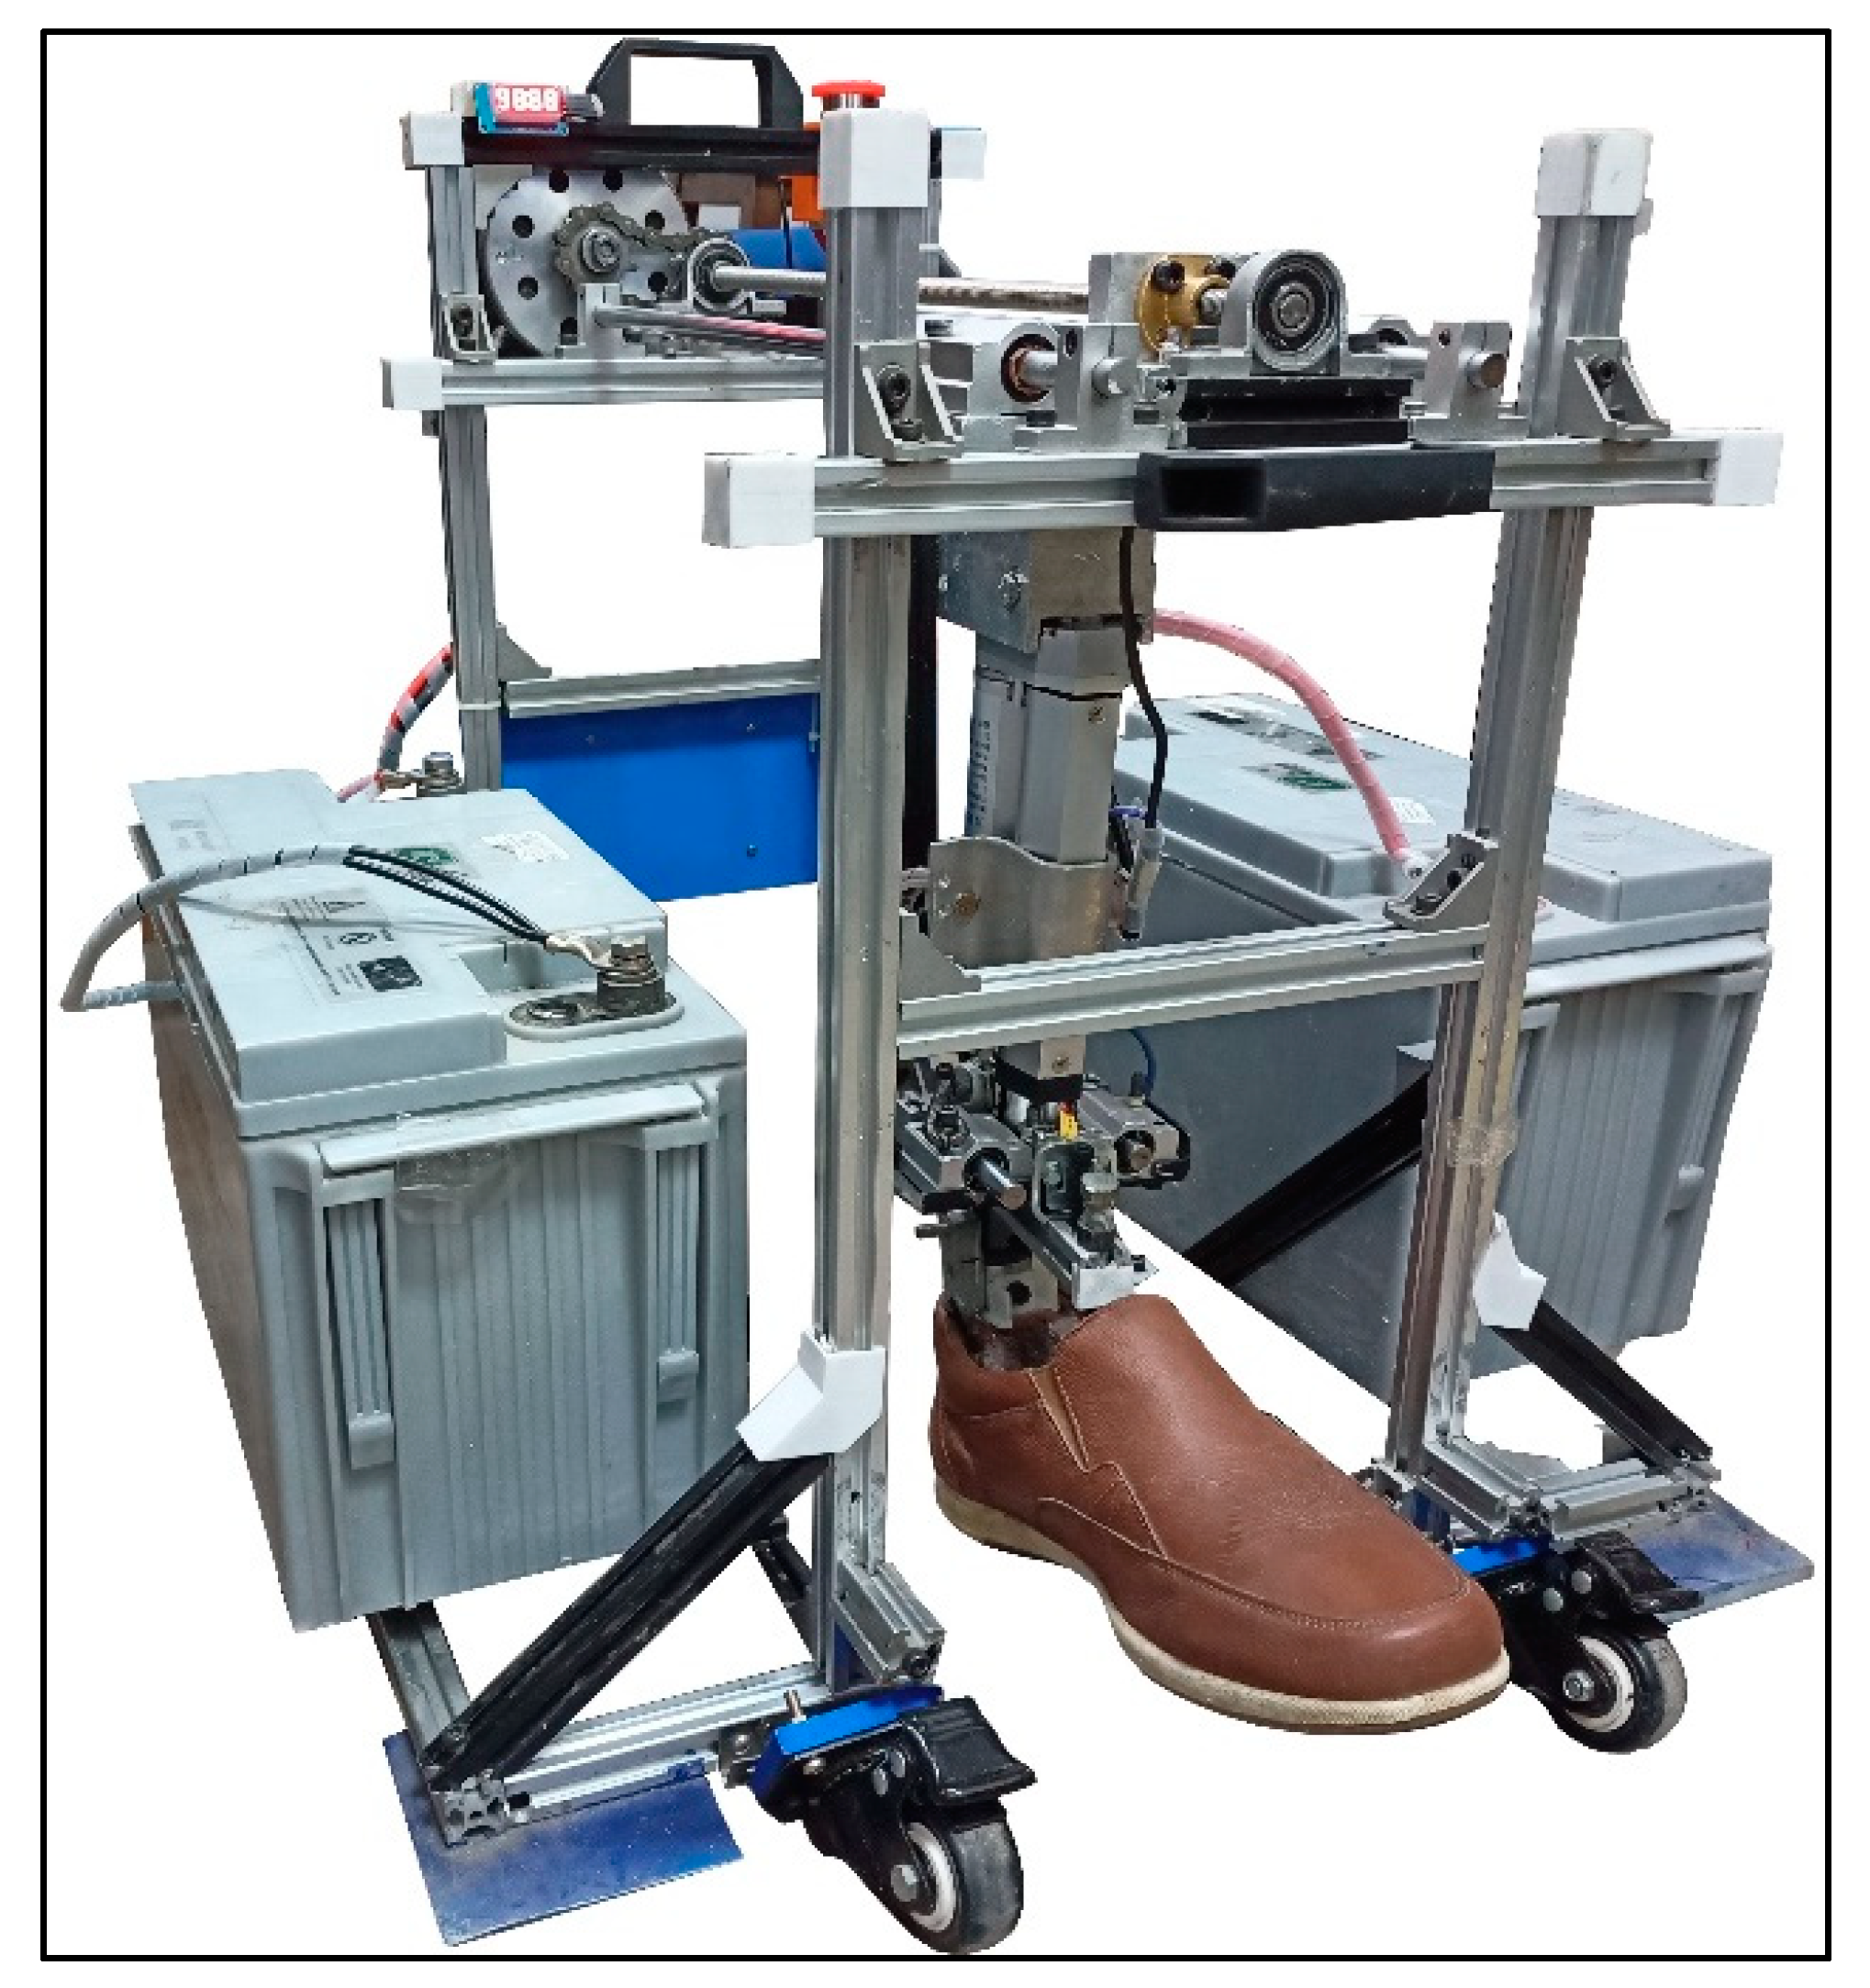
The shoe–floor traction was estimated using a portable and biofidelic mechanical slip tester [31] (Figure 4). The whole-shoe slip-testing device implemented in this study was based on the ASTM F2913-19 standard [32]. The robotic testing device consisted of three major mechanisms, i.e., the horizontal motion mechanism to provide the slipping velocity, the vertical motion mechanism to provide the normal load, and the angle adjusting mechanism to simulate heel-strike slipping dynamics. The normal load during slipping was controlled by a linear actuator and measured using a cantilever load cell. This load cell was present in between the test rig and the actuator. Once the slipping motion was provided, the shear force was calculated by the load cell placed beside the shoe last. As the device was portable, it was carried to the actual flooring location to perform the tests. Finally, the dynamic friction was calculated by dividing the shear force by the normal force observed during the slipping simulation. The detailed development of this device is explained in a recent work by Gupta et al. [31]. The developed outsoles were then attached to the footwear, and the footwear was further attached to the slip tester. To simulate realistic slipping biomechanics, a shoe–floor angle of 17 ± 2.5°, a slipping speed of 0.5 m/s, and a normal load of 250 ± 25 N were applied as the pre-programmed settings to the slip tester [8,16,27,28]. The developed nine outsoles were slip tested on a common matte flooring across dry and water-contaminated conditions. The flooring had an average surface roughness (peak to valley) of 28.4 µm, which was measured using a digital surface profilometer (Precision instruments, India) at 10 locations in the concerned area on which the testing was performed. To simulate the water-contaminated condition, 40 mL of water was spilled over the flooring area. Five repetitions for each sample across each slipping condition (i.e., dry and water contaminant condition) were performed separately and represented. The ACOF values were quantified within the initial 200 ms once the normal load reached 250 ± 25 N.
The induced fluid pressure and mass flow rate across the outsoles were estimated using the computational framework. The ACOF of nine outsoles was quantified using the slip tester across dry and wet slipping conditions. The correlation coefficient (R2) was used to assess the quality of correlations between tread width and the ACOF in both dry and wet conditions, tread width and the fluid pressure and mass flow rate, tread gaps and the ACOF in both dry and wet conditions, and tread gaps and the fluid pressure and mass flow rate. Furthermore, the effect of the tread area on the ACOF, fluid pressure, and mass flow rates was also analyzed. For this study, 0.5 > R2 was deemed insignificant, 0.5 < R2 < 0.7 was considered moderate, and R2 > 0.7 was considered a strong correlation [16].
3. Results
3.1. Frictional Performance of Footwear Outsoles
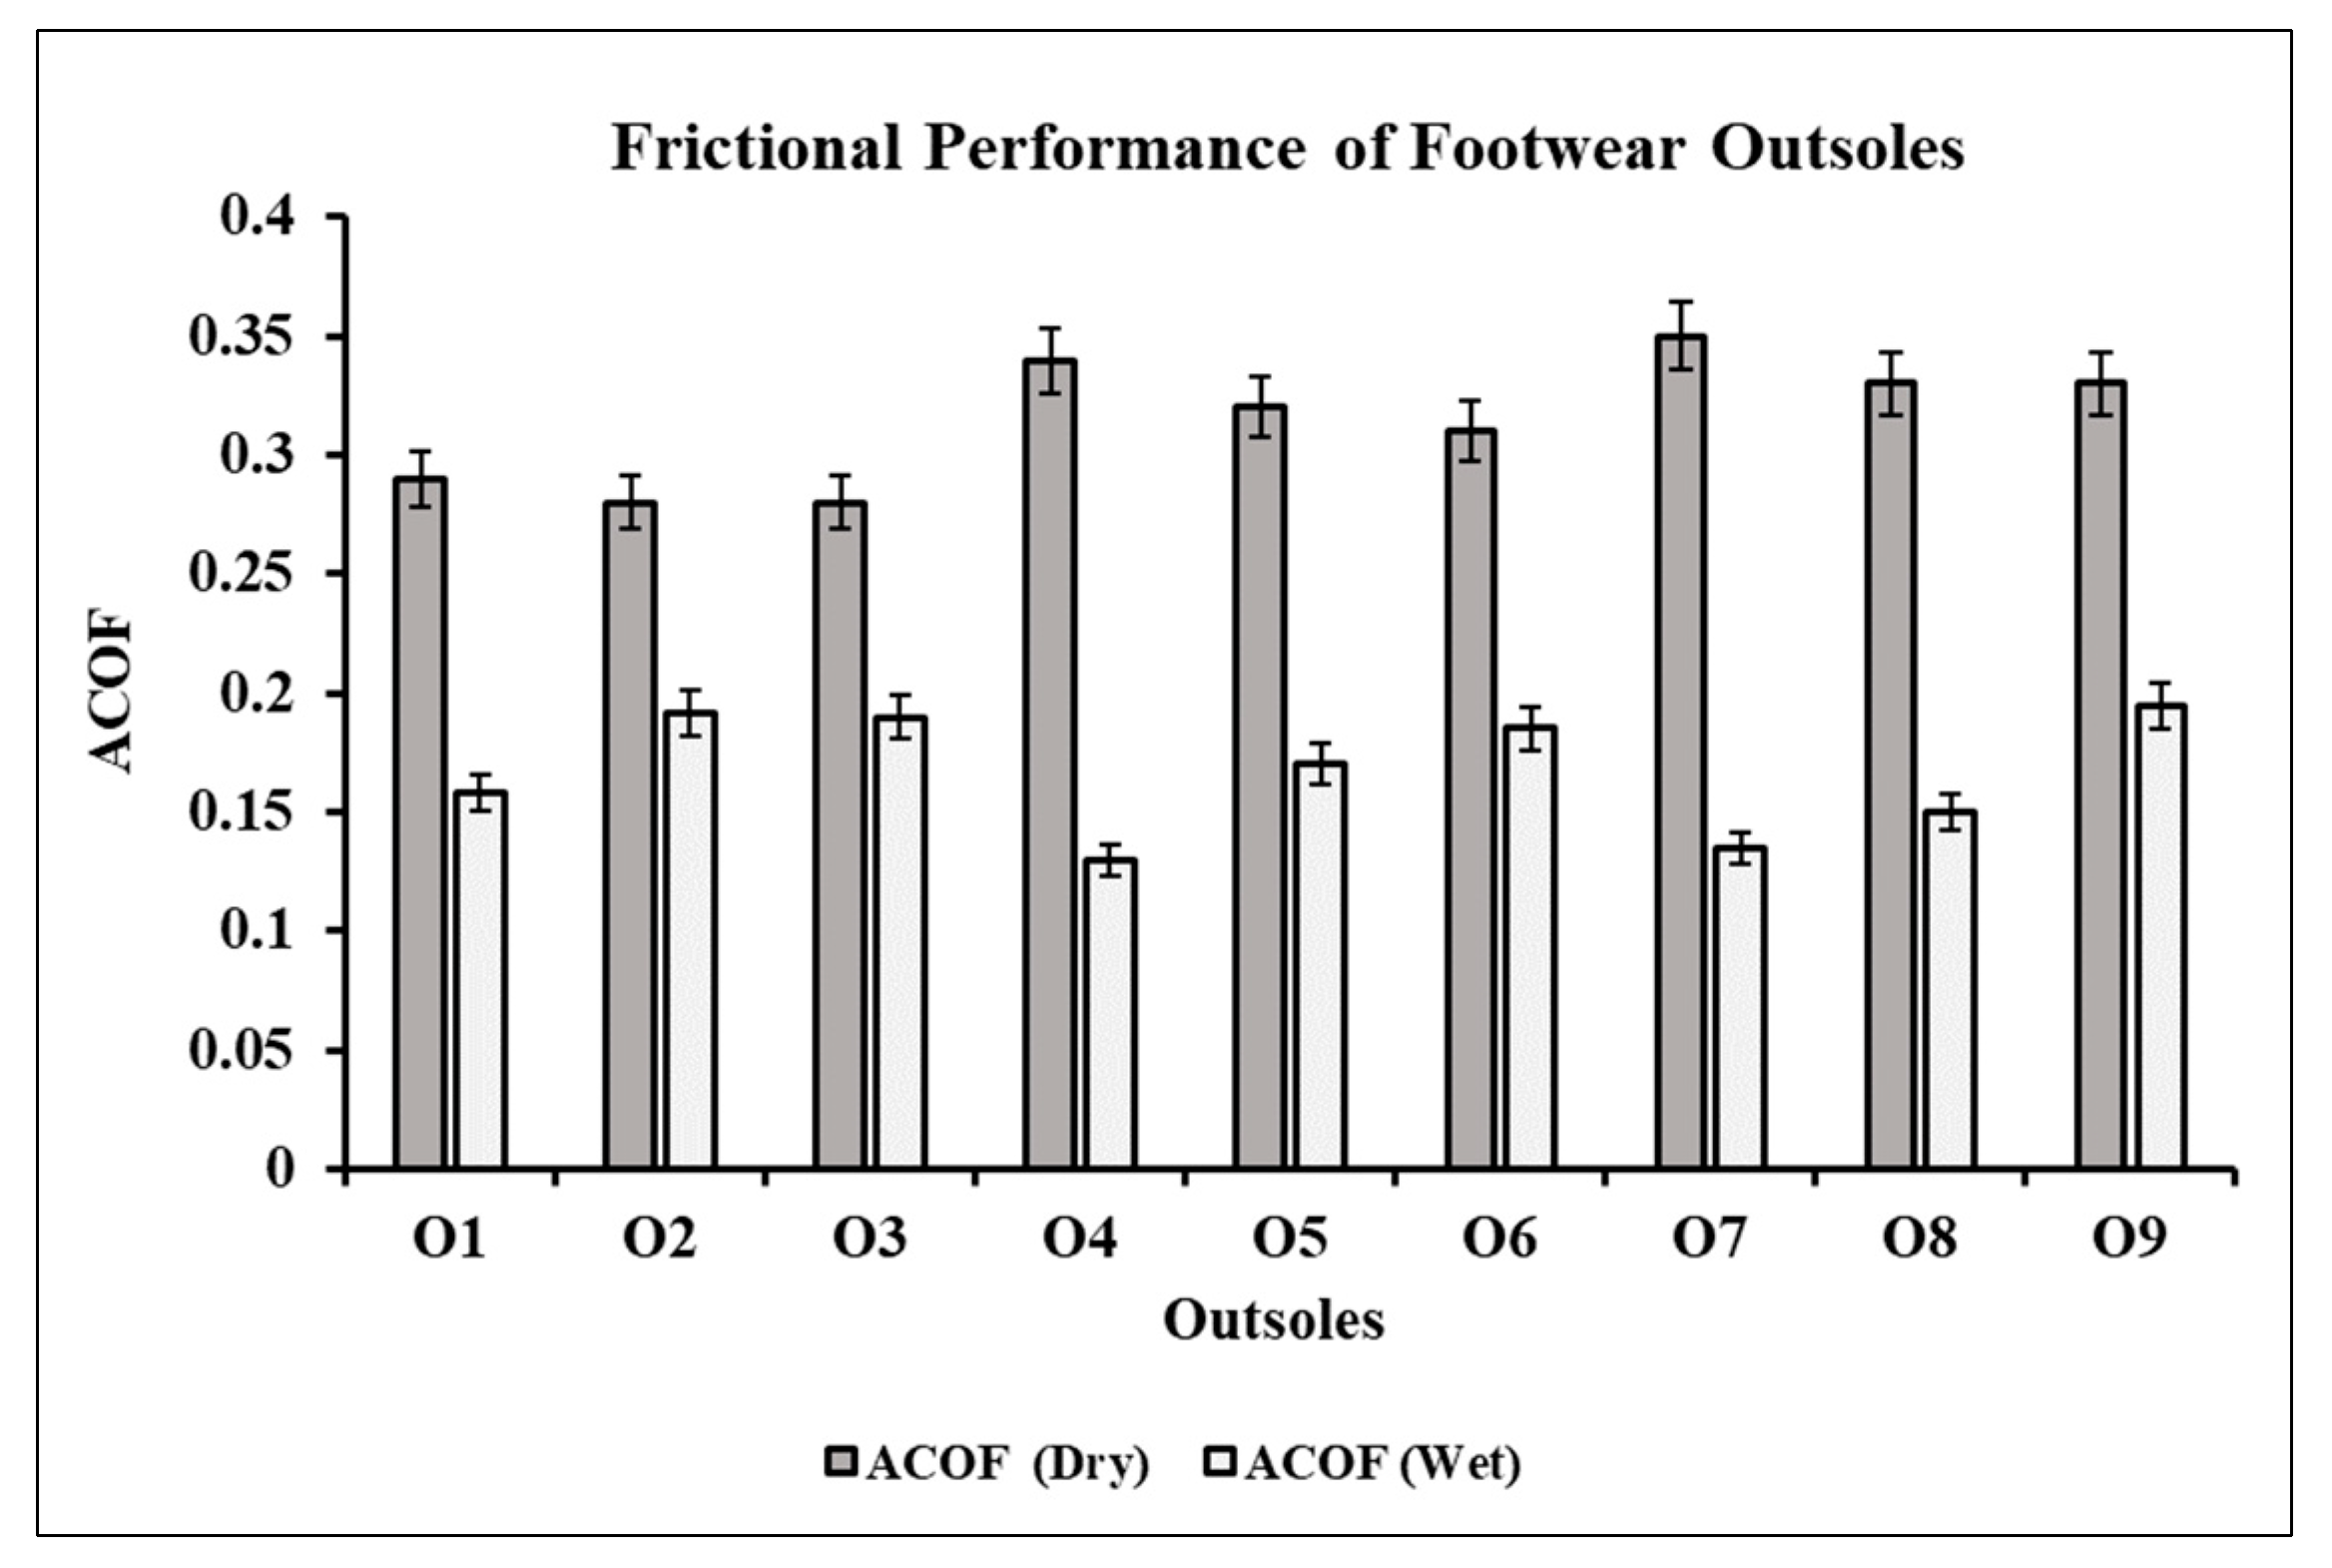
The induced fluid pressure and mass flow rate across the outsoles were estimated using the computational framework. The ACOF of nine outsoles was quantified using the slip tester across dry and wet slipping conditions. The ACOF values of the outsoles varied from 0.13 to 0.35 when slip tested on dry and wet flooring (Figure 5). Specifically, in dry slip testing, the friction values ranged from 0.28 to 0.35. Outsole O7 exhibited the highest ACOF of 0.35, as compared to the other outsoles. Apart from O7, outsoles O8 and O9 exhibited similar ACOF outcomes (i.e., 0.33). After O7, O4 showed the highest ACOF of 0.34. As compared to O7, O1 experienced a reduction of approximately 20%, O2 and O3 of 25%, O5 of 9%, O6 of 13%, and O8 and O9 of 6% each in the ACOF in the dry condition. O2 and O3 exhibited the lowest ACOF (i.e., 0.28) among all the outsoles. In water-contaminated conditions, the ACOF values varied from 0.13 to 0.19. Across all the outsoles, O9, O2, and O3 showed similar and the highest ACOF (i.e., 0.19) in the wet slip testing. Outsole O6, too, showed a similar ACOF, with a difference of 0.01 (i.e., 0.18). As compared to O9, O2, and O3, O1 experienced a reduction of approximately 23%, O2 of 2%, O4 of 50%, O5 of 15%, O7 of 44%, and O8 of 30% each in the ACOF in wet conditions. Outsoles O4 and O7 performed the poorest by generating a low ACOF (i.e., 0.13) across all the outsoles.
3.2. Fluid Pressure and Mass Flow Rates across the Footwear outsoles
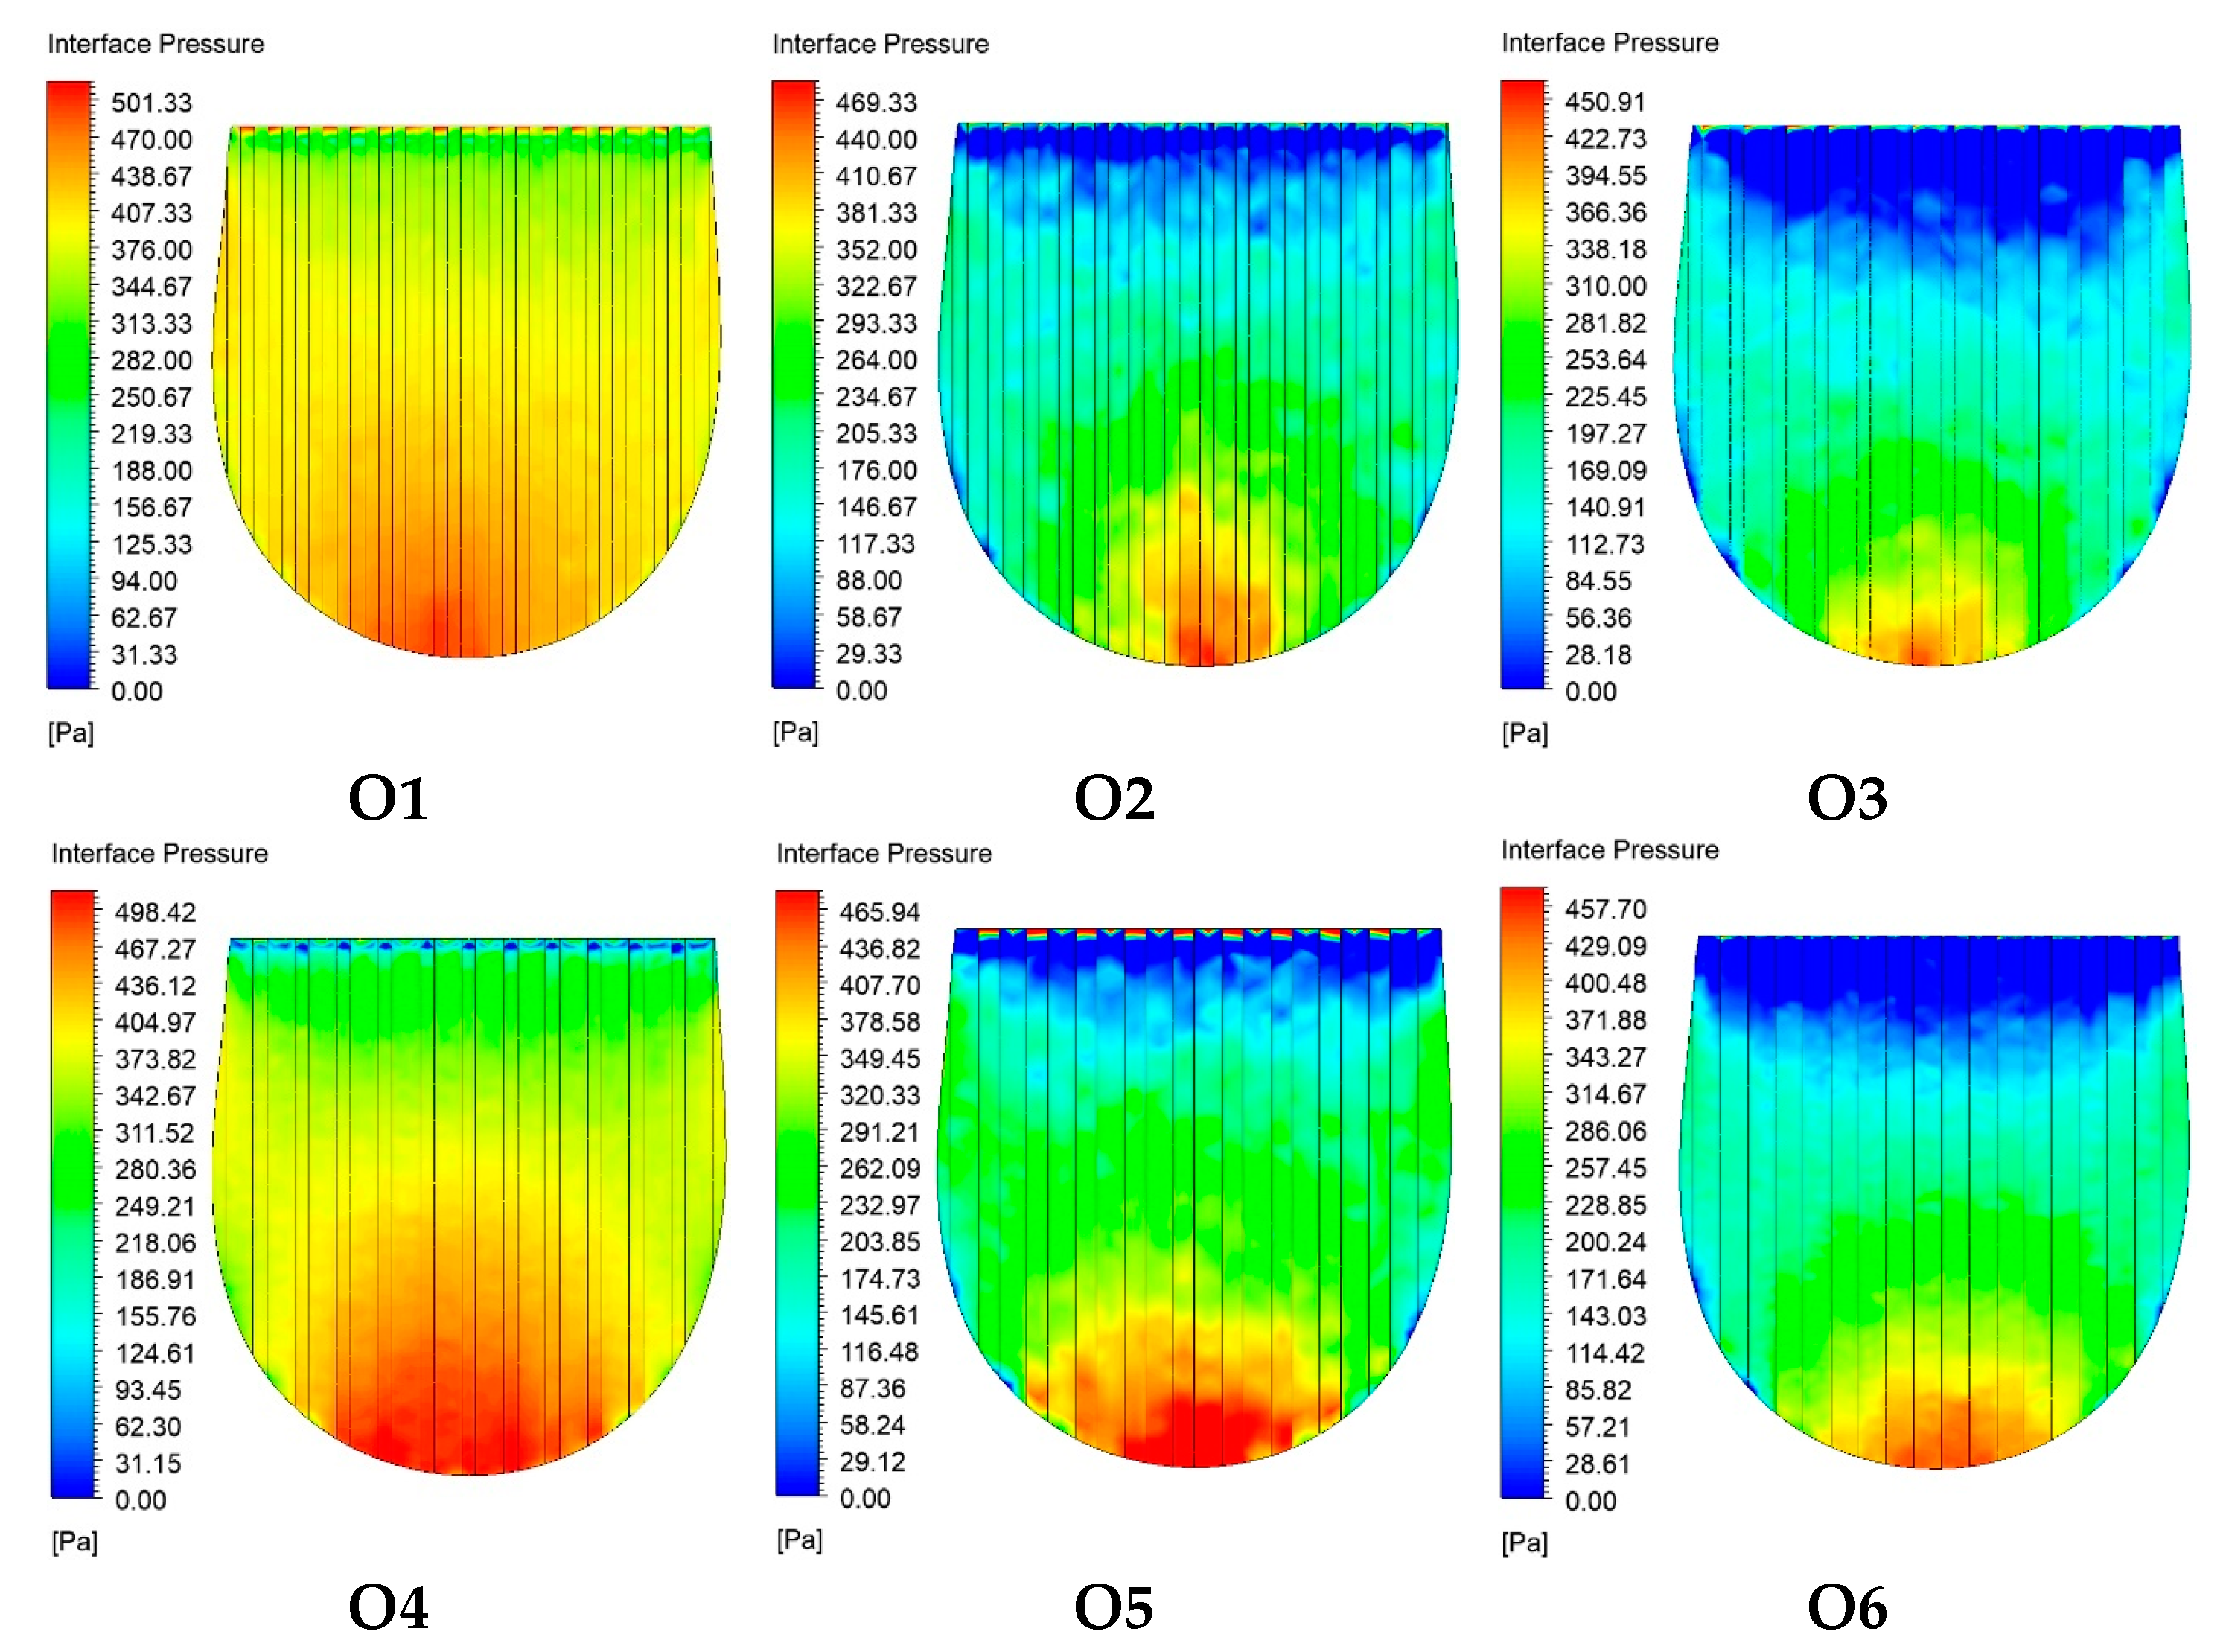
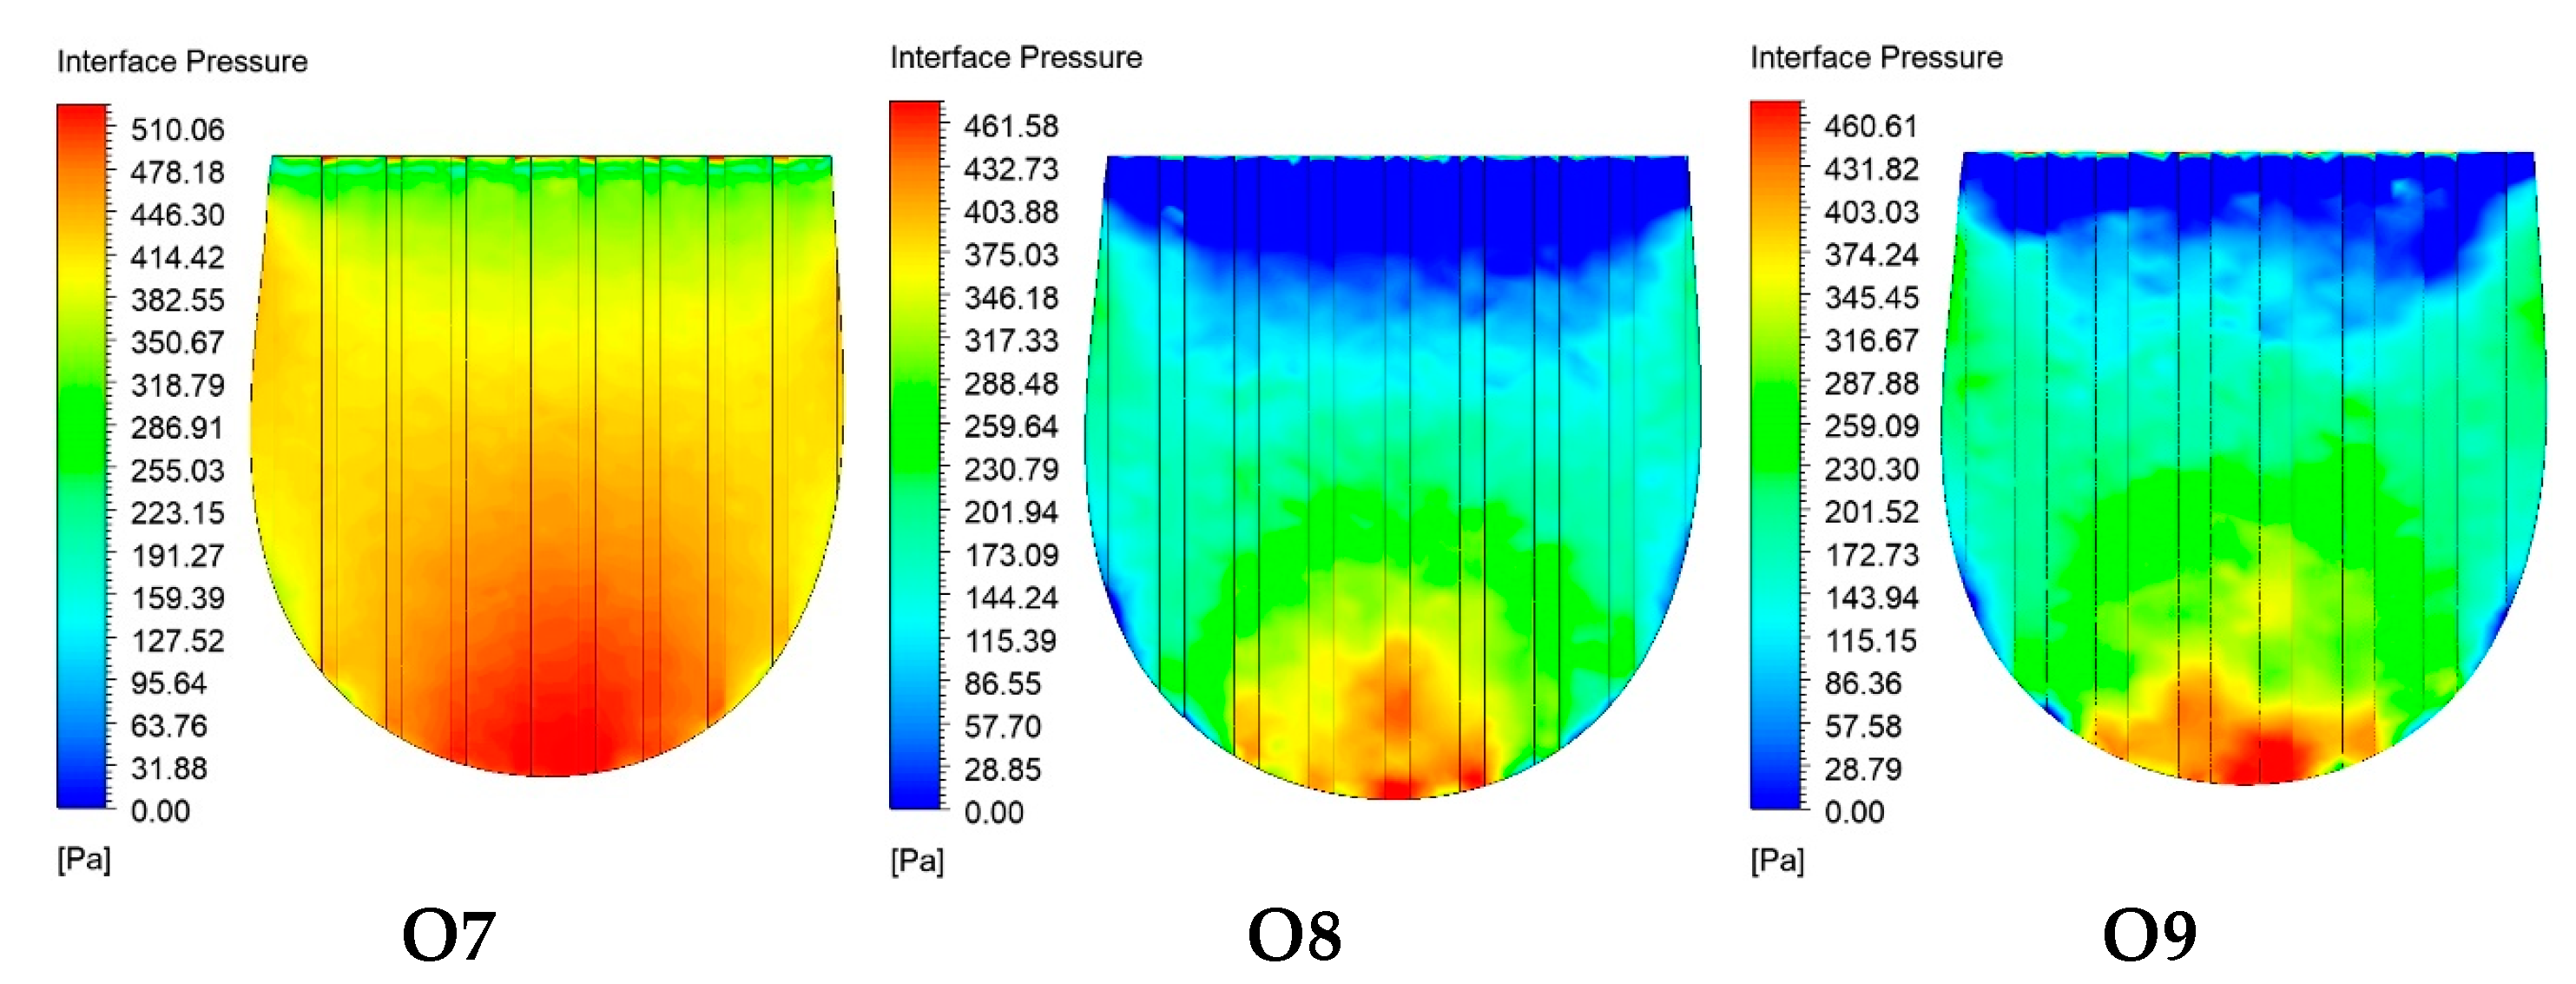
The maximum induced fluid pressure over the outsoles in the wet slipping simulations ranged from 450.91 Pa to 510.06 Pa (Figure 6). Outsole O7 showed the highest interfacial fluid pressure (i.e., 510.06 Pa), whereas O3 showed the lowest fluid pressure (i.e., 450.91 Pa) across all the outsoles. As compared to O7, O1 experienced a reduction of approximately 2%, O2 of 9%, O3 of 13%, O4 of 3%, O5 of 10%, O6 of 12%, and O8 and O9 of 11%. Outsoles O2, O3, O5, O6, O8, and O9 experienced the lowest fluid pressures of 469.33 Pa, 450.91 Pa, 465.94 Pa, 457.70 Pa, 461.58 Pa, and 460.61 Pa, respectively. O1, O4, and O7 showed similar high-pressure contours and limited localized zones as compared to the other outsoles. The remaining outsoles showed similar pressure distribution contours.
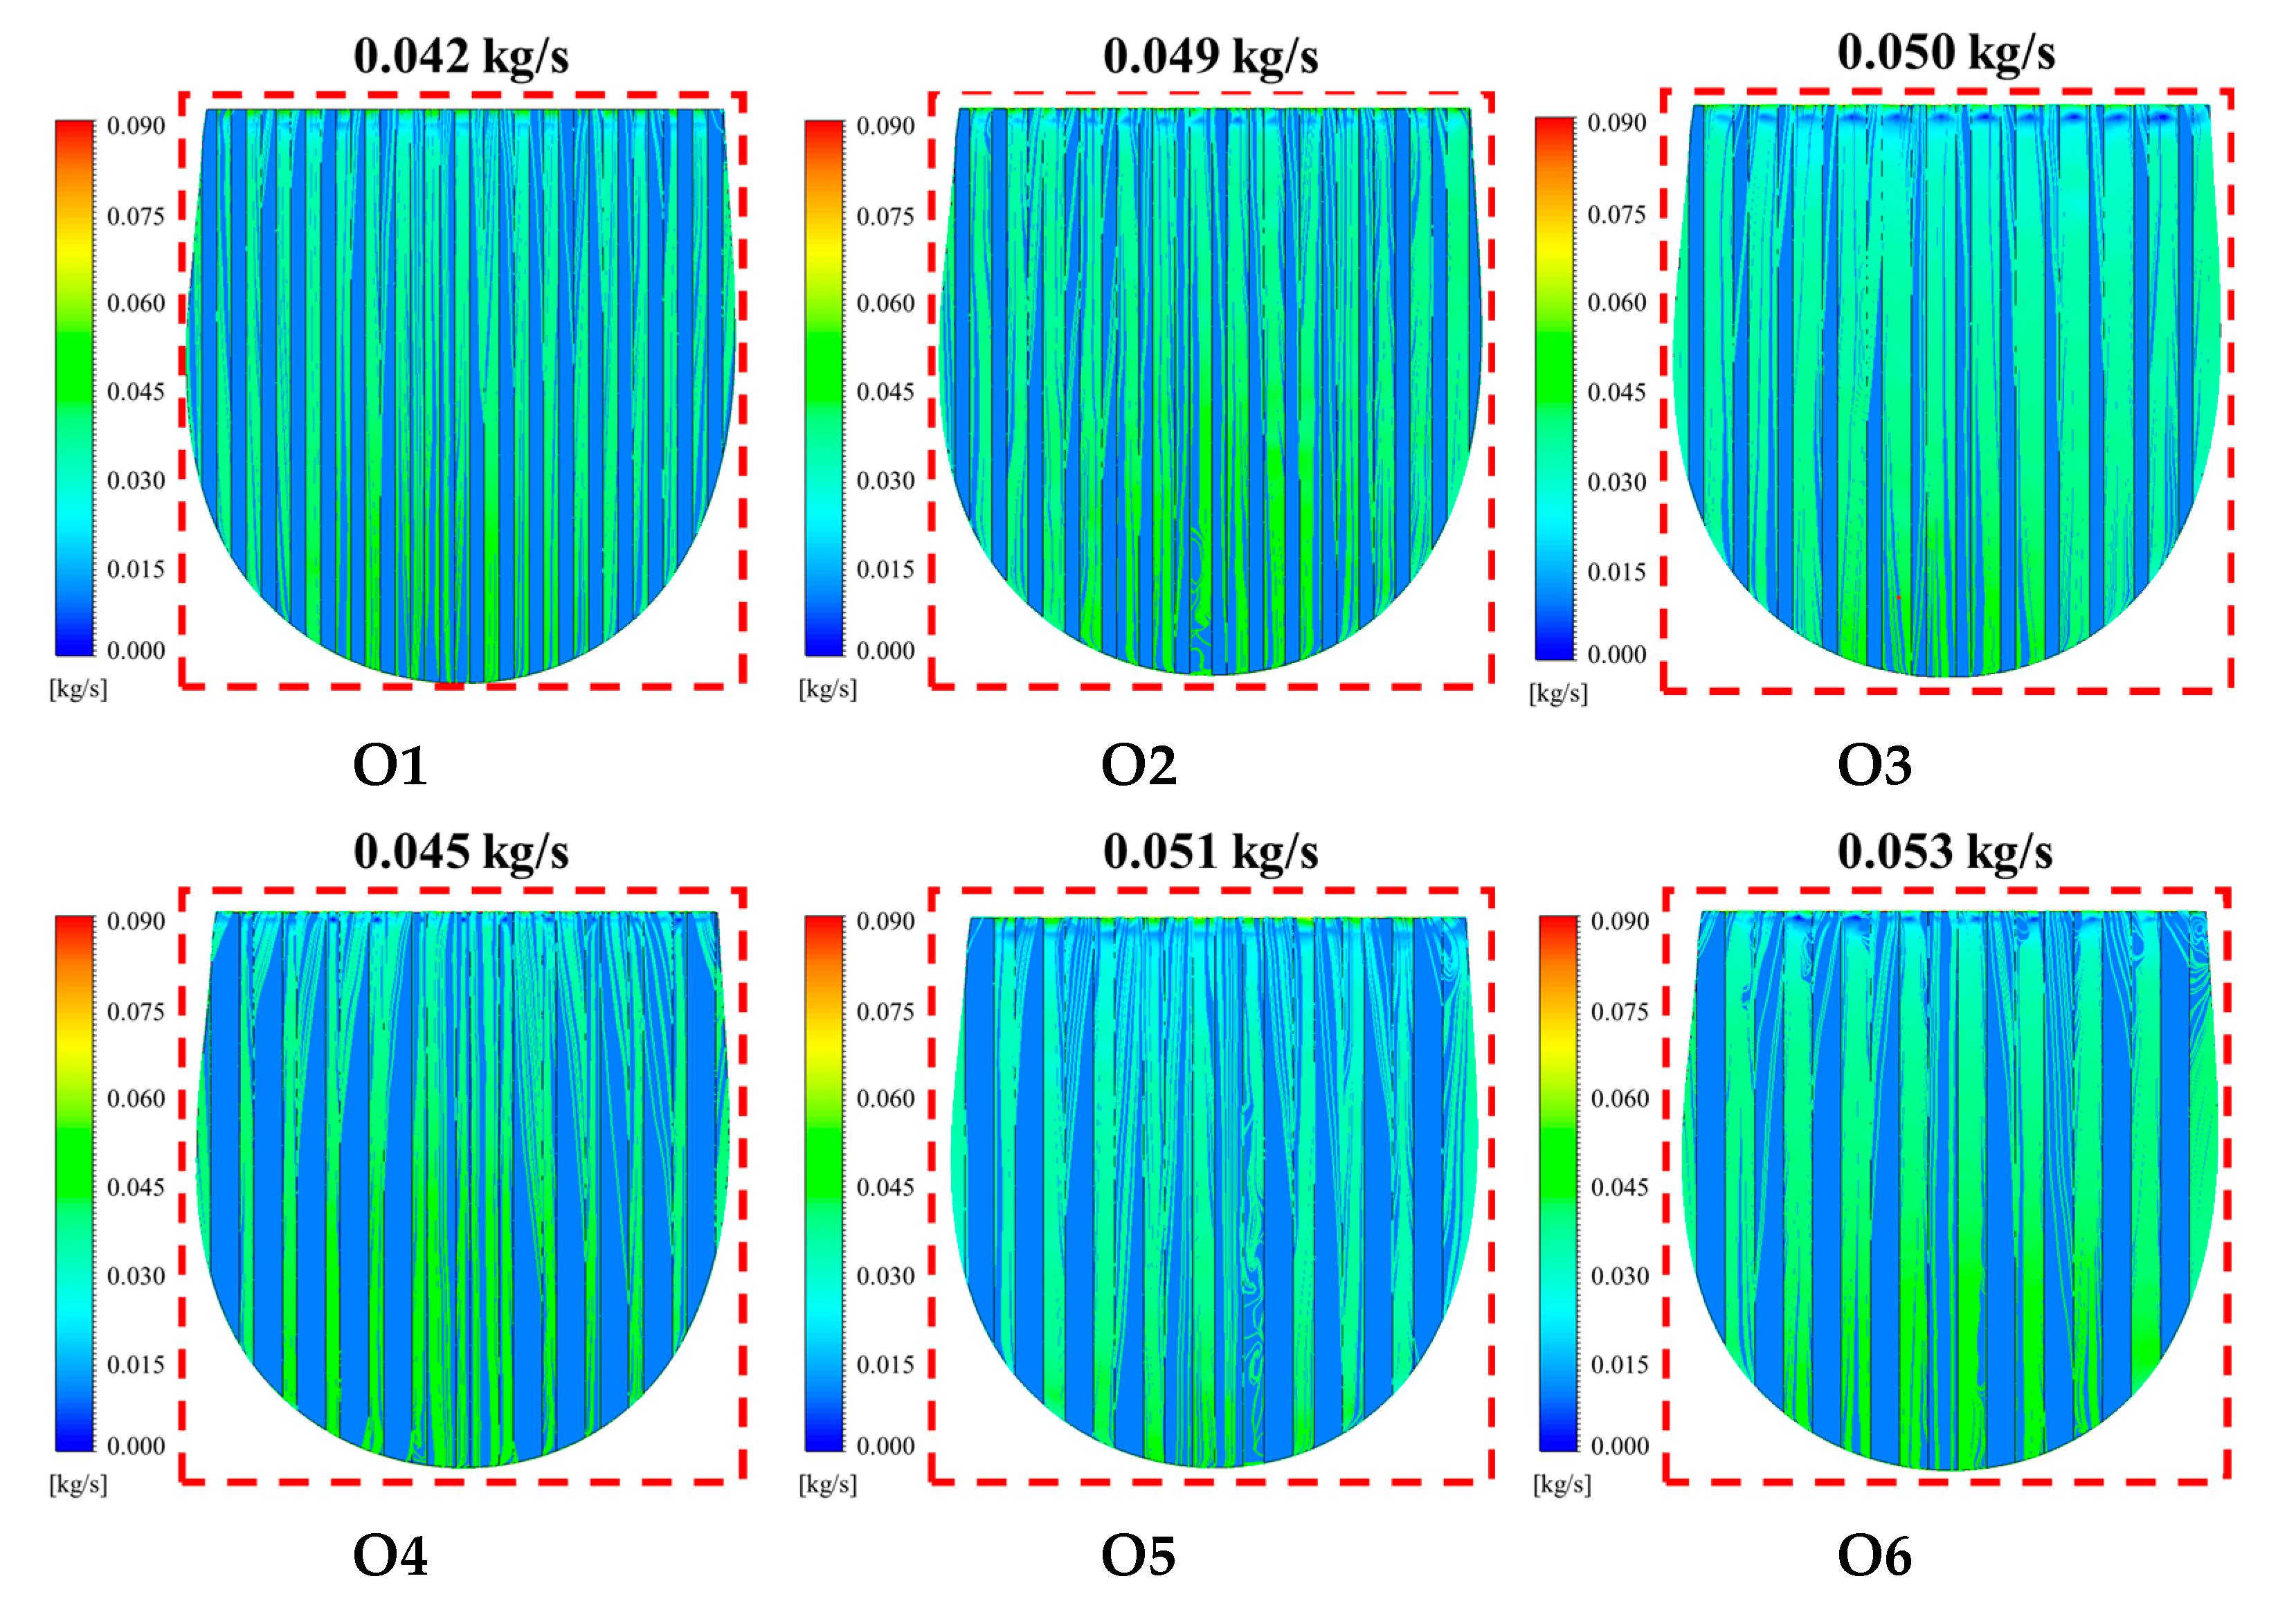
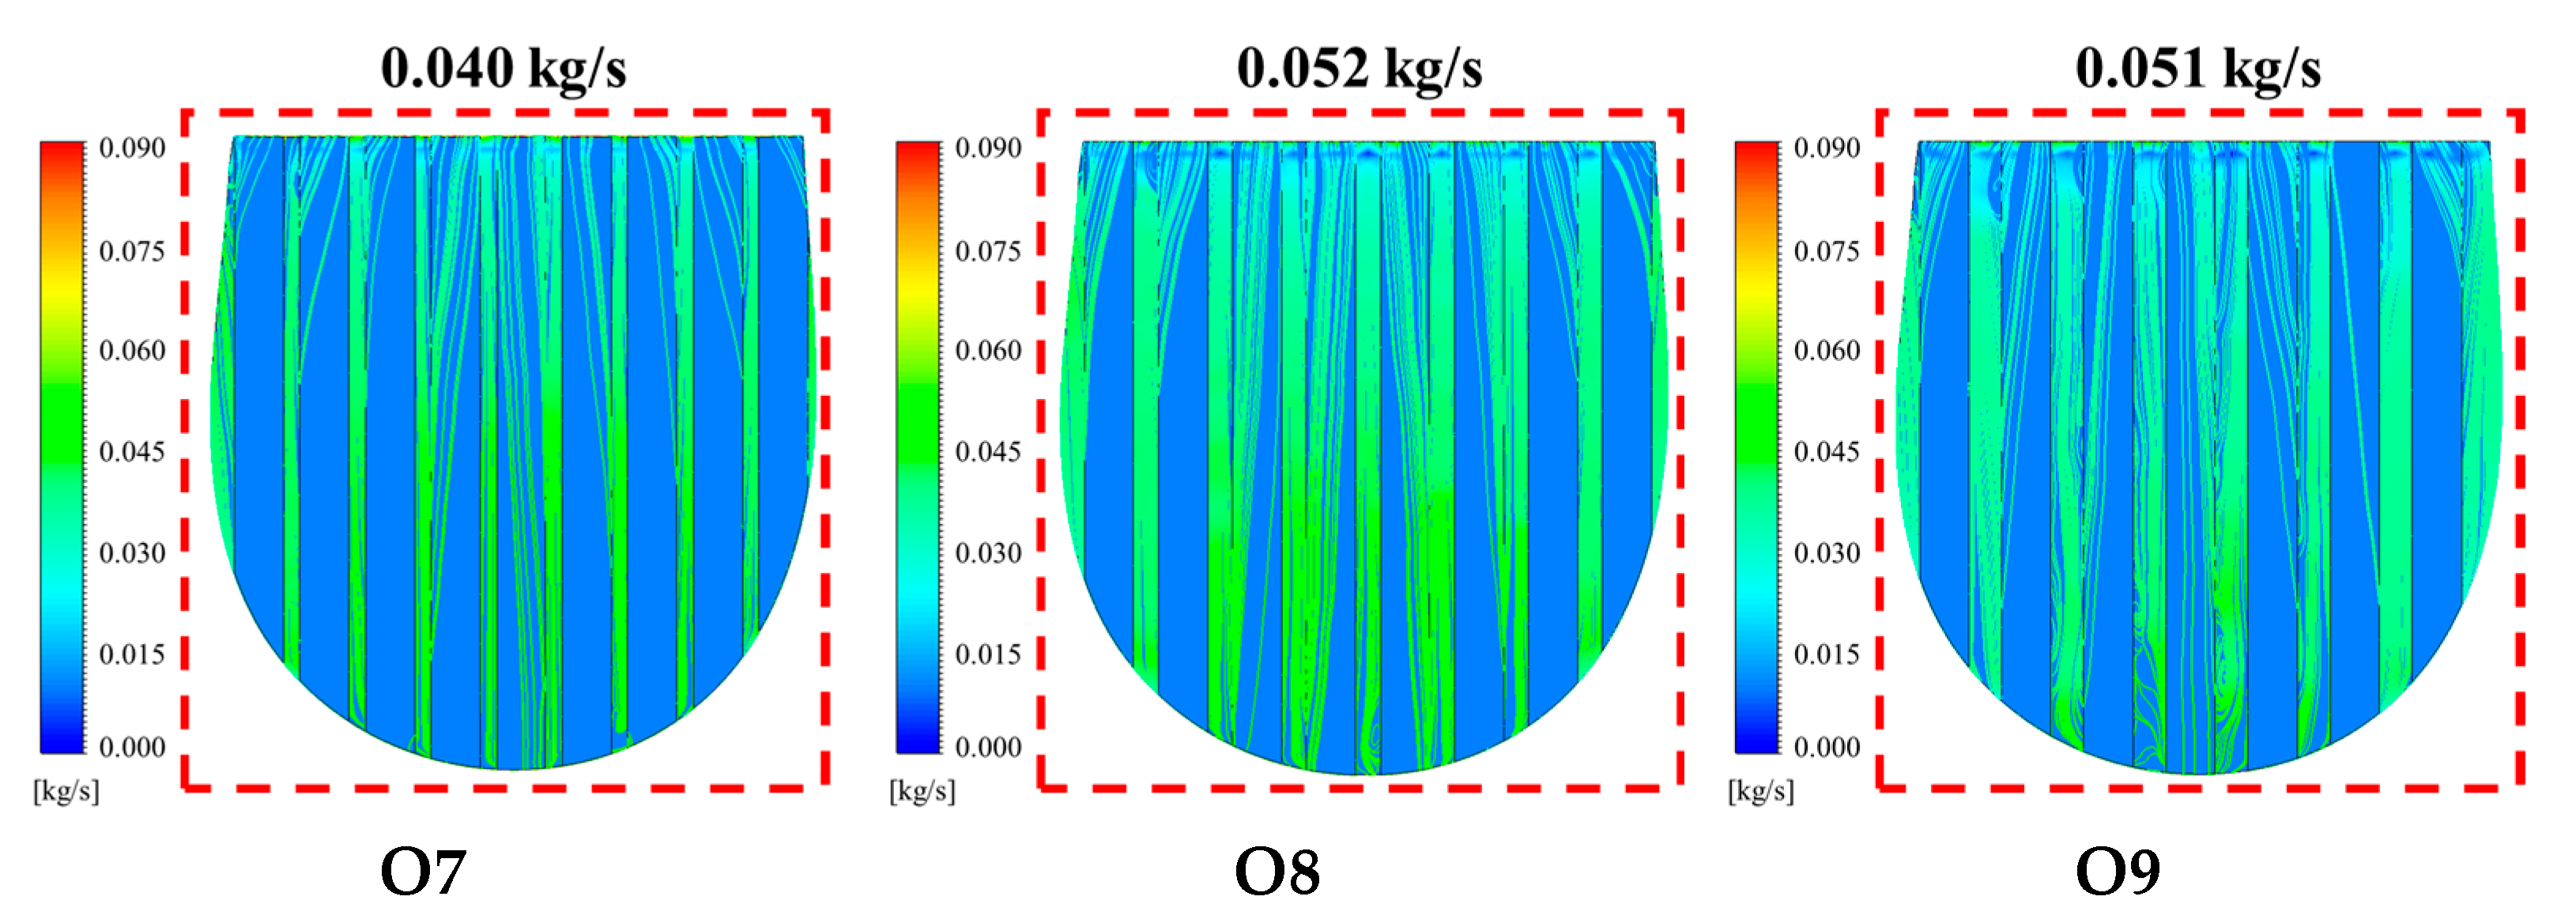
Figure 7 represents the averaged mass flow rates during wet slip simulations across the footwear outsoles. The mass flow rates ranged from 0.040 kg/s to 0.053 kg/s. Out of all the outsoles, O6 showed the maximum mass flow rate of 0.053 kg/s throughout the outsole topography. On the contrary, O7 exhibited the lowest mass flow rate of 0.040 kg/s across its treads during the wet slip simulation. Outsole O1 reported a similar flow rate (i.e., 0.042 kg/s) as compared to O7, which showed a staggered channeling of water flow via its treads. Besides O6, the remaining outsoles (i.e., O2, O3, O5, O8, and O9) exhibited increased mass flow rates in the ranges of 0.049 kg/s to 0.052 kg/s. Among these, the highest mass flow rates were for the O5 and O8, with 0.051 kg/s and 0.052 kg/s, respectively.
3.3. Effect of Tread Parameters on Study Outcomes
3.3.1. Effect of Tread Gaps on ACOF, Fluid Pressure, and Flow Rate
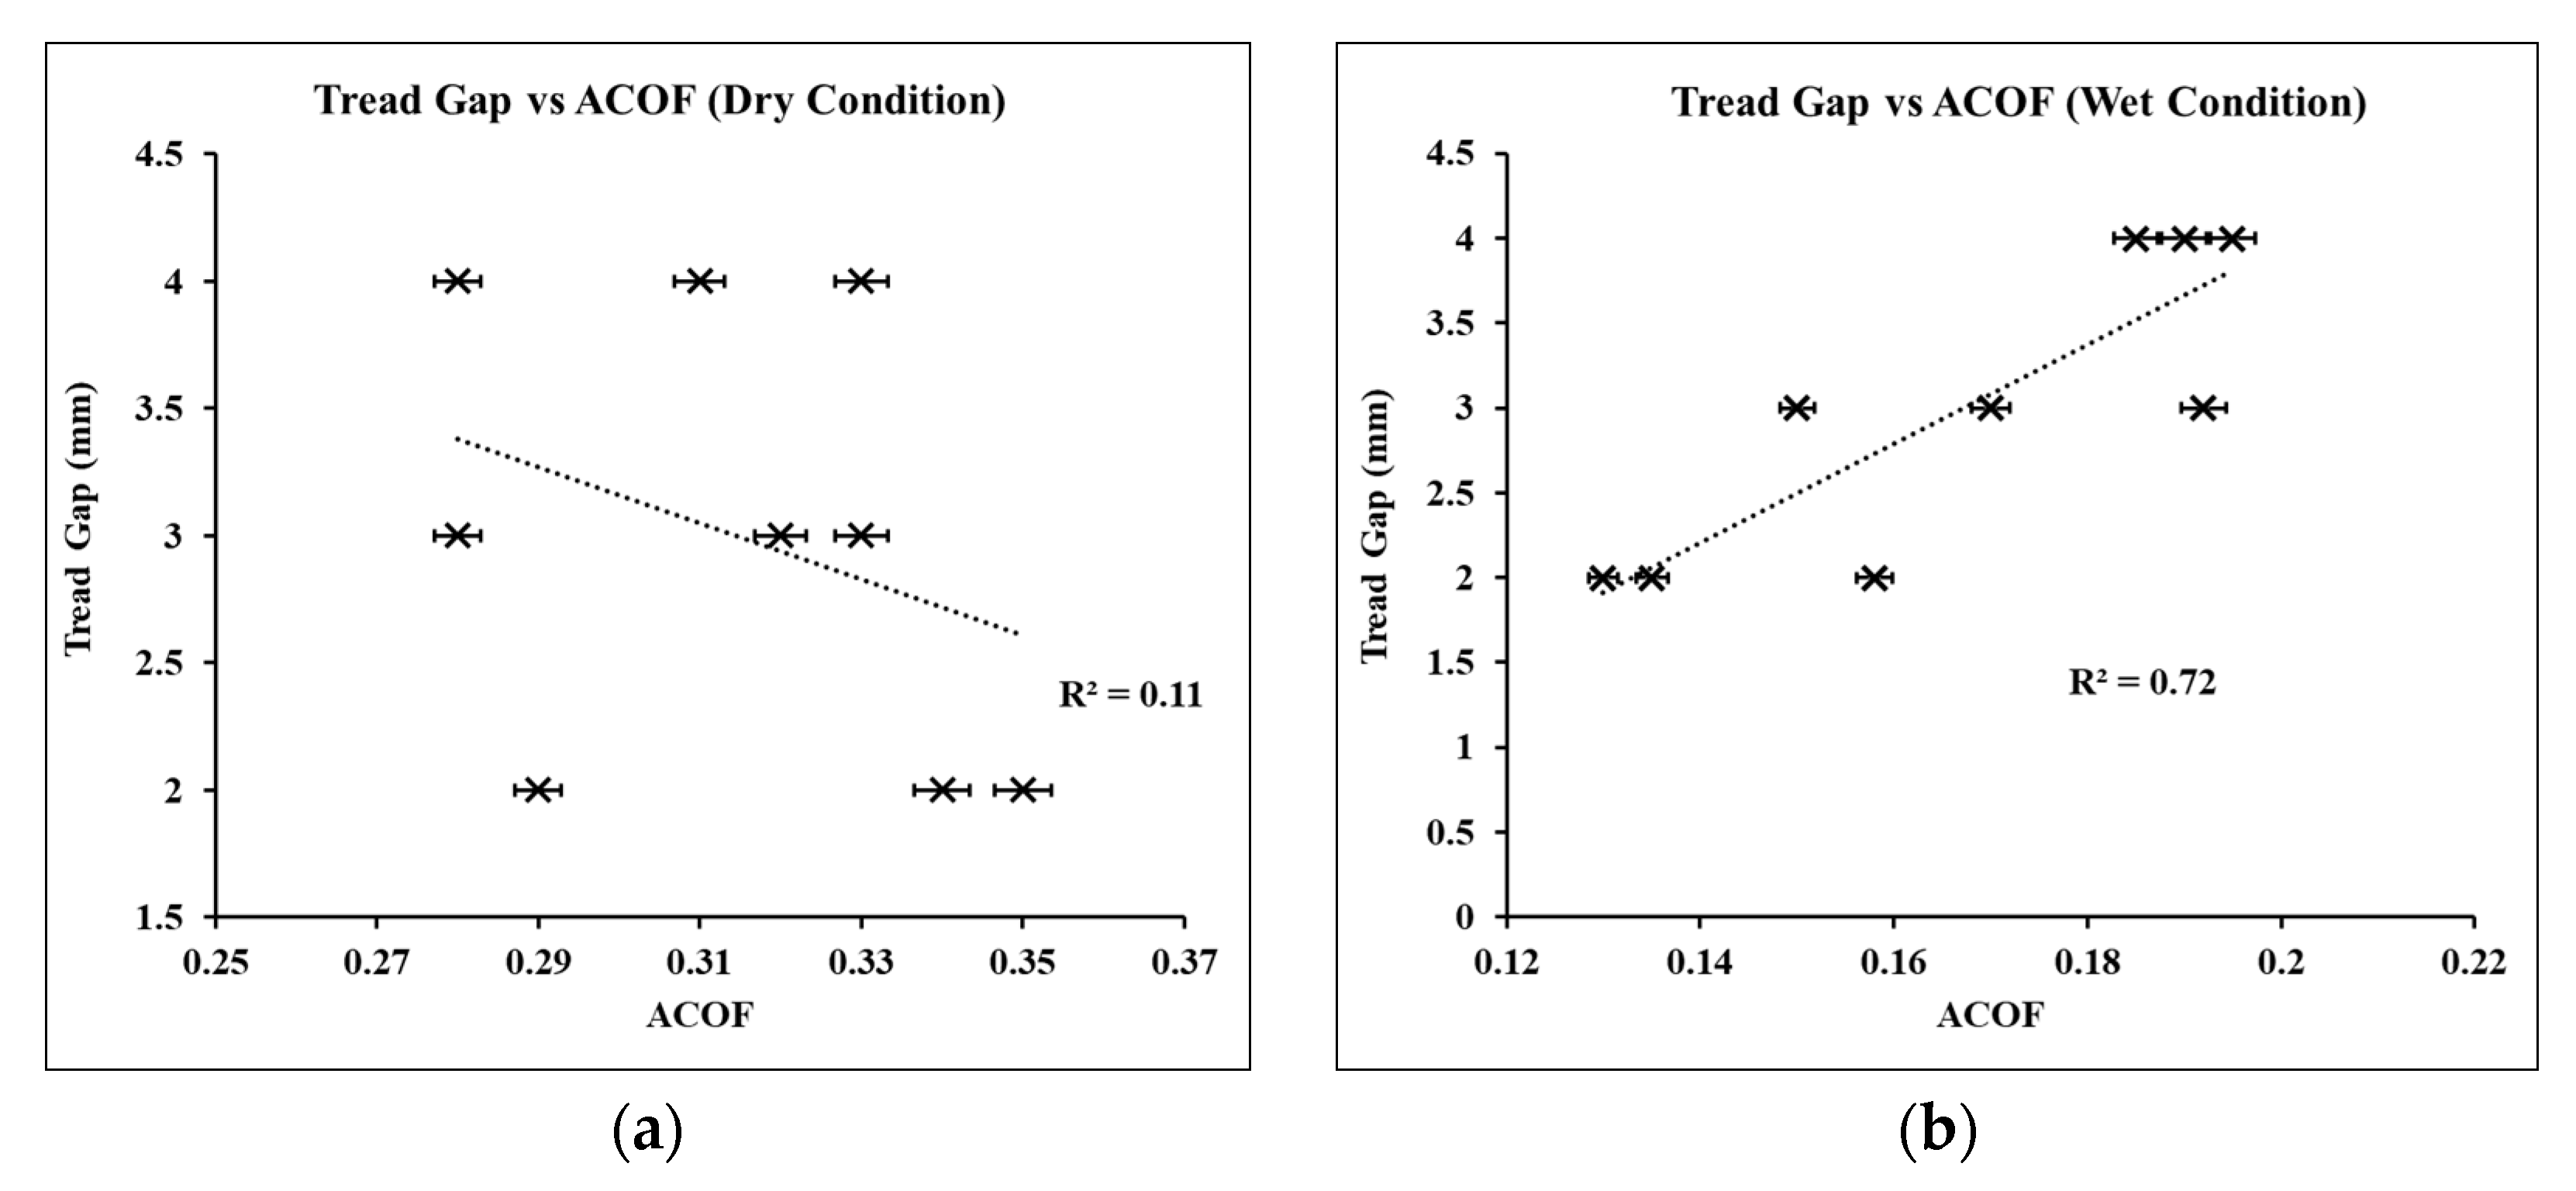
The effect of changing gaps (i.e., gap = 2 mm, 3 mm, and 4 mm) between the treads of the outsoles on friction was analyzed by quantifying the correlation between the gaps and the ACOF (Figure 8). In the dry slip-testing conditions, the gaps between the treads showed a weak correlation (R2 = 0.11) with the ACOF, as the ACOF ranged widely without any particular trend (Figure 8a). On the contrary, in the wet slip-testing conditions, the tread gaps strongly correlated with the ACOF (R2 = 0.72), as shown in Figure 8b. The positive trend meant the increase in the ACOF in the wet slipping conditions was due to an increase in the tread gaps. Outsoles O3, O6, and O9 had the largest tread gap and exhibited the highest ACOF values in the wet slipping conditions. On the contrary, outsoles with gaps of 2 mm (i.e., O1, O4, and O7) showed a low ACOF when tested on the water-contaminated flooring.
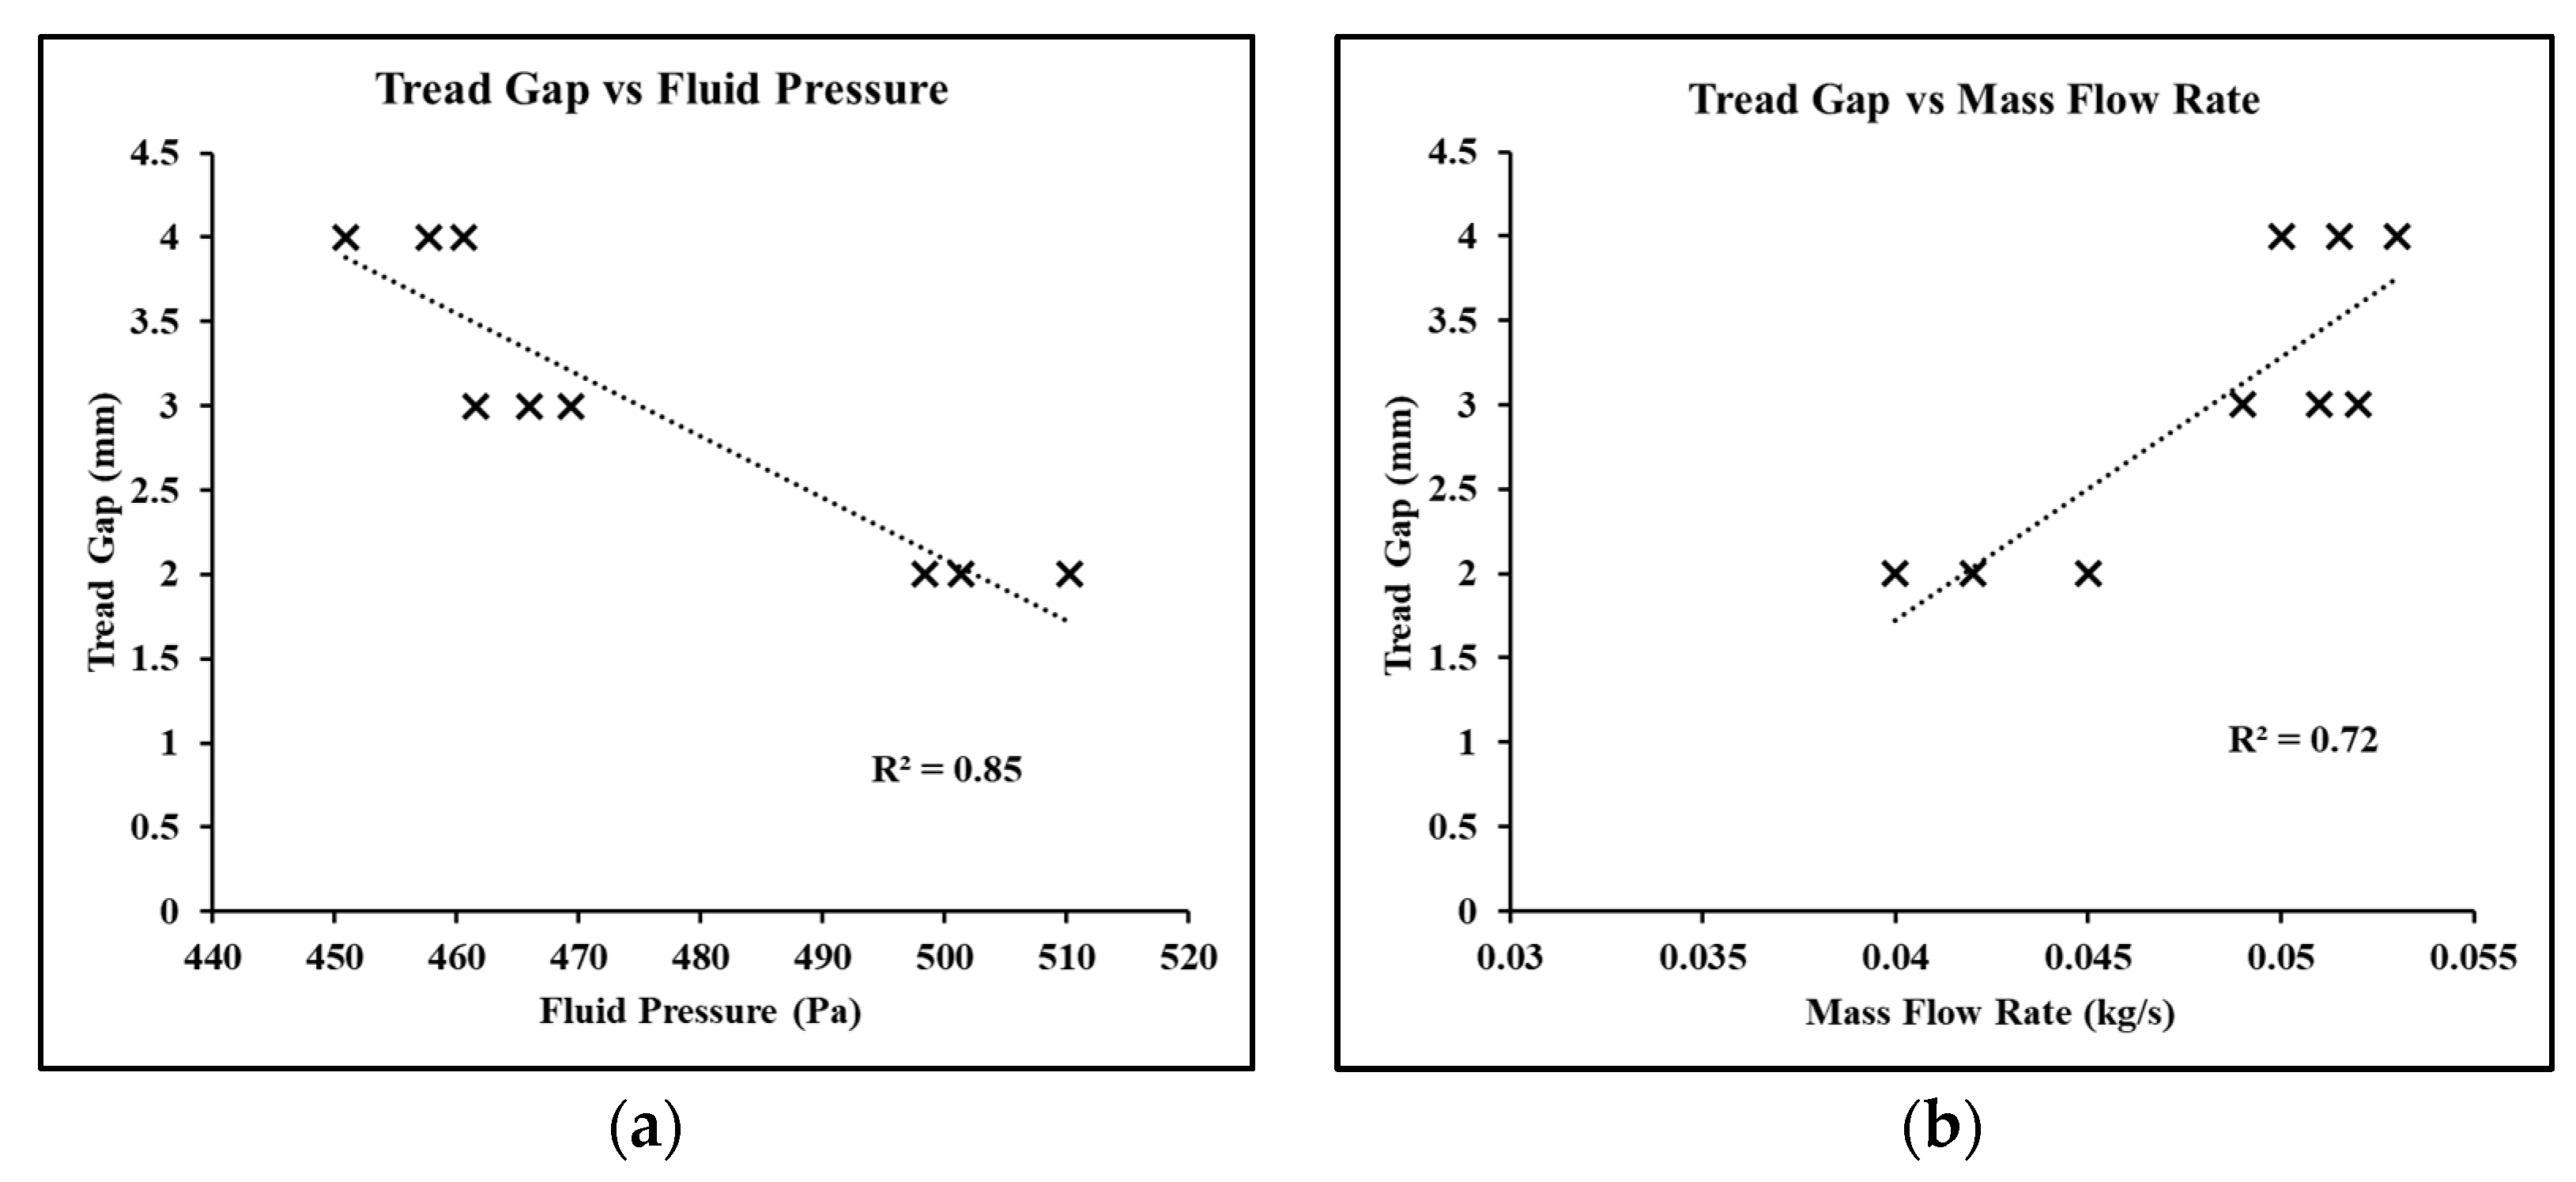
In wet slipping simulations, the influence of altering the tread gap on the fluid pressure and mass flow rate was measured by estimating the correlations between them (Figure 9). Figure 9a shows the correlation between the tread gap and induced fluid pressure. A strong and negative correlation was reported for the gaps and fluid pressure (R2 = 0.85). The fluid pressure for a gap of 4 mm varied from 450.91 Pa to 460.61 Pa, whereas a 3 mm gap and 2 mm gap ranged from 461.58 Pa to 469.33 Pa and 498.42 Pa to 510.26 Pa, respectively. In a similar trend, the tread gap and mass flow rate were quantified to be positively and strongly correlated (R2 = 0.72) (Figure 9b). Average mass flow rates across the tread gap of 4 mm varied from 0.050 kg/s to 0.053 kg/s, whereas for 3 mm and 2 mm gaps, it varied from 0.049 kg/s to 0.052 kg/s and 0.040 kg/s to 0.045 kg/s.
3.3.2. Effect of Tread Width on ACOF, Fluid Pressure, and Flow Rate
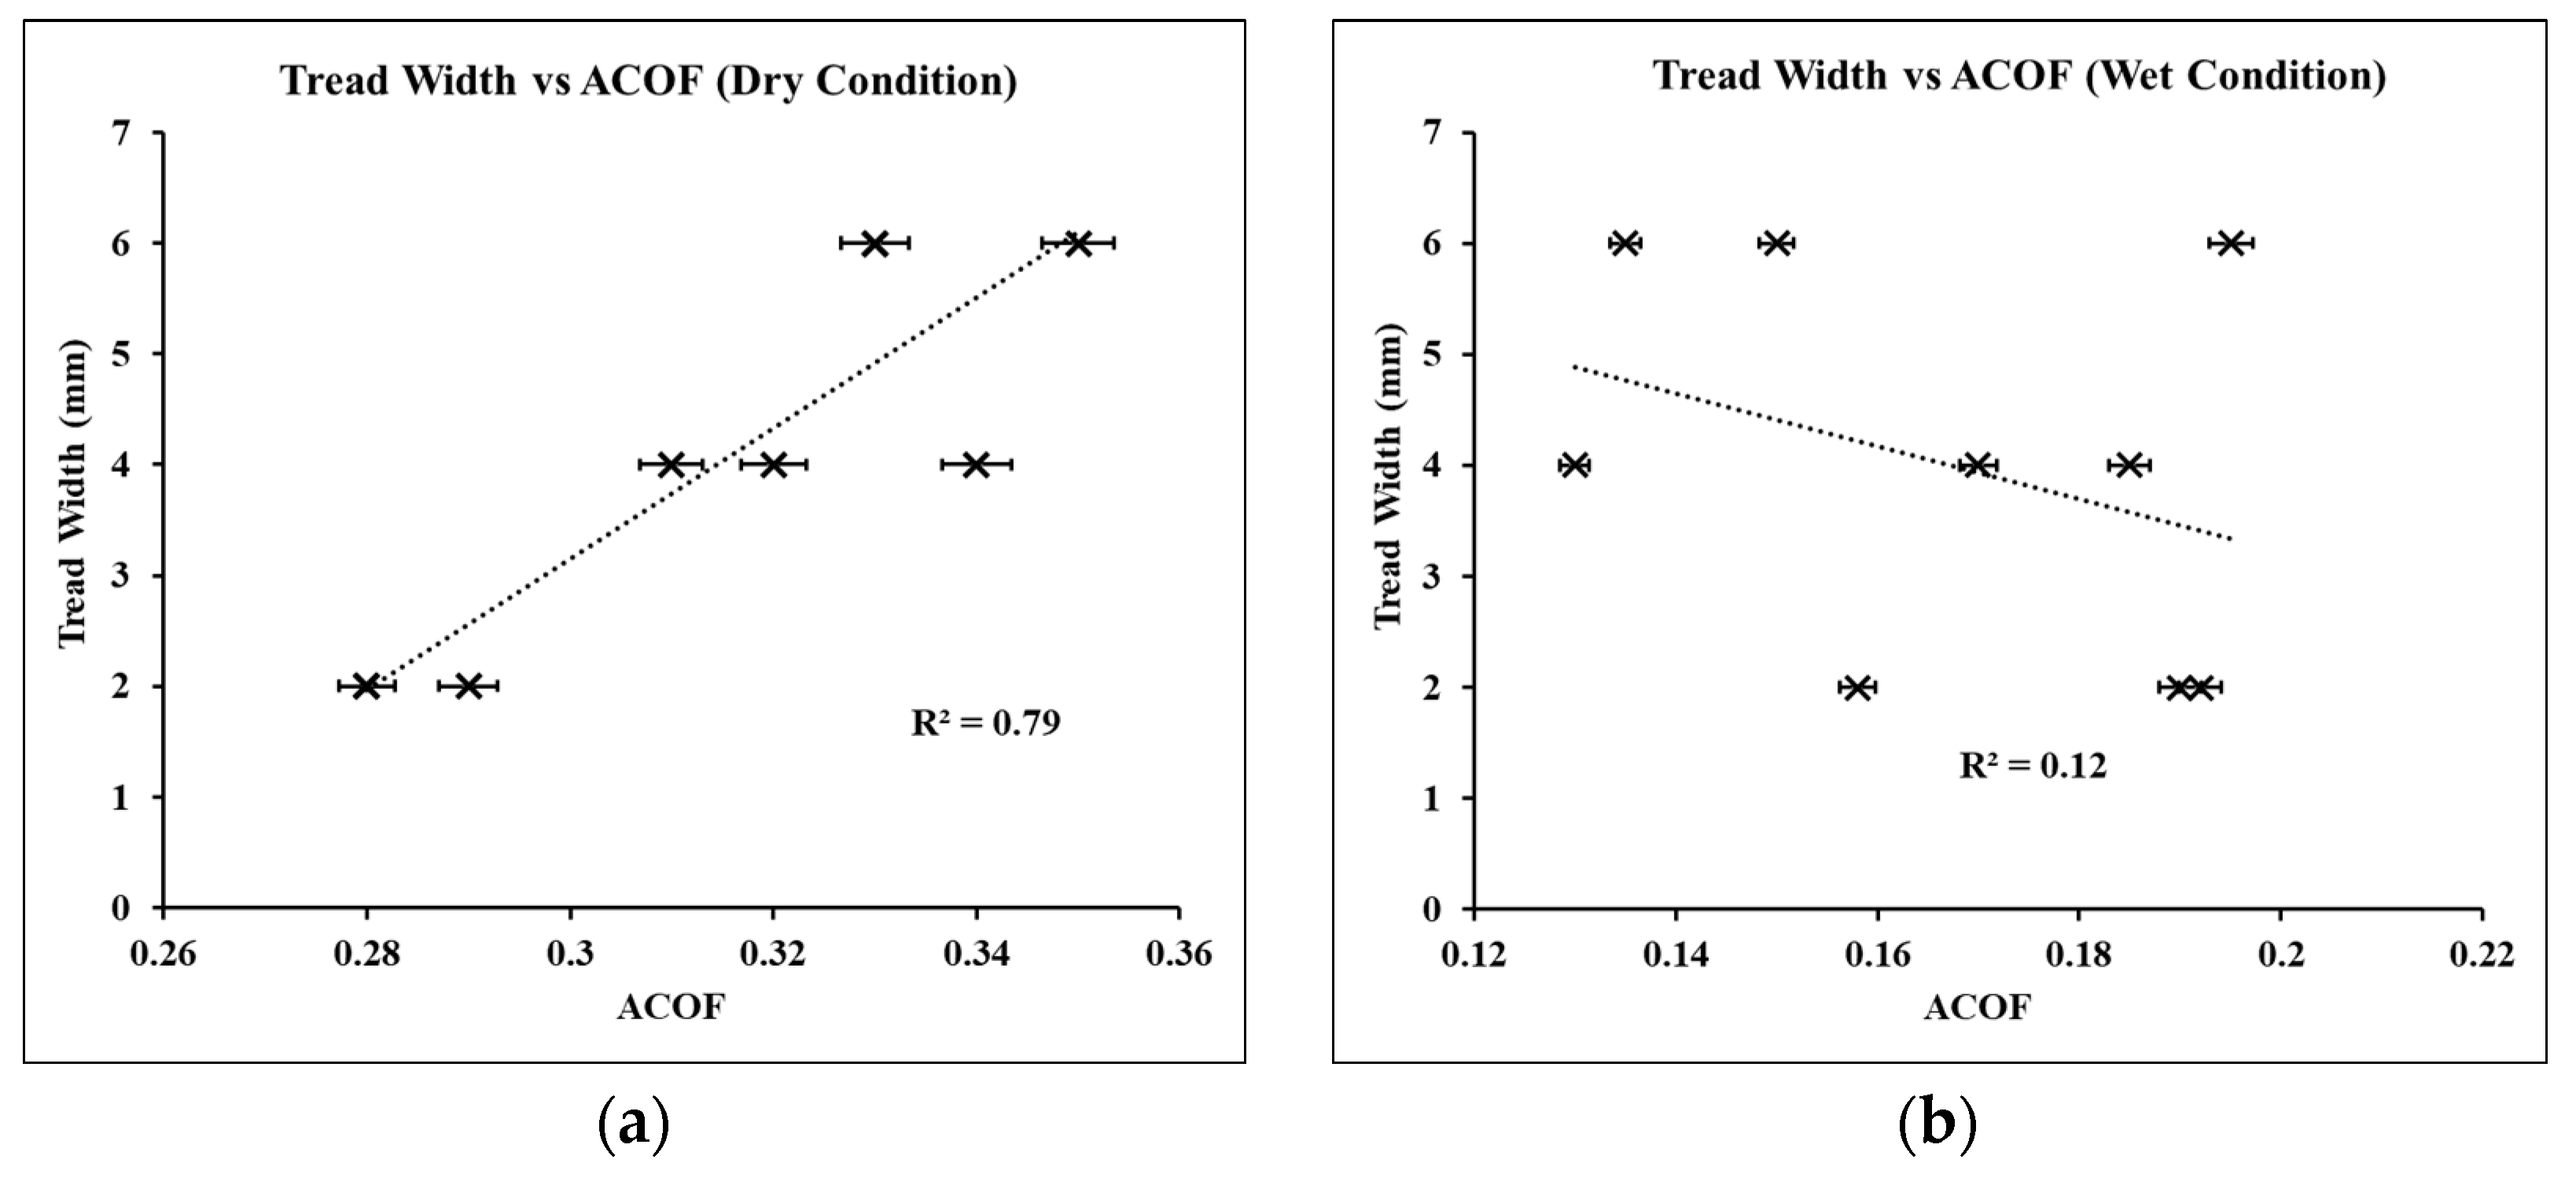
Figure 10 shows the correlations between the altering tread widths (i.e., the width = 2 mm, 4 mm, and 6 mm) and the shoe–floor traction in dry, as well as wet, slipping conditions. In dry conditions, increasing the tread width exhibited increased ACOF outcomes. The width and ACOF were observed to be strongly (R2 = 0.79) and positively correlated (Figure 10a). Specifically, outsoles O1, O2, and O3, having smaller tread widths, showed lower ACOF compared to the other outsoles. The outsoles O4, O5, and O6, having a tread width of 4 mm, exhibited moderate ACOF values. The remaining outsoles (i.e., O7, O8, and O9), having the widest treads, showed the highest ACOFs, as compared to the other outsoles. In wet slip testing, regardless of the tread width, the outsoles demonstrated both low and high ACOFs. The tread width, as an altering parameter, was not found to significantly correlate (R2 = 0.12) with the ACOF (Figure 7b).
3.3.3. Effect of Tread Area on ACOF, Fluid Pressure, and Flow Rate
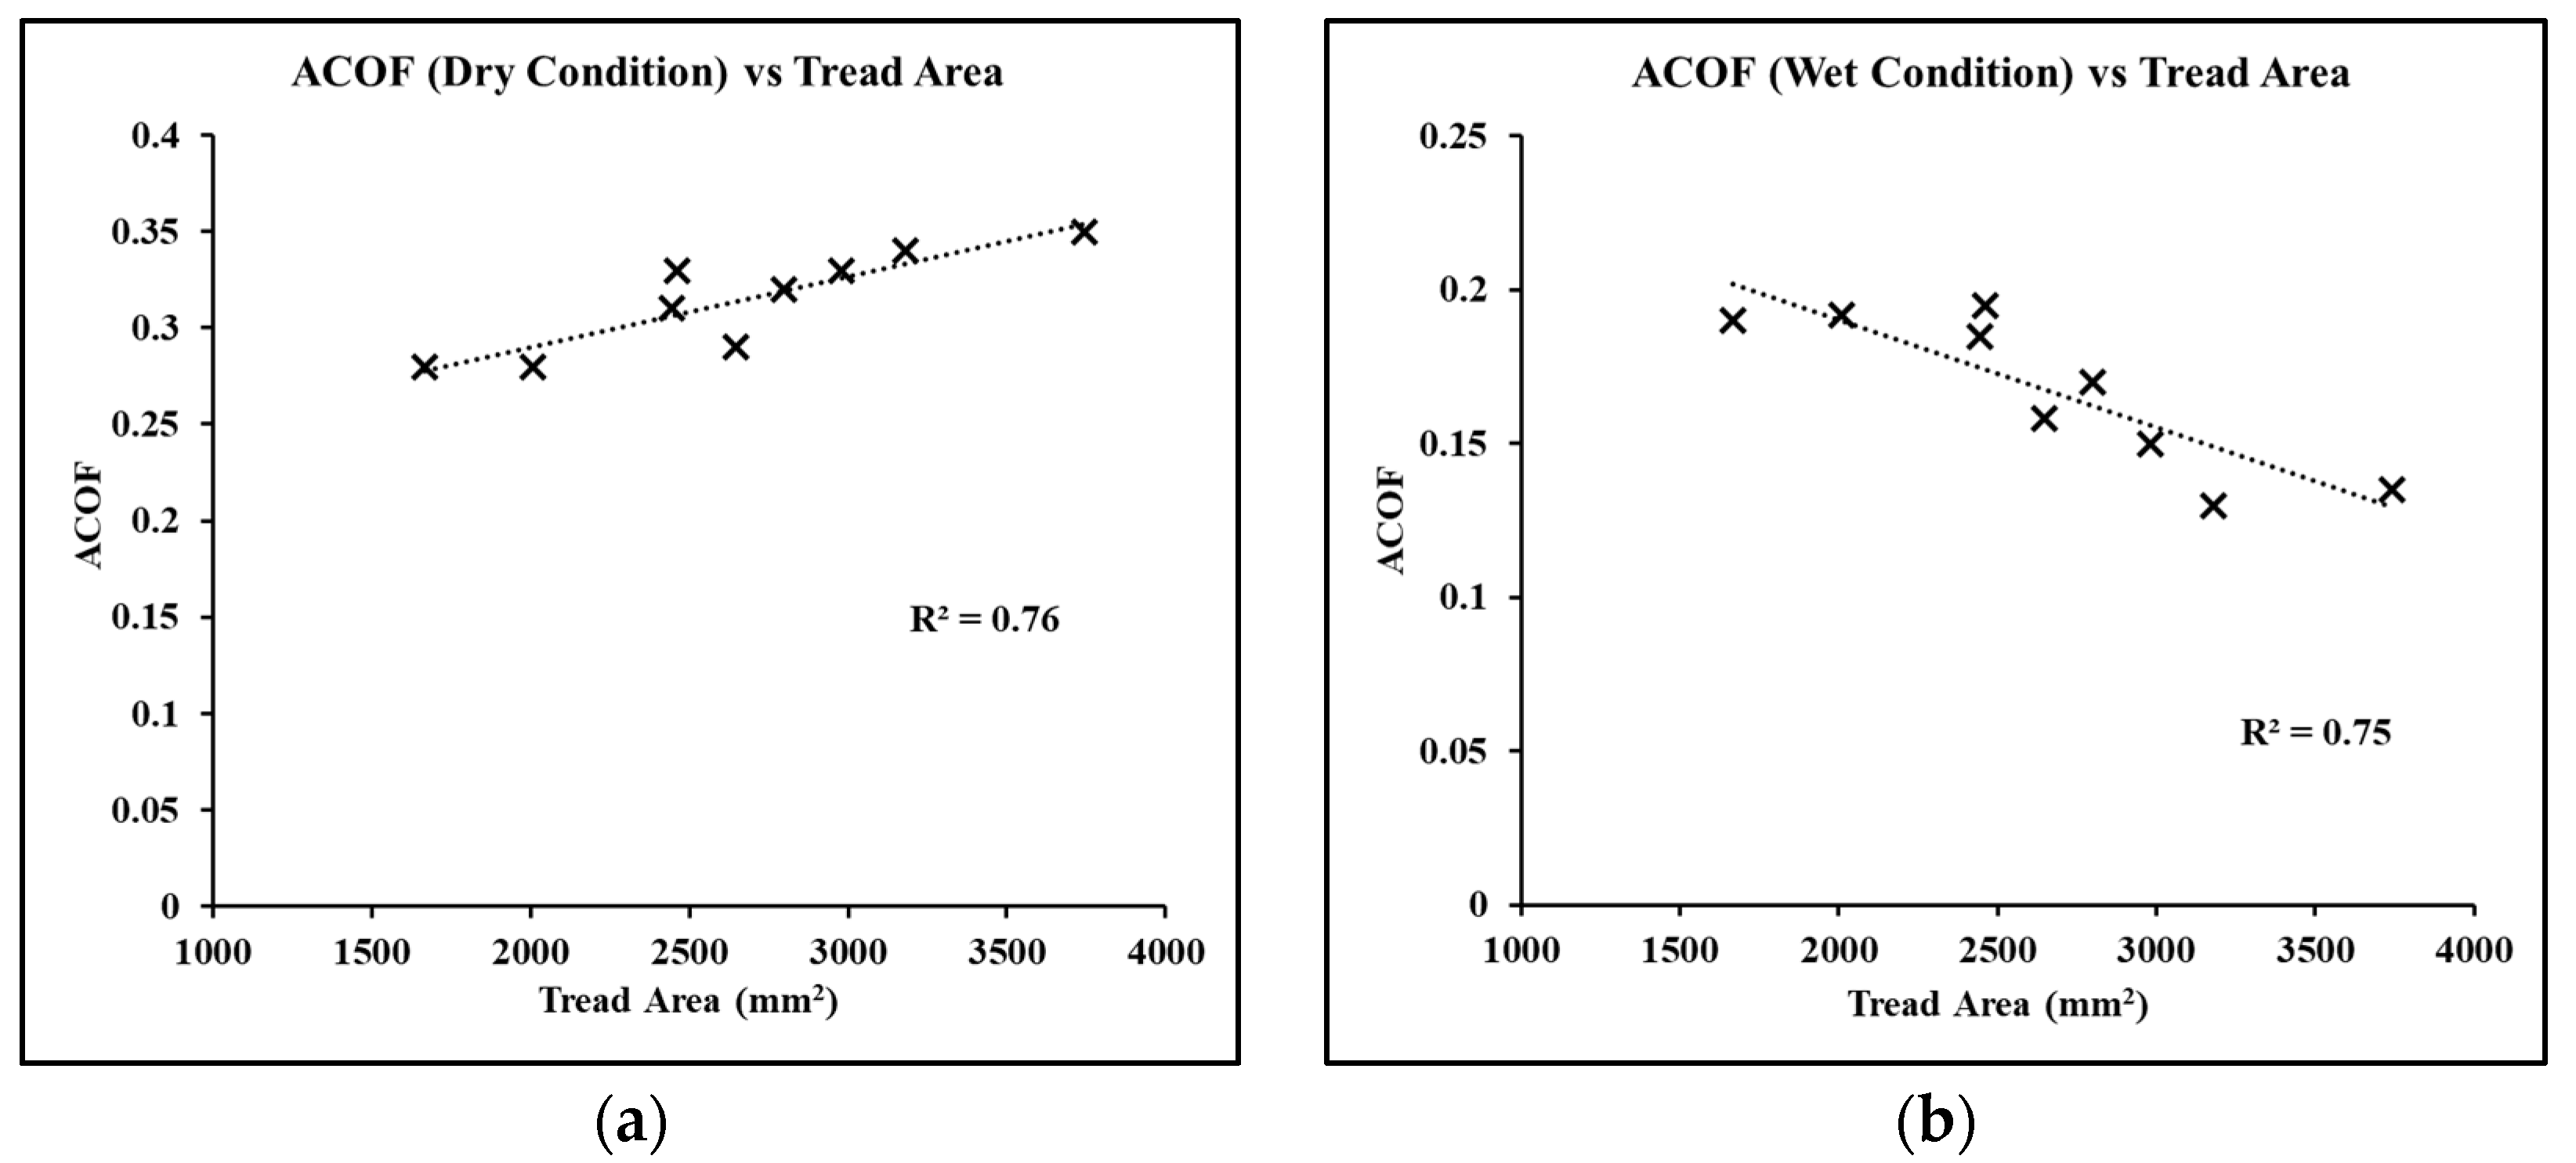
The effect of the parametrically modified outsoles on the friction was assessed by estimating the correlation between the tread area and ACOF (Figure 11). In dry slipping conditions, the ACOF and tread area were strongly (R2 = 0.76) and positively correlated with each other (Figure 11a). Outsoles having a wider width (i.e., O7, O8, O9) accounted for an increased tread area, exhibiting the highest ACOF values in dry conditions. On the contrary, the tread area was reported to be negatively and strongly correlated (R2 = 0.75) with the ACOF in wet slipping conditions (Figure 11b). Outsoles with a lesser tread area (i.e., O2, O3, O6, and O9) exhibited a higher ACOF on water-contaminated flooring as compared to the other outsoles.
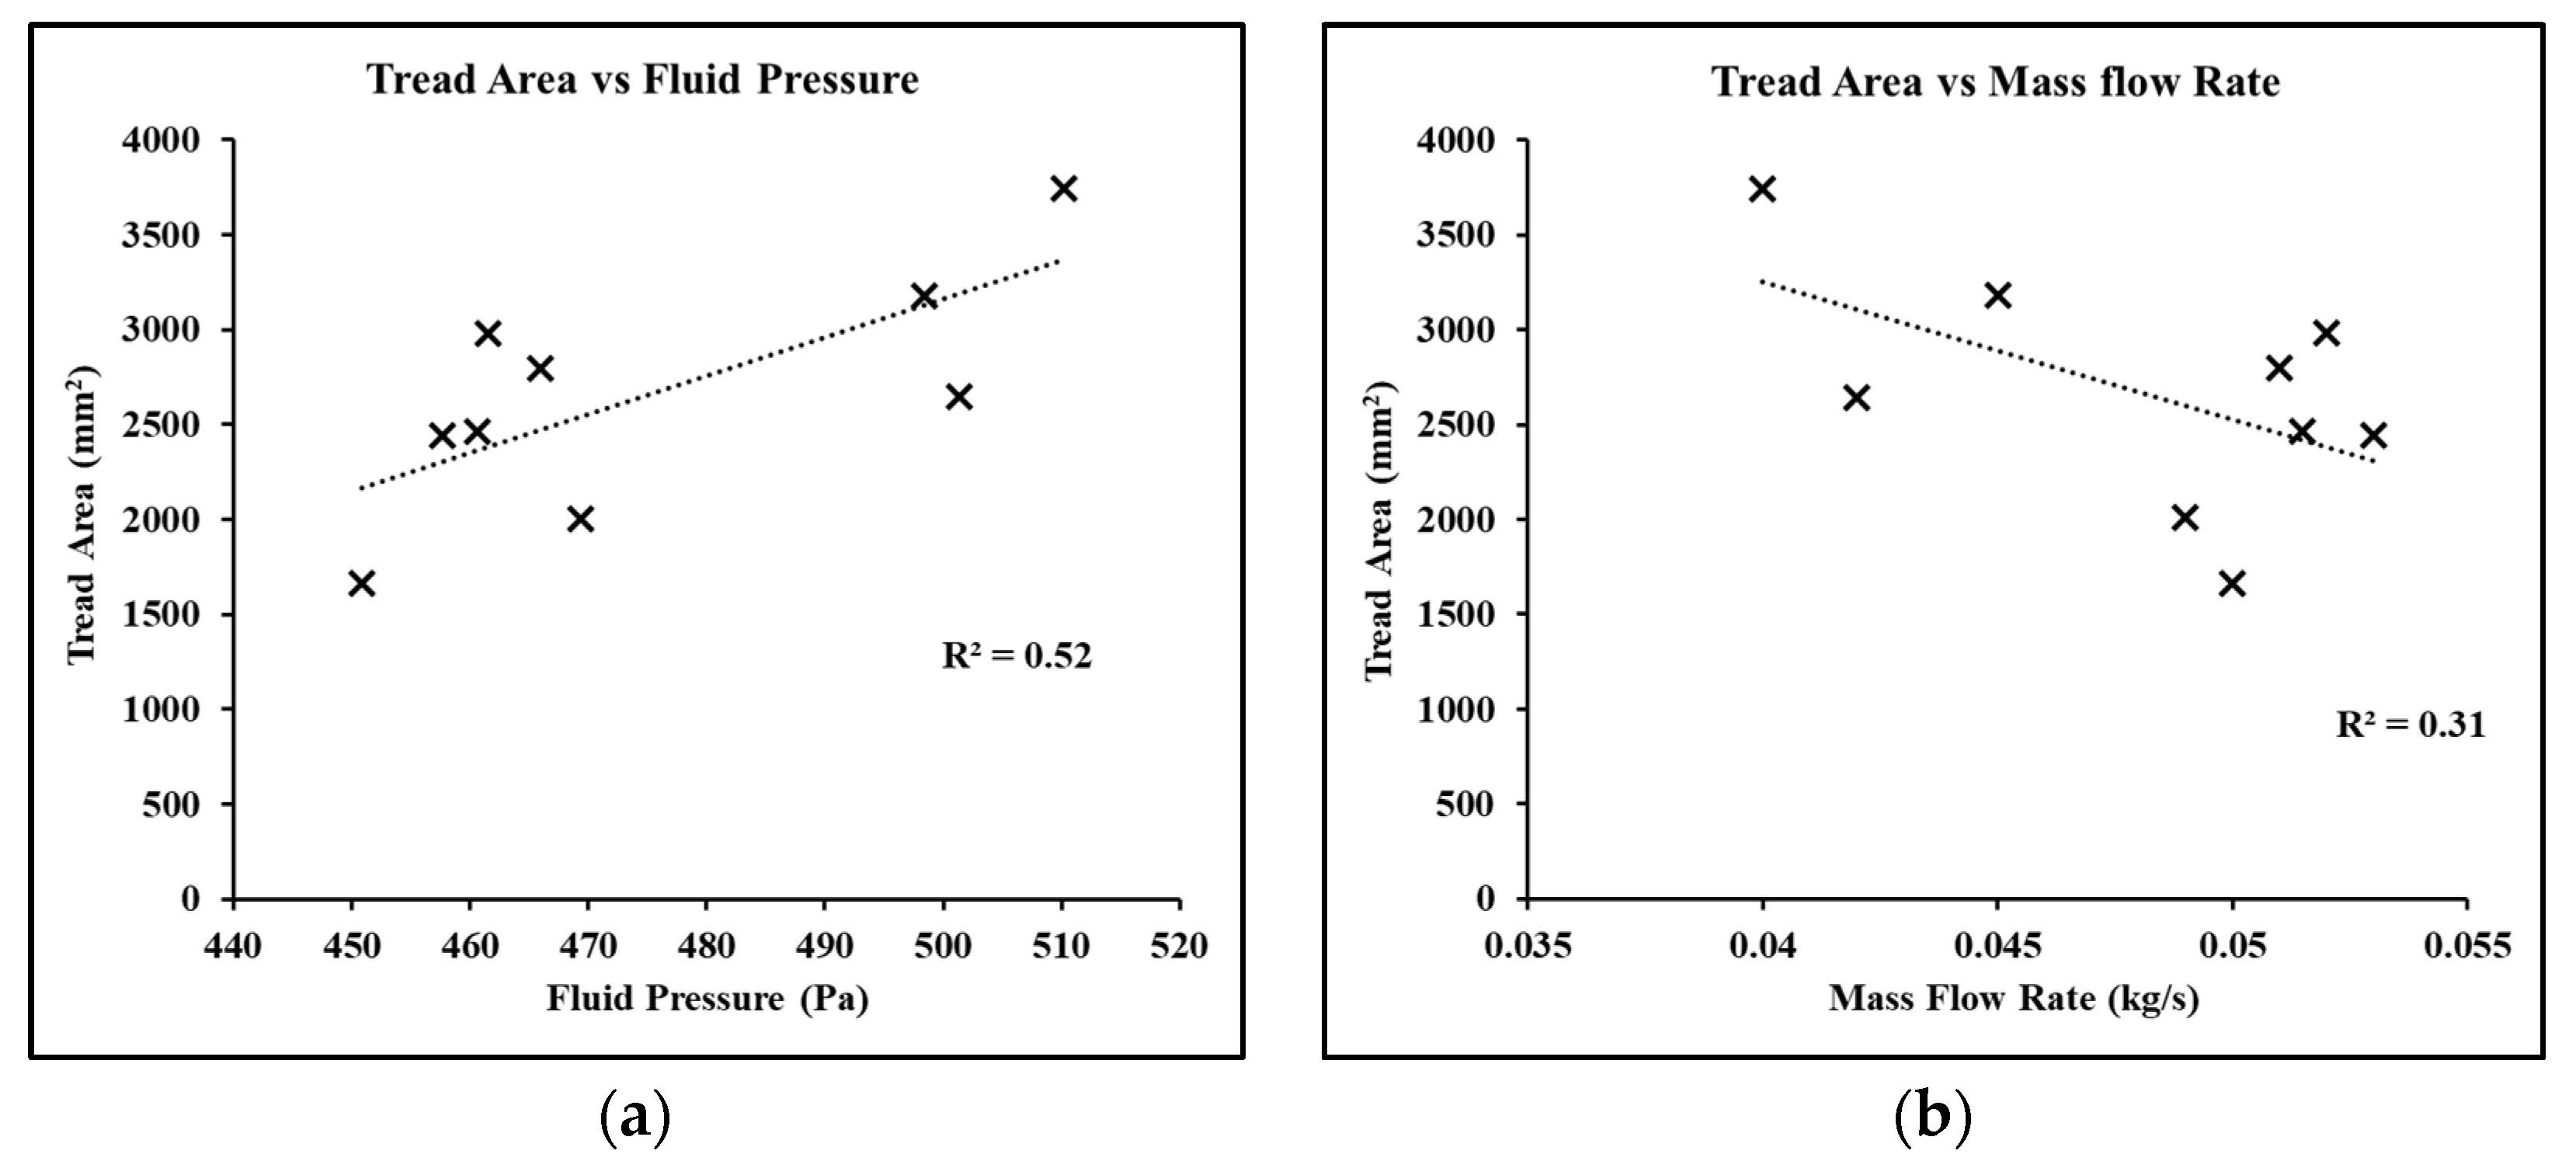
In wet slipping conditions, the effect of the tread area on the fluid pressure and mass flow rate was analyzed by estimating the correlations between them (Figure 12). The tread areas were observed to be moderately correlated (R2 = 0.52) for the fluid pressure and weakly correlated (R2 = 0.31) for the mass flow rate (Figure 12a,b).
4. Discussion
This study evaluated the effect of varying tread characteristics on the traction performance of footwear having vertical treads. Nine outsole designs were designed and fabricated based on the varying tread widths (2 mm, 4 mm, and 6 mm) and gaps (2 mm, 3 mm, and 4 mm). The modeled outsoles were tested for induced fluid pressure and the mass flow rate to assess their performance in wet slipping conditions. Furthermore, the developed outsoles were slip-tested on dry and water-contaminated flooring using a biofidelic whole-shoe slip-testing device. According to the study’s findings, the tread characteristics exhibited a significant impact on the footwear grip on both dry and wet surfaces.
In the case of dry slip testing, more than 65% of outsoles were reported to cross an ACOF threshold of 0.3, above which the slip risks were reduced drastically. Higher deviations (i.e., maximum ±0.05) in the friction values were observed in the case of dry conditions as compared to the friction outcomes in wet conditions (i.e., maximum ±0.01). This observation was in line with a previous study by Chanda et al. [16], which stated low variations across the test results and generalizable friction outcomes for footwear tested on fluid-contaminated conditions. The outsoles exhibited significant differences in the ACOF, which shows the influence of varying tread parameters of similar outsoles on footwear traction. In the case of wet slip testing, outsoles with a tread width of 2 mm and 4 mm and a tread gap of 3 mm and 4 mm showed high wet friction as compared to the 2 mm ones. On the other hand, in the case of wide-treaded outsoles (i.e., 4 mm and 6 mm), the outsole with the highest tread gap (i.e., 4 mm) showed increased friction in wet slipping conditions. In most of the slipping experiments, outsoles with a tread width of 6 mm showed reduced friction in the case of wet slipping conditions. A possible reason for this finding could be the increase in the overall tread area, which led to an increase in the developed hydrodynamic fluid films. However, the outsole with the largest gap (i.e., 4 mm) showed high friction as it could have led to ease in channeling the fluid flow throughout its treads. On studying the correlations between the tread area and ACOF in dry slip testing, the outsoles which had a large tread area generated high ACOF. This could be due to the increased contact area with respect to the flooring, which possibly led to a greater number of surface junctions coming in contact and hence, increased the ACOF. On the contrary, the tread area was found to be negatively correlated with the ACOF values in wet slipping conditions. An increased tread area could have led to an increase in the overall area of the hydrodynamic fluid film formed at the interface of the shoe and the flooring, leading to a low ACOF. These findings, such as the influence of tread gaps in dissipating the fluid through the treads, are in-line with the previous literature [33]. Selection of an optimal outsole design for both dry and wet slipping conditions may be challenging. Future work studying treads oriented at different angles could further help in the development of anti-slip outsoles in both dry and wet conditions.
The induced fluid pressure was characterized to estimate the ability of tread patterns to disperse the fluid flow over wet floorings. Specifically, a few outsoles exhibited high fluid pressure build-up zones at the entry and exit points. Outsoles that had the lowest gap (i.e., 2 mm) exhibited high fluid pressure contours over a large region across the outsole, whereas the outsoles with a 3 mm or 4 mm gap showed high localized pressure at the heel region of the outsoles. Moreover, moderate-to-high mass flow rates were observed for the outsoles that had large tread gaps, as compared to small tread gaps, which affected the amount of fluid entrapment inside the treads. Observations suggest that the effect of tread gaps on footwear traction dominates the tread area during wet slipping conditions. Additionally, the outsoles that had low gaps were observed to allow lesser fluid flow than the other outsoles. Hence, irrespective of the tread width or tread area, outsoles having larger tread gaps are anticipated to perform better on water-contaminated floorings and reduce slip risks. Although the CFD model was checked for its accuracy through convergence criterion and correlations with the physical parameters, future studies considering the development of an experimental setup to measure real-time-induced pressures could further increase the overall accuracy of the CFD model.
5. Conclusions
In conclusion, it was shown that parametric differences in vertical tread patterns significantly alter the traction performance of similar footwear outsoles in dry and water-contaminated slipping conditions. Although the friction in wet slipping conditions was lesser than the dry conditions, outsoles with a tread gap of more than 3 mm exhibited increased wet friction as compared to other outsoles. In addition to this, outsoles with wide treads and small gaps showed high dry friction. Wide-treaded outsoles are anticipated to contribute to the increase in the overall area, which could increase the dry friction. On the other hand, outsoles with large gaps could help in the reduction of fluid accumulation and could help in the increase of friction in wet slipping conditions. As the slipping dynamics are complex and multi-dimensional, the selection of an optimum outsole for enhanced traction performance in both dry and wet conditions may be challenging. Such findings on the relationship between vertical tread characteristics and traction have not been previously reported, to the best of our knowledge. The methods, including the outcomes presented in this work, are anticipated to advance the understanding of the science behind footwear friction and help footwear manufacturers optimize outsole designs to reduce the overall slip and fall risks.
Author Contributions
S.G.: Methodology; Design; Software; Validation; Investigation; Formal Analysis; Writing—Original draft; Writing—Review and Editing. S.C.: Validation; Investigation; Data Curation. A.C.: Conceptualization; Methodology; Formal Analysis; Supervision; Writing—Review and Editing. All authors have read and agreed to the published version of the manuscript.
Funding
We would like to acknowledge the funding support received from SERB-DST and IRD, IIT Delhi.
Data Availability Statement
The datasets generated during and/or analyzed during the current study are not publicly available due to a large data-set but are available from the corresponding author on reasonable request.
Conflicts of Interest
The authors declare no conflict of interest.
References
- Beschorner, K.E.; Li, Y.; Yamaguchi, T.; Ells, W.; Bowman, R. The Future of Footwear Friction. In Proceedings of the 21st Congress of the International Ergonomics Association; Springer: Cham, Switzerland, 2021; Volume 223, pp. 841–855. [Google Scholar] [CrossRef]
- US Department of Labor—Bureau of Labor Statistics. A Look at Falls, Slips and Trips in the Construction Industry; US Bureau of Labor Statistics: Washington, DC, USA, 2022. [Google Scholar]
- Florence, C.; Simon, T.; Haegerich, T.; Luo, F.; Zhou, C. Estimated Lifetime Medical and Work-Loss Costs of Fatal Injuries—United States, 2013. MMWR. Morb. Mortal. Wkly. Rep. 2015, 64, 1074–1077. [Google Scholar] [CrossRef]
- Libery Mutual. 2017 Liberty Mutual Workplace Safety Index; Libery Mutual: Boston, MA, USA, 2017. [Google Scholar]
- Bell, J.L.; Collins, J.W.; Wolf, L.; Grönqvist, R.; Chiou, S.; Chang, W.-R.; Sorock, G.S.; Courtney, T.; Lombardi, D.A.; Evanoff, B.A. Evaluation of a comprehensive slip, trip and fall prevention programme for hospital employees. Ergonomics 2008, 51, 1906–1925. [Google Scholar] [CrossRef]
- Iraqi, A.; Cham, R.; Redfern, M.S.; Beschorner, K.E. Coefficient of friction testing parameters influence the prediction of human slips. Appl. Ergon. 2018, 70, 118–126. [Google Scholar] [CrossRef]
- Hemler, S.L.; Sider, J.R.; Redfern, M.S.; Beschorner, K.E. Gait kinetics impact shoe tread wear rate. Gait Posture 2021, 86, 157–161. [Google Scholar] [CrossRef]
- Beschorner, K.E.; Redfern, M.S.; Porter, W.L.; Debski, R.E. Effects of slip testing parameters on measured coefficient of friction. Appl. Ergon. 2007, 38, 773–780. [Google Scholar] [CrossRef] [PubMed]
- Iraqi, A.; Vidic, N.S.; Redfern, M.S.; Beschorner, K.E. Prediction of coefficient of friction based on footwear outsole features. Appl. Ergon. 2019, 82, 102963. [Google Scholar] [CrossRef]
- Gupta, S.; Chatterjee, S.; Malviya, A.; Chanda, A. Frictional Assessment of Low-Cost Shoes in Worn Conditions Across Workplaces. J. Bio-Tribo-Corrosion 2023, 9, 23. [Google Scholar] [CrossRef]
- Hemler, S.L.; Pliner, E.M.; Redfern, M.S.; Haight, J.M.; Beschorner, K.E. Effects of natural shoe wear on traction performance: A longitudinal study. Footwear Sci. 2021, 14, 1–12. [Google Scholar] [CrossRef]
- Tsai, Y.-J.; Powers, C.M. The Influence of Footwear Sole Hardness on Slip Initiation in Young Adults. J. Forensic Sci. 2008, 53, 884–888. [Google Scholar] [CrossRef] [PubMed]
- Jakobsen, L.; Lysdal, F.G.; Bagehorn, T.; Kersting, U.G.; Sivebaek, I.M. The effect of footwear outsole material on slip resistance on dry and contaminated surfaces with geometrically controlled outsoles. Ergonomics 2022, 66, 322–329. [Google Scholar] [CrossRef]
- Strobel, C.M.; Menezes, P.L.; Lovell, M.R.; Beschorner, K.E. Analysis of the Contribution of Adhesion and Hysteresis to Shoe–Floor Lubricated Friction in the Boundary Lubrication Regime. Tribol. Lett. 2012, 47, 341–347. [Google Scholar] [CrossRef]
- Chang, W.-R.; Grönqvist, R.; Leclercq, S.; Myung, R.; Makkonen, L.; Strandberg, L.; Brungraber, R.J.; Mattke, U.; Thorpe, S.C. The role of friction in the measurement of slipperiness, Part 1: Friction mechanisms and definition of test conditions. Ergonomics 2001, 44, 1217–1232. [Google Scholar] [CrossRef] [PubMed]
- Chanda, A.; Jones, T.G.; Beschorner, K.E. Generalizability of Footwear Traction Performance across Flooring and Contaminant Conditions. IISE Trans. Occup. Ergon. Hum. Factors 2018, 6, 98–108. [Google Scholar] [CrossRef]
- Li, K.W.; Chen, C.J. The effect of shoe soling tread groove width on the coefficient of friction with different sole materials, floors, and contaminants. Appl. Ergon. 2004, 35, 499–507. [Google Scholar] [CrossRef]
- Gupta, S.; Chatterjee, S.; Chanda, A. Effect of footwear material wear on slips and falls. Mater. Today Proc. 2022, 62, 3508–3515. [Google Scholar] [CrossRef]
- Yamaguchi, T.; Katsurashima, Y.; Hokkirigawa, K. Effect of rubber block height and orientation on the coefficients of friction against smooth steel surface lubricated with glycerol solution. Tribol. Int. 2017, 110, 96–102. [Google Scholar] [CrossRef]
- Hemler, S.L.; Charbonneau, D.N.; Iraqi, A.; Redfern, M.S.; Haight, J.M.; Moyer, B.E.; Beschorner, K.E. Changes in under-shoe traction and fluid drainage for progressively worn shoe tread. Appl. Ergon. 2019, 80, 35–42. [Google Scholar] [CrossRef]
- Hemler, S.L.; Charbonneau, D.N.; Beschorner, K.E. Predicting hydrodynamic conditions under worn shoes using the tapered-wedge solution of Reynolds equation. Tribol. Int. 2020, 145, 106161. [Google Scholar] [CrossRef]
- Meehan, E.E.; Vidic, N.; Beschorner, K.E. In contrast to slip-resistant shoes, fluid drainage capacity explains friction performance across shoes that are not slip-resistant. Appl. Ergon. 2021, 100, 103663. [Google Scholar] [CrossRef]
- Beschorner, K.E.; Albert, D.L.; Chambers, A.J.; Redfern, M.S. Fluid pressures at the shoe–floor–contaminant interface during slips: Effects of tread & implications on slip severity. J. Biomech. 2014, 47, 458–463. [Google Scholar] [CrossRef] [Green Version]
- Li, K.W.; Wu, H.H.; Lin, Y.-C. The effect of shoe sole tread groove depth on the friction coefficient with different tread groove widths, floors and contaminants. Appl. Ergon. 2006, 37, 743–748. [Google Scholar] [CrossRef] [PubMed]
- Albert, D.; Moyer, B.; Beschorner, K.E. Three-Dimensional Shoe Kinematics During Unexpected Slips: Implications for Shoe–Floor Friction Testing. IISE Trans. Occup. Ergon. Hum. Factors 2016, 5, 1–11. [Google Scholar] [CrossRef]
- Moghaddam, S.R.M.; Hemler, S.L.; Redfern, M.S.; Jacobs, T.D.; Beschorner, K.E. Computational model of shoe wear progression: Comparison with experimental results. Wear 2019, 422–423, 235–241. [Google Scholar] [CrossRef]
- Jones, T.; Iraqi, A.; Beschorner, K. Performance testing of work shoes labeled as slip resistant. Appl. Ergon. 2018, 68, 304–312. [Google Scholar] [CrossRef]
- Beschorner, K.E.; Iraqi, A.; Redfern, M.S.; Cham, R.; Li, Y. Predicting slips based on the STM 603 whole-footwear tribometer under different coefficient of friction testing conditions. Ergonomics 2019, 62, 668–681. [Google Scholar] [CrossRef]
- Rodrigues, P.V.; Ramoa, B.; Machado, A.V.; Cardiff, P.; Nóbrega, J.M. Assessing the Compressive and Impact Behavior of Plastic Safety Toe Caps through Computational Modelling. Polymers 2021, 13, 4332. [Google Scholar] [CrossRef]
- Gupta, S.; Chatterjee, S.; Malviya, A.; Singh, G.; Chanda, A. A Novel Computational Model for Traction Performance Characterization of Footwear Outsoles with Horizontal Tread Channels. Computation 2023, 11, 23. [Google Scholar] [CrossRef]
- Gupta, S.; Malviya, A.; Chatterjee, S.; Chanda, A. Development of a Portable Device for Surface Traction Characterization at the Shoe–Floor Interface. Surfaces 2022, 5, 504–520. [Google Scholar] [CrossRef]
- ASTM F2913-19; Standard Test Method for Measuring the Coefficient of Friction for Evaluation of Slip Performance of Footwear and Test Surfaces/Flooring Using a Whole Shoe Tester. ASTM International: West Conshohocken, PA, USA, 2019.
- Singh, G.; Beschorner, K.E. A Method for Measuring Fluid Pressures in the Shoe–Floor–Fluid Interface: Application to Shoe Tread Evaluation. IIE Trans. Occup. Ergon. Hum. Factors 2014, 2, 53–59. [Google Scholar] [CrossRef]
Figure 1.
Dimensions of the original footwear’s tread design.

Figure 2.
The fabricated outsoles with parametrically modified tread widths and gaps.


Figure 3.
Consolidated computational framework implemented in this study.

Figure 4.
Whole-shoe biofidelic and portable slip tester used for experiments.

Figure 5.
Frictional performance of the outsoles tested using the mechanical slip tester across dry and wet slipping conditions.
Figure 5.
Frictional performance of the outsoles tested using the mechanical slip tester across dry and wet slipping conditions.

Figure 6.
Induced interfacial fluid pressures over the outsoles in the presence of water as a contaminant.
Figure 6.
Induced interfacial fluid pressures over the outsoles in the presence of water as a contaminant.


Figure 7.
Mass flow rates across the outsole treads due to wet slipping simulations.


Figure 8.
Effect of tread gap on ACOF: (a) in dry conditions and (b) in wet conditions.

Figure 9.
Effect of tread gap on: (a) induced fluid pressure and (b) mass flow rate.

Figure 10.
Effect of tread width on ACOF in: (a) dry conditions and (b) wet conditions.

Figure 11.
Effect of tread area on ACOF in: (a) dry conditions and (b) wet conditions.

Figure 12.
Effect of tread area on: (a) induced fluid pressure and (b) mass flow rate.


Table 1.
Parametrical modifications in the outsole’s design.
| Outsole Nomenclature | Width (mm) | Gap (mm) |
|---|---|---|
| O1 | 2 | 2 |
| O2 | 2 | 3 |
| O3 | 2 | 4 |
| O4 | 4 | 2 |
| O5 | 4 | 3 |
| O6 | 4 | 4 |
| O7 | 6 | 2 |
| O8 | 6 | 3 |
| O9 | 6 | 4 |
Table 2.
Computational parameters implemented for the slipping simulation.
| Parameter | Description |
|---|---|
| Mesh Details | |
| Element order | 10-node SOLID 187 tetrahedral |
| Orthogonal quality | More than 0.85 |
| Pinch tolerance | 1.8 × 10⁻² mm |
| Fluent Details | |
| Model | Incompressible, turbulent- k-epsilon (RNG) |
| Inlet boundary condition | Fluid velocity = 0.5 m/s |
| Outlet boundary condition | Atmospheric |
| Wall roughness | 28.4 µm |
Disclaimer/Publisher’s Note: The statements, opinions and data contained in all publications are solely those of the individual author(s) and contributor(s) and not of MDPI and/or the editor(s). MDPI and/or the editor(s) disclaim responsibility for any injury to people or property resulting from any ideas, methods, instructions or products referred to in the content. |
© 2023 by the authors. Licensee MDPI, Basel, Switzerland. This article is an open access article distributed under the terms and conditions of the Creative Commons Attribution (CC BY) license (https://creativecommons.org/licenses/by/4.0/).
Share and Cite
MDPI and ACS Style
Gupta, S.; Chatterjee, S.; Chanda, A. Influence of Vertically Treaded Outsoles on Interfacial Fluid Pressure, Mass Flow Rate, and Shoe–Floor Traction during Slips. Fluids 2023, 8, 82. https://doi.org/10.3390/fluids8030082
AMA Style
Gupta S, Chatterjee S, Chanda A. Influence of Vertically Treaded Outsoles on Interfacial Fluid Pressure, Mass Flow Rate, and Shoe–Floor Traction during Slips. Fluids. 2023; 8(3):82. https://doi.org/10.3390/fluids8030082
Chicago/Turabian StyleGupta, Shubham, Subhodip Chatterjee, and Arnab Chanda. 2023. "Influence of Vertically Treaded Outsoles on Interfacial Fluid Pressure, Mass Flow Rate, and Shoe–Floor Traction during Slips" Fluids 8, no. 3: 82. https://doi.org/10.3390/fluids8030082