Interpreting the Spatial-Temporal Structure of Turbulent Chemical Plumes Utilized in Odor Tracking by Lobsters

1
Department of Environmental Sciences, University of Virginia, Charlottesville, VA 22904, USA
2
Department of Environmental Science and Policy Management, University of California, Berkeley, CA 94720, USA
*
Author to whom correspondence should be addressed.
Fluids 2020, 5(2), 82; https://doi.org/10.3390/fluids5020082
Submission received: 6 April 2020
/
Revised: 14 May 2020
/
Accepted: 20 May 2020
/
Published: 24 May 2020
(This article belongs to the Special Issue Advances in Biological Flows and Biomimetics)
Abstract
:Olfactory systems in animals play a major role in finding food and mates, avoiding predators, and communication. Chemical tracking in odorant plumes has typically been considered a spatial information problem where individuals navigate towards higher concentration. Recent research involving chemosensory neurons in the spiny lobster, Panulirus argus, show they possess rhythmically active or ‘bursting’ olfactory receptor neurons that respond to the intermittency in the odor signal. This suggests a possible, previously unexplored olfactory search strategy that enables lobsters to utilize the temporal variability within a turbulent plume to track the source. This study utilized computational fluid dynamics to simulate the turbulent dispersal of odorants and assess a number of search strategies thought to aid lobsters. These strategies include quantification of concentration magnitude using chemosensory antennules and leg chemosensors, simultaneous sampling of water velocities using antennule mechanosensors, and utilization of antennules to quantify intermittency of the odorant plume. Results show that lobsters can utilize intermittency in the odorant signal to track an odorant plume faster and with greater success in finding the source than utilizing concentration alone. However, the additional use of lobster leg chemosensors reduced search time compared to both antennule intermittency and concentration strategies alone by providing spatially separated odorant sensors along the body.
1. Introduction
Smell and search are key components of animal behaviors including migration, mate detection, predator avoidance, and food acquisition [1,2,3,4]. Although olfaction is a primary sensory modality for many organisms, how information is perceived from the environment, the importance of different sensory information, and how organisms integrate this information from different modalities is still an active area of research [5,6,7]. Understanding olfaction has additional applied utility, as animal strategies in tracking odor can be adapted into human engineering of autonomous underwater search vehicles [8]. However, our engineering knowledge is still insufficient to develop sensors and algorithms that enable man-made systems to predict, navigate and utilize turbulent odorant plumes to locate sources of chemical release at the speed and accuracy of many organisms. The majority of olfactory search models are adapted to well mixed and diffusive regimes or lack turbulence in their transport equation, and therefore do not accurately represent the intermittent nature of chemical plumes [9,10]. In ocean boundary layers, turbulence is intrinsic to the intermittent odor dispersion in fluids, generating complex distributions of odorants with high concentration filaments often adjacent to no or little odor [11,12]. Therefore, quantification of three-dimensional flow environments and the transport of chemicals at fine temporal and spatial scales relevant to an animal’s sensory system is required [13,14]. Quantitatively understanding chemical signal movement and how animals filter information to track odorants are challenges to studying chemosensory guided search [15]. These challenges are related because an adequate assessment of the variables used by organisms to conduct search and the strategies they utilize first requires an understanding of the species’ environment.
Chemotaxis and odor-gated rheotaxis are frequently studied search strategies that occur in nature. Chemotaxis prescribes that an organism directly follows an increasing chemical concentration gradient [16]. Odor-gated rheotaxis combines cues from the odorant environment with information from the flow direction to inform movement [15]. If an organism detects odor from chemosensors, it will move in the upstream direction as informed by mechanosensors. Vergassola et al. [17] introduced the concept of infotaxis, a strategy that incorporates multiple search variables that is based on the fastest acquisition of information to reduce uncertainty. A search variable that is composed of both spatial and temporal information, in addition to magnitude, will therefore be effective in infotaxis. Intermittency, defined here as the time since last odorant encounter above a given minimum threshold, achieves this. Organisms following infotaxis discern significant differences in their environment quickly to be successful. This promotes random walking in the absence of odor detection to reacquire an odor plume, as this increases the spatial information available. Intermittency’s temporal component benefits infotaxis because organisms can quickly move towards areas that contain a high frequency of odor encounter. Intermittency does not require coding of odorant concentration, which is unpredictable in turbulent plumes. It reduces the encoding to a binary presence/absence form and often is a more reliable predictor of plume structure than concentration information [16,18,19,20]. Changes in odor intermittency, primarily influenced by hydrodynamics and bed topography, have been found to influence the success and behavior of search in invertebrates [21,22,23]. Organisms using intermittency also locate odor sources without relying heavily on proximity to the odor centerline, which is crucial in turbulent environments where flow changes suddenly. This behavior is apparent in some crustaceans, including lobsters, which can be used as a model for olfactory search in aquatic organisms.
Lobster Olfactory Search
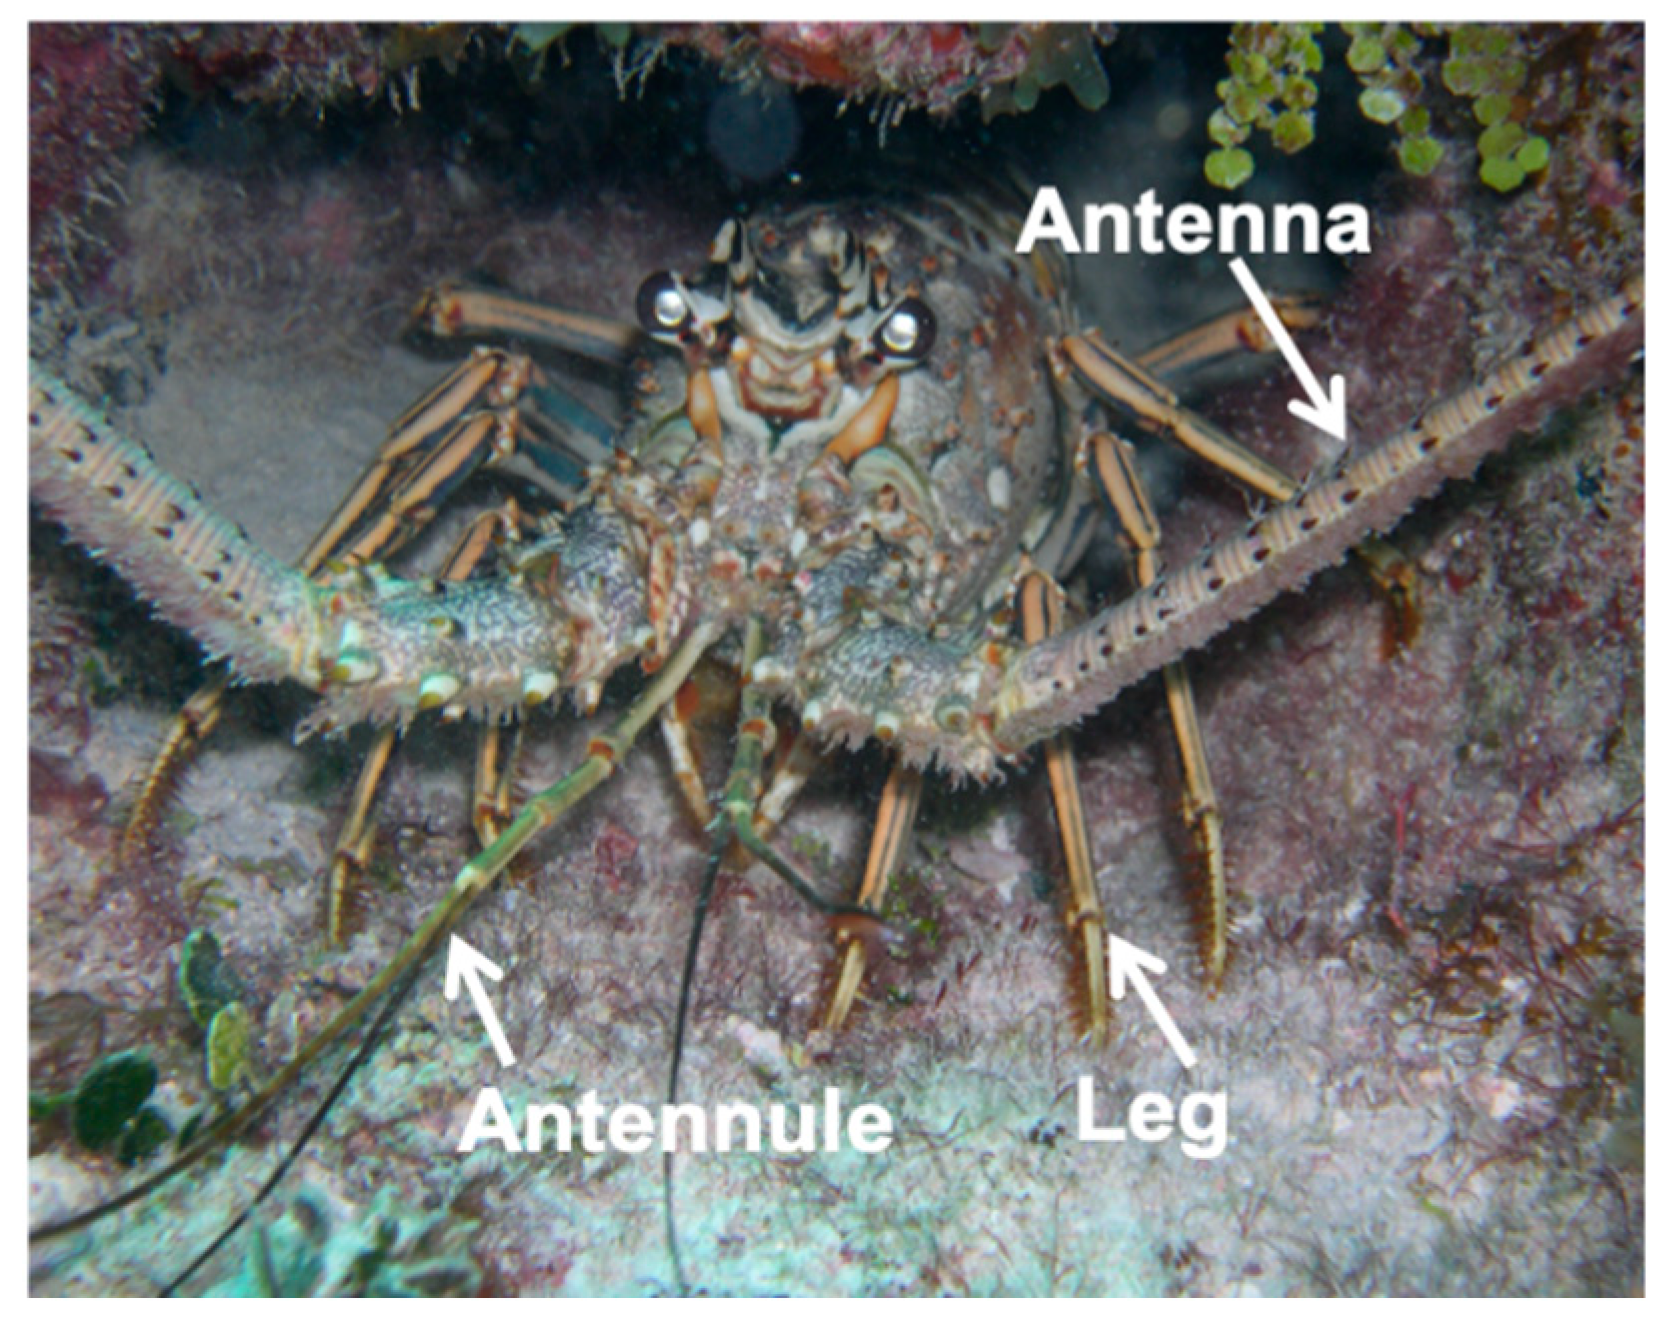
Lobsters utilize a multitude of sensors to inform search, primarily sensory hairs, called sensilla (Figure 1). Sensilla possess chemosensors, mechanosensors, or bimodal receptors that contain both receptors [24,25]. Sensilla are located over the lobster’s entire body, although they are highly concentrated on antennules and the distal tips of legs. Chemosensors and mechanosensors on the lobster’s antennules are primarily used for the quantification of odorants and flows [26,27]. Leg receptor cells are similar to those in antennules and assist in both orientation and source location, especially at close distances where lobsters rake their legs along the bottom [28].
Lobsters contain olfactory antennules that have two branches, called flagella. The lateral flagellum of an antennule contains chemosensory hairs called aesthetascs [29]. These aesthetascs are aligned in rows along the antennule and contain chemosensory neurons that project to the olfactory lobe of the brain [27,30,31]. Both the lateral and medial flagella also contain other sensilla bearing chemosensory neurons that are used in olfaction [27,30,32]. Lobsters flick their antennules down rapidly to force odorant-laden water between aestethasc hairs, and rise slowly to lower the Reynolds number of the flow to trap the odorant-laden water. This enables a more rapid diffusive transport of odorants to aethetasc surfaces [33,34]. The majority of olfactory receptor neurons (ORNs) respond to odorant concentrations with changes in discharge intensity, while some are intrinsically or conditionally rhythmically active ORNs [35,36,37,38,39,40,41] and are referred to as “bursting” ORNs (bORNs). bORNs have been well characterized in the Panulirus argus lobster olfactory organ, where they have been shown to generate intrinsic bursts in response to brief odor stimuli in a phase-dependent manner that could serve as a neural mechanism for the estimation of interval timing [42]. In support of this hypothesis, a computational neural model [10,43] quantitatively showed that a population of bORNs is capable of quantifying the time since the last encounter with an odor plume (i.e., intermittency).
Previous research in olfactory search in lobsters and other aquatic organisms suggests that the speed at which animals navigate within a plume requires that multiple instantaneous sensory feedbacks be utilized. This is to be expected since numerous studies have found that time-averaged concentrations converge too slowly to be useful alone to a foraging animal (reviewed in [16]). Grasso et al. [18] tested the then plausible theory that crustaceans moved by chemotaxis (i.e., moving up a concentration gradient) alone by determining whether lobsters moved in the direction of the antennule sensing higher concentration. Surprisingly, the difference between concentrations of the left and right antennules explained only 7% of turning decisions at distances farther than 30 cm from the odor source. A possible reason for this low predictability is that crustaceans possess chemosensors on almost the entirety of their bodies and antennules may be over emphasized in importance compared to other sensory locations such as legs [24]. Leg chemosensors have been studied as a tool in search but with uncertain results. Leg chemosensors are highly useful to blue crabs undergoing search [19,20], however they have not been studied extensively across a variety of organisms. Leg chemosensors are exposed to more uniform odorant concentrations in an odor plume due to well mixed conditions near the bed and may be insufficient if used by themselves in search [44]. The loss of chemosensing in leg neurons does not appear to significantly impact search when antennules function properly [28]. However, Devine and Atema [28] found the loss of both the lateral flagellum of the antennule and leg sensilla caused a 177% increase in search path length to locate an odor source compared to a 71% increase if only the lateral flagellum of the antennule was removed. Their study promotes that leg chemosensors play an important secondary role in search. In addition to odorants, the quantification of direction and magnitude of the flow has been shown to provide information that may be useful to a lobster navigating in a plume. Pravin and Reidenbach [25] studied transverse flux in odorant concentration as a search variable, defined as the intermittency in concentration (c’) multiplied by the transverse velocity (v’). Two antennules in their model differentiated the average value of c’v’ faster than concentration alone, so their results suggest hydrodynamic information could improve crustacean decision making.
This research quantifies turbulent flow and the dispersal of an odorant plume at the scale of a lobster that is actively foraging, (e.g., at the temporal scale of tens of seconds and at the spatial scale of meters) with a resolution relevant to their olfactory organs (i.e., millimeters). Computational fluid dynamics (CFD) is utilized to recreate a realistic odorant plume and is validated utilizing a plume generated within a laboratory flume. This research addresses how the spatial and temporal information of odorants and flows within a plume can be utilized by a lobster to aid olfactory search under multiple plausible search strategies. Specifically, we test various search algorithms based on quantifying intermittency of the odorants within a plume, using leg chemosensing, and using combined odor and flow sensing to determine how these search behaviors may improve navigation. CFD provides a method to quantify three-dimensional flow environments and the transport of chemicals at fine temporal and spatial scales over a large search area, which is necessary to test various search strategies and challenging to acquire otherwise [13,14].
2. Materials and Methods
2.1. Computational Fluid Dynamics Simulation
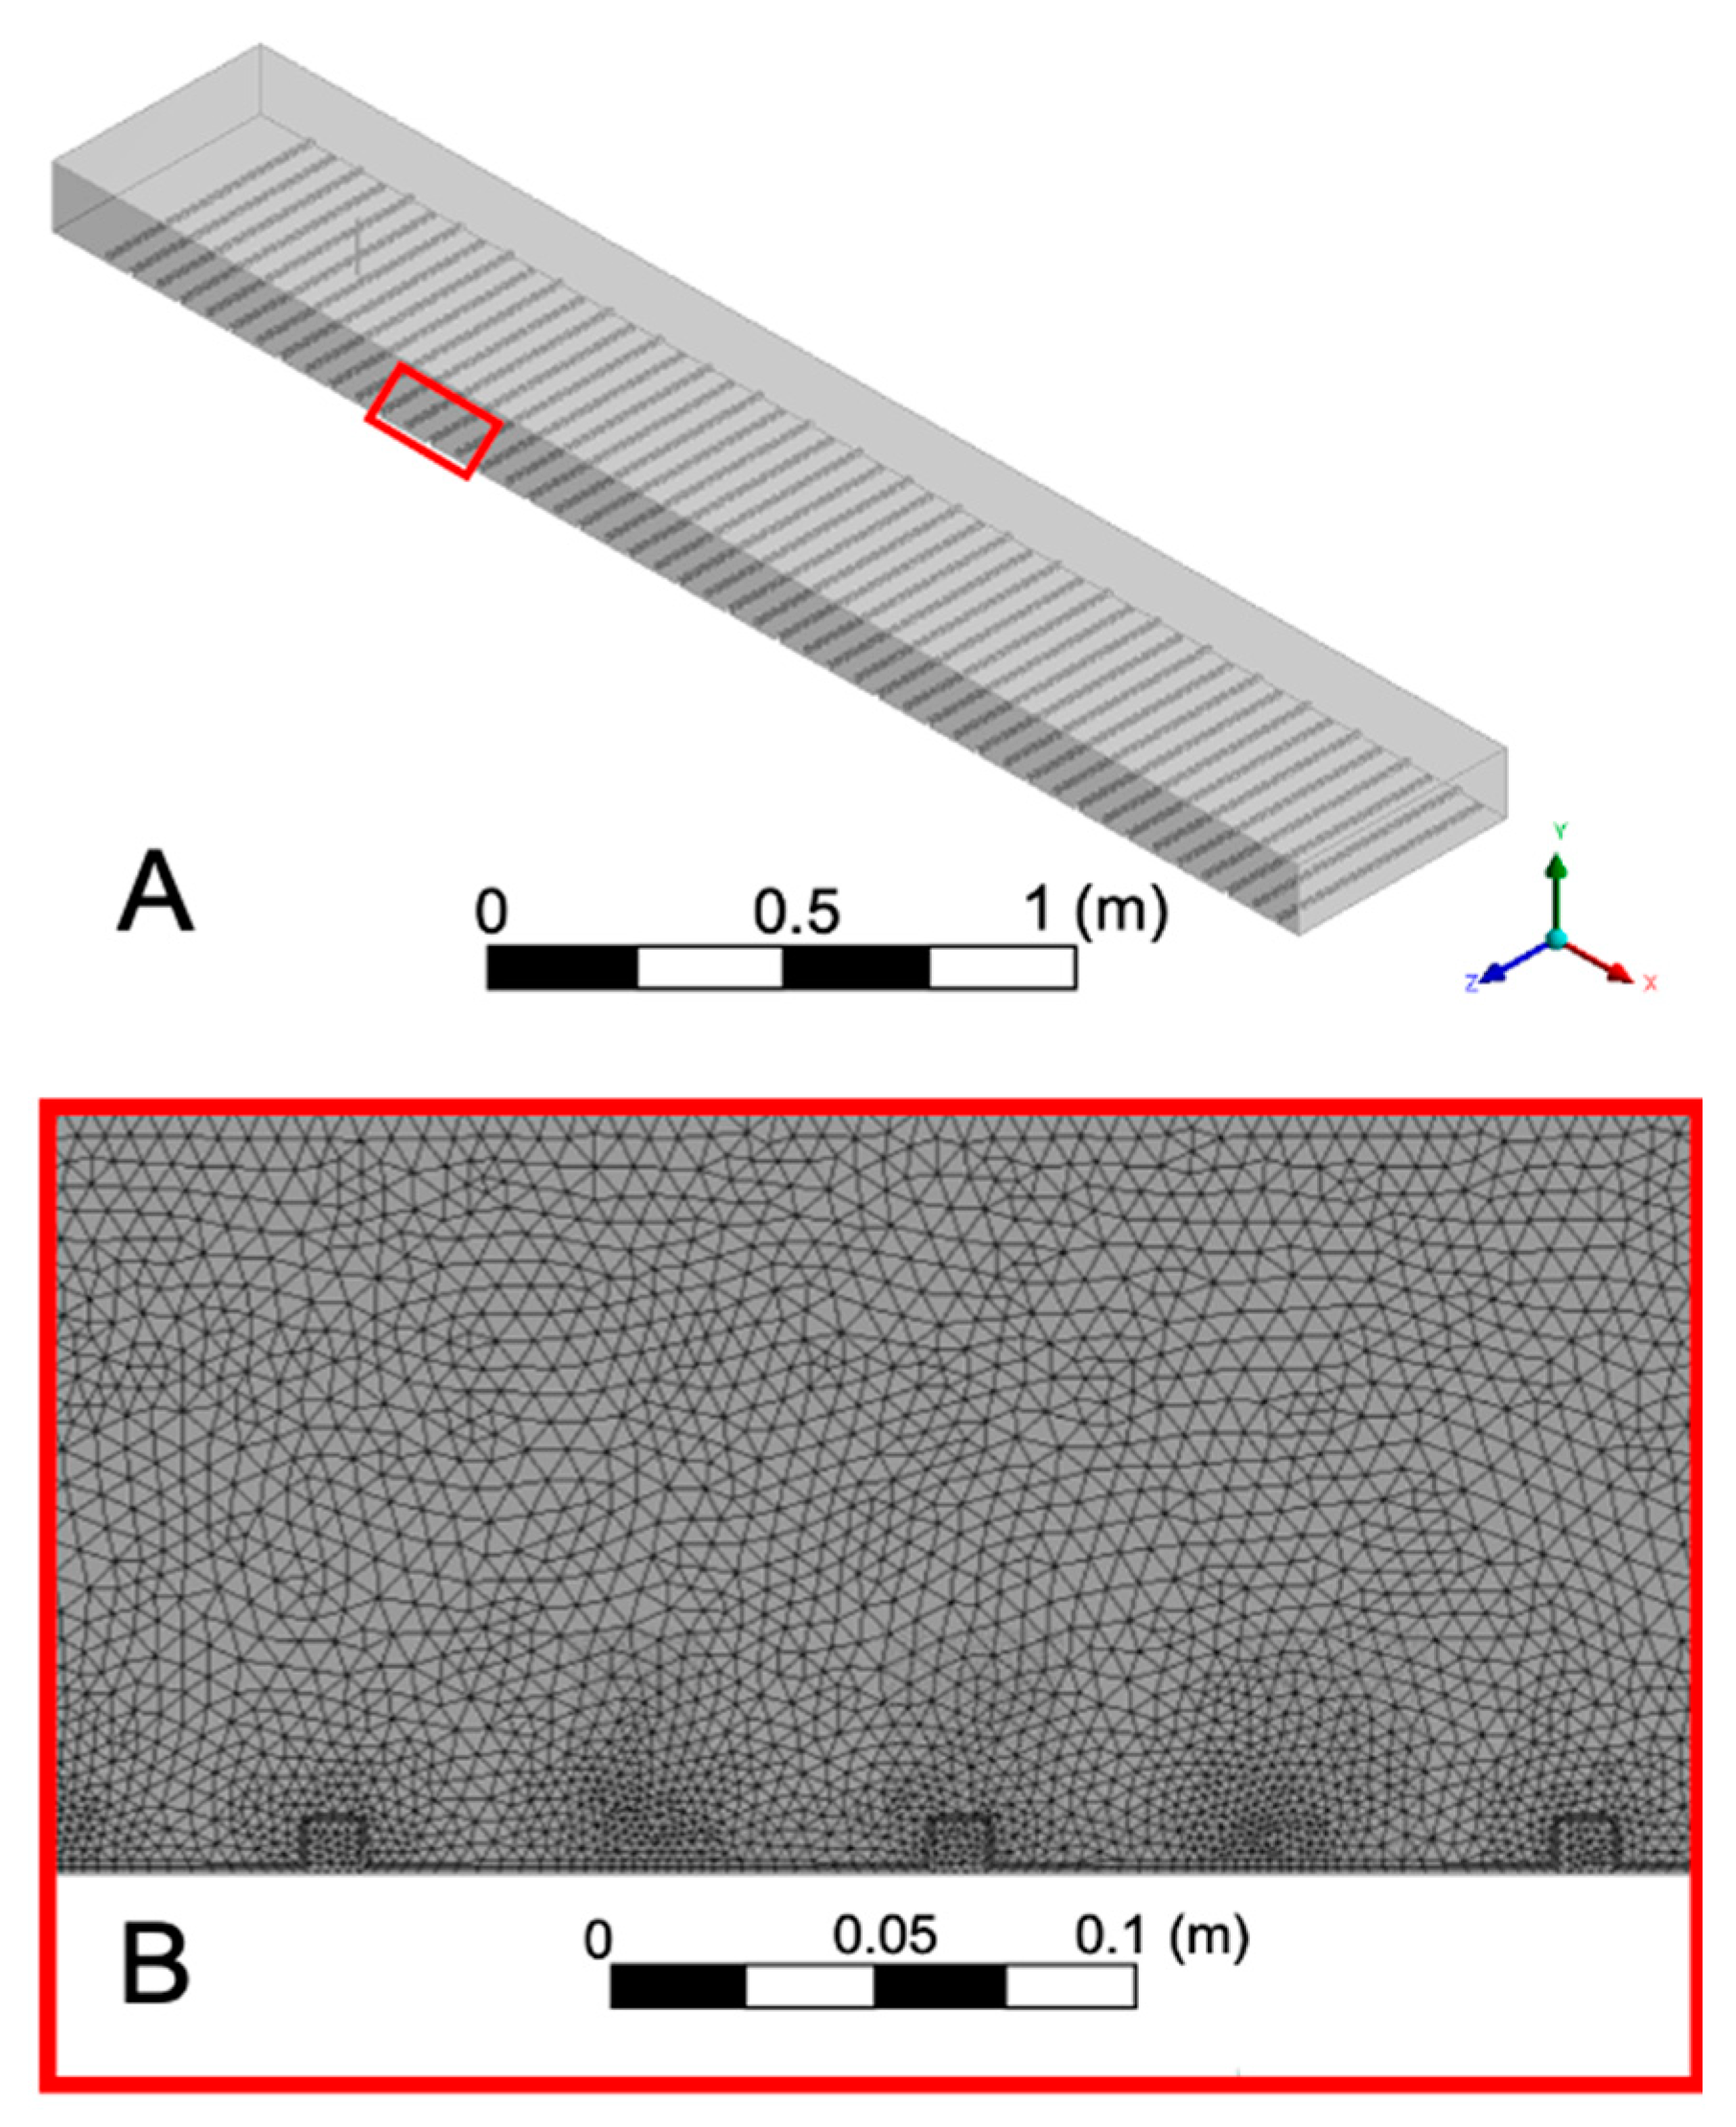
The computational fluid dynamics solver software, ANSYS-CFX® 2018, was used to create a 0.5 m wide, 0.15 m tall, and 3.5 m long computational flume containing a turbulent flow, with a pipe inlet that releases odorant 3 cm above the bed 0.5 m downstream (Figure 2). The size of the flume is comparable to that used in behavioral experiments [18,28,45]. Water enters through the upstream edge of the flume at 0.1 m·s−1 and exits the outlet 3.5 m downstream. Roughness elements were added to the bed of the flume through the addition of 1 cm3 blocks placed in staggered fashion to replicate sand bed topography and generate a turbulent boundary layer. The CFD model used a 5 million node unstructured tetrahedral mesh with a maximum distance between nodes of 5.5 mm and a three layer inflation along the bed. The downstream location of the odor inlet was chosen to enable turbulence to develop within the flow before the release of odor, as well as to better replicate how odor is injected into the flume in physical verification experiments [14]. The minimum distance between nodes was 0.8 mm, which ensures fine resolution along the boundary layer and roughness blocks. Water velocity, velocity gradient, turbulence intensity, and odor concentration were computed at each node for each timestep in the solution at 0.05 s intervals. A Bounded Central Difference Scheme and LES-Smagorinsky turbulence model were used to model flow. The Bounded Central Difference Scheme was chosen based upon its ability to eliminate unphysical negative concentration values by implementing upwinding [46].
The CFD model was validated by comparing odor concentration and velocity to data collected in a recirculating laboratory flume, with a 1 m long, by 0.2 m wide, by 0.3 m tall test section. A combined planar laser induced fluorescence and particle image velocimetry technique was used to simultaneously quantify dye concentrations and water velocities [47]. Fluorescein dye, possessing a similar diffusivity to odorant compounds like amino acids, was released as a tracer for planar laser induced fluorescence (PLIF) [25,48]. An argon ion laser that has an output wavelength of 488 nm fluoresced the dye after the laser was passed through a beam focus onto a scanning mirror. Velocity measurements were computed using particle image velocimetry (PIV). PIV entails a laser emitting 532 nm wavelength light to illuminate 9 µm diameter silver coated glass spheres and track their change in location to measure velocity. The PIV laser passed through a beam focus onto a convex lens to create a sheet of light. The lasers for PLIF and PIV alternated illumination of an 8 cm × 8 cm plane over the centerline of the plume 0.5 m downstream from the dye input. The dye injector consisted of an L shaped pipe located at a position 3 cm above the bed in the center of the flume that released dye at a continuous rate of 0.2 kg·3·s−1. PIV particles were added to the flume to create a seeding density of approximately 10 particles per 1 cm2 imaging area. A digital camera (Basler Ace 2040), operated at 40 Hz, captured alternating images of PIV and PLIF at increments of 0.05 s each.
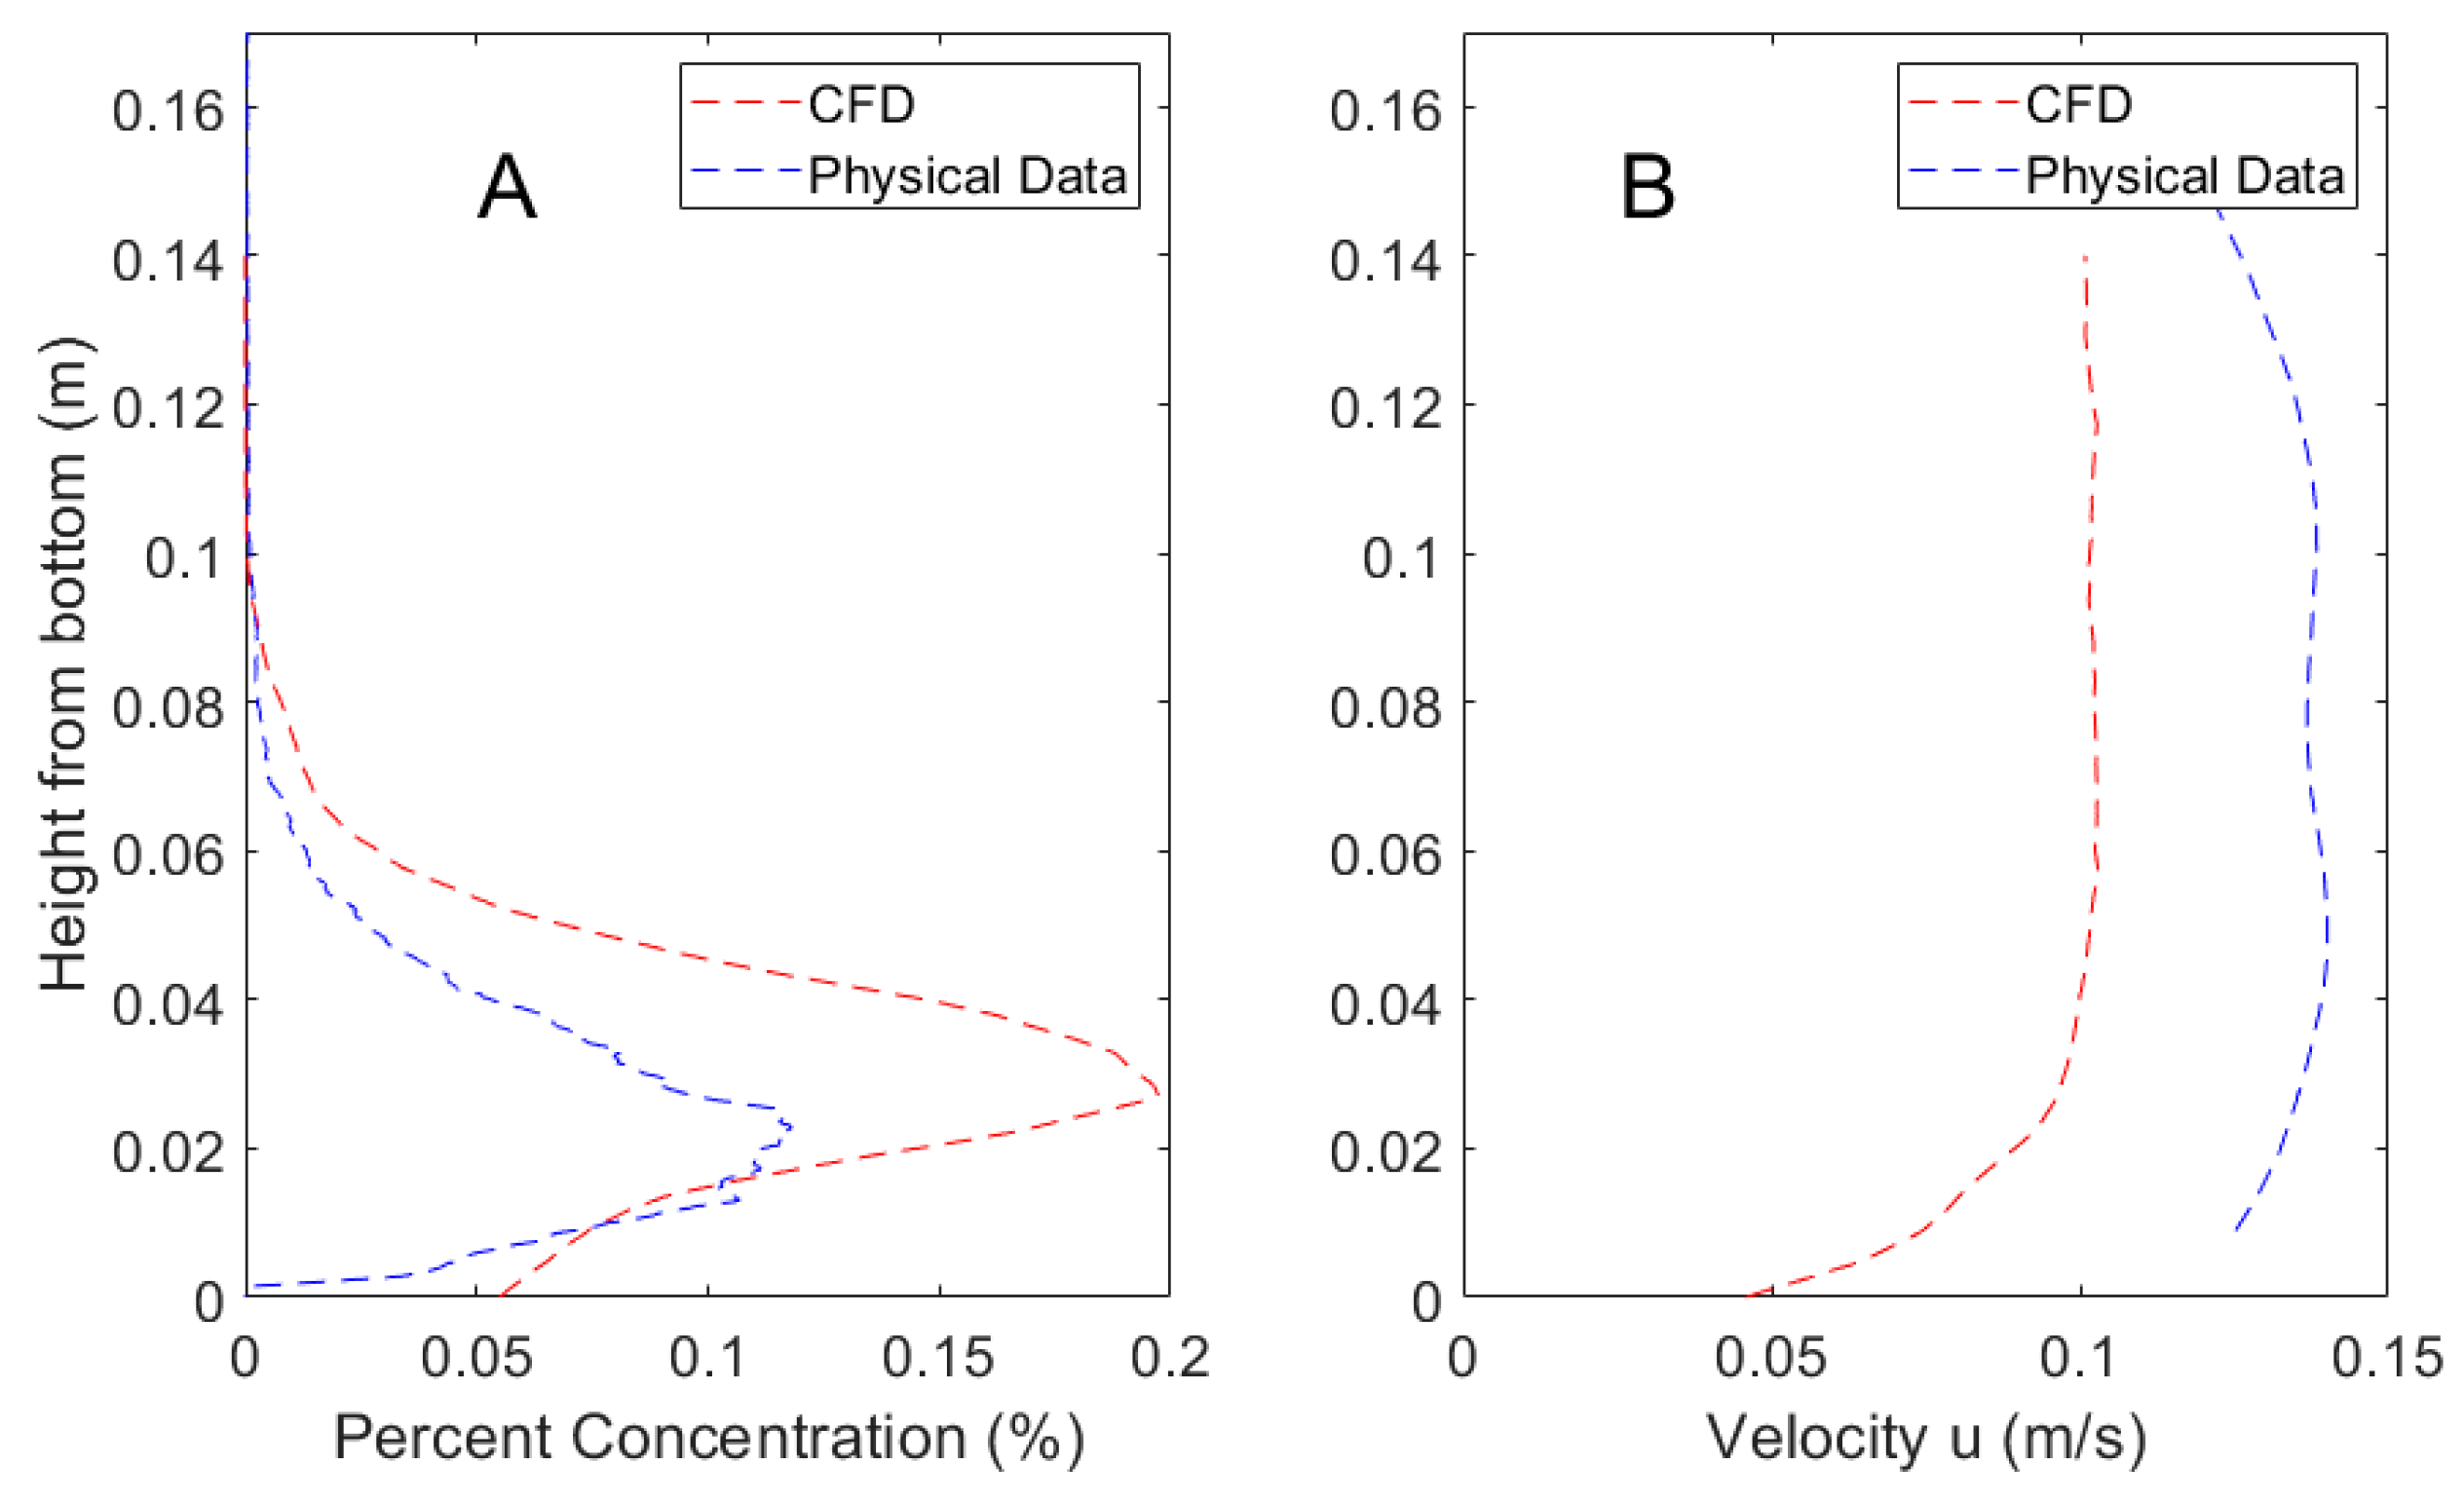
Validation of the CFD model using velocity and concentration showed approximate agreement with laboratory measurements, as shown in Figure 3. The water velocities generated within the laboratory flume were not precisely matched to the CFD simulation of 10 cm·s−1 and therefore slightly higher velocities within the laboratory flume resulted in more well mixed concentrations. However, both the velocity and concentration profiles are qualitatively similar, and the validation results are consistent with that of a similar hydrodynamic model studied in Pravin and Reidenbach [25]. Flow statistics for the hydrodynamic model are shown in Table 1. The Reynolds roughness value is defined as, Re* = ρu*L/µ, where ρ is the fluid density, u* is the friction velocity, L is the lengthscale of the roughness element, and µ is the fluid viscosity. The Reynolds roughness value observed of Re* = 23.5 falls within the range of 3 to 100 that is common in marine environments [49].
2.2. Search Algorithms
Search algorithms were designed to compare potential methods of lobster search given known chemosensory and mechanosensory function and sensitivity of P. argus [50,51]. Search variable parameters of interest included concentration above a threshold concentration, odorant intermittency, and water velocity. Intermittency was calculated as:
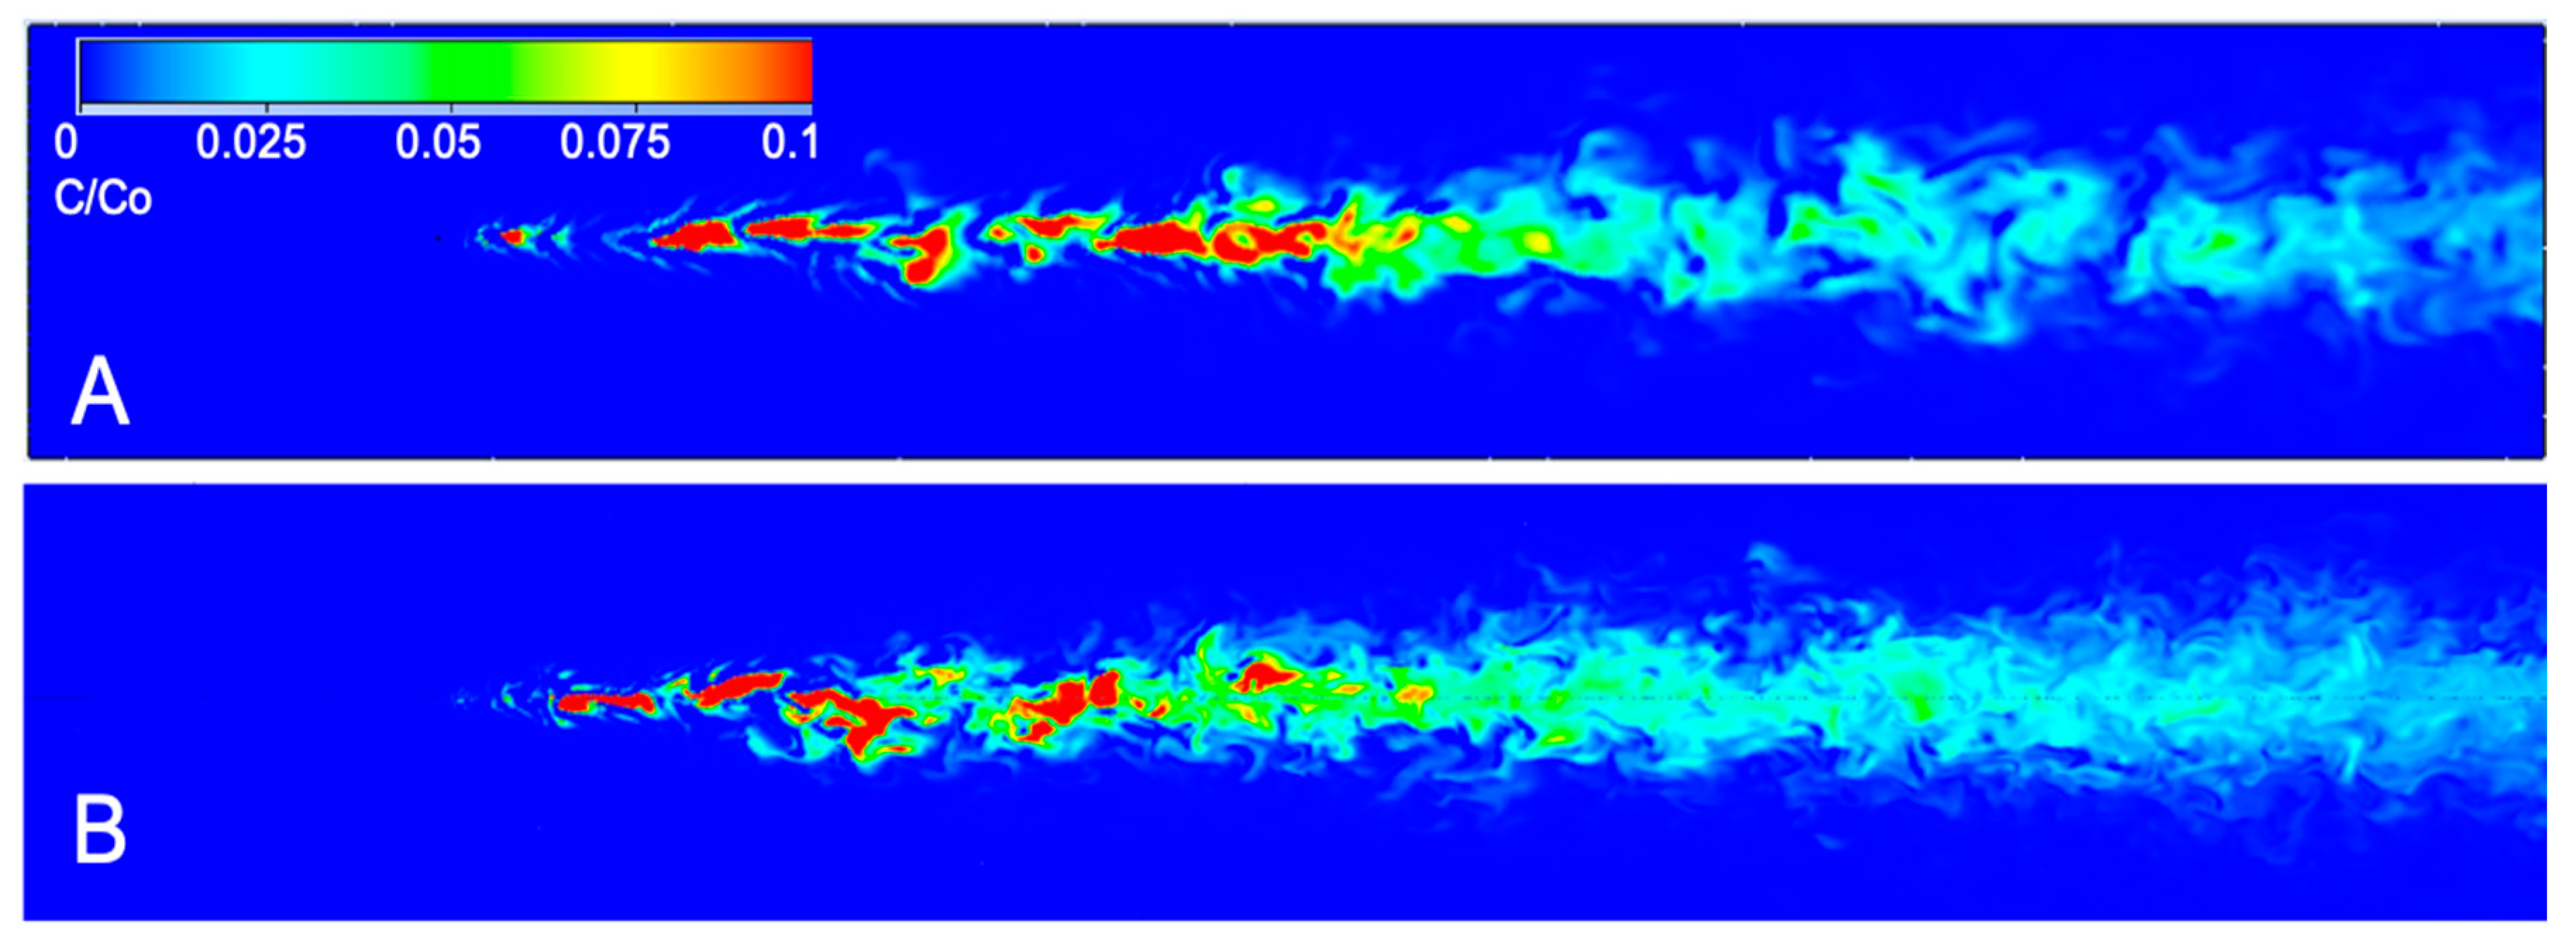
where I is intermittency in seconds, t0 is the current time (s) and t1 is the time (s) the lobster last encountered odor above a threshold concentration. For the purposes of this study, the threshold concentration was set to 0.02% of the 0.2 kg/m3 source concentration. No dynamic rules for intermittency encoding are applied to the search algorithm, although it is known that lobsters can adapt to changes in mean background concentrations [52,53]. The threshold concentration of 0.02% was determined based on the minimum concentration of glycine, a common amino acid Panulirus lobsters track for food, that elicited a feeding response [54]. Two points spaced 5 cm apart, to represent antennule spacing on a lobster, were assessed to identify differences in concentration and intermittency at an elevation of z = 5 cm above the bed. Search algorithms use the nearest node’s instantaneous chemical and velocity data for each antennule and leg. Therefore, concentration and velocity sensing has a spatial resolution between 0.8 mm and 5.5 mm, the same as the node spacing for the CFD simulation. The distribution of instantaneous concentrations at z = 0.05 m above the bed and at z = 0.02 m above the bed (to represent sampling height of leg chemosensors) is shown in Figure 4.
I = t0 − t1
Six search algorithms tested odorant tracking in crustaceans and were simulated N = 1000 times each. General guidelines for movement using a concentration strategy similar to odor-gated rheotaxis were that if one antennule senses odor concentration above threshold, the lobster moves upstream diagonally towards that antennule. If both antennules sense odor, the lobster moves directly upstream. If neither antennule senses odor, the lobster moves transversely to its left or right in random fashion. This was based on previous research that crustaceans search cross-stream to reacquire an odor plume [19]. A speed of 5 cm·s−1 was used for every decision based on previous literature and observations of crustaceans [10].
An intermittency search algorithm incorporated time since last odor encounter to determine search movement. Intermittency, I, was used when neither antennule sensed odor at the present time. If at least one antennule sensed odor, the same general guidelines are used where the lobster moves in the direction of that antennule or straight ahead if both antennules sensed odor. However, if neither antennule sensed odor, then the lobster moved in the direction that has the lowest intermittency measured by time since last encounter within the previous 5 s. A five second detection time was used to direct movement because the average spontaneous bursting frequency of bORNS was found to be approximately 0.2 Hz (i.e., the average bORN bursts once every 5 s in the absence of a chemical signal and resets) [42,43]. If both antennules sensed odor at the same time within 5 s, then the lobster remains still as it was likely close to the centerline. If no odor had been measured in the past five seconds by either antennule, then the lobster walks randomly in the cross stream direction.
Leg chemosensing and transverse flow search strategies were tested for complementarity to the intermittency and concentration based search methods. Thus, both were incorporated as add-ons to the intermittency and concentration search strategies to test if they improved search. Legs 5 cm to the left and right of the lobster sensed water 1 cm above roughness blocks (i.e., z = 2 cm above the bed) for leg chemosensing. The search algorithms for intermittency and concentration were modified to test if both legs sense odor above the threshold. If only one antennule sensed an above threshold concentration and both legs sensed odor, then the lobster moved directly forward, as it is likely still within the plume. If odor was not detected by either antennule and at least one leg sensed above threshold odor, the lobster moves in the direction of whichever leg sensed a concentration or directly upstream if both legs sensed odor.
Transverse flow search algorithms integrated both the concentration and direction of flow within a plume. The algorithm followed guidelines outlined in Pravin and Reidenbach [25] for simultaneous sampling of flow and odors to aid in search. Briefly, the algorithm utilized both concentration and the direction of flow to make decisions regarding lobster movement towards higher concentration. Transverse flow is defined as the water velocity perpendicular to the downstream direction; An animal can conceivably utilize this information to determine if they are to the left or right of the centerline of the plume, which statistically contains the highest mean concentration [25]. The transverse flow search algorithm was similar to the concentration method, except movements were adjusted in the case that a single antennule sensed odor above threshold. If the left antennule sensed odor and transverse flow above 1 cm s−1 towards the lobster body from the left side, the lobster moves diagonally as normal and takes an additional step 5 cm to its left beyond its normal movement over a total of two seconds. The lobster used the same process if its right antennule senses odor and transverse flow in the direction of the lobster body above 1 cm s−1. This movement is designed to enable lobsters on the edge of a plume to assess their flow environment and move towards the plume centerline more accurately. A summary of all search strategies is presented in Table 2.
All strategies were tested with total time and percent of successful searches recorded; Lobster search was deemed a success within one body length of the source, set at 0.2 m for the P. argus spiny lobster. The lobster had a total of two minutes to search. Initial lobster location was randomly generated within the flume with a minimum distance 0.5 m downstream of the odor source. Each search algorithm was tested with N = 1000 independent searches, with mean downstream distance at start of search being statistically similar for each search algorithm. Each search was conducted within the same CFD plume simulation.
3. Results
3.1. CFD Plume Dynamics
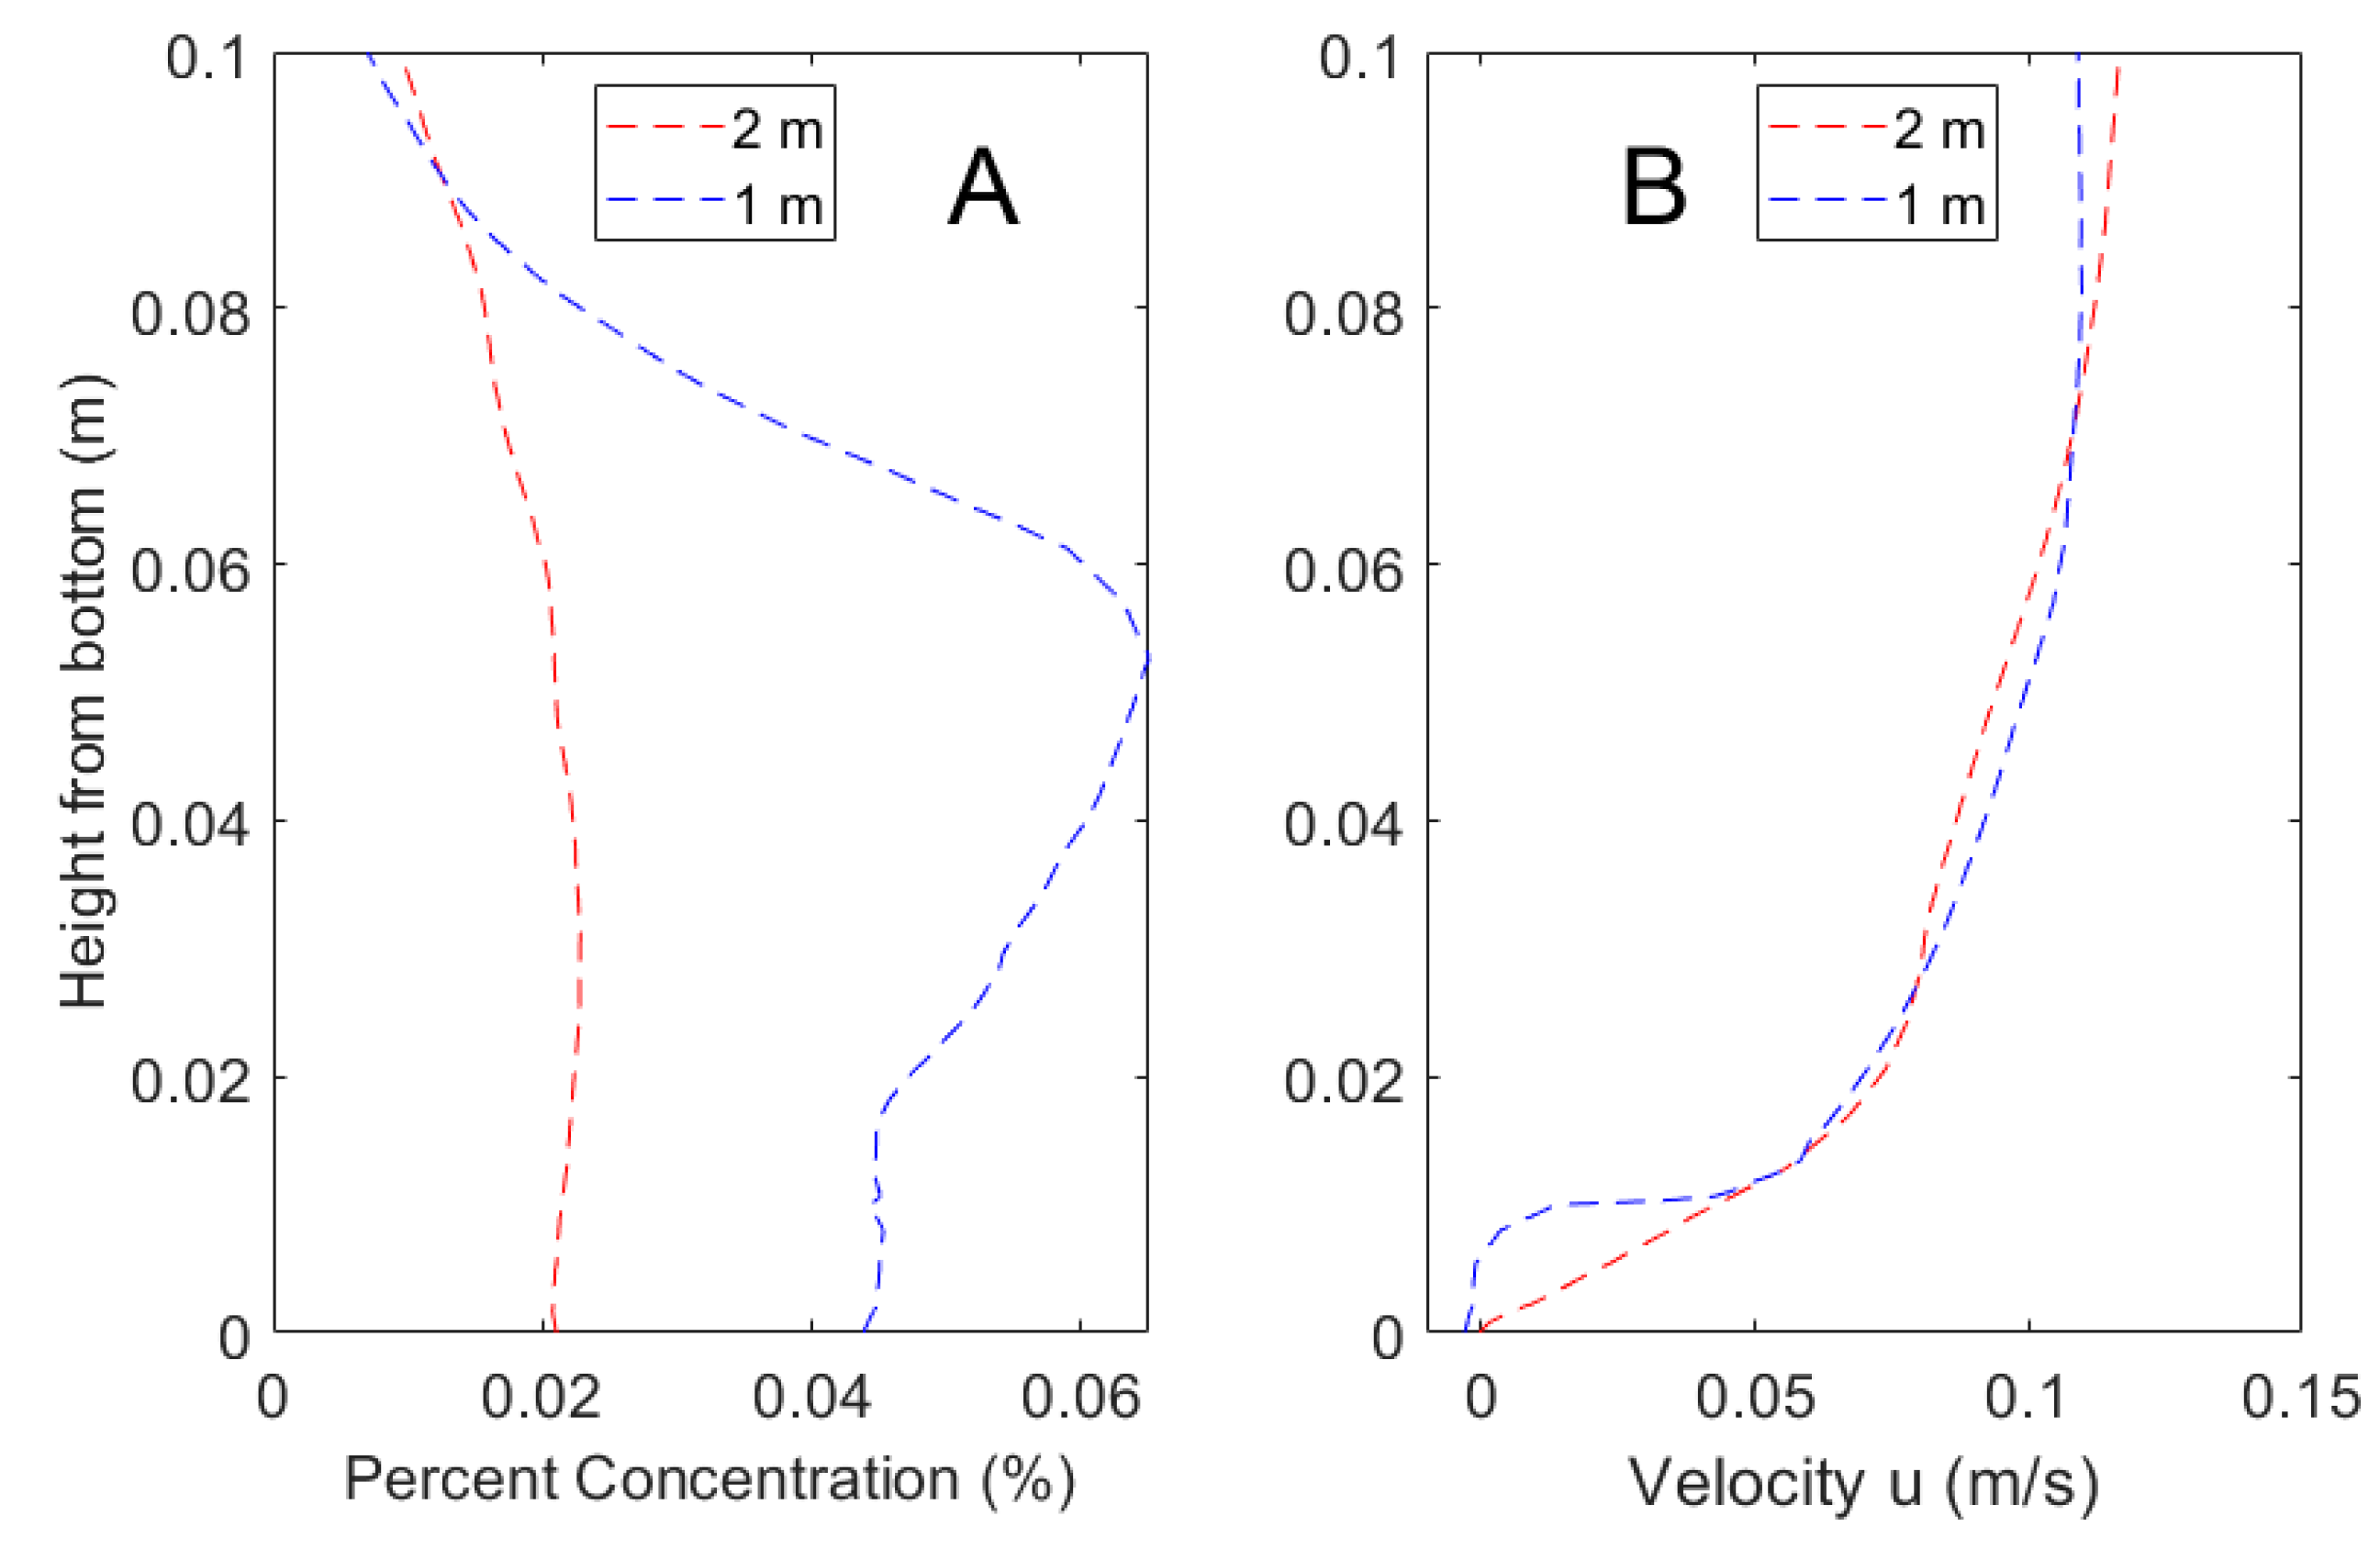
The mean concentration and velocity at x = 1 m and 2 m downstream from the odor source generated from the numerical simulation are shown in Figure 5. The plume and velocity structure has not fully developed at 1 m downstream, but it has fairly uniform, well mixed concentration distributions by 2 m downstream. The velocity profile also becomes logarithmic by 2 m downstream. The shear layer formed in the velocity profile at z = 0.1 m above the bed and x = 1 m downstream is due to flow interaction with the roughness elements.
3.2. Search Algorithms
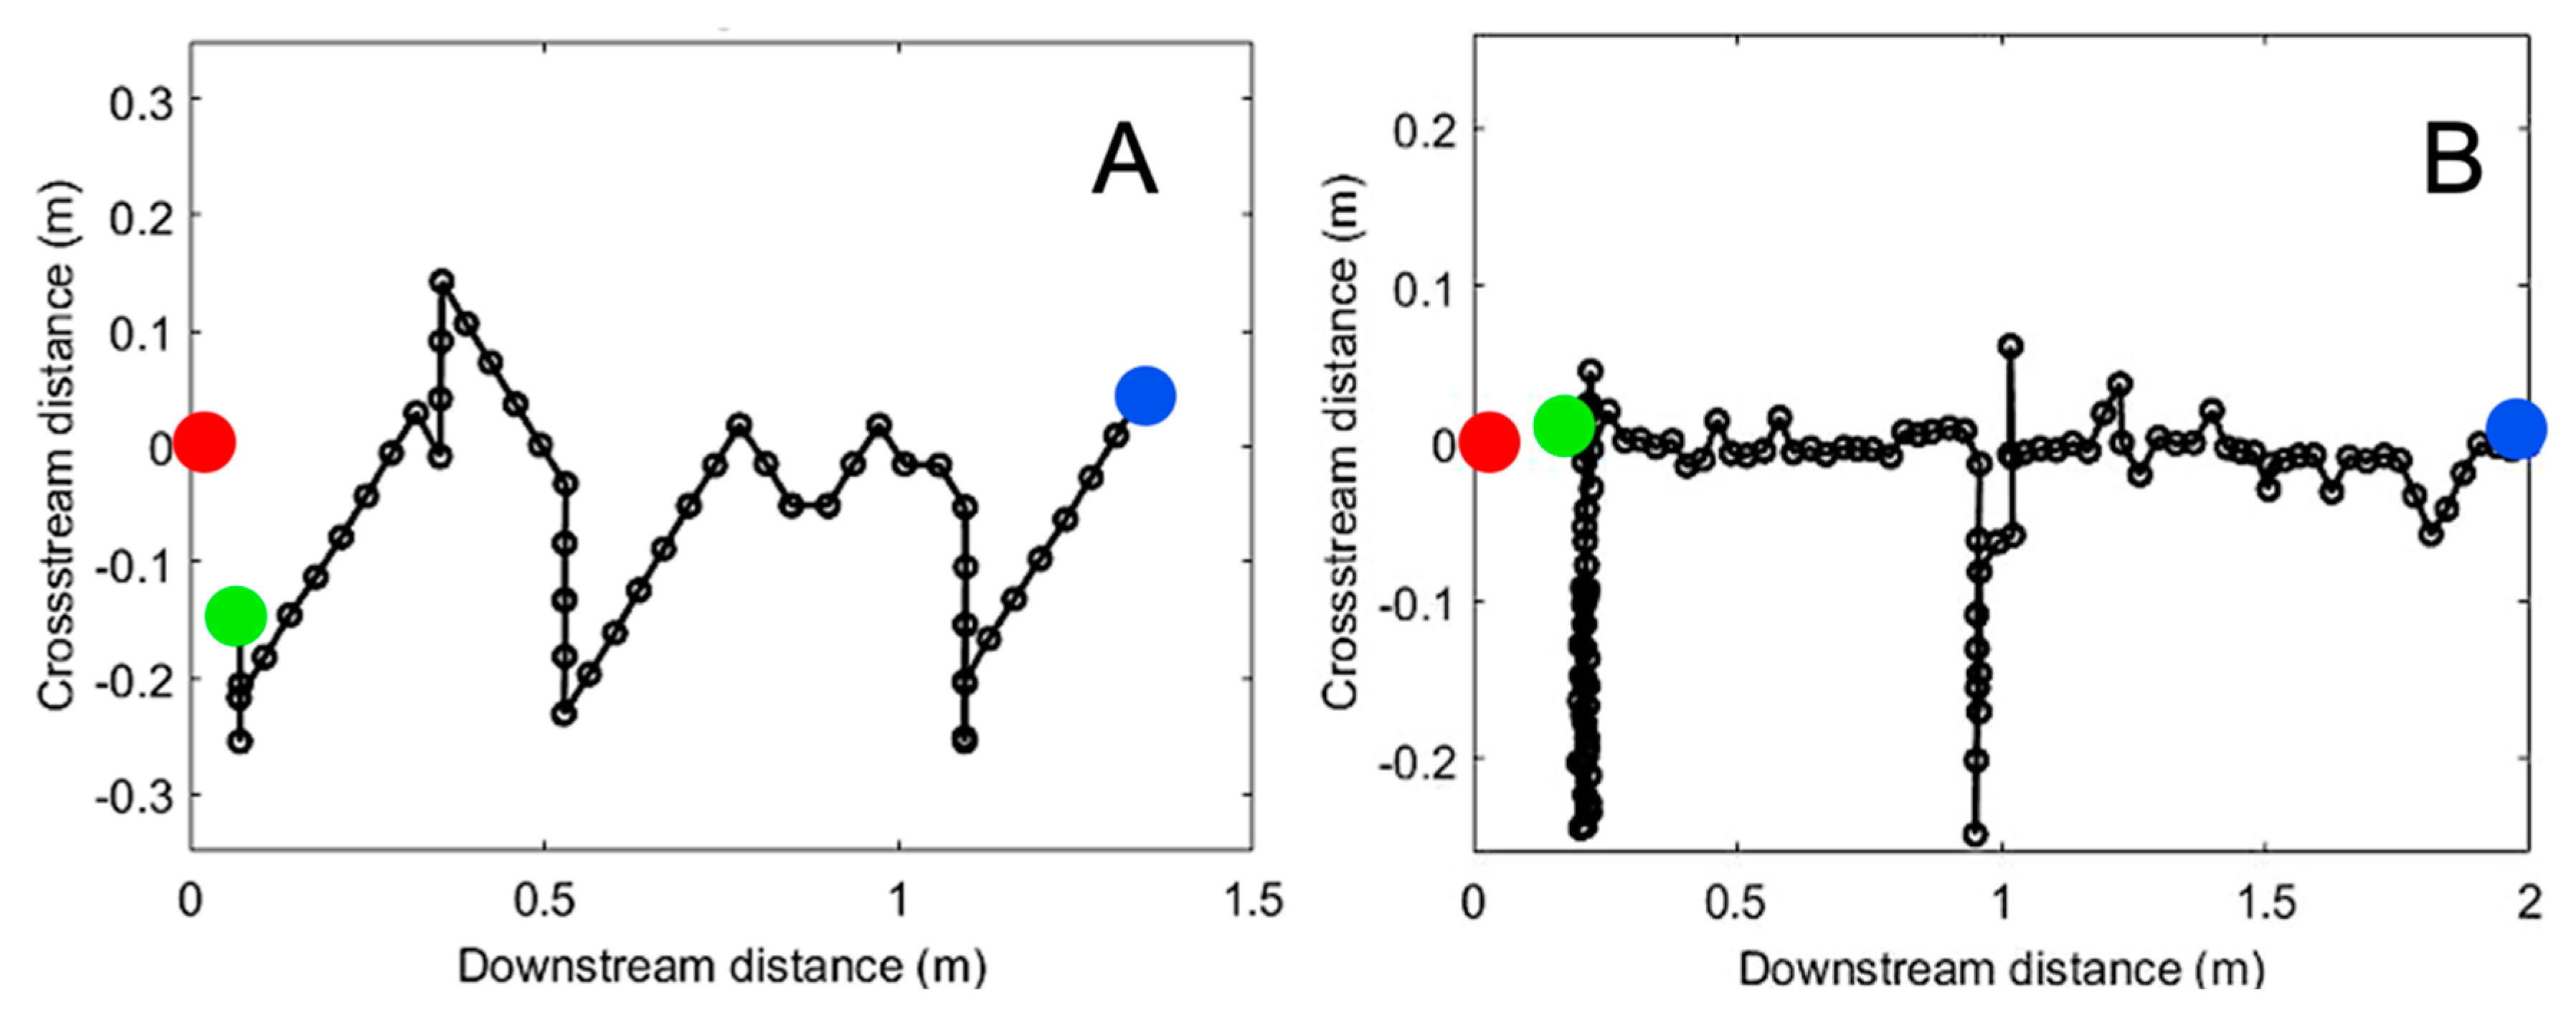
Example trajectories of a concentration-based search and an intermittency-based search are shown in Figure 6, where the blue dot is the initial lobster location, the red dot is the odor source location, and the green dot is the lobster’s final position. These representative trajectories show general trends of a concentration search strategy seeking to follow the path along the center of the plume. Alternatively, an intermittency-based search utilizes recent odor encounters to inform movement toward the odor source, often by detecting and adjusting direction based on the edge of a plume.
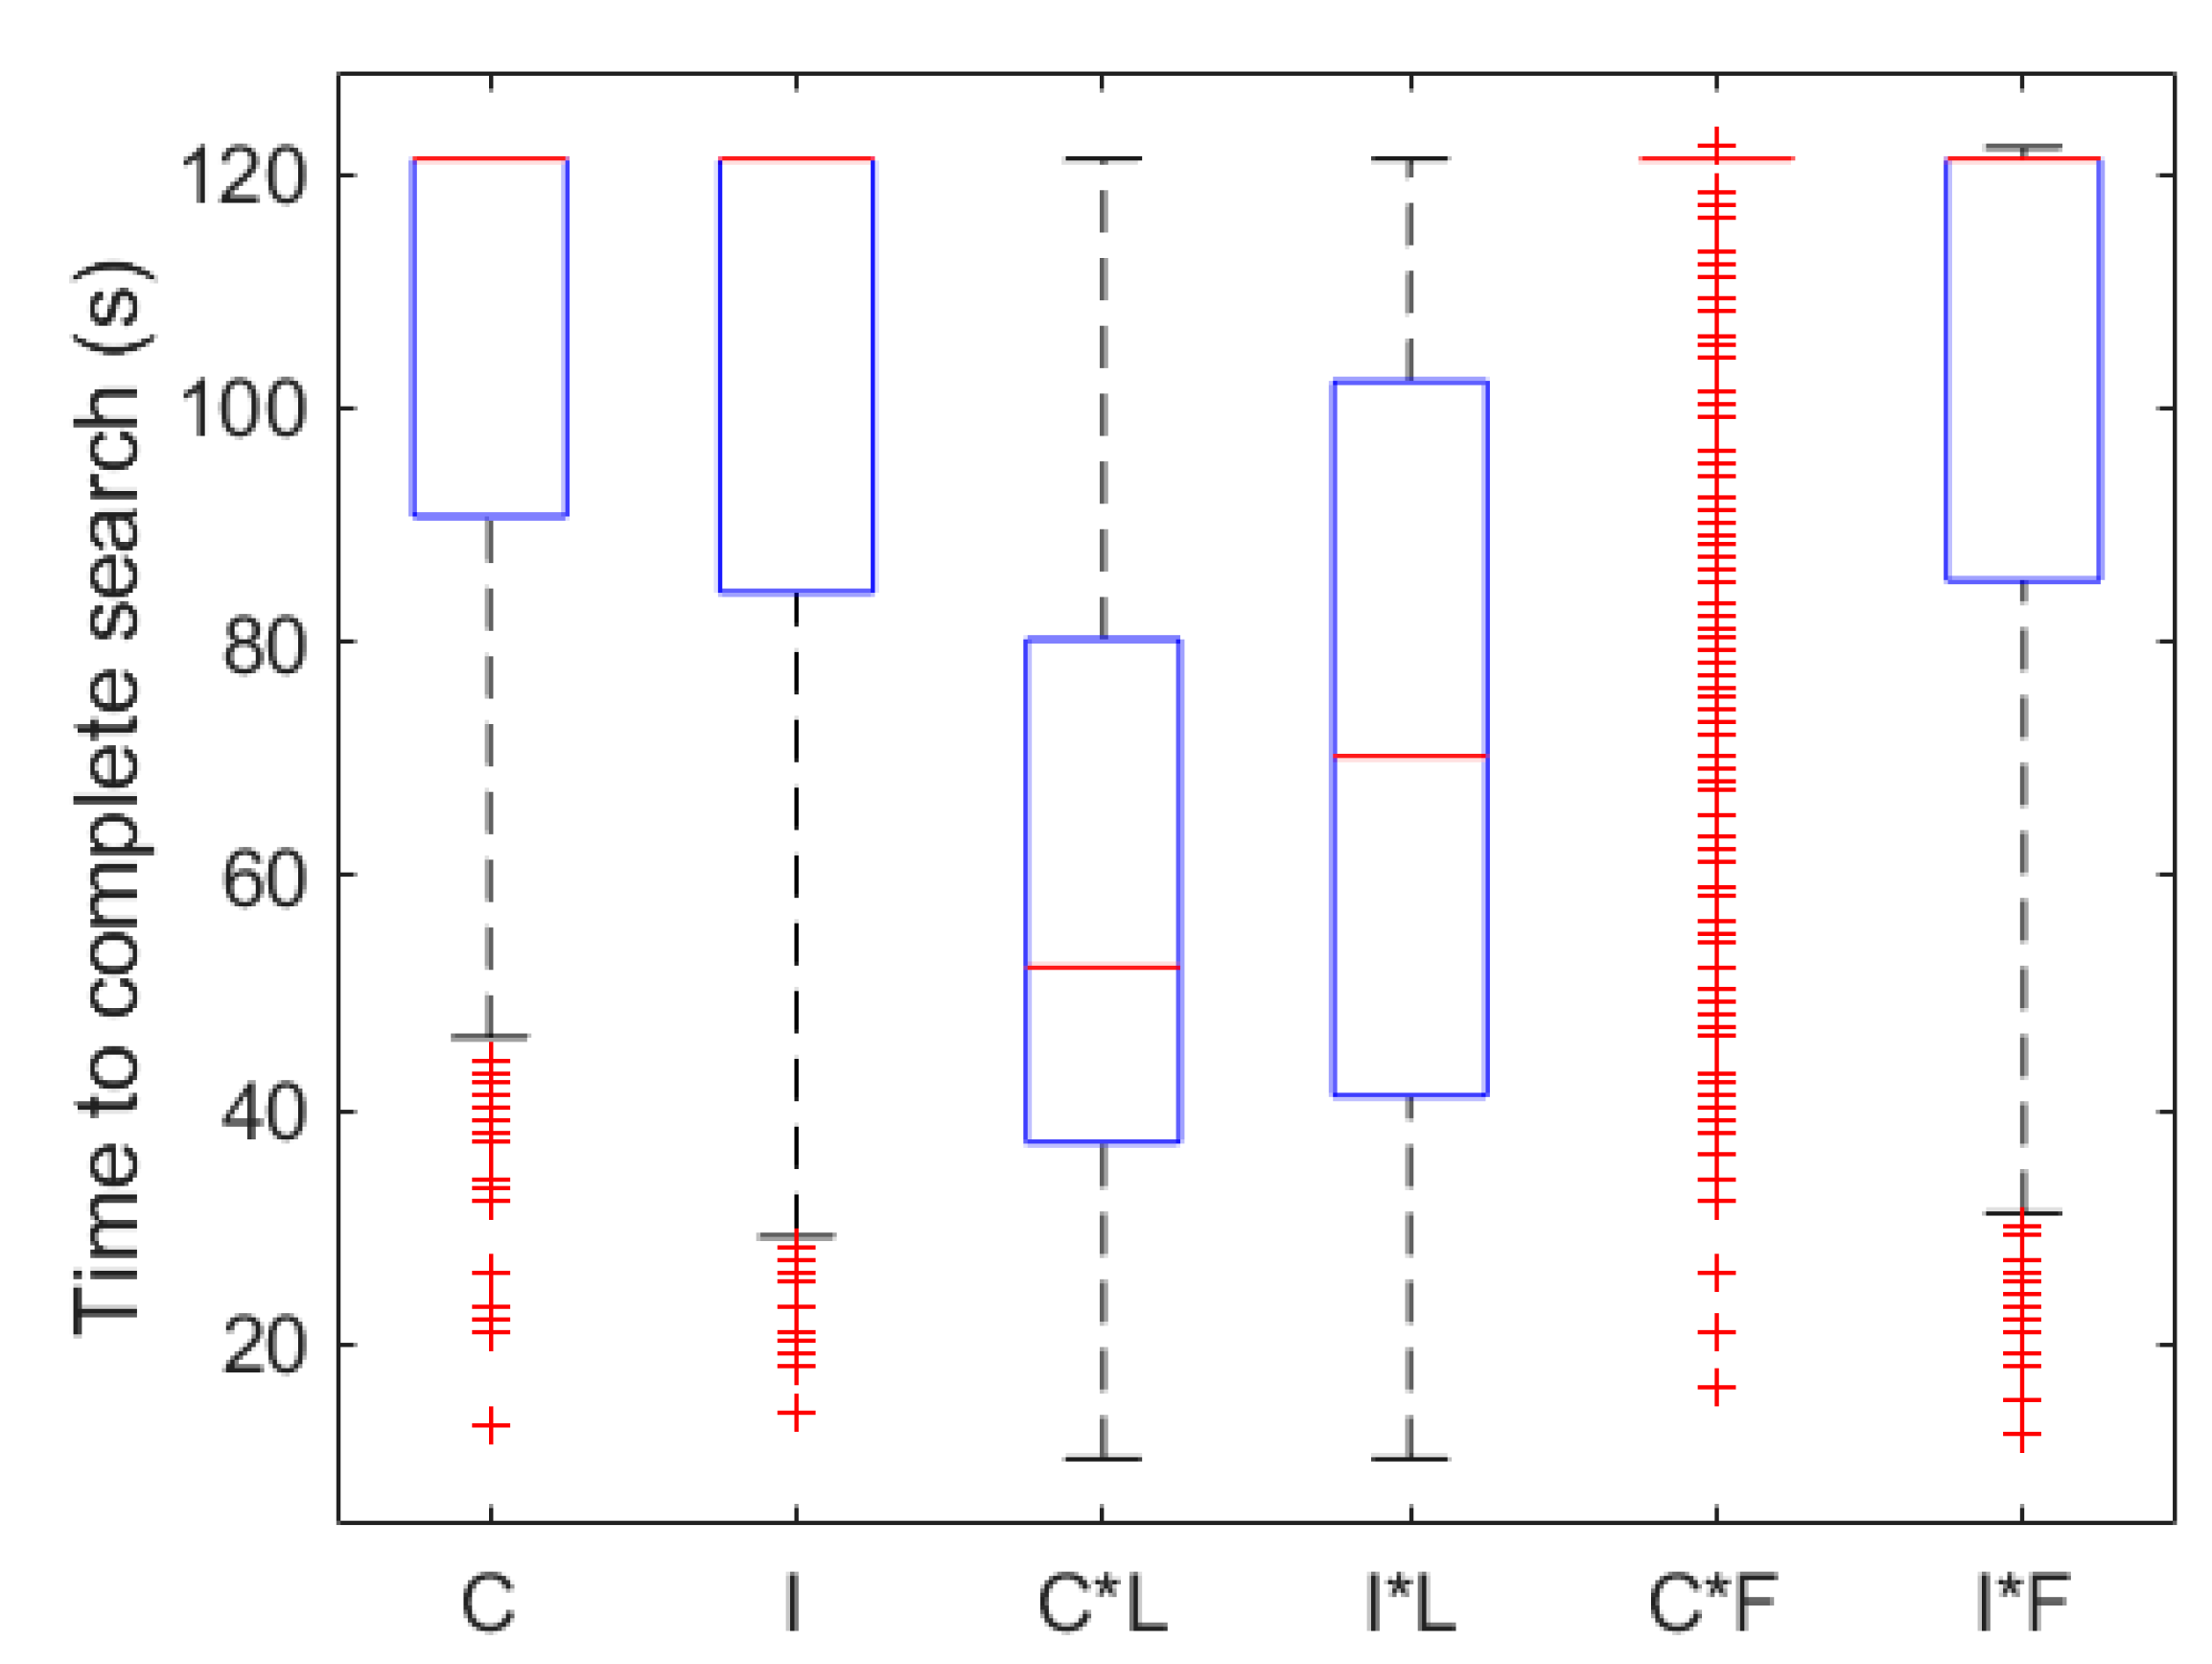
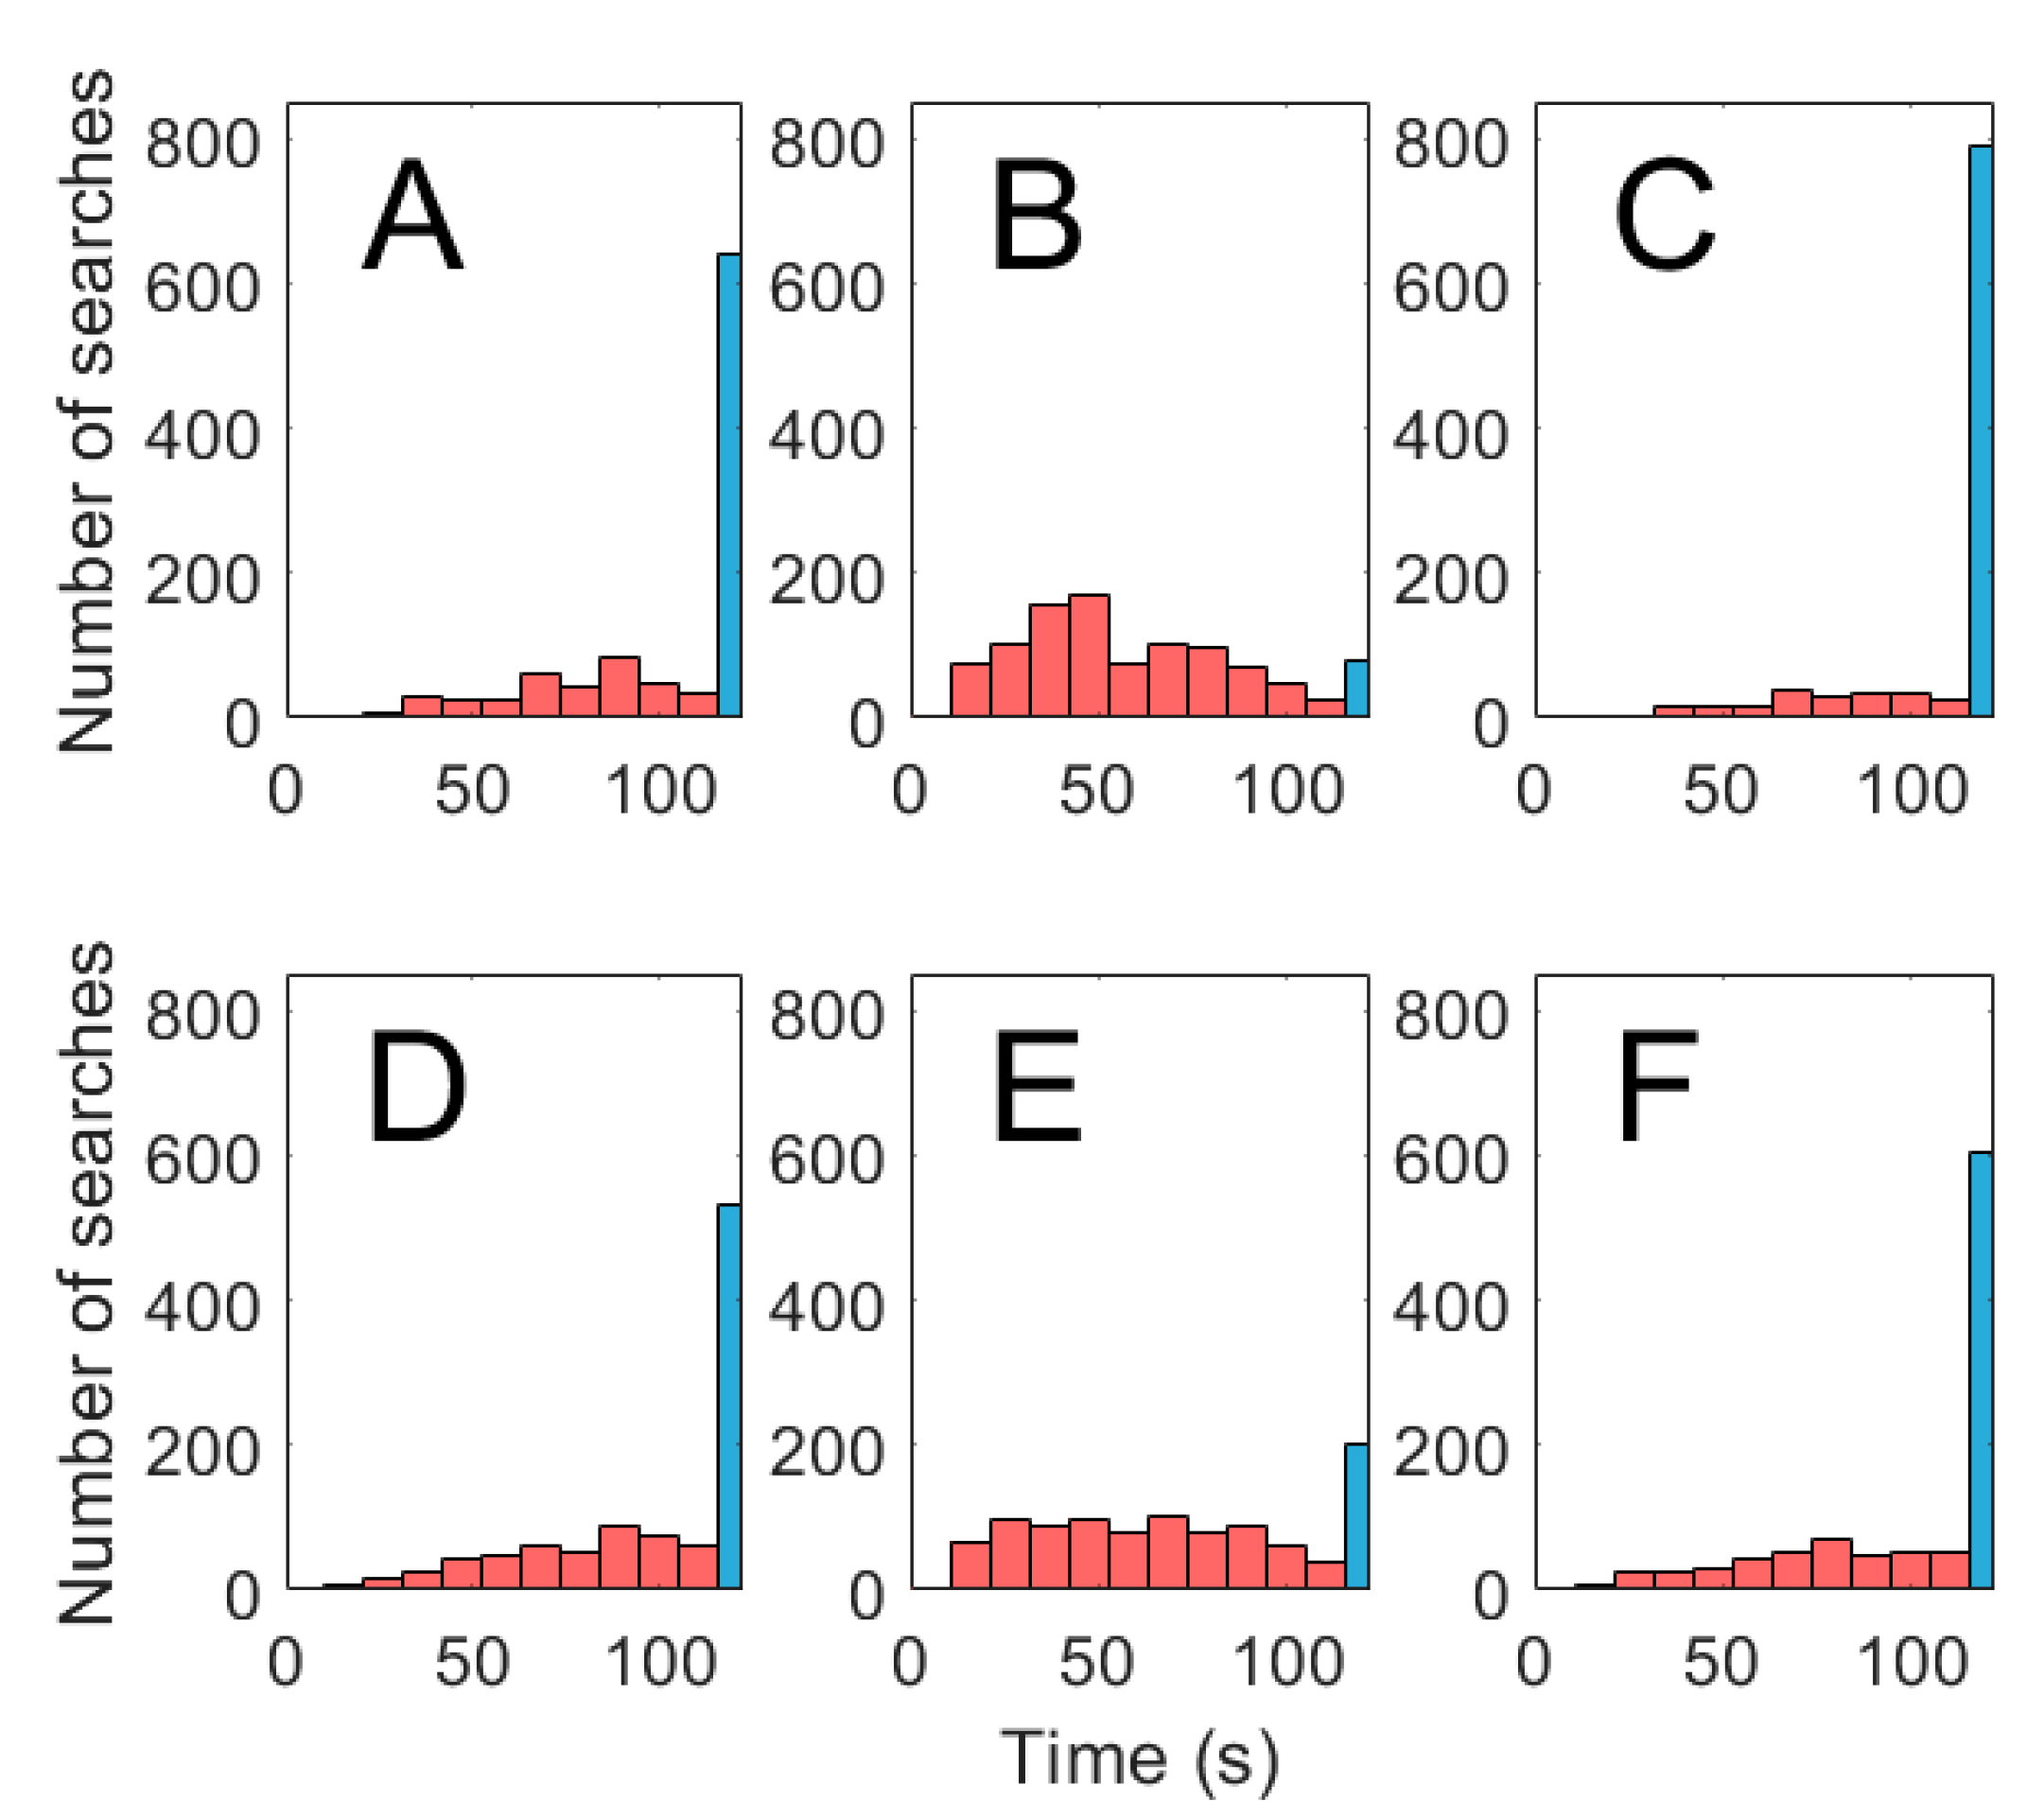
Results for N = 1000 search runs for each of the six search algorithms tested are shown in Figure 7. The concentration search algorithm was successful in tracking the odor plume in 37.1% of trials with an average time of 105 s ± 25.6 s (mean ± SD) spent searching. Histograms of time taken to reach the odor source using concentration search algorithms are compared to one another in Figure 8A–C. The concentration search time distribution is strongly left skewed. The intermittency search algorithm successfully located the odor source in 49.1% of runs with an average time of 100 s ± 27.6 s and also possessed a highly left skewed distribution. Histograms of time taken to reach the odor source using intermittency-based search algorithms are compared to one another in Figure 8D–F. The intermittency strategy was statistically superior to the concentration strategy (p < 0.01). Search utilizing leg chemosensors improved the search success and average time in comparison to antennule search (p < 0.01 for intermittency, p < 0.01 for concentration). Average search time decreased from 105 s to 59.7 s and 100 s to 71.6 s for concentration and intermittency respectively. Percent success rate increased from 37.1% to 93.5% and 49.1% to 81.7% for concentration and intermittency respectively. There was a negative effect of utilizing transverse flow with concentration (p < 0.01) and no effect of flow combined with intermittency (p > 0.10). Success rate decreased from 37.1% to 24.4% and 49.1% to 42.7% for concentration and intermittency respectively when transverse flow was incorporated in to search.
Results for all search algorithms were highly skewed for time searching and lacked homogeneity of variance. A generalized linear model with a Poisson distribution for time spent searching and log link was used to compare search algorithms as a result. Contrasts included intermittency vs. concentration; intermittency and leg chemosensing vs. intermittency alone; concentration and leg chemosensing vs. concentration; intermittency and flow mechanosensing vs. intermittency; and concentration and flow mechanosening vs. concentration (Table 3). A Bonferroni correction reduced Type I error, making the significant p-value < 0.01.
3.3. Effect of Change in Source Concentration and Intermittency Threshold
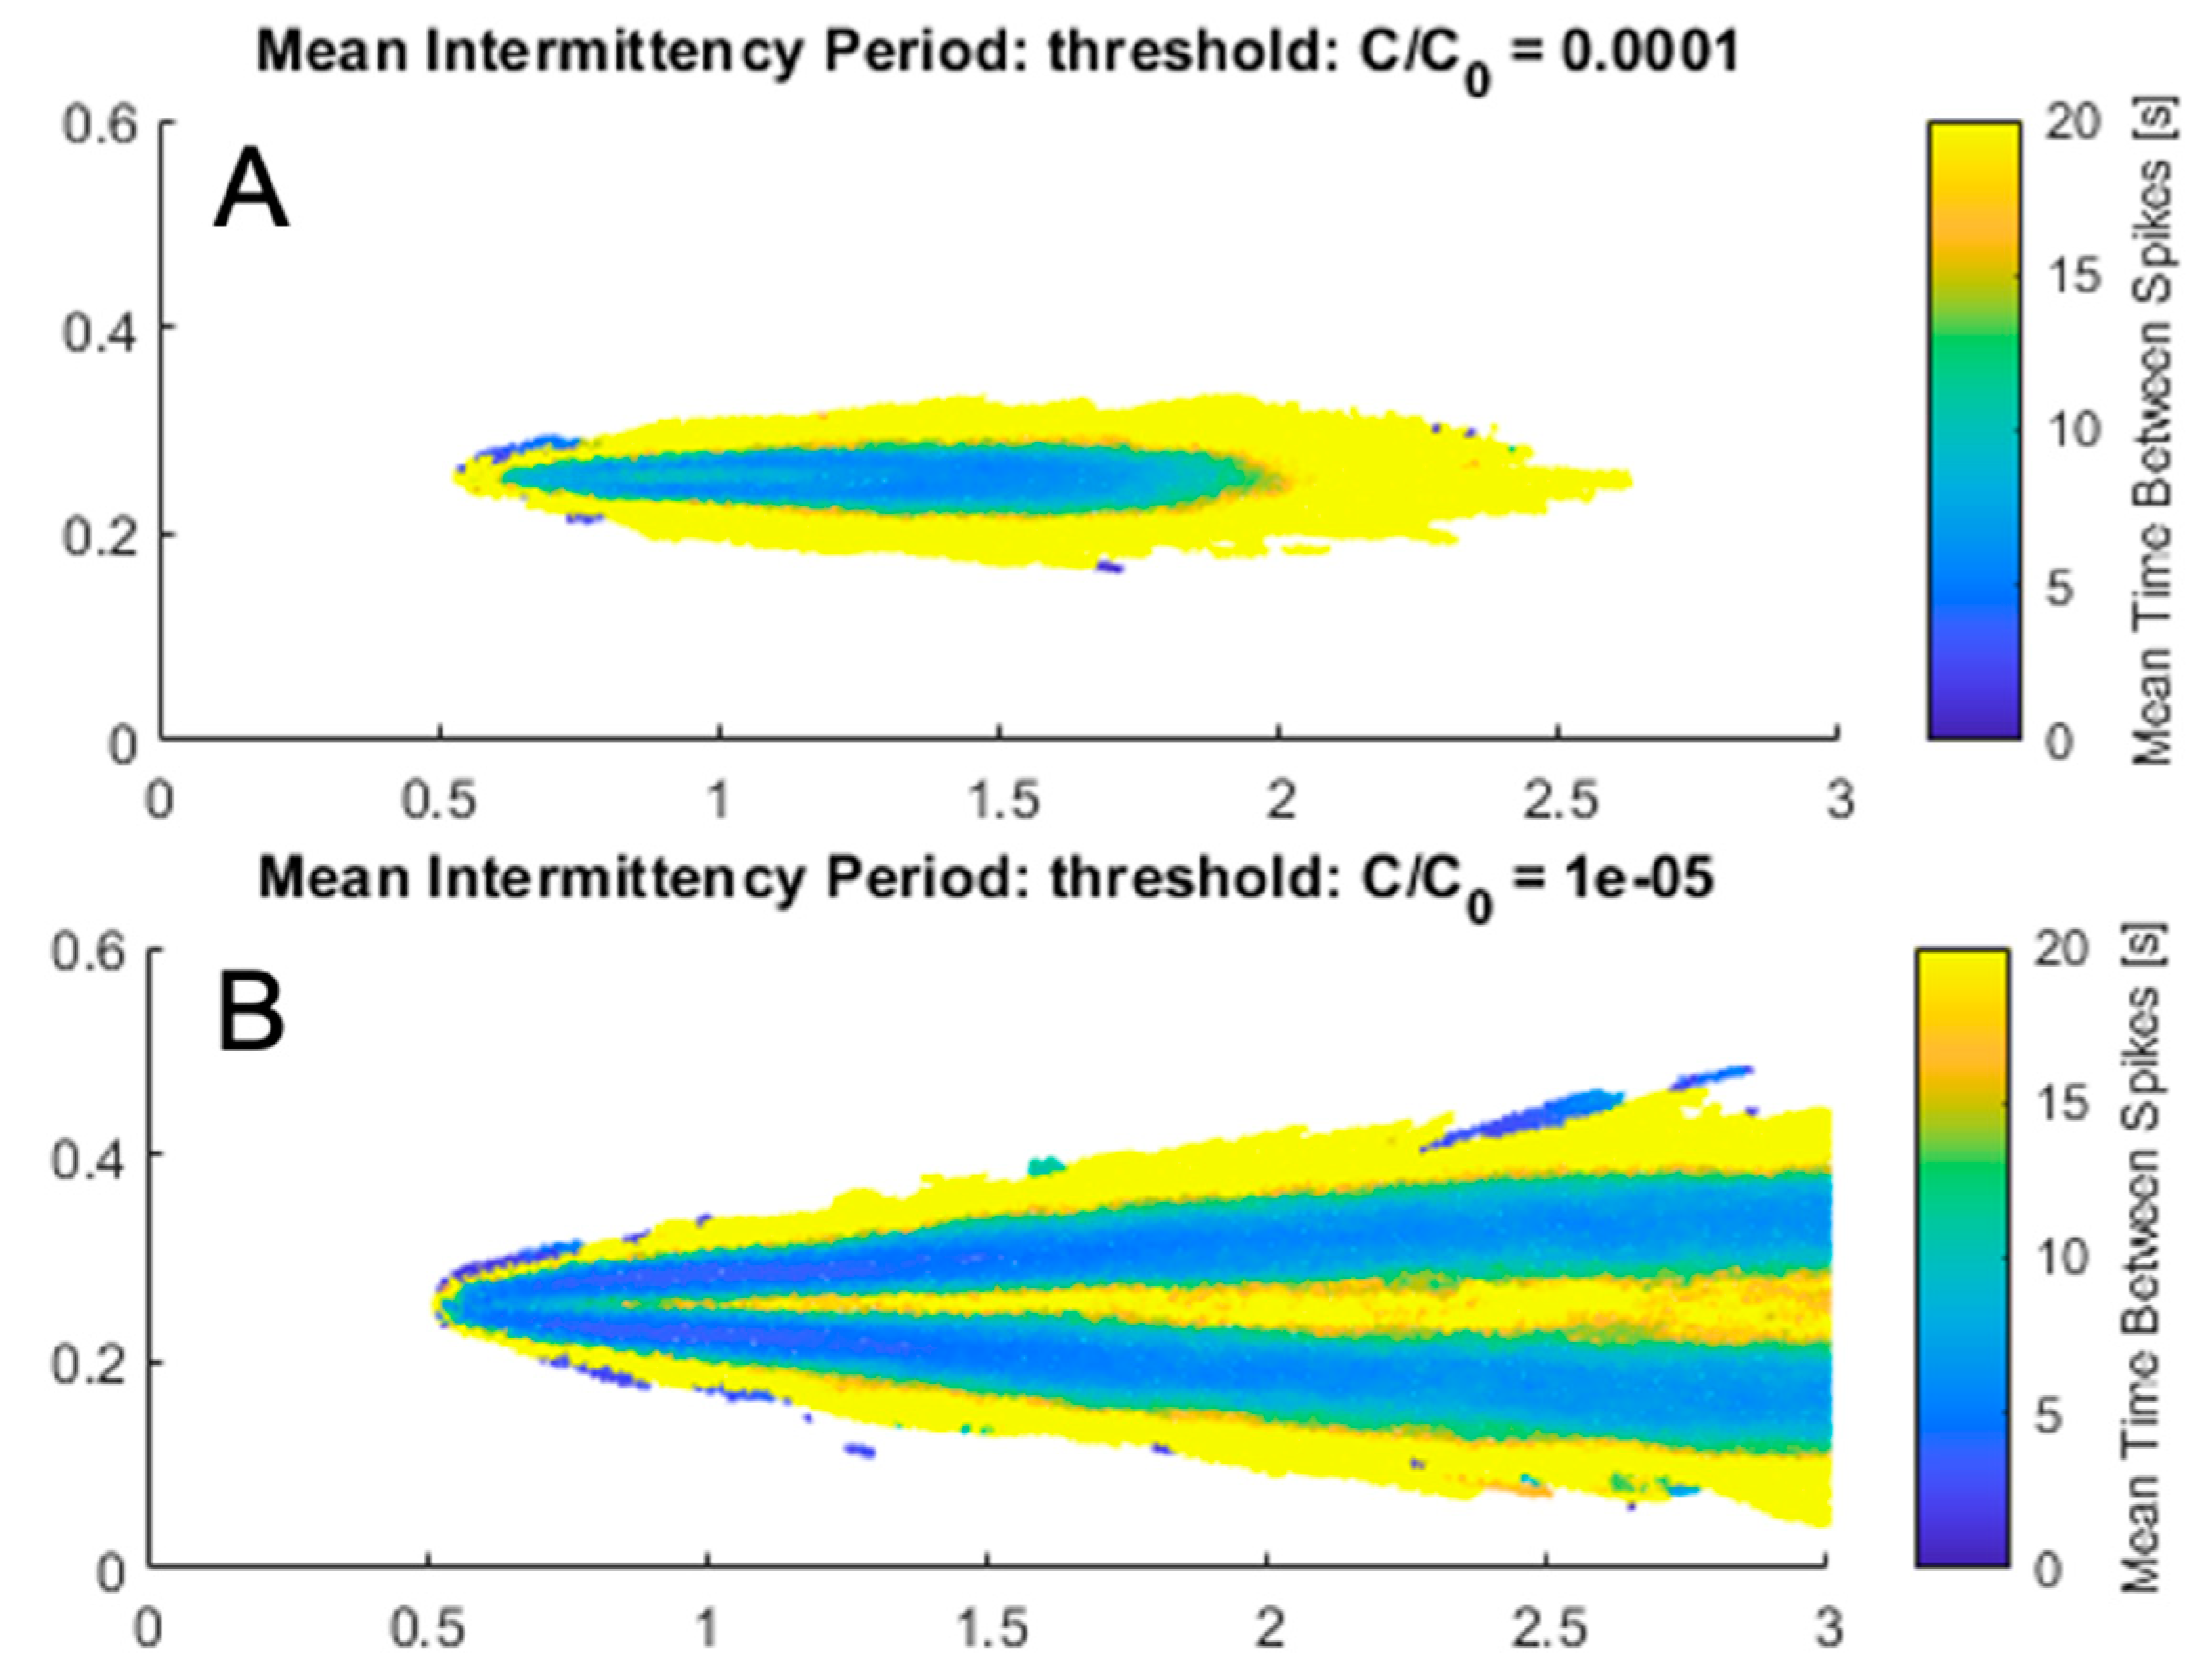
The minimum detectable concentration and intermittency threshold was set to 0.02% of source concentration (C/Co = 0.0002) based on the minimum concentration of glycine that elicited a feeding response in P. argus [54]. However, if different source concentrations were simulated, search results and success in finding the source would likely differ. The above search strategies were re-run with a threshold concentration of 0.001% reflecting a source concentration twenty times higher than that modeled but keeping the minimum detectable concentration the same. The lower concentration threshold resulted in much higher success rates (i.e., above 90%) for all strategies. Both search strategies using leg chemosensing performed the best, supporting that more spatial information is still beneficial in this scenario. Mean intermittency was mapped throughout the plume at two different concentration thresholds to demonstrate how the odor environment an animal encounters may change depending on the source concentration (Figure 9). With a larger range of detectable concentration, intermittency occurs over a greater width and peaks slightly off-center of downstream. This suggests that for intermittency to be effective as a search variable, the threshold concentration above which odorants are detected must be adaptable. Such adaptation would allow the animal to be sensitive to intermittent changes in odor concentration in environments where the source and background concentration varies.
4. Discussion
4.1. Odorant Dispersion in Turbulent Flows
A 3.5 m long 3-dimensional odorant plume was created using a computational fluid dynamics simulation that simultaneously computed velocity and odorant concentration throughout the computation domain. The creation of an accurate CFD simulation with spatial and temporal resolution relevant to search is a step forward in replicating natural environments. This is especially beneficial where instantaneous measures of concentration and intermittency are needed at multiple locations in space and time. The CFD model both improves upon the scale tested in previous studies and equals realistic water flume dimensions used in laboratory experiments [25,55,56]. The concentration vertical profile evolved and grew with downstream distance, reaching well mixed vertical conditions 2 m downstream from the source. Physical studies within water flumes found similar characteristics of increasing plume height and decline in concentration with distance downstream [11,44]. This vertical plume height plays a role in antennule sensing of odorants by lobsters. Depending upon the size of the lobster, antennules possess an advantage in sensing concentrations higher above the bed in comparison to legs but only at downstream distances from the source where the plume has vertically mixed to the height of the antennules. Due to intense turbulence adjacent to the bed, antennules encounter a more intermittent odor environment relative to leg chemosensors. As the plume is advected downstream, the plume width continues to expand with downstream distance from the source. Mean concentration peaks along the plume centerline.
Intermittency appears to benefit search and increase the search speed to a greater extent as the lobster approaches the source, possibly due to more frequent odor encounter and thus more information. Similarly, crayfish and blue crabs increase their speed with proximity to an odor source, which supports that crustaceans quickly gain more spatial information (or confidence in source location) as they approach the source [20,57]. The intermittency environment differed from concentration depending on the minimum detectable threshold concentration. This occurs because intermittency, as shown in Figure 9, is the mean time between spikes when concentration exceeds the threshold concentration. Therefore, a high threshold concentration would decrease the likelihood of spikes above threshold. Conversely, a low threshold concentration would increase the frequency of concentration above threshold. Both threshold extremes thus lower the perceived intermittency of the odorant signal. At the threshold concentration chosen in this study, intermittency was highest directly downstream of the odor source. If the source concentration of our experiment were higher, however, intermittency would peak off-center on either side of the centerline. In this case, intermittency would benefit search because it would promote tracking further along the edge of the plume where odor encounter is most frequent. With a greater range of detectable concentrations, odor search success utilizing intermittency-based search increased. It is unsurprising that a stronger source concentration enhances an organism’s ability to find the source, but this demonstrates that the best search strategies distinguish themselves when source odor is faint and information scarce. This also suggests that with changing source and background concentrations, lobsters may differentially utilize information from leg versus antennule chemosensors. Improvements to search by utilizing dynamic rules have been observed in other organismal studies utilizing blue crabs and may be promising for future work [20].
4.2. Olfactory Search Strategies
Intermittency, leg chemosensing, and transverse flow are all potentially useful to concentration search for lobsters because they provide additional spatial and/or temporal information. Intermittency is superior to concentration as an olfactory search variable based on observed results. This is largely due to intermittency providing extensive spatial and temporal information, so the model lobster could regain contact with the odor plume and continue moving towards the odor source in the absence of present odor. Previous studies also corroborate that intermittency and infotaxis are superior to concentration alone [10,43,58]. Intermittency provides advantageous temporal information that guides movement, and sampling of intermittency within an odorant plume is likely tied to the functioning of bORN neurons in antennule sensilla. Lobsters benefit from temporal information when on the edge of a plume where they are less likely to encounter concentration above threshold, as one encounter with an odorant filament can guide movement towards the centerline. However, if a lobster is within the plume near the centerline this method may result in the lobster exiting the plume, even though reducing lateral movement would be more beneficial. Even with this limitation, results show that an intermittency search strategy proved superior to a concentration strategy. However, our tested search algorithms suggest additional spatial information may be as good or superior to algorithms with added temporal information.
Due to expansion of the width of the plume and continual stirring of the odorant by turbulence, both the mean concentration and intermittency decrease with downstream distance. This suggests that it is necessary for lobsters to adapt to changing concentration gradients and mean background concentrations as they navigate within the plume. For the purposes of this study, although we utilized a constant threshold concentration set to 0.02% of the 0.2 kg/m3 source concentration, previous research has shown that lobsters can alter their minimum threshold concentration of detection through adaptation [53,59,60]. If an odor stimulus lasts too long, their chemoreceptor cells undergo adaptation where their response to subsequent odor pulses of similar or lower concentration is reduced [60]. Such adaptation is thought to adjust the sensitivity of the neuron enabling it to respond to pulses of odor concentration above background, and remain sensitive to changes in odor concentration [53,59]. Lobster olfactory receptor neurons can also undergo cumulative adaptation [52]. This causes a decrease in number of spikes and increase in the latency time when the frequency of odor pulse delivery is high. This suggests that intermittency detection may vary throughout the plume as a lobster adapts to a changing background concentration. Computational models of adaptation (and disadaptation) in olfactory receptor neurons have shown that this determines the range of concentration fluctuations over which cells will respond and are analogous to a band-pass filter in electronics [61,62].
Leg chemosensing improves search success remarkably for both concentration and intermittency strategies, supporting the benefit of multiple spatial sensors. Sampling odorant concentrations using antennule and leg chemosensors is more successful in locating the source than an intermittency sampling strategy using antennules and leg chemosensors. This is a reversal of intermittency being more successful than concentration alone for algorithms using just antennnules. An excess of path corrections may result in antennule intermittency and leg chemosensing searches often moving away from the plume or beyond the source location upstream. Despite the success of leg chemosensing in this model, previous studies have differed in their beliefs that leg chemosensing is essential for search beyond a body length from the source in crustaceans [24,28,63]. Our findings support that additional spatial information (i.e., leg chemosensing) may be highly beneficial to search in a turbulent environment along the benthos. Leg chemosensing search success rates of 81.7% and 93.5% are comparable to actual crustaceans searching in laboratory experiments [16,64]. Blue crab studies found leg chemosensing to be advantageous to search because of the leg’s extended distance from the body in comparison to antennules and legs themselves were sufficient to locate odor sources [19,65]. The tested lobster search algorithms held antennules at stationary positions less than 5 cm apart in comparison to leg locations 10 cm apart, so leg chemosensing in our simulations acquired spatial data unavailable to antennules, similar to studies utilizing crabs. In addition, since legs sample the plume closer to the bed, the odorants are typically more well mixed in this region [11] than at the elevation of the antennule, and therefore legs sample a more coherent (i.e., less intermittent) odorant landscape. This may aid search in certain situations and enable animals to gain different information from leg versus antennule chemosensors.
Pravin and Reidenbach [25] studied transverse flux (c’v’) in odorant concentration as a search variable, and their results show that this flux is highest along the edge of the plume, similar to findings of where intermittency in the odorant signal is also greatest. Our results suggest that the addition of transverse flow as a decision variable is not beneficial to search, as it had no effect on the intermittency algorithm and increased time searching for the concentration strategy. However, Pravin and Reidenbach [25] did not utilize intermittency as a search variable, which may suggest that quantifying intermittency in the odorant signal alone is sufficient as compared to simultaneous sampling of fluctuations in flows and odorants. The chemical and physical environment of lobsters is highly heterogeneous, so a strategy that is predicted to benefit lobsters on the edge of a plume may reduce search success of lobsters already within the plume. The search algorithms applied in our study are highly simplified, so this finding does not dismiss the certain importance of fluid flow in search, especially in detecting upstream flow direction. Odor gated rheotaxis is supported as a possible strategy in this study, and all search algorithms required knowledge of upstream direction for movement.
4.3. Study Limitations
The search algorithms tested in this study are exploratory in nature and not exhaustive, so future research is encouraged in a number of directions, especially in how various search strategies may become more or less advantageous as the source is approached. In addition, no specific odorant molecules were studied, just concentrations relative to the source. Hinow et al. [9] found that crustaceans tracking a ratio of odor chemicals gain information of their cross-stream position as chemicals decay at different rates. This strategy is potentially important to animals that rely heavily on chemosensors relative to mechanosensors such as lobsters [66] and those who have an ability to discriminate between different odorant molecules. Several additional variables were omitted that may improve our study. We applied two discrete sampling points to represent antennules of P. argus. This greatly simplifies the hundreds to thousands of chemosensing neurons along each sensilla that would allow more spatially and temporally variable odorant concentration values to be determined along each antennule [28]. Lobsters have four flexible joints on their antennules and the ability to adjust the relative spacing between them. Lobsters are known to alter antennule orientation in response to hydrodynamic stimuli during olfactory tracking, so their importance is likely [24,67]. Chemical plumes widen by turbulent mixing and advection over time, so a crustacean’s ability to simultaneously change the distance between antennules is beneficial to search. Additionally, Panulirus argus, the spiny lobster alters the frequency of antennule flicking, increasing from 1 Hz upon odor encounter to 3 Hz [68]. Adjusting antennule position and odor sampling frequency in response to fluid movement and intermittency are two viable methods to improve search. However, research is needed to assess how crustaceans use these multiple search parameters in combination [24], as well as dynamically adjust search strategies [69].
5. Conclusions
Olfactory search is of near universal importance throughout the animal kingdom, but much work is still needed to understand the strategies animals use. Taken together, our work suggests concentration, intermittency and potentially flow sensing benefit lobster search based on the large number of chemosensors and mechanosensors covering the crustaceans’ bodies [25,44]. Olfactory search in turbulent odorant plumes is often considered a spatial information problem where organisms navigate towards higher concentration. However, concentrations of odorants are too irregular in turbulent environments to solely explain the speed and accuracy of many animals that undergo search. The recent discovery of bORNs in P. argus suggest a neural mechanism that enables lobsters to quantify the temporal structure of intermittent odorants caused by turbulence. Our results support that plume intermittency is reliably detectable by chemosensory neurons when sampling odorants in the range of seconds and is more beneficial than concentration alone when sampling along the edge of the plume. Plume intermittency therefore occurs on temporal and spatial scales relevant for a searching animal and is suitable as a navigational cue [70]. However, the incorporation of additional spatial information within the plume, through leg chemosensors, can improve search and reflects the many sources of information animals likely integrate in tracking. Our work also shows the utility of computational fluid dynamics to study plume dynamics that can quickly and efficiently assess algorithms developed for chemical search. These algorithms help understand what organisms might do, but still need to be confirmed through behavioral and nuerophysiological studies.
Author Contributions
Conceptualization, K.W.L. and M.A.R.; Methodology, K.W.L., B.T.M. and M.A.R.; Formal Analysis K.W.L., B.T.M. and M.A.R.; Writing—Original Draft Preparation, K.W.L. and M.A.R.; Writing—Review & Editing, K.W.L., B.T.M. and M.A.R.; Supervision, M.A.R.; Project Administration, M.A.R.; Funding Acquisition, M.A.R. All authors have read and agreed to the published version of the manuscript.
Funding
This research was funded by the United States National Science Foundation, grant number IIS-1631864.
Acknowledgments
We are grateful to Swapnil Pravin and Jonathan Stocking for assistance developing the CFD model. We thank Raheleh Baharloo for discussions regarding search algorithms. We also thank John Porter for assistance with CFD validation.
Conflicts of Interest
The authors declare no conflict of interest.
References
- Dittman, A.; Quinn, T. Homing in Pacific salmon: Mechanisms and ecological basis. J. Exp. Biol. 1996, 199, 83–91. [Google Scholar] [PubMed]
- Karavanich, C.; Atema, J. Olfactory Recognition of Urine Signals in Dominance Fights Between Male Lobster, Homarus Americanus. J. Behav. 1998, 135, 719–730. [Google Scholar]
- Keller, T.A.; Moore, P.A. Effects of ontogeny and odors on behavior: The influence of crayfish size and fish odors on crayfish movement. Mar. Freshw. Behav. Physiol. 1999, 33, 35–50. [Google Scholar] [CrossRef]
- Belanger, R.M.; Moore, P.A. The Role of the Major Chelae in the Localization and Sampling of Female Odours by Male Crayfish, Orconectes rusticus (Girard, 1852). Crustaceana 2009, 82, 653–668. [Google Scholar]
- Moore, P.A.; Atema, J. Spatial Information in the Three-Dimensional Fine Structure of an Aquatic Odor Plume. Biol. Bull. 1991, 181, 408–418. [Google Scholar] [CrossRef]
- Webster, D.R.; Weissburg, M.J. Chemosensory guidance cues in a turbulent chemical odor plume. Limnol. Oceanogr. 2001, 46, 1034–1047. [Google Scholar] [CrossRef]
- Atema, J. Opening the chemosensory world of the lobster, Homarus americanus. Bull. Mar. Sci. 2018, 94, 479–516. [Google Scholar] [CrossRef]
- Soares, J.M.; Aguiar, A.P.; Pascoal, A.M.S.; Martinoli, A. An Algorithm for Formation-Based Chemical Plume Tracing Using Robotic Marine Vehicles. In Proceedings of the OCEANS 2016 MTS/IEEE Monterey, Monterey, CA, USA, 19–23 September 2016. [Google Scholar]
- Hinow, P.; Strickler, J.R.; Yen, J. Olfaction in a viscous environment: The “color” of sexual smells in Temora longicornis. Sci. Nat. 2017, 104, 46. [Google Scholar] [CrossRef]
- Park, I.J.; Hein, A.M.; Bobkov, Y.V.; Reidenbach, M.A.; Ache, B.W.; Principe, J.C. Neurally Encoding Time for Olfactory Navigation. PLoS. Comput. Biol. 2016, 12, e1004682. [Google Scholar] [CrossRef] [Green Version]
- Reidenbach, M.A.; Limm, M.; Hondzo, M.; Stacey, M.T. Effects of bed roughness on boundary layer mixing and mass flux across the sediment-water interface. Water Resour. Res. 2010, 46. [Google Scholar] [CrossRef]
- Crimaldi, J.P.; Wiley, M.B.; Koseff, J.R. The relationship between mean and instantaneous structure in turbulent passive scalar plumes. J. Turbul. 2002, 3, 1–24. [Google Scholar] [CrossRef]
- Weissburg, M.J. The fluid dynamical context of chemosensory behavior. Biol. Bull. 2000, 198, 188–202. [Google Scholar] [CrossRef] [PubMed]
- Tu, J.; Yeoh, G.; Liu, C. Computational Fluid Dynamics a Practical Approach, 2nd ed.; Butterworth-Heinemann: Waltham, MA, USA, 2012. [Google Scholar]
- Webster, D.R.; Volyanskyy, K.Y.; Weissburg, M.J. Bioinspired algorithm for autonomous sensor-driven guidance in turbulent chemical plumes. Bioinspir. Biomim. 2012, 7, 1–11. [Google Scholar] [CrossRef] [PubMed] [Green Version]
- Webster, D.R.; Weissburg, M.J. The Hydrodynamics of Chemical Cues among Aquatic Organisms. Annu. Rev. Fluid Mech. 2009, 41, 73–90. [Google Scholar] [CrossRef]
- Vergassola, M.; Villermaux, E.; Shraiman, B.I. “Infotaxis” as a strategy for searching without gradients. Nature 2007, 445, 406–409. [Google Scholar] [CrossRef]
- Grasso, F.W.; Basil, J.A.; Atema, J. Toward the Convergence: Robot and Lobster Perspectives of Tracking Odors to Their Source in the Turbulent Marine Environment. In Proceedings of the 1998 IEEE International Symposium on Intelligent Control (ISIC) held jointly with IEEE International Symposium on Computational Intelligence in Robotics and Automation (CIRA) Intell, Gaithersburg, MD, USA, 17 September 1998; pp. 259–264. [Google Scholar]
- Page, J.L.; Dickman, B.D.; Webster, D.R.; Weissburg, M.J. Staying the course: Chemical signal spatial properties and concentration mediate cross-stream motion in turbulent plumes. J. Exp. Biol. 2011, 214, 1513–1522. [Google Scholar] [CrossRef] [Green Version]
- Page, J.L.; Dickman, B.D.; Webster, D.R.; Weissburg, M.J. Getting ahead: Context-dependent responses to odorant filaments drive along-stream progress during odor tracking in blue crabs. J. Exp. Biol. 2011, 214, 1498–1512. [Google Scholar] [CrossRef] [Green Version]
- Kozlowski, C.; Voigt, R.; Moore, P.A. Changes in odour intermittency influence the success and search behaviour during orientation in the crayfish (Orconectes rusticus). Mar. Freshwat. Behav. Physiol. 2003, 36, 97–110. [Google Scholar] [CrossRef]
- Moore, P.A.; Ferrante, P.A.; Bergner, J.L. Chemical orientation strategies of the crayfish are influenced by the hydrodynamics of their native environment. Am. Midl. Nat. 2015, 173, 17–29. [Google Scholar] [CrossRef]
- Moore, P.A.; Grills, J.L. Chemical orientation to food by the crayfish Orconectes rusticus: Influence of hydrodynamics. Animal Behav. 1999, 58, 953–963. [Google Scholar] [CrossRef]
- Grasso, F.W.; Basil, J.A. How lobsters, crayfishes, and crabs locate sources of odor: Current perspectives and future directions. Curr. Opin. Neurobiol. 2002, 12, 721–727. [Google Scholar] [CrossRef]
- Pravin, S.; Reidenbach, M.A. Simultaneous sampling of flow and odorants by crustaceans can aid searches within a turbulent plume. Sensors 2013, 13, 16591–16610. [Google Scholar] [CrossRef] [PubMed] [Green Version]
- Gleeson, R.A.; Carr, W.E.S.; Trapido-Rosenthal, H.G. Morphological characteristics facilitating stimulus access and removal in the olfactory organ of the spiny lobster, Panulirus argus: Insight from the design. Chem. Senses 1993, 18, 67–75. [Google Scholar] [CrossRef]
- Steullet, P.; Krützfeldt, D.R.; Hamidani, G.; Flavus, T.; Ngo, V.; Derby, C.D. Dual antennular chemosensory pathways mediate odor-associative learning and odor discrimination in the Caribbean spiny lobster Panulirus argus. J. Exp. Biol. 2002, 205, 851–867. [Google Scholar]
- Devine, D.V.; Atema, J. Function of chemoreceptor organs in spatial orientation of the lobster, Homarus americanus: Differences and overlap. Biol. Bull. 1982, 163, 144–153. [Google Scholar] [CrossRef]
- Koehl, M.A.R. The Fluid Mechanics of Arthropod Sniffing in Turbulent Odor Plumes. Chem. Senses 2006, 31, 93–105. [Google Scholar] [CrossRef]
- Horner, A. Functional Roles of Crustacean Dual Antennular Chemosensory Pathways in Odor Mediated Behaviors. Ph.D. Thesis, Georgia State University, Atlanta, GA, USA, 2007. [Google Scholar]
- Schmidt, M. Identification of putative neuroblasts at the base of adult neurogenesis in the olfactory midbrain of the spiny lobster, Panulirus argus. J. Comp. Neurol. 2007, 503, 64–84. [Google Scholar] [CrossRef]
- Schmidt, M.; Derby, C.D. Non-olfactory chemoreceptors in asymmetric setae activate antennular grooming behavior in the Caribbean spiny lobster Panulirus argus. J. Exp. Biol. 2005, 208, 233–248. [Google Scholar] [CrossRef] [Green Version]
- Stacey, M.T.; Mead, K.S.; Koehl, M.A.R. Molecule capture by olfactory antennules: Mantis shrimp. J. Math. Biol. 2002, 44, 1–30. [Google Scholar]
- Pravin, S.; Mellon, D.; Reidenbach, M.A. Micro-scale fluid and odorant transport to antennules of the crayfish, Procambarus clarkii. J. Comp. Physiol. A 2012, 198, 669–681. [Google Scholar] [CrossRef]
- Sicard, G. Electrophysiological recordings from olfactory receptor cells in adult mice. Brain Res. 1986, 397, 405–408. [Google Scholar] [CrossRef]
- Frings, S.; Lindemann, B. Odorant response of isolated olfactory receptor cells is blocked by amiloride. J. Membr. Biol. 1988, 105, 233–243. [Google Scholar] [CrossRef] [PubMed]
- Reisert, J.; Matthews, H.R. Response properties of isolated mouse olfactory receptor cells. J. Physiol. 2001, 530, 113–122. [Google Scholar] [CrossRef] [PubMed]
- Reisert, J.; Matthews, H.R. Responses to prolonged odour stimulation in frog olfactory receptor cells. J. Physiol. 2001, 534, 179–191. [Google Scholar] [CrossRef] [PubMed]
- Holy, T.E.; Dulac, C.; Meister, M. Responses of Vomeronasal Neurons to Natural Stimuli. Science 2000, 289, 1569–1572. [Google Scholar] [CrossRef] [PubMed] [Green Version]
- Arnson, H.A.; Holy, T.E. Chemosensory burst coding by mouse vomeronasal sensory neurons. J. Neurophysiol. 2011, 106, 409–420. [Google Scholar] [CrossRef] [Green Version]
- Ukhanov, K.; Bobkov, Y.; Ache, B.W. Imaging ensemble activity in arthropod olfactory receptor neurons in situ. Cell Calcium 2011, 49, 100–107. [Google Scholar] [CrossRef] [PubMed] [Green Version]
- Bobkov, Y.V.; Ache, B.W. Intrinsically bursting olfactory receptor neurons. J. Neurophysiol. 2007, 97, 1052–1057. [Google Scholar] [CrossRef]
- Park, I.; Bobkov, Y.; Ache, B.; Principe, J. Intermittency Coding in the Primary Olfactory System: A Neural Substrate for Olfactory Scene Analysis. J. Neurosci. 2014, 34, 941–952. [Google Scholar] [CrossRef] [Green Version]
- Reidenbach, M.A.; Koehl, M.A.R. The spatial and temporal patterns of odors sampled by lobsters and crabs in a turbulent plume. J. Exp. Biol. 2011, 214, 3138–3153. [Google Scholar] [CrossRef] [Green Version]
- Major, R.; Jeffs, A. Orientation and food search behaviour of a deep sea lobster in turbulent versus laminar odour plumes. Helgol. Mar. Res. 2017, 71, 9. [Google Scholar] [CrossRef] [Green Version]
- Adedoyin, A.; Walters, D.; Bhushan, S. Investigation of turbulence model and numerical scheme combinations for practical finite-volume large eddy simulations. Eng. Appl Comput. Fluid Mech. 2015, 9, 1–19. [Google Scholar] [CrossRef] [Green Version]
- Reidenbach, M.A. Tracking odorant plumes. In Olfactory Receptors: Methods and Protocols; Simoes de Souza, F.M., Antunes, G., Eds.; Springer: New York, NY, USA, 2018; pp. 251–263. ISBN 978-1-4939-8608-8. [Google Scholar]
- Yen, J.; Weissburg, M.J.; Doall, M.H. The fluid physics of signal perception by mate-tracking copepods. Philos. Trans. R. Soc. London Ser. B 1998, 353, 787–804. [Google Scholar] [CrossRef] [PubMed] [Green Version]
- Weissburg, M.J. Chemo- and Mechanosensory Orientation by Crustaceans in Laminar and Turbulent flows: From Odor Trails to Vortex Streets. In Orientation and Communication in Arthropods; Lehrer, M., Ed.; EXS.; Birkhäuser: Basel, Switzerland, 1997; pp. 215–246. ISBN 978-3-0348-8878-3. [Google Scholar]
- Reidenbach, M.A.; George, N.; Koehl, M.A.R. Antennule morphology and flicking kinematics facilitate odor sampling by the spiny lobster, Panulirus argus. J. Exp. Biol. 2008, 211, 2849–2858. [Google Scholar] [CrossRef] [PubMed] [Green Version]
- Pravin, S.; Mellon, D.; Berger, E.J.; Reidenbach, M.A. Effects of sensilla morphology on mechanosensory sensitivity in the crayfish. Bioinspir. Biomim. 2015, 10, 036006. [Google Scholar] [CrossRef] [Green Version]
- Gomez, G.; Voigt, R.; Atema, J. Frequency filter properties of lobster chemoreceptor cells determined with high-resolution stimulus measurement. J. Comp. Physiol. A 1994, 174, 803–811. [Google Scholar] [CrossRef]
- Gomez, G.; Atema, J. Temporal resolution in olfaction II: Time course of recovery from adaptation in lobster chemoreceptor cells. J. Neurophysiol. 1996, 76, 1340–1343. [Google Scholar] [CrossRef]
- Zimmer-Faust, R.K. Chemical Signal-to-Noise Detection by Spiny Lobsters. Biol. Bull. 1991, 181, 419–426. [Google Scholar] [CrossRef]
- Horner, A.J.; Weissburg, M.J.; Derby, C.D. Dual antennular chemosensory pathways can mediate orientation by Caribbean spiny lobsters in naturalistic flow conditions. J. Exp. Biol. 2004, 207, 3785–3796. [Google Scholar] [CrossRef] [Green Version]
- Keller, T.A.; Weissburg, M.J. Effects of Odor Flux and Pulse Rate on Chemosensory Tracking in Turbulent Odor Plumes by the Blue Crab, Callinectes sapidus. Biol. Bull. 2004, 207, 44–55. [Google Scholar] [CrossRef] [Green Version]
- Wolf, M.C.; Voigt, R.; Moore, P.A. Spatial Arrangement of Odor Sources Modifies the Temporal Aspects of Crayfish Search Strategies. J. Chem. Ecol. 2004, 30, 501–517. [Google Scholar] [CrossRef] [PubMed] [Green Version]
- Voges, N.; Chaffiol, A.; Lucas, P.; Martinez, D. Reactive Searching and Infotaxis in Odor Source Localization. PLOS Comput. Biol. 2014, 10, e1003861. [Google Scholar] [CrossRef] [PubMed]
- Borroni, P.F.; Atema, J. Adaptation in chemoreceptor cells. J. Comp. Physiol. 1988, 164, 67–74. [Google Scholar] [CrossRef] [PubMed]
- Gomez, G.; Atema, J. Temporal resolution in olfaction: Stimulus integration time of lobster chemoreceptor cells. J. Exp. Biol. 1996, 199, 1771–1779. [Google Scholar]
- Moore, P.A. A model of the role of adaptation and disadaptation in olfactory receptor neurons: Implications for the coding of temporal and intensity patterns in odor signals. Chem. Senses 1994, 19, 71–86. [Google Scholar] [CrossRef]
- Moore, P.A.; Shao, K. An electrical circuit model of chemoreceptor cells based on adaptation and disadaptation time constants: Implications for temporal filtering. Mater. Sci. and Eng. C 1999, 7, 149–160. [Google Scholar] [CrossRef]
- Garm, A.; Shabani, S.; Høeg, J.T.; Derby, C.D. Chemosensory neurons in the mouthparts of the spiny lobsters Panulirus argus and Panulirus interruptus (Crustacea: Decapoda). J. Exp. Mar. Biol. Ecol. 2005, 314, 175–186. [Google Scholar] [CrossRef]
- Kenning, M.; Lehmann, P.; Lindström, M.; Harzsch, S. Heading which way? Y-maze chemical assays: Not all crustaceans are alike. Helgol. Mar. Res. 2015, 69, 305–311. [Google Scholar] [CrossRef] [Green Version]
- Daniel, P.C.; Fox, M.; Mehta, S. Identification of Chemosensory Sensilla Mediating Antennular Flicking Behavior in Panulirus argus, the Caribbean Spiny Lobster. Biol. Bull. 2008, 215, 24–33. [Google Scholar] [CrossRef]
- Weissburg, M.J.; Ferner, M.C.; Pisut, D.P.; Smee, D.L. Ecological Consequences of Chemically Mediated Prey Perception. J. Chem. Ecol. 2002, 28, 1953–1970. [Google Scholar] [CrossRef]
- Mjos, K.; Grasso, F.; Atema, J. Antennule Use by the American Lobster, Homarus americanus, During Chemo-orientation in Three Turbulent Odor Plumes. Biol. Bull. 1999, 197, 249–250. [Google Scholar] [CrossRef] [PubMed]
- Goldman, J.A. Fluid Dynamic Design of Lobster Olfactory Organs: High Speed Kinematic Analysis of Antennule Flicking by Panulirus argus. Chem. Senses 2001, 26, 385–398. [Google Scholar] [CrossRef] [PubMed] [Green Version]
- Kraus-Epley, K.E.; Lahman, S.E.; Moore, P.A. Behaviorally-selective chemoreceptor lesions reveal two different chemically mediated orientation strategies in the rusty crayfish, Orconectes rusticus. J. Crust. Biol. 2015, 35, 753–762. [Google Scholar] [CrossRef] [Green Version]
- Michaelis, B.T.; Leathers, K.W.; Bobkov, Y.V.; Ache, B.W.; Principe, J.C.; Baharloo, R.; Park, I.M.; Reidenbach, M.A. Odor tracking in aquatic organisms: The importance of temporal and spatial intermittency of the turbulent plume. Sci. Rep. 2020, 10, 7961. [Google Scholar] [CrossRef]
Figure 1.
The spiny lobster, Panulirus argus, with anatomy related to search labeled. Antenna are primarily used for mechanosensing, while antennules and legs possess high concentrations of sensilla with both chemosensors and mechanosensors.
Figure 1.
The spiny lobster, Panulirus argus, with anatomy related to search labeled. Antenna are primarily used for mechanosensing, while antennules and legs possess high concentrations of sensilla with both chemosensors and mechanosensors.

Figure 2.
(A) Geometry of computational flume, with roughness blocks along the flume bed staggered to promote turbulent mixing. The pipe inlet, located 0.5 m downstream from the upstream edge, is used to introduce odor into an already turbulent environment. Inset of red box is shown in (B) that shows nodes where odor concentration and water velocities are computed. Nodes are arranged in a tetrahedral mesh with minimum spacing of 0.8 mm to capture turbulent flow over roughness blocks in the boundary layer. An adaptive mesh is used for the remainder of the geometry with a maximum distance between nodes of 5.5 mm.

Figure 3.
Mean percent concentration (A) and velocity (B) of the CFD model and physical validation data taken along a vertical gradient 0.5 m downstream from the odorant source.
Figure 3.
Mean percent concentration (A) and velocity (B) of the CFD model and physical validation data taken along a vertical gradient 0.5 m downstream from the odorant source.

Figure 4.
Image of instantaneous odor concentration (concentration/source concentration) at (A) z = 0.05 m and (B) z = 0.02 m height above the bed. Flow is from left to right. Dimensions of the computational flume are 0.5 m wide, 0.15 m tall, and 3.5 m long, with odorant release at z = 0.03 m above the bed. Odor was released at x = 0.5 m downstream of the leading edge of the flume to allow the turbulent boundary layer to develop before odor injection.

Figure 5.
(A) Mean concentration as a percent of source concentration at 1 m and 2 m downstream from the odor source, measured along the plume centerline. (B) Mean horizontal velocity at 1 m and 2 m downstream from the odor source.
Figure 5.
(A) Mean concentration as a percent of source concentration at 1 m and 2 m downstream from the odor source, measured along the plume centerline. (B) Mean horizontal velocity at 1 m and 2 m downstream from the odor source.

Figure 6.
(A) Search algorithm using intermittency. Example starting at 1.4 m downstream and 0.2 m cross-stream. (B) Search algorithm using concentration above threshold, starting at 2 m downstream and 0 m cross-stream.
Figure 6.
(A) Search algorithm using intermittency. Example starting at 1.4 m downstream and 0.2 m cross-stream. (B) Search algorithm using concentration above threshold, starting at 2 m downstream and 0 m cross-stream.

Figure 7.
Summary statistics for different search algorithms applied to lobster antennule and leg chemosensors and mechanosensors. C = Concentration strategy, I = Intermittency, C*L = Concentration and Legs, I*L = Intermittency and Legs, C*F = Concentration and Flow, I*F = Intermittency and Flow. The central red line is the median, box edges are the 25th and 75th percentiles, whiskers extend to the farthest points that are not outliers, and outliers are red crosses.

Figure 8.
Total time spent searching until source located using (A) concentration measured along the antennule, (B) concentration measured along the antennule combined with leg chemosensing, and (C) concentration combined with transverse flow mechanosensing measured along the antennule. Total time spent searching until source located using (D) intermittency measured along the lobster antennule, (E) intermittency measured along the antennule combined with leg chemosensing, and (F) intermittency measured along the antennule combined with transverse flow mechanosensing. Searches that lasted 120 s were unsuccessful and shaded blue.

Figure 9.
(A) Mean intermittency (s) at concentration threshold of 0.01% throughout the flume measured by time between concentration above the threshold. (B) Mean intermittency at concentration threshold of 0.001% throughout the flume measured by time between concentration above the threshold.
Figure 9.
(A) Mean intermittency (s) at concentration threshold of 0.01% throughout the flume measured by time between concentration above the threshold. (B) Mean intermittency at concentration threshold of 0.001% throughout the flume measured by time between concentration above the threshold.


Table 1.
Mean statistics for CFD model where initial inlet velocity was set at 10 cm/s. All values are averaged over the entire domain and u* is the friction velocity, Re* is the roughness Reynolds number, η is the Kolmogorov length scale, and ε is the dissipation rate of turbulence.
Table 1.
Mean statistics for CFD model where initial inlet velocity was set at 10 cm/s. All values are averaged over the entire domain and u* is the friction velocity, Re* is the roughness Reynolds number, η is the Kolmogorov length scale, and ε is the dissipation rate of turbulence.
| Inlet Velocity (cm·s−1) | Outlet Velocity (cm·s−1) | u* (cm/s) | Re* | η (cm) | ε (m2·s−3) |
|---|---|---|---|---|---|
| 10.0 | 9.2 | 0.21 | 23.5 | 0.12 | 1.66 × 10⁻⁴ |
Table 2.
Summary of the search strategies used.
| Strategy | Behavior | Parameters |
|---|---|---|
| Concentration | If one antennule (A1 or A2) senses odor concentration above threshold, the lobster moves upstream diagonally towards that antennule. If both antennules sense odor, the lobster moves directly upstream. If neither antennule senses odor, the lobster moves transversely to its left or right in random fashion. | A1, A2 |
| Intermittency | The rules of the Concentration strategy apply, except intermittency, I, is used when neither antennule senses odor at the present time. If neither antennule senses odor, then the lobster moves in the direction that has the lowest I (I1 or I2) measured by time since last odor encounter within the previous 5 s. If neither antennule sensed odor within the last five seconds, the lobster moves transversely, as in the concentration strategy | A1, A2, I1, I2 |
| Concentration + leg sensors | The rules of the Concentration strategy apply except if odor is not detected by either A1 or A2 and at least one of two leg chemosensors (L1 or L2) senses above threshold odor, the lobster moves in the direction of whichever leg senses a concentration or directly upstream if both legs sense odor. If only one antennule senses an above threshold concentration and both legs sense odor, then the lobster moves directly forward, as it is likely still within the plume. | A1, A2, L1, L2 |
| Intermittency + leg sensors | This strategy is the same as concentration + leg sensors except if neither antennules nor leg chemosensors sense odor in the present time, the intermittency strategy is used. | A1, A2, L1, L2, I1, I2 |
| Concentration + transverse flow | The rules of the concentration strategy apply except movements are adjusted in the case that a single antennule senses odor above threshold. If the left antennule senses odor and transverse flow, V1, above 1 cm s−1 towards the lobster body from the left side, the lobster moves diagonally as normal and takes an additional step to its left beyond its normal movement over a total of two seconds. The lobster uses the same process if its right antennule senses odor and transverse flow, V2, in the direction of the lobster body above 1 cm s−1. | A1, A2, V1, V2 |
| Intermittency + transverse flow | The rules of the intermittency strategy apply except when just one of A1 or A2 senses odor, the transverse flow strategy is used. | A1, A2, V1, V2, I1, I2 |
Table 3.
Generalized linear model contrast results for various search algorithms based upon lobster antennules, leg chemosensors, and mechanosensors. Num DF is degrees of freedom in the model, Den DF is the number of degrees of freedom from model error. Pr > ChiSiq is the probability that the observed Chi-Square value is observed if the null hypothesis that the search strategies are the same is true. Type of model used is Likelihood Ratio (LR).
| Contrast | Num DF | Den DF | Chi-Square | Pr > ChiSq | Type |
|---|---|---|---|---|---|
| Intermittency vs. Concentration | 1 | 5994 | 10.01 | 0.0016 | LR |
| Intermittency and Leg Search vs. Intermittency | 1 | 5994 | 455.27 | <0.0001 | LR |
| Concentration and Leg Search vs. Concentration | 1 | 5994 | 1189.15 | <0.0001 | LR |
| Intermittency and Flow Search vs. Intermittency | 1 | 5994 | 2.21 | 0.1368 | LR |
| Concentration and Flow Search vs. Concentration | 1 | 5994 | 21.85 | <0.0001 | LR |
© 2020 by the authors. Licensee MDPI, Basel, Switzerland. This article is an open access article distributed under the terms and conditions of the Creative Commons Attribution (CC BY) license (http://creativecommons.org/licenses/by/4.0/).
Share and Cite
MDPI and ACS Style
Leathers, K.W.; Michaelis, B.T.; Reidenbach, M.A. Interpreting the Spatial-Temporal Structure of Turbulent Chemical Plumes Utilized in Odor Tracking by Lobsters. Fluids 2020, 5, 82. https://doi.org/10.3390/fluids5020082
AMA Style
Leathers KW, Michaelis BT, Reidenbach MA. Interpreting the Spatial-Temporal Structure of Turbulent Chemical Plumes Utilized in Odor Tracking by Lobsters. Fluids. 2020; 5(2):82. https://doi.org/10.3390/fluids5020082
Chicago/Turabian StyleLeathers, Kyle W., Brenden T. Michaelis, and Matthew A. Reidenbach. 2020. "Interpreting the Spatial-Temporal Structure of Turbulent Chemical Plumes Utilized in Odor Tracking by Lobsters" Fluids 5, no. 2: 82. https://doi.org/10.3390/fluids5020082